Article

Elastic Parameters of Paramagnetic Fe–20Cr–20Ni-Based Alloys: A First-Principles Study

Department of Applied Physics, Tafila Technical University, Tafila 66110, Jordan
Metals 2019, 9(7), 792; https://doi.org/10.3390/met9070792
Submission received: 26 June 2019 / Revised: 10 July 2019 / Accepted: 11 July 2019 / Published: 17 July 2019

Abstract

:
The single-crystal and polycrystalline elastic parameters of paramagnetic Fe0.6−xCr0.2Ni0.2Mx (M = Al, Co, Cu, Mo, Nb, Ti, V, and W; 0 ≤ x ≤ 0.08) alloys in the face-centered cubic (fcc) phase were derived by first-principles electronic structure calculations using the exact muffin-tin orbitals method. The disordered local magnetic moment approach was used to model the paramagnetic phase. The theoretical elastic parameters of the present Fe–Cr–Ni-based random alloys agree with the available experimental data. In general, we found that all alloying elements have a significant effect on the elastic properties of Fe–Cr–Ni alloy, and the most significant effect was found for Co. A correlation between the tetragonal shear elastic constant C′ and the structural energy difference ΔE between fcc and bcc lattices was demonstrated. For all alloys, small changes in the Poisson’s ratio were obtained. We investigated the brittle/ductile transitions formulated by the Pugh ratio. We demonstrate that Al, Cu, Mo, Nb, Ti, V, and W dopants enhance the ductility of the Fe–Cr–Ni system, while Co reduces it. The present theoretical data can be used as a starting point for modeling the mechanical properties of austenitic stainless steels at low temperatures.

1. Introduction

Austenitic stainless steels are paramagnetic alloys having the face-centered cubic (fcc) crystallographic structure. They are mainly composed of Fe, a minimum of 12 atomic percentage of chromium, a minimum of 6 atomic percentage of Ni, and low amounts of carbon and nitrogen. Austenitic stainless steels have excellent corrosion resistance and good mechanical properties such as ductility, strength, stiffness, and toughness [1]. Austenitic stainless steels have a wide range of applications, such as kitchen utensils, construction, equipment for the chemical industry and food processing, heat exchangers, etc. [2].
Single-crystal and polycrystalline elastic parameters are essential in determining the mechanical properties of the materials, such as hardness, fracture, ductility, and brittleness. These parameters measure the resistance of materials to external forces, and they determine the bulk modulus B, shear modulus G, Young’s modulus E, and Poisson’s ratio ν. Alloying is important in tuning the fundamental properties of materials and in designing advanced engineering materials. Different alloying elements have specific effects on the materials. In austenitic stainless steels, the major alloying elements are chromium and nickel. Chromium gives the austenitic stainless steels corrosion resistance [3], while nickel is added to austenitic stainless steels to promote the austenite microstructure and to increase the ductility and toughness of steels. Other alloying elements determine the property profiles of certain grades of austenitic stainless steels. Many experimental studies have investigated the elastic properties of austenitic stainless steels [4,5,6,7,8]. In contrast to the experimental side, there are only a few theoretical studies of the elastic properties of austenitic stainless steels [9,10,11]. The principal purpose of this first-principles study is to fill this gap and to provide a comprehensive database of the alloying effects on the elastic parameters of paramagnetic fcc Fe–20Cr–20Ni–xM. Specifically, we investigated the changes in the single-crystal and polycrystalline elastic constants caused by adding small concentrations of M (M = Al, Co, Cu, Mo, Nb, V, and W; 0 x 8, where x is in atom %) that are soluble in the Fe–Cr–Ni system. We chose these alloying elements since they represent simple metal (Al), as well as nonmagnetic (Cu, Mo, Nb, V, and W) and magnetic (Co) transition metals. We excluded Cr and Ni from this study, since the effects of these alloying elements on the elastic properties of a paramagnetic fcc Fe–Cr–Ni system were discussed previously by Vitos et al. [11].
In the present work, all quaternary alloys were treated as substitutional disordered paramagnetic solid solutions with an ideal fcc structure. The paramagnetic phase was modeled using a disordered local moment scheme, which describes the systems well above the magnetic transition temperatures.
The rest of the paper includes two sections and conclusions. In Section 2, we describe the ab initio method, the elastic parameters, and the details of the numerical calculations. We present the results and the discussion in Section 3.

2. Methodology

2.1. Total Energy Calculations

The calculations in this work are based on density functional theory [12,13] and the Perdew-Burke-Ernzerhof (PBE) generalized gradient approximation [14] for the exchange correlation functional. The exact muffin-tin orbitals (EMTO) method [10,15,16,17,18,19] in combination with the scalar-relativistic scheme and soft-core approximation was used to solve the Kohn-Sham equations. The chemical and magnetic substitutional disorder was treated using coherent potential approximation (CPA) [20,21]. The total energy was computed using full charge density (FCD) approximation [22]. The paramagnetic state of the Fe–Cr–Ni–M alloys was simulated by the disordered local moments (DLM) model [23]. Within the DLM picture, a paramagnetic Fe–Cr–Ni–M quaternary alloy is described as an eight-component (FeFe)0.6−x(CrCr)0.2(NiNi)0.2(MM)x alloy with equal amounts of spin up (↑) and spin down (↓) components. Using the DLM scheme, the impact of the loss of the magnetic moment above the Curie temperature on the total energy is properly taken into account, although our calculations were formally still performed at 0 K.
The equations of state and elastic parameters of the present Fe-based alloys and transition metal alloys were calculated using the EMTO method which was used in several former works [9,11,24,25,26,27,28,29,30,31].

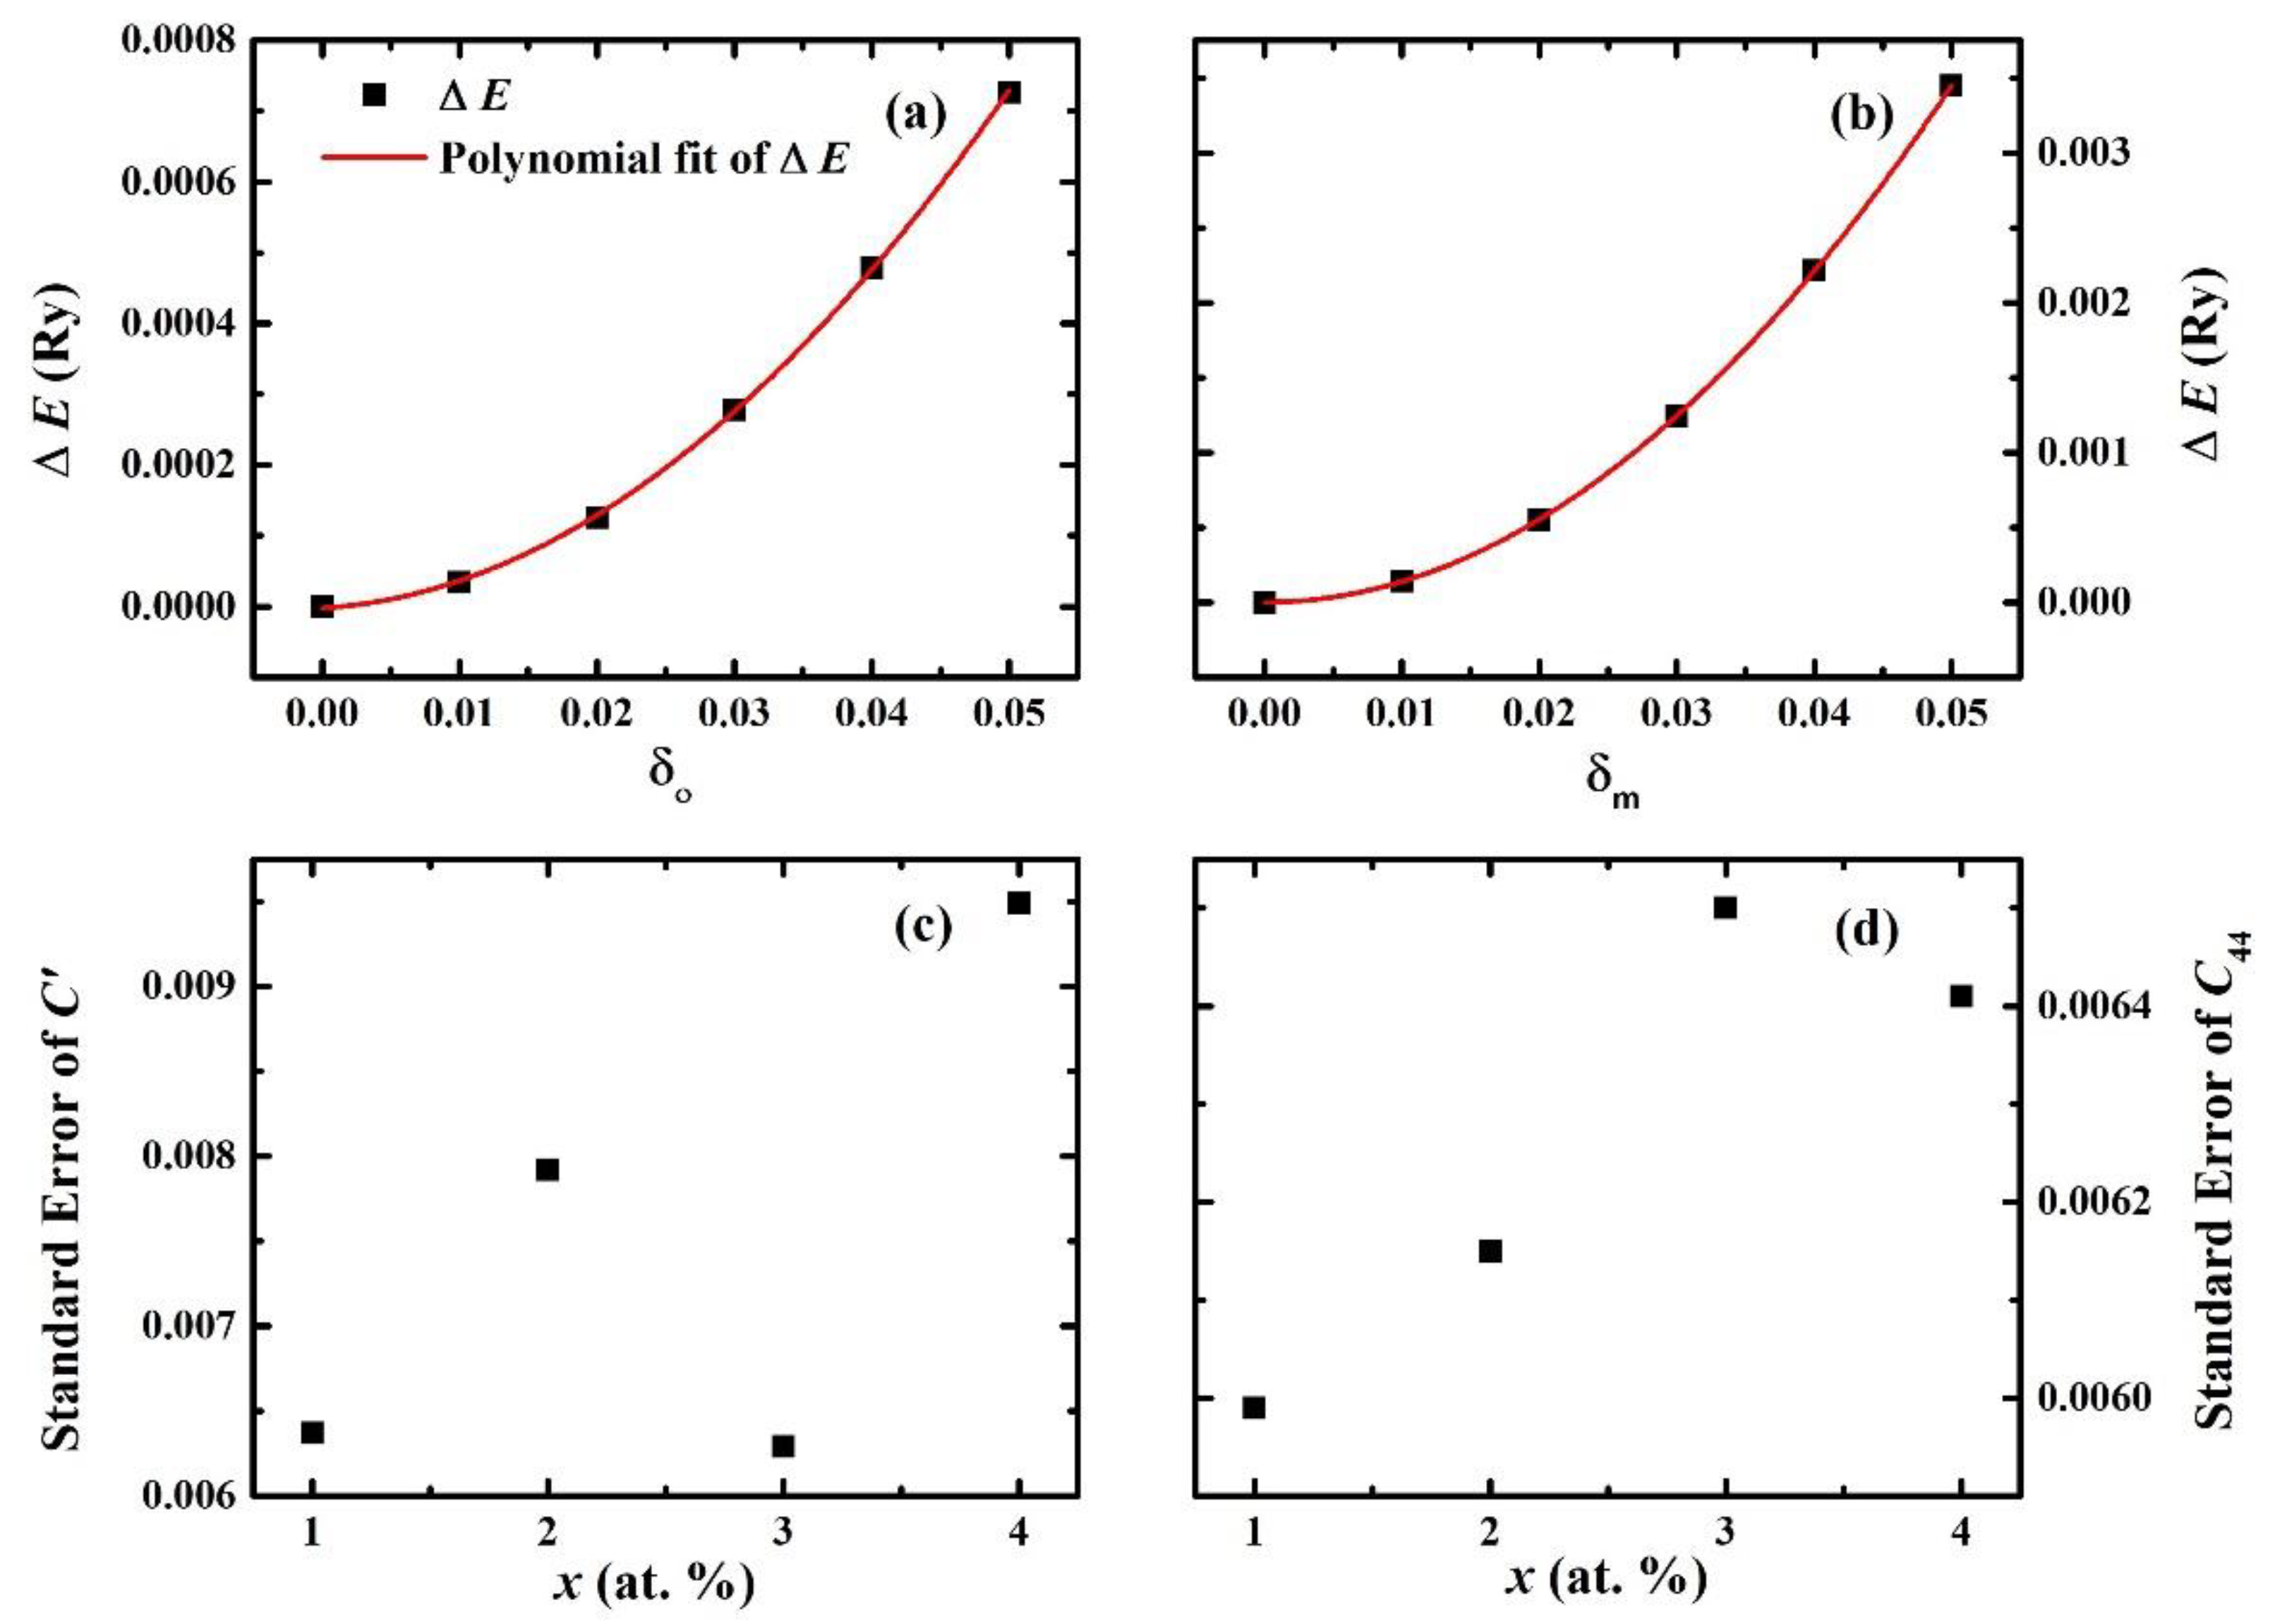
2.2. Elastic Constants

The elastic properties of mono-crystalline materials are described by the elements Cij of the elasticity tensor. There are three independent elastic constants for a cubic lattice C11, C12, and C44 and they are connected to the tetragonal shear elastic constant C′ = (C11C12)/2 and bulk modulus B = (C11 + 2C12)/3. Dynamical (mechanical) stability requires that C44 > 0, C′ > 0, and B > 0.
The cubic shear elastic constants C′ and C44 were computed by keeping the volume constant during deformations of the conventional cubic cell. For the tetragonal shear modulus C′, the following orthorhombic deformation was used:
( 1 + δ o 0 0 0 1 δ o 0 0 0 1 1 δ o 2 ) .
This leads to the energy change
Δ E ( δ o ) = 2 V C δ o 2 + O ( δ o 4 ) .
The C44 shear modulus was determined from the monoclinic distortion
( 1 δ m 0 δ m 1 0 0 0 1 1 δ m 2 )
yielding
Δ E ( δ m ) = 2 V C 44 δ m 2 + O ( δ m 4 )
In the above expressions, δ is the strain parameter.
Figure 1a,b represents an example of polynomial fit carried out for the above two equations (Equations (1) and (2)) which represent the constant volume (equilibrium volume) total energy change as functions of orthorhombic and monoclinic deformations, respectively. Panels (c) and (d) in Figure 1 show the standard errors in C′ and C44, respectively, of paramagnetic fcc Fe–Cr–Ni–Al alloys based on the polynomial fit.
In polycrystalline materials, the mono-crystalline grains are misoriented. On a large scale, these materials can be considered as isotropic materials. The isotropic solids can be described by their bulk modulus B and shear modulus G. One can establish the ab initio polycrystalline elastic moduli by transforming single-crystal elastic constants Cij to macroscopic quantities by suitable averaging methods based on statistical mechanics. For a cubic lattice, the polycrystalline bulk modulus is identical to the single-crystal bulk modulus. For the shear modulus, there are several different techniques for averaging the single-crystal data. Here, we adopted the arithmetic Hill [32] average G = (GV + GR)/2, where the Voigt [33] and Reuss [34] limits are given in terms of single-crystal elastic constants, namely,
G R = 5 ( C 11 C 12 ) C 44 / ( 4 C 44 + 3 C 11 3 C 12 )
G V = ( C 11 C 12 + 3 C 44 ) / 5
The Young’s modulus E and Poisson’s ratio ν are related to B and G by the relations
E = 9 B G / ( 3 B + G )
ν =   ( 3 B 2 G ) / ( 6 B + 2 G )
In the present study, the single-crystal and polycrystalline elastic constants of the paramagnetic Fe0.6−xCr0.2Ni0.2Mx (where M = Al, Co, Cu, Mo, Nb, Ti, V, and W; 0 x 0.08 ) quaternary alloys were calculated for fcc lattices. The properties are presented and analyzed as a function of the atomic concentration x. Different atomic concentrations were used for each alloying element depending on their real solubility in austenitic Fe0.6−xCr0.2Ni0.2M stainless steel.

2.3. Numerical Details

Green’s function was computed for 16 complex energy points distributed exponentially on a semicircular contour. The s, p, d, and f orbitals were included in the EMTO basis set and l max h = 8 was used in the one-center expansion of the full charge density [10]. The calculations are presented for paramagnetic fcc alloys. The total energy was evaluated by the shape function technique. The screened impurity model [35] with a screening parameter of 0.6 was used to describe the electrostatic correction to the single-site coherent potential approximation. For all components of the alloy, we chose the radii of the potential spheres to be equal to the corresponding average radii of the atomic spheres.
The bulk moduli of Fe0.6−xCr0.2Ni0.2Mx alloys at their equilibrium volumes estimated from Equation (7) were derived from an exponential Morse-type function [36] installed with the ab initio total energies calculated for seven different atomic volumes; these volumes were expressed in terms of Wigner-Seitz radii w in the range 2.55 Bohr ≤ w ≤ 2.70 Bohr in steps of 0.025 Bohr, including the equilibrium Wigner-Seitz radius. We considered six orthorhombic and monoclinic distortions with δ = 0, 0.01, 0.02, 0.03, 0.04, and 0.05. We used 1331–1694 uniformly distributed k-points in the irreducible wedge of the monoclinic and orthorhombic Brillouin zones to get the accuracy needed for the calculation of elastic constants.

3. Results and Discussions

3.1. Assessing the Accuracy of the Paramagnetic fcc Fe–20Cr–20Ni Alloy

We started our study by assessing the accuracy of our method with available experimental methods. In Table 1, we compare our results of single-crystal and polycrystalline elastic constants for the Fe0.6Cr0.2Ni0.2 alloy with the experimental results [8] for the Fe0.62Cr0.19Ni0.19 alloy, which is the closest alloy that we found to compare with. All theoretical elastic parameters for the Fe0.6Cr0.2Ni0.2 alloy were calculated at the lattice parameter a = 3.58 Å estimated from Equation (7), and the experimental elastic parameters for the Fe0.62Cr0.19Ni0.19 alloy were calculated at their experimental volume a = 3.55 Å [8]. We obtained agreement between our results and the experimental results, and we found that the theoretical C11, C12, and C′ values were smaller than the experimental values by 13.2%, 6.8%, and 25.1%, respectively. The calculated C44 was larger than the experimental value by 3.9%. We ascribe the worse agreement in the case of C′ to the different experimental volumes used in both methods and to the small differences in concentrations of alloying elements in both systems. The theoretical polycrystalline elastic constants B, E, and G were smaller than the experimental values by 9.4%, 9.2%, and 9.2%, respectively. On the other hand, the B/G ratio and Poisson’s ratio ν were accurately reproduced by our method. Compared to the experiment data, they deviated by 0.27% and 0.17%, respectively.
Having demonstrated the accuracy of our method, we expanded our study to Fe–Cr–Ni systems containing different concentrations of Al, Co, Cu, Mo, Nb, Ti, V, and W and investigated the alloying effects on the single and polycrystalline elastic constants of the Fe–Cr–Ni system.

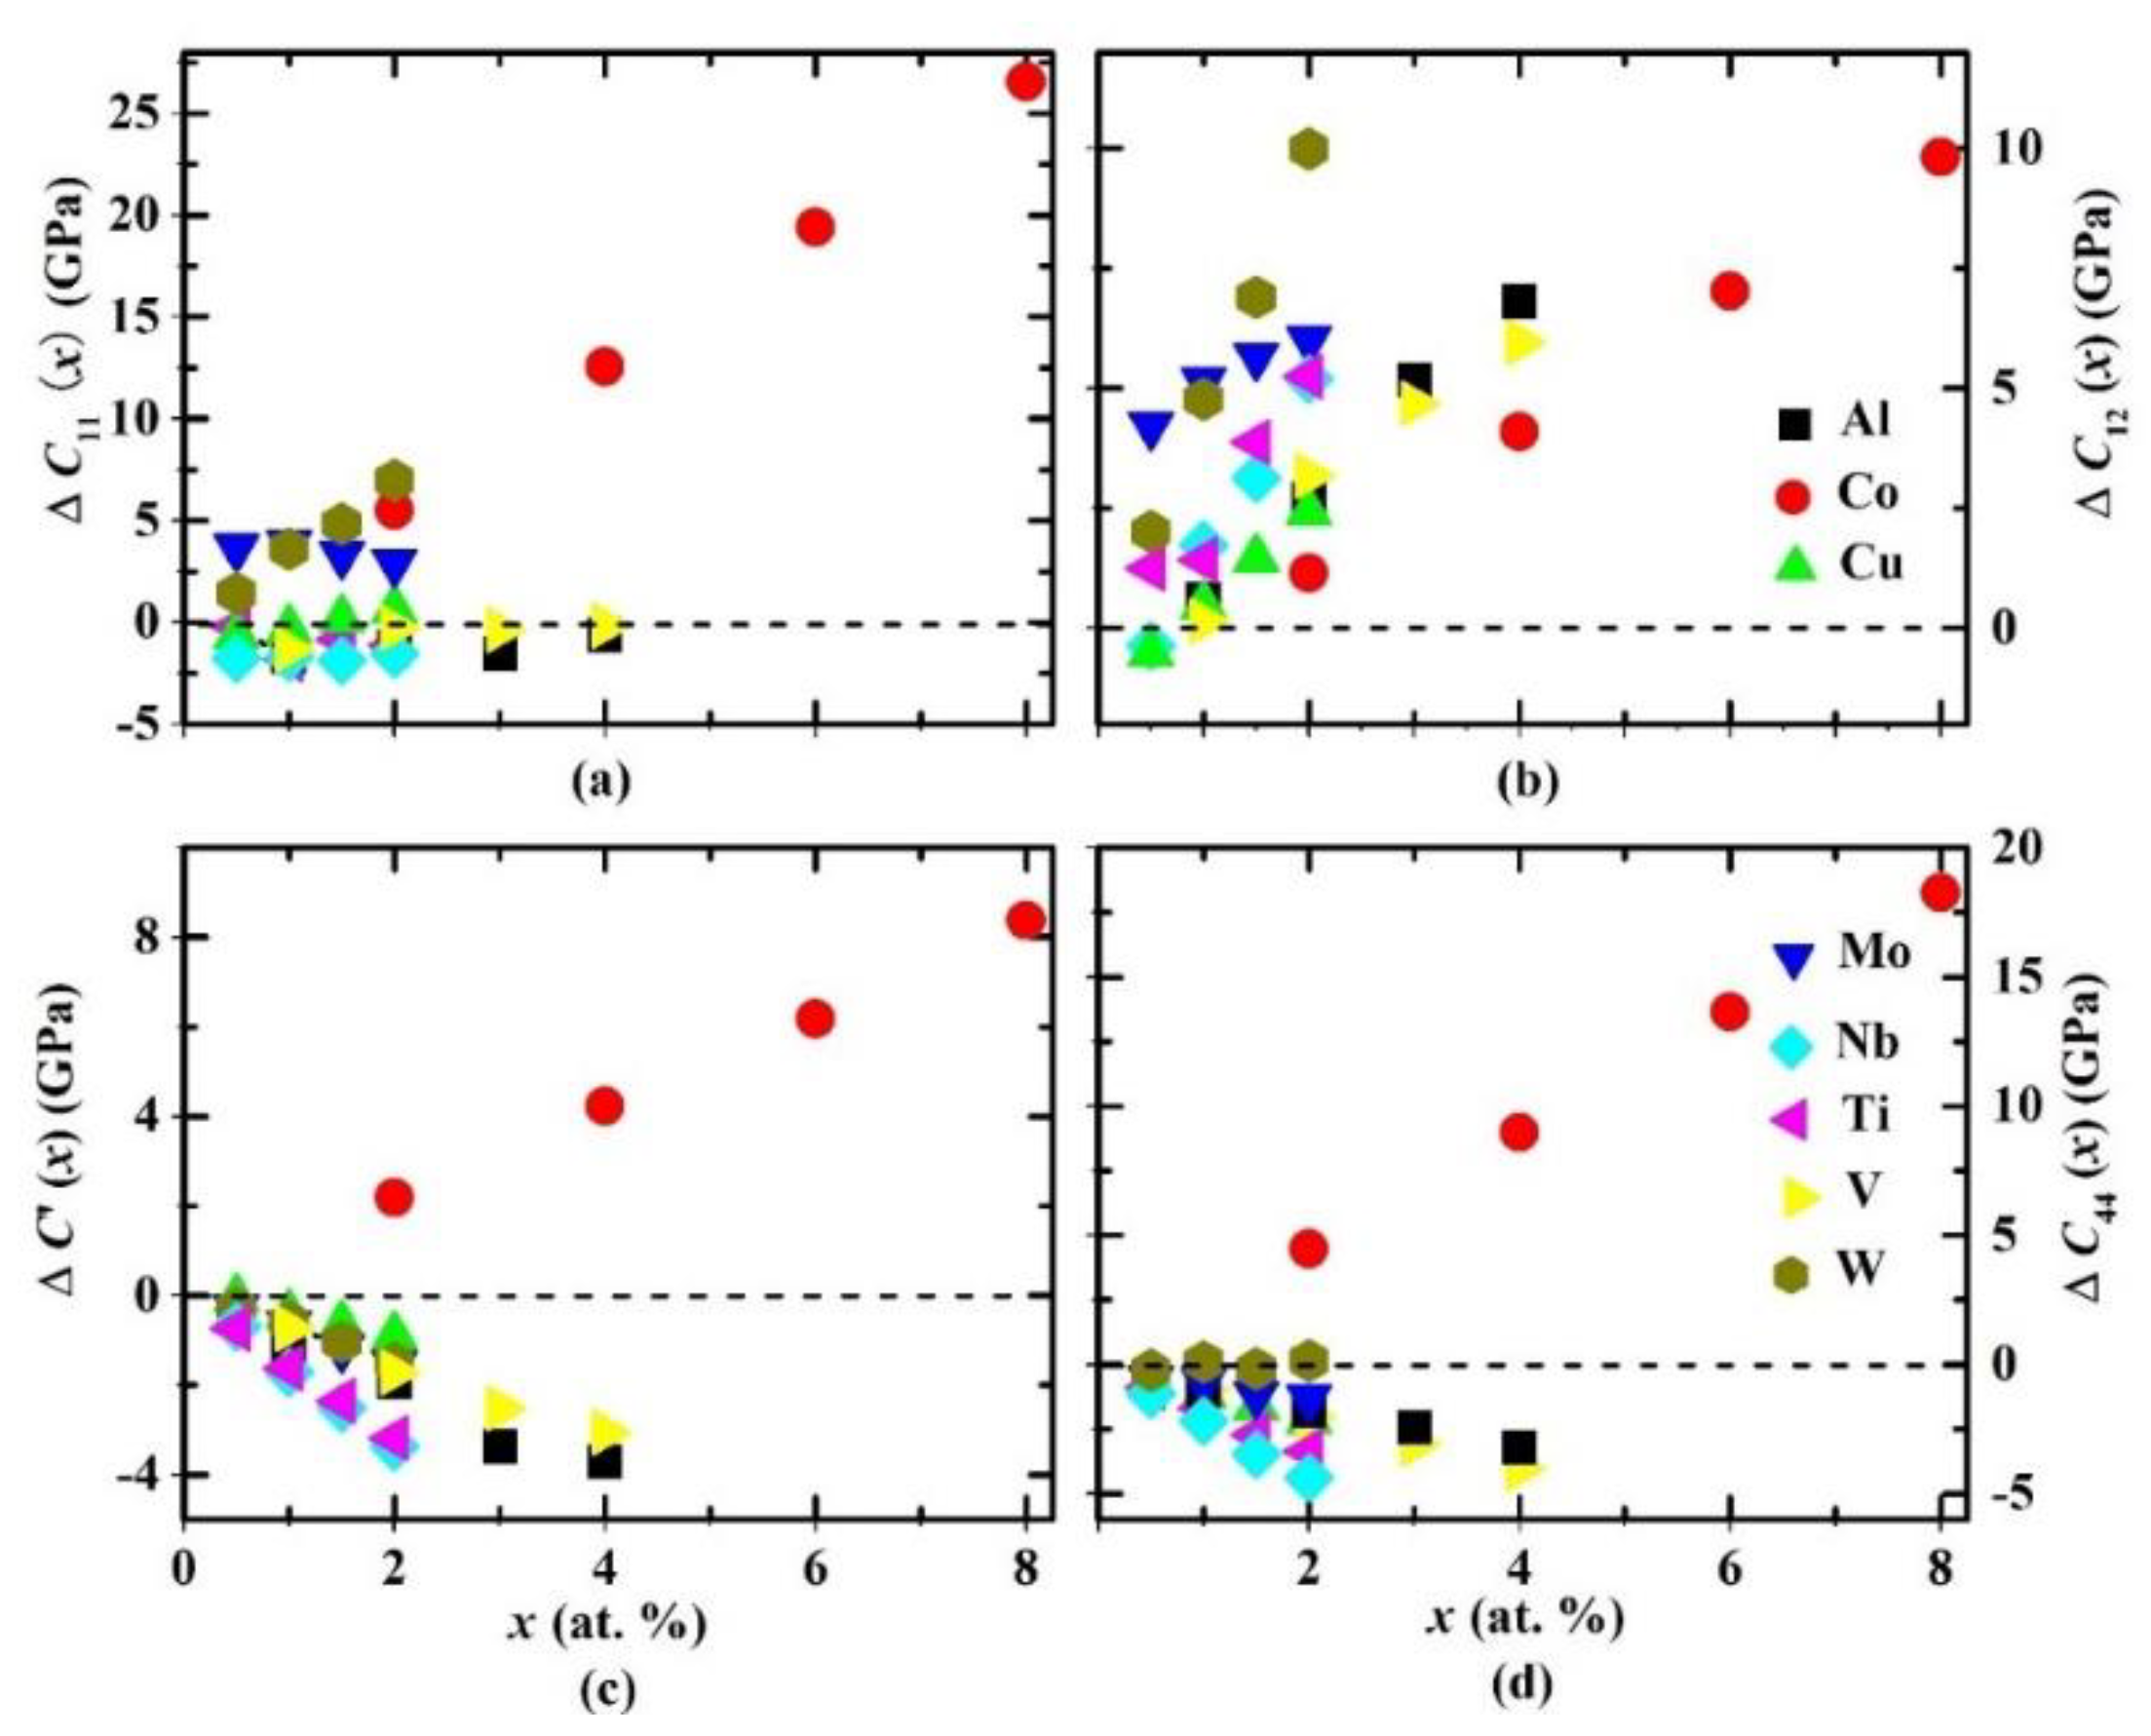
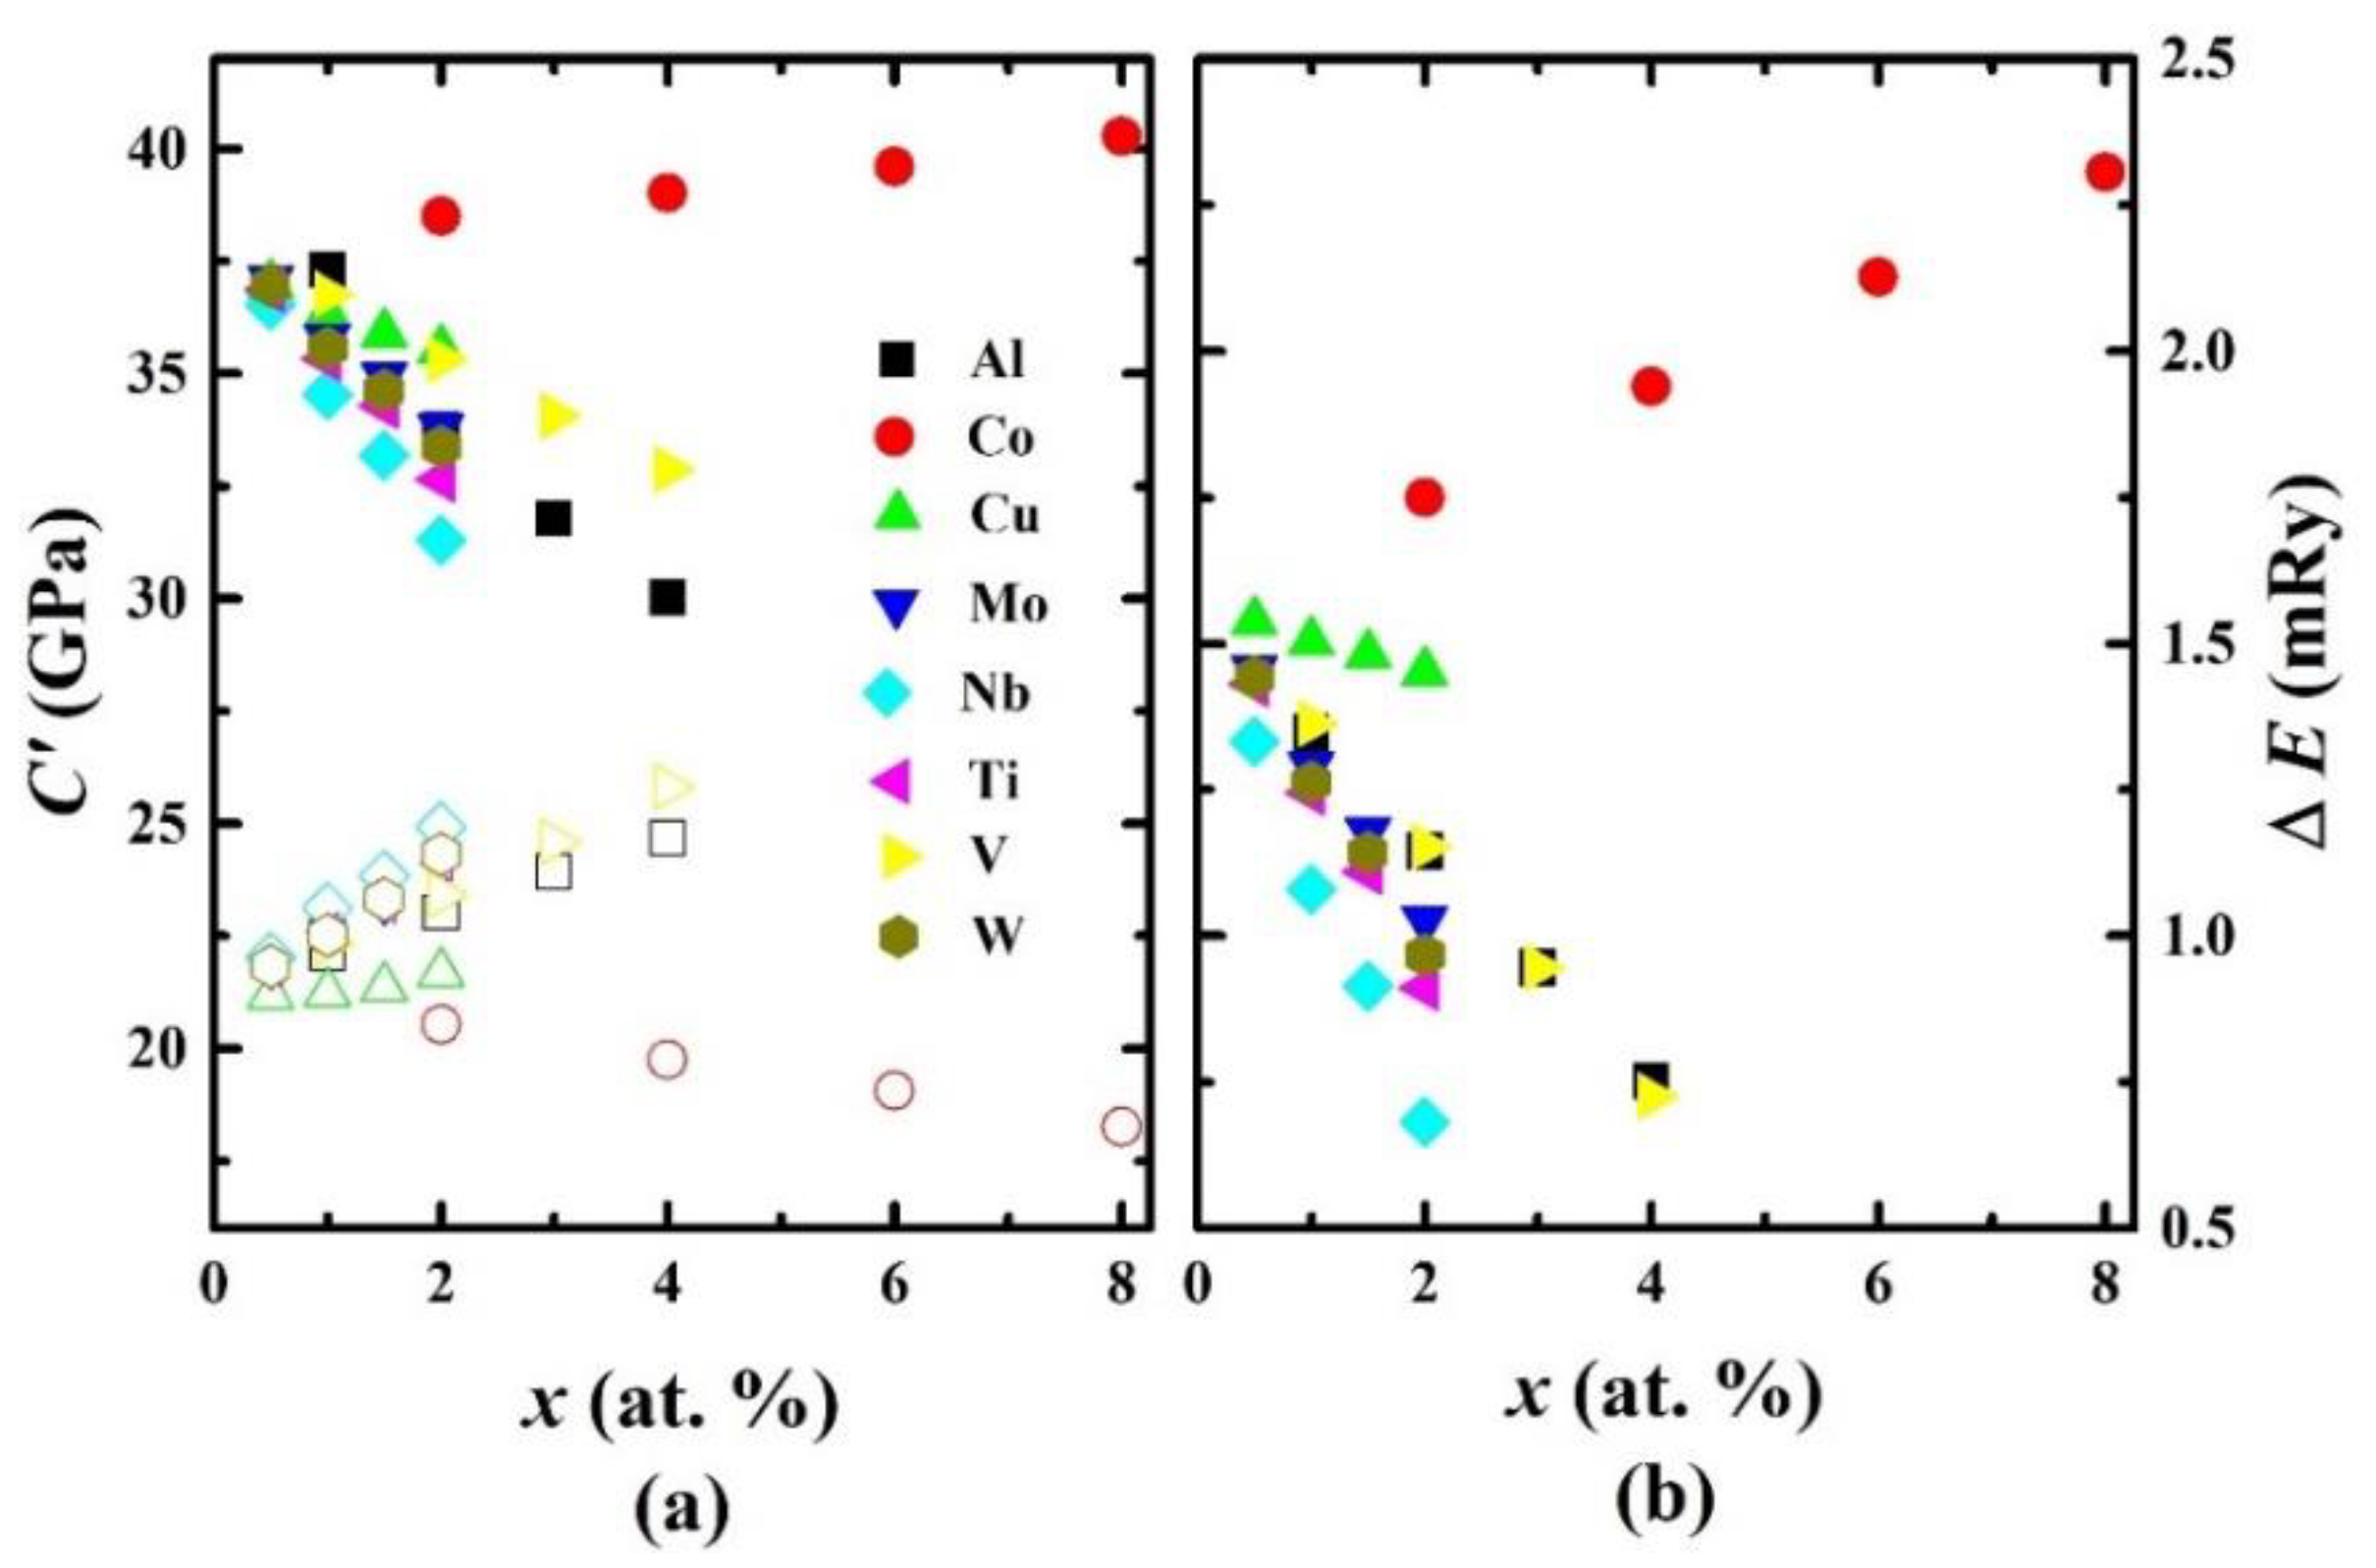
3.2. Single-Crystal Elastic Constants

Dyson and Holmes [37] applied X-ray methods to an austenite standard of known lattice parameter, and they observed predominantly linear variation in the lattice parameter with variation in the amount of alloying element in the austenite steel. They performed linear multiple regression analysis. The variation in the lattice parameter of austenite with respect to the atom % values of alloying elements using regression analysis was
a (Å) = 3.577 + 0.0065C + 0.0010Mn − 0.0002Ni + 0.0006Cr + 0.0056N + 0.0028Al − 0.004Co + 0.0014Cu + 0.0053Mo + 0.0079Nb + 0.0032Ti + 0.0017V + 0.0057W.
According to Equation (7), Al, Cu, Mo, Nb, Ti, V, and W dopants enlarge the lattice parameter of austenite steel, while Co deceases it. In Figure 2, using Equation (7), we display the changes in the equilibrium lattice parameter for paramagnetic fcc Fe0.6−xCr0.2Ni0.2Mx (M = Al, Co, Cu, Mo, Nb, Ti, V, and W; 0 x 0.08 ) quaternary alloys relative to the paramagnetic fcc Fe0.6Cr0.2Ni0.2 ternary alloy as a function of the atomic concentrations x of alloying elements. The numerical values of the lattice parameters, based on Equation (7), of the paramagnetic fcc Fe0.6−xCr0.2Ni0.2-based alloys are listed in Table 2 and Table 3.
Figure 3 represents the theoretical changes in single-crystal elastic constants (i.e., ΔCij(x) = Cij(Fe0.6−xCr0.2Ni0.2Mx) − Cij(Fe0.6Cr0.2Ni0.2)) of paramagnetic fcc Fe0.6−xCr0.2Ni0.2Mx (M = Al, Co, Cu, Mo, Nb, Ti, V, and W; 0 x 0.08 ) random alloys relative to the paramagnetic fcc Fe0.6Cr0.2Ni0.2 random alloy. In Table 2, we list the numerical values for C11, C12, C′, and C44 of paramagnetic fcc Fe0.6−xCr0.2Ni0.2-based alloys calculated at their corresponding equilibrium lattice parameter aexp.
Investigating Figure 3 and Table 2, we observe that when adding 2.0 (0.5), 4.0 (1.0), 6.0 (1.5), and 8.0 (2.0) atom % of Co (W) to the paramagnetic fcc Fe–Cr–Ni alloy, the theoretical C11 increases by 5.5 (1.5), 12.6 (3.6), 19.4 (4.9), and 53.6 (7.0) GPa, respectively. Aluminum, copper, niobium, titanium, and vanadium were found to have negligible effects on the C11 value of the paramagnetic fcc Fe–Cr–Ni alloy. It is interesting to note that when substituting 0.5 atom % of Mo for Fe in the Fe0.6Cr0.2Ni0.2 alloy, the C11 increases by 3.7 GPa, but further substitution of Mo (1.0, 1.5, and 2.0 atom %) for Fe has no effect on the C11 of the Fe0.6Cr0.2Ni0.2 alloy.
The calculated C12 of the fcc Fe–Cr–Ni alloy increased with all alloying elements considered. Namely, the addition of 1.0, 2.0, 3.0, and 4.0 atom % of Al (V) to the Fe0.6Cr0.2Ni0.2 alloy enhanced the C12 value by 0.6 (0.2), 2.7 (3.2), 5.2 (4.7), and 6.8 (6) GPa, respectively. Cobalt and tungsten had pronounced effects on the C12 value: adding 2.0 (0.5), 4.0 (1.0), 6.0 (1.5), and 8.0 (2.0) atom % of Co (W) to Fe0.6Cr0.2Ni0.2 alloy yielded ΔC12 = 1.2 (2), 4.1 (4.8), 7 (6.9), and 9.8 (10) GPa. Substituting 0.5 atom % to 2.0 atom % of Cu, Mo, Nb, and Ti for Fe in the Fe0.6Cr0.2Ni0.2 alloy increased C12 from ~1.2 GPa to ~4.4 GPa.
We then investigated the alloying effects on the shear elastic constant C44 of the Fe0.6Cr0.2Ni0.2 alloy, and we found that Co is the only alloying element that enhanced C44. Adding 2.0, 4.0, 6.0, and 8.0 atom % of Co to the Fe0.6Cr0.2Ni0.2 alloy increased the C44 value by 4.5, 9.0, 13.7, and 18.3 GPa, respectively. Negative alloying effects on C44 of the fcc Fe–Cr–Ni alloy occurred for Al, Cu, Mo, Nb, Ti, and V. Substituting 1.0, 2.0, 3.0, and 4.0 atom % of Al (V) for Fe in the Fe0.6Cr0.2Ni0.2 alloy reduced the C44 value by 1.0 (1.0), 1.8 (2.0), 2.5 (3.0), and 3.2 (4.0) GPa, respectively. On the other hand, adding 0.5 atom % to 2 atom % of Cu, Mo, Nb, and Ti changed ΔC44 from approximately −0.6 GPa to −3.4 GPa. Tungsten was found to have a negligible effect on C44.
The tetragonal shear elastic constant C′ is often used to describe the stability of cubic solids. Positive (negative) values of C′ indicate a stable (unstable) structure. Investigating Figure 3, we observed that Co addition increased the C′ value of paramagnetic fcc Fe–Cr–Ni alloy, while Al, Cu, Mo, Nb, Ti, V, and W additions decreased it. Adding 2.0, 4.0, 6.0, and 8.0 atom % of Co to Fe0.6Cr0.2Ni0.2 enhanced C′ by 2.1, 3.5, 6.1, and 8.3 GPa, while substituting 1.0, 2.0, 3.0, and 4.0 atom % of Al (V) for Fe in the Fe0.6Cr0.2Ni0.2 alloy reduced the C′ value by 1.2 (0.8), 2 (1.8), 3.4 (2.6), and 3.8 (3.1) GPa. The effects of the other alloying elements were similar to those of Al and V. Adding 0.5 atom % to 2 atom % of Cu, Mo, Nb, Ti, or W to the Fe–Cr–Ni alloy changed the ΔC′ from approximately −0.1 GPa to approximately −3.4 GPa, respectively. According to our calculations of C′, we may conclude that the paramagnetic fcc Fe–Cr–Ni alloy becomes dynamically more stable with Co addition and less stable with Al, Cu, Nb, Mo, Ti, V, and W dopants.
The tetragonal shear elastic constant C′ is connected to the structural energy difference ΔE (i.e., ΔE = EbccEfcc) between the bcc and fcc lattices. The values of C′ can be obtained from the curvature around the energy minimum along a constant-volume Bain path. In fact, the Bain path [38] is a martensitic path that connects the fcc and bcc lattices which can be described as a body-centered tetragonal (bct) structure; when the c/a ratio of the bct structure is 1, the structure is bcc, while when the c/a ratio reaches 2 , the structure is called an fcc structure. We can understand the trends of the C′ elastic constants by understanding the trends of ΔE. In Figure 4, we plot the C′ of fcc (solid symbols) and bcc (open symbols) lattices of paramagnetic Fe–Cr–Ni-based alloys and ΔE (i.e., ΔE = EbccEfcc).
Lacking experimental volume data for the paramagnetic bcc Fe0.6−xCr0.2Ni0.2Mx (M = Al, Co, Cu, Mo, Nb, Ti, V, and W; 0 x 0.08 ) random alloys, the Cfcc and Cbcc values and the total energies Ebcc and Efcc in Figure 4 were calculated at their theoretical equilibrium volumes.
Investigating Figure 4a, we find that the C′ values of all fcc paramagnetic Fe–Cr–Ni–M alloys are larger than those of the bcc lattices, which means that for all alloys considered, the fcc structure is more stable than the bcc structure. On the other hand, alloying has an impact on increasing or decreasing the fcc and bcc tetragonal elastic constants. We observe that the Cfcc (Cbcc) value of the Fe–Cr–Ni system increases (decreases) by addition of Co, while other alloying elements (Al, Cu, Mo, Nb, Ti, V, and W) reduce (enhance) the Cfcc (Cbcc) value of the Fe–Cr–Ni system. The structural energy difference ΔE (Figure 4b) has a similar (opposite) trend to that of Cfcc (Cbcc), with larger (smaller) values of ΔE corresponding to larger (smaller) values of Cfcc (Cbcc) of the Fe–Cr–Ni system. The scaling between Cfcc (Cbcc) and ΔE for Fe–Cr–Ni-based alloys holds. Our observations on the correlation between C′ and ΔE are in line with those obtained by [39,40,41,42,43,44].
In summary, according to our calculations, the most significant effect on the C11, C12, C44, and C′ values of paramagnetic fcc Fe–Cr–Ni alloy was found for Co. The correlation between C′ and the structural energy difference ΔE between the bcc and fcc lattices of the paramagnetic Fe–Cr–Ni system holds.

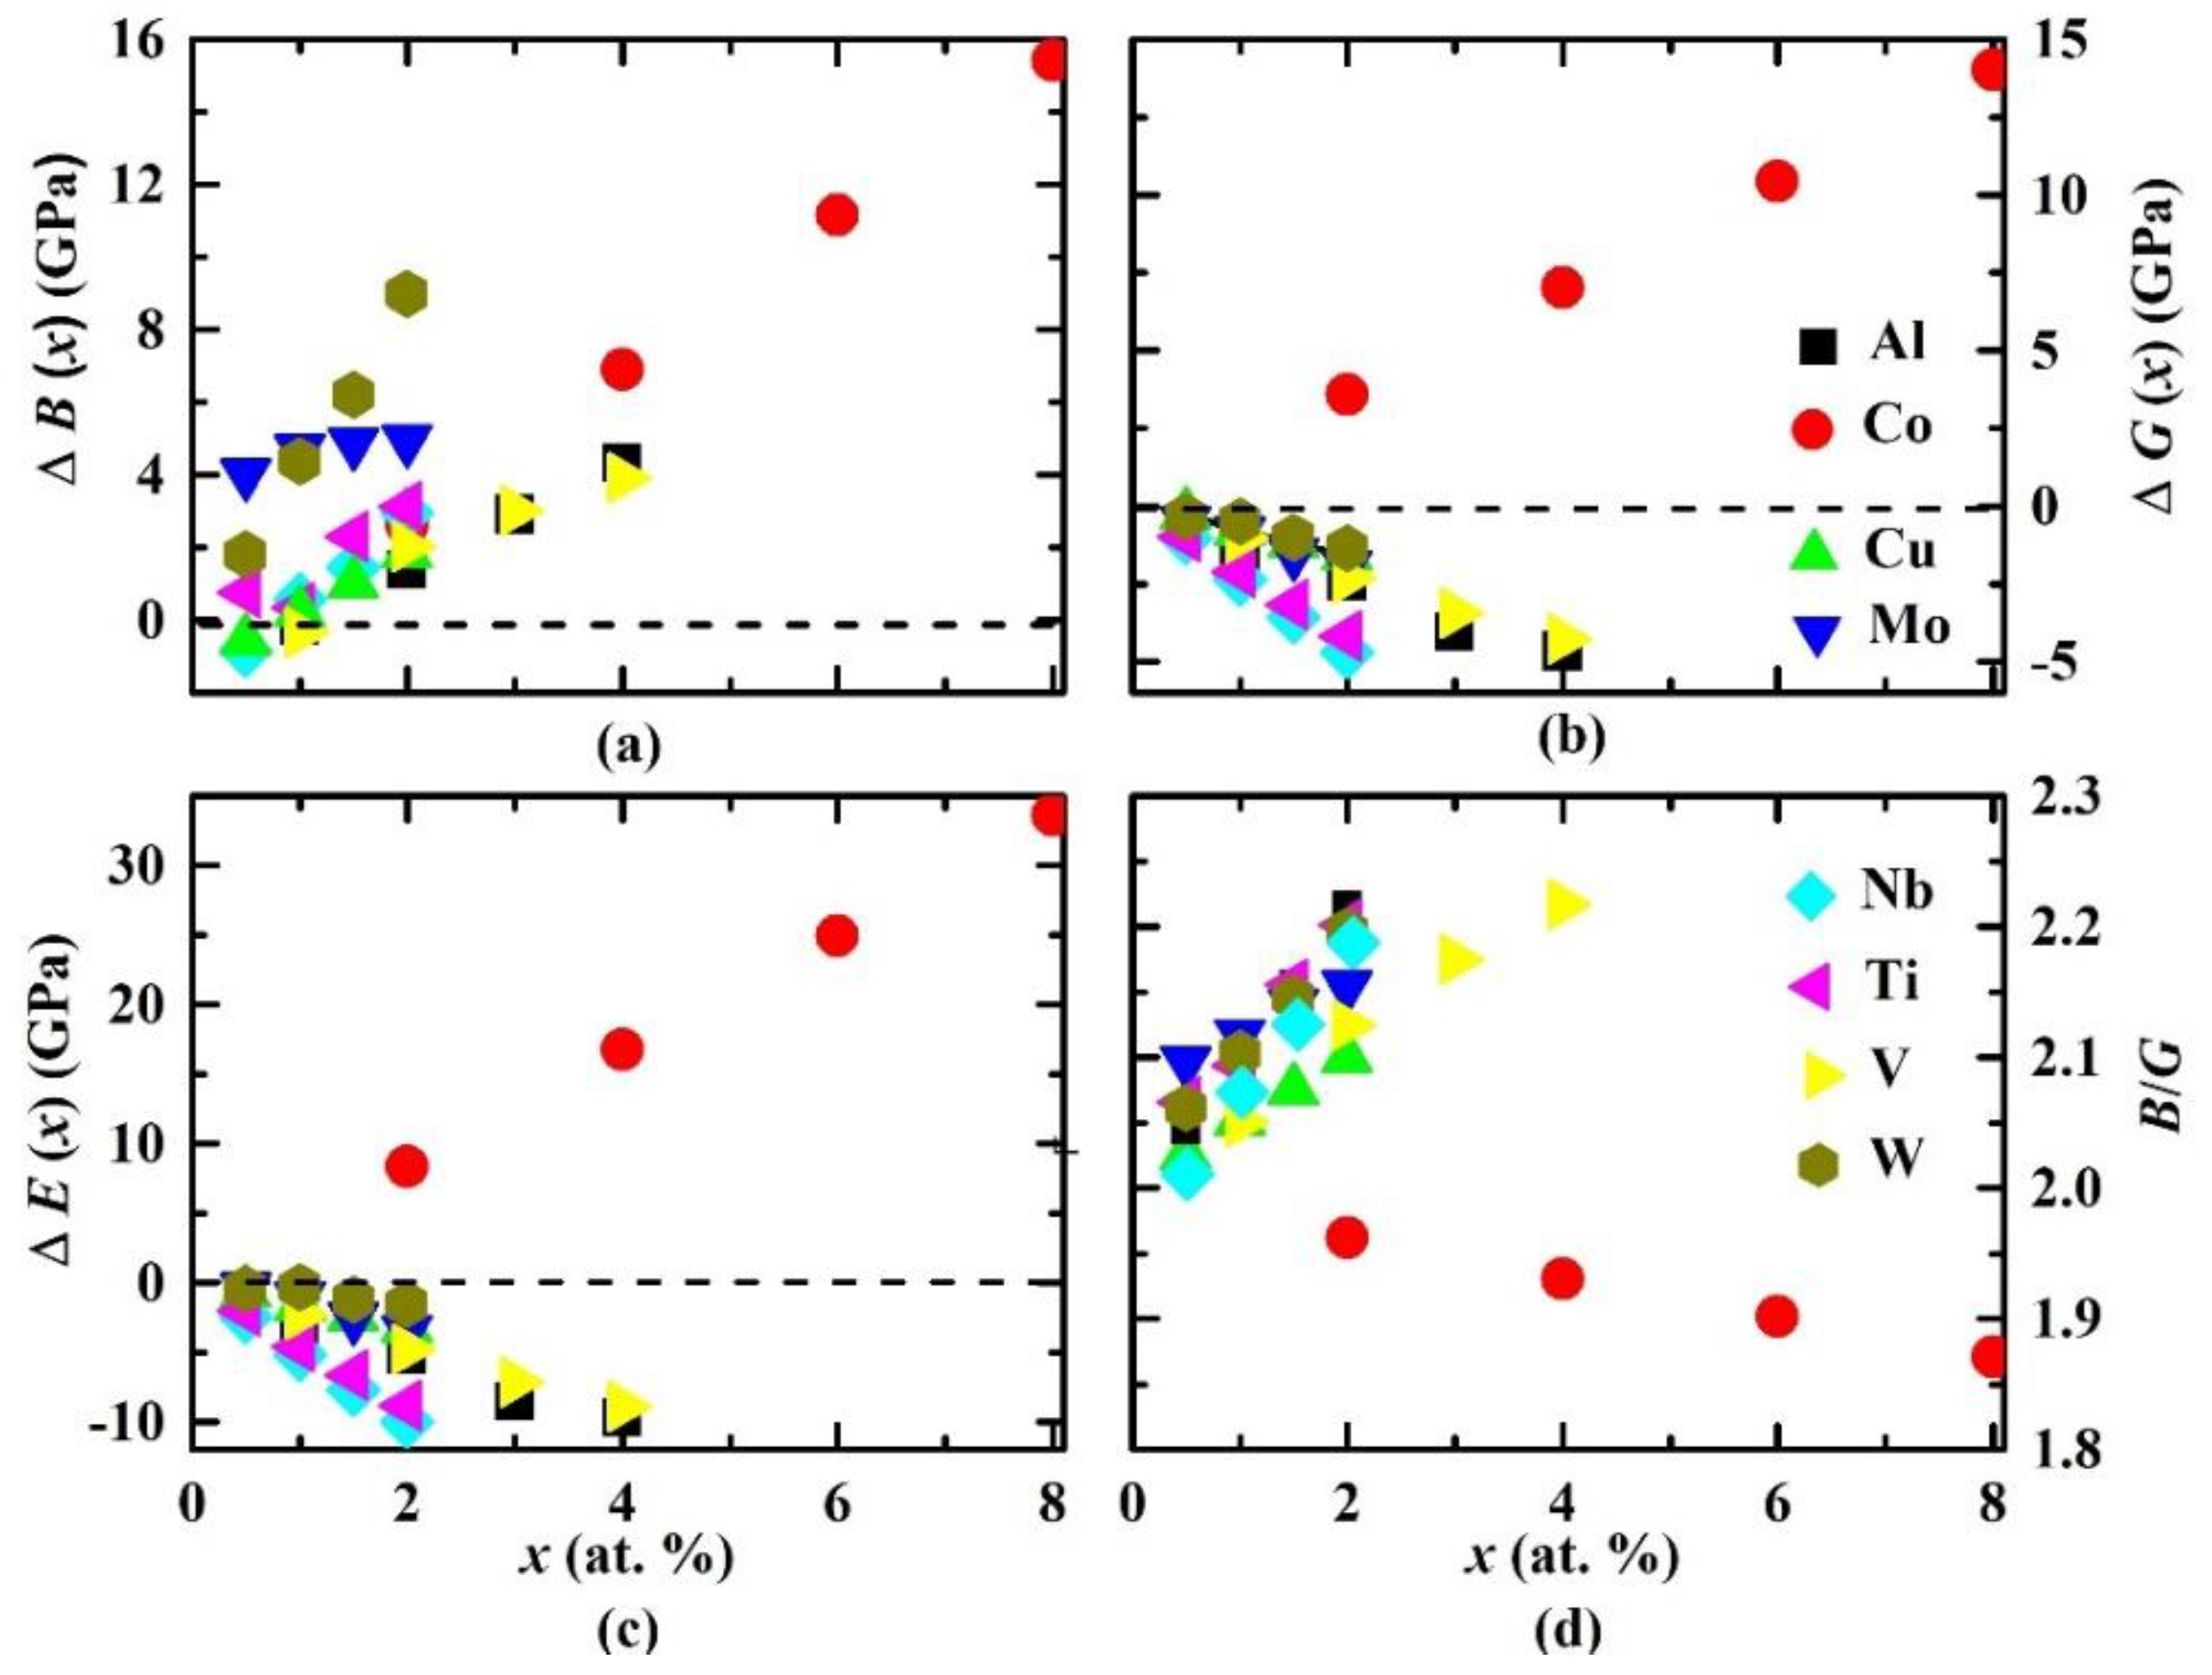
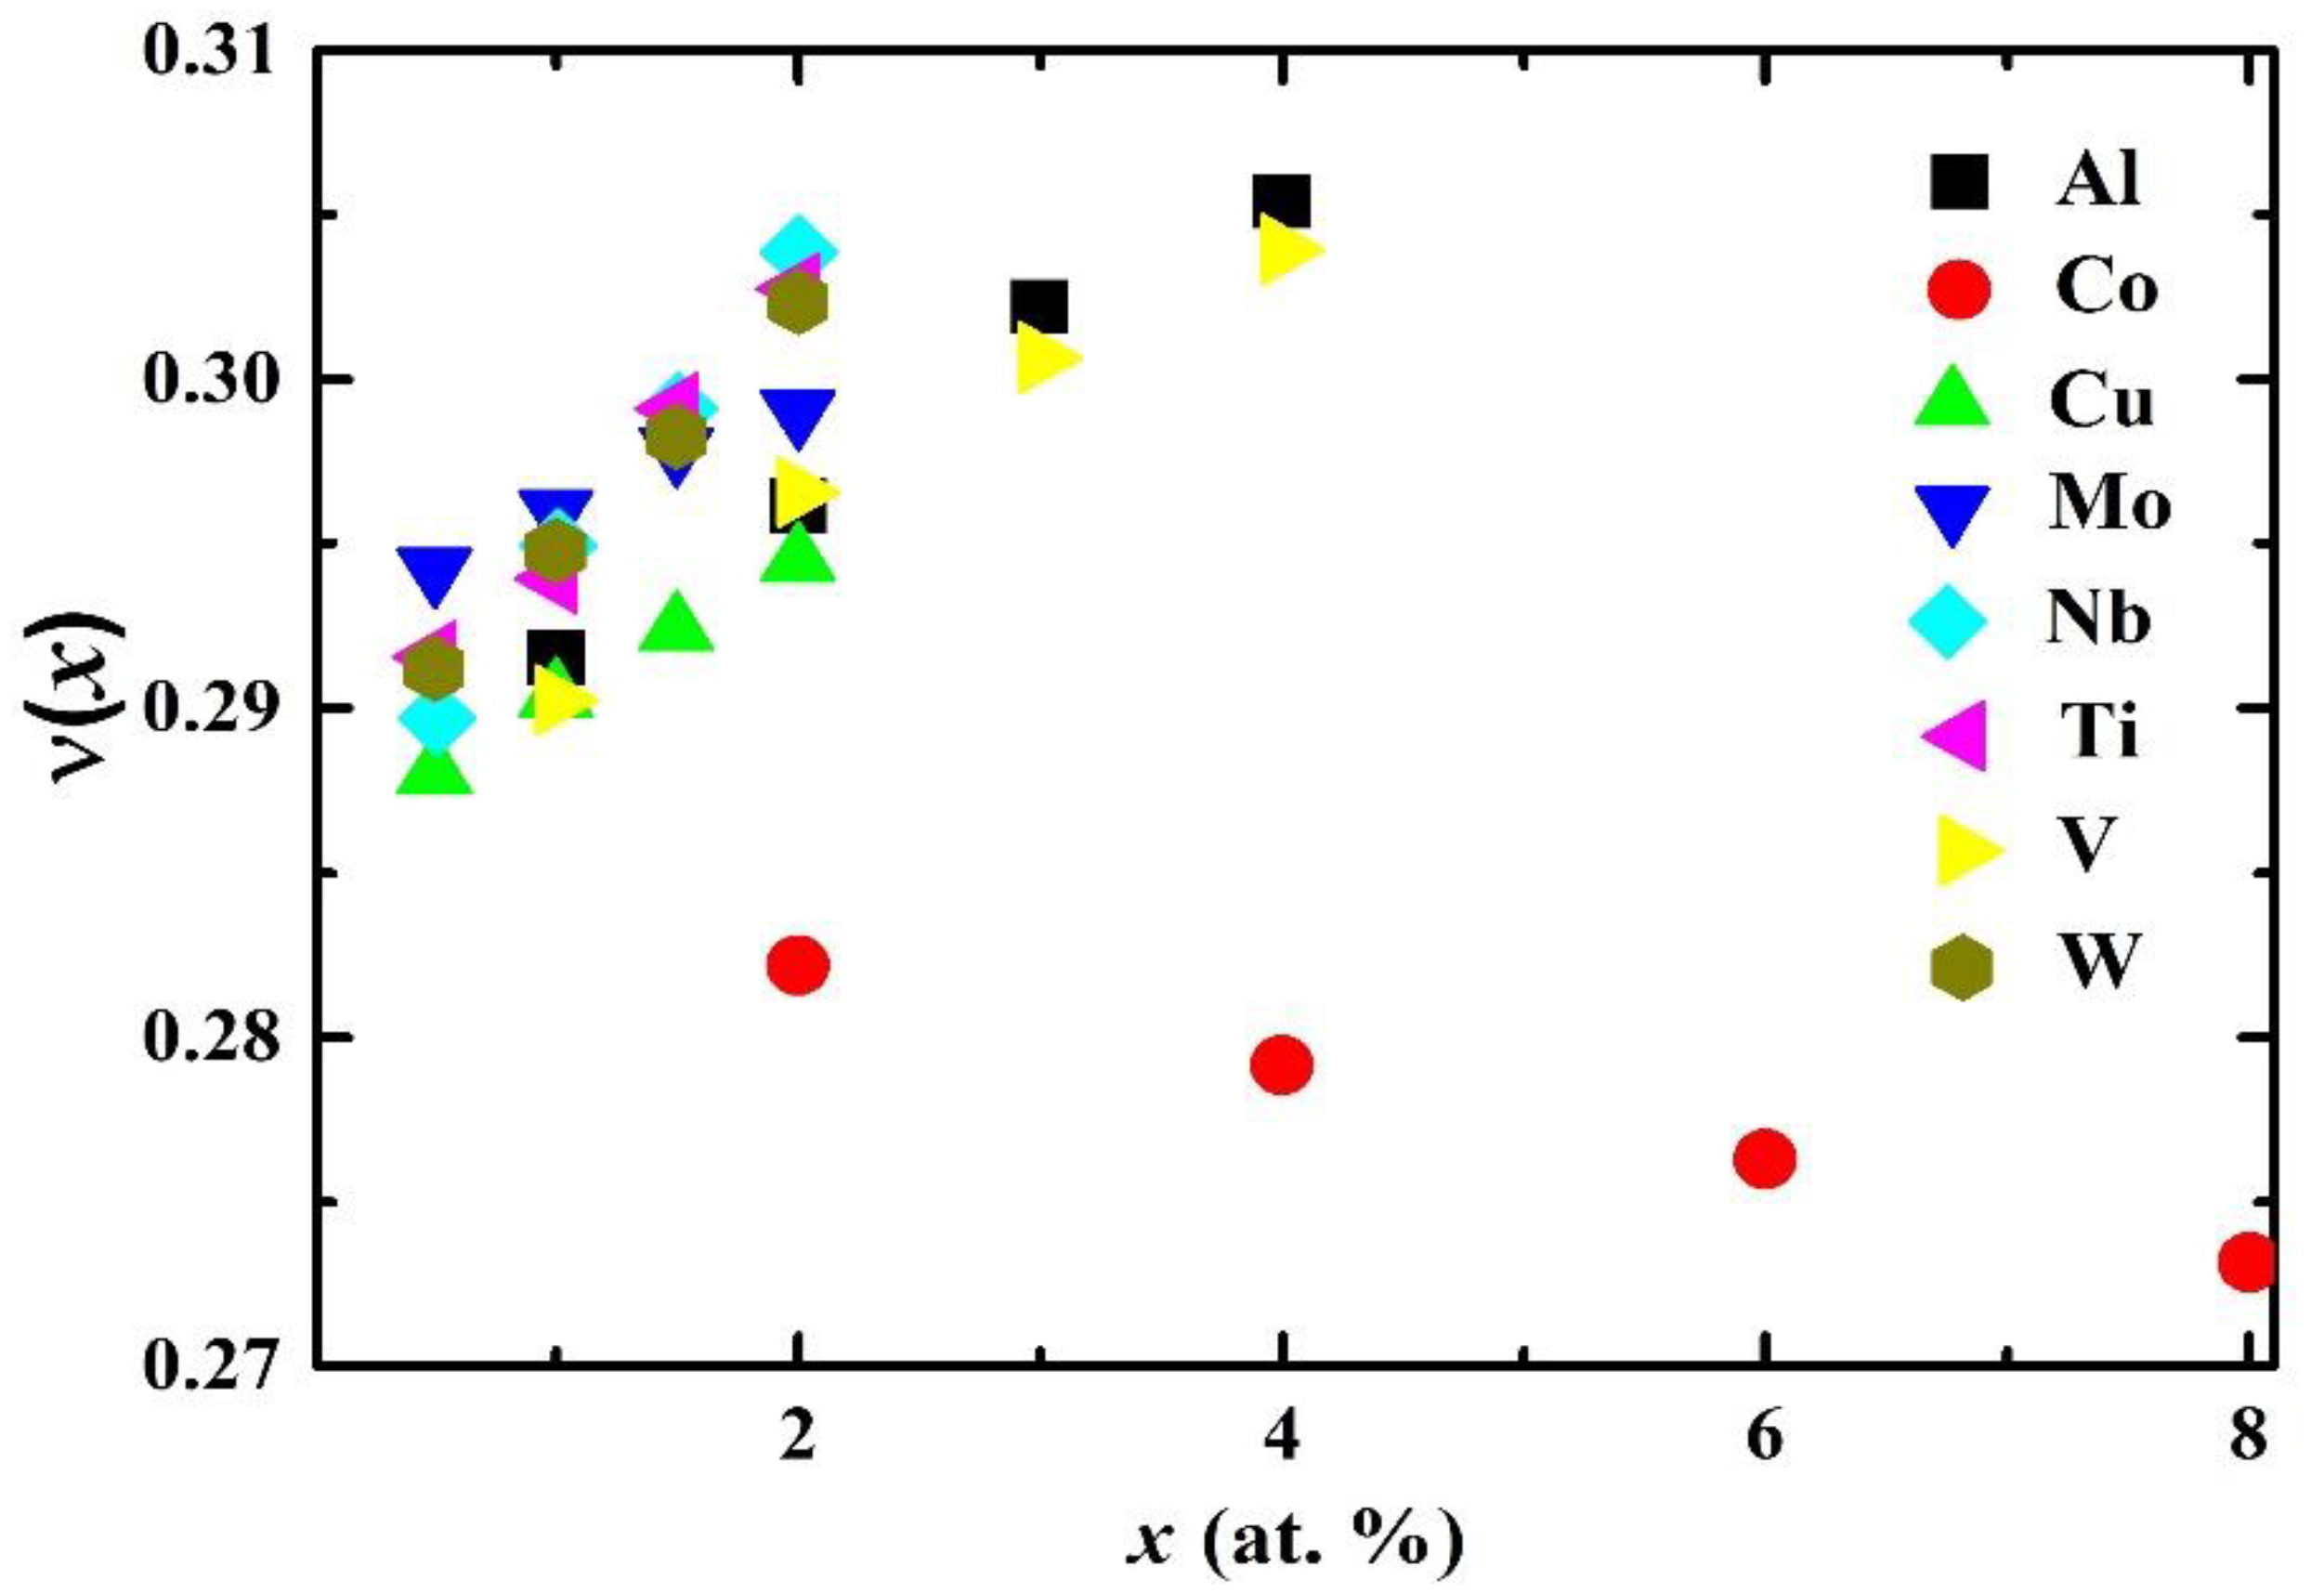
3.3. Polycrystalline Elastic Constants

Theoretical changes in the polycrystalline elastic constants (ΔB(x), ΔG(x), ΔE(x)) of paramagnetic fcc Fe0.6−xCr0.2Ni0.2Mx (M = Al, Co, Cu, Mo, Nb, Ti, V, and W; 0 x 0.08 , where x is in atom %) random alloys relative to the paramagnetic fcc Fe0.6Cr0.2Ni0.2 random alloy and B/G ratio are plotted in Figure 5. The numerical values of the polycrystalline elastic constants (B(x), G(x), E(x)), B/G(x) ratio, and Poisson ratio ν(x) for paramagnetic fcc Fe–Cr–Ni-based alloys calculated at their experimental lattice parameters aexp are listed in Table 3.
In Figure 5, we observe that all alloying elements enhanced the bulk modulus of the Fe–Cr–Ni system. The greatest alloying effect was found for Co, which increased the B(x) of the Fe–Cr–Ni alloy to 3.6, 6.9, 11.2, and 15.4 GPa when adding 2.0, 4.0, 6.0, and 8.0 atom %. Aluminum and vanadium had an almost similar effect on the bulk modulus of the Fe–Cr–Ni system. Substituting 1.0, 2.0, 3.0, and 4.0 atom % of Al (V) for Fe in the Fe0.6Cr0.2Ni0.2 alloy enhanced the bulk modulus by −0.2 (−0.3), 1.4 (2.0), 2.9 (3.0), and 4.3 (3.9) GPa, respectively. Tungsten had a significant effect on the bulk modulus. Namely, adding 0.5, 1.0, 1.5, and 2 atom % of W to the Fe–Cr–Ni alloy enhanced the bulk modulus by 1.8, 4.4, 6.2, and 9 GPa, respectively. Other alloying elements (Cu, Mo, Nb, Ti) enhanced the bulk modulus by small amounts ranging from approximately −0.8 GPa to approximately 5.0 GPa depending on the alloying elements’ atomic concentrations. We attribute the increase of the bulk modulus when adding transition metals (Co, Cu, Mo, Nb, Ti, V, W) to the Fe–Cr–Ni alloy to the cohesion in d metals using the Friedel model [45,46], and also to the bond increase when going from 3d (Co, Cu, Ti, V) to 4d (Mo, Nb) and 5d (W) metals [47].
From Figure 5 and Table 3, we see that ΔG(x) and ΔE(x) have similar behavior. The variation of the shear modulus G(x) and Young’s modulus E(x) increased when adding Co to the Fe–Cr–Ni alloy: adding 2.0–8.0 atom % of Co raised the G value (E value) of the Fe–Cr–Ni alloy by 3.6 (8.4) to 14.0 (33.6) GPa. On the other hand, Al, Cu, Mo, Nb, Ti, V, and W dopants reduced the G(x) and E(x) of the Fe–Cr–Ni alloy. The largest effect on G(x) and E(x) of Fe–Cr–Ni–M was produced by Co.
Investigating Figure 3 and Figure 5, we note that the trends of ΔC′(x), ΔC44(x), ΔG(x), and ΔE(x) are similar but are opposite to that of Δa(x) from Figure 2. These trends can be explained using the following assumption based on the volume effect: Since Co addition decreases the average volume per atom in Fe–Cr–Ni (see Figure 2), it is also increasing the average bond strength and, therefore, the ability of the alloy to resist shear, while additions of Al, Cu, Nb, Mo, Ti, V, and W have the opposite effect. The addition of Al, Cu, Nb, Mo, Ti, V, or W to the fcc Fe–Cr–Ni alloy enlarges the lattice parameter and thus weakens the average bond strength between atoms; therefore, the ability of the alloy to resist shear decreases.
The ductile/brittle behavior of structural materials is important to their performance. Pugh [48] suggested a criterion that tests the ductility and brittleness of materials based on their bulk and shear moduli values: a material that has a B/G ratio less than 1.75 is in the brittle regime; otherwise, it is in the ductile regime. From Figure 5 and Table 3, we observed that the paramagnetic fcc Fe0.6Cr0.2Ni0.2 alloy is in the ductile regime with B/G = 2.0253. Our calculations show that Al, Cu, Mo, Nb, Ti, V, or W addition to the paramagnetic fcc Fe–Cr–Ni system enhances B/G and increases the ductility of the system. Niobium and vanadium have the largest impact on the ductility of the Fe–Cr–Ni system: adding 2.0 (4.0) atom % of Nb (V) raised the B/G to 2.2161 (2.2167). Cobalt reduced the B/G value and therefore decreased the ductility of the Fe–Cr–Ni system.
In Figure 6, we plot the theoretical Poisson’s ratio ν(x) for paramagnetic fcc Fe0.6−xCr0.2Ni0.2Mx (M = Al, Co, Cu, Mo, Nb, Ti, V, and W; 0 x 0.08 ) random alloys as a function of atomic concentration x. We obtained the result that the Poisson’s ratio has a similar trend to B/G. Adding Al, Cu, Mo, Nb, Ti, V, or W to the Fe–Cr–Ni alloy enhanced the value of ν(x), while Co addition decreased the ν(x) value of the Fe–Cr–Ni alloy. The most significant effects on the ν(x) value of paramagnetic fcc Fe–Cr–Ni alloy were produced by Al and V.
Our results on the polycrystalline elastic constants for Fe–Cr–Ni–Mo alloys are in line with those obtained by Ledbetter et al. [5], who produced ultrasonic measurements of the polycrystalline elastic constants of six fcc Fe–19Cr–12Ni (atom %) alloys with Mo content ranging up to 2.4 atom %. They found that Mo reduced the G and E moduli and raised the B and ν ratio.

4. Conclusions

Using the exact muffin-tin orbital method with coherent potential approximation and Perdew-Burke-Ernzerhof generalized gradient approximation, we investigated the single-crystal and polycrystalline elastic parameters of paramagnetic fcc Fe0.6−x–Cr–Ni–Mx(M = Al, Co, Cu, Mo, Nb, Ti, V, and W; 0 ≤ x ≤ 0.08) random alloys. We demonstrated that all alloying elements enhanced the elastic constant C12 of the Fe–Cr–Ni system. Cobalt and tungsten increased the C11 elastic constant of the Fe–Cr–Ni ternary alloy, while other alloying elements had a negligible effect. Furthermore, we found that the C′, C44, E, and G moduli of the Fe–Cr–Ni alloy were increased by Co addition and reduced by Al, Cu, Mo, Nb, Ti, V, and W dopants. Tungsten had a negligible effect on C44. We obtained a correlation between C′ and the structural energy difference ΔE between fcc and bcc lattices, wherein large C′ corresponds to large ΔE. The brittle/ductile transitions formulated by the Pugh ratio B/G were also discussed. It was shown that Al, Cu, Mo, Nb, Ti, V, and W dopants enhanced the ductility of the Fe–Cr–Ni system, while Co enhanced the brittleness of the Fe–Cr–Ni alloy. The Poisson’s ratio ν showed the same trend as the B/G ratio, with small variations obtained in ν when adding alloying elements to the Fe–Cr–Ni system. Our calculations provide consistent data on the elastic properties of paramagnetic fcc Fe–Cr–Ni-based alloys at low temperature and call for experimental studies on these alloys.

Funding

This research received no external funding.

Acknowledgments

I would like to thank L. Vitos for the helpful discussion. The simulations were performed using resources provided by the Swedish National Infrastructure for Computing (SNIC) at the National Supercomputer Centre in Linköping.

Conflicts of Interest

The author declares no conflict of interest.

References

  1. Marshall, P. Austenitic Stainless Steel: Microstructure and Mechanical Properties; Elsevier Applied Science Publishers Ltd.: London, UK, 1984. [Google Scholar]
  2. Davis, J.R. AMS Specialty Handbook: Stainless Steels; AMS International: Geauga County, OH, USA, 1994. [Google Scholar]
  3. Wrangln, G. An Introduction to Corrosion and Protecting of Metals; Chapman and Hall: New York, NY, USA, 1985. [Google Scholar]
  4. Majumdar, A.K.; Blanckenhagen, P.V. Magnetic phase diagram of Fe80−xNixCr20 (10≤x≤30) alloys. Phys. Rev. B 1984, 29, 4079–4085. [Google Scholar]
  5. Ledbetter, H.M.; Kim, S.A. Molybdenum effect on Fe–Cr–Ni-alloy elastic constants. J. Mater. Res. 1988, 3, 40–44. [Google Scholar] [CrossRef]
  6. Ledbetter, H. Predicted monocrystal elastic constants of 304-type stainless steel. Physica 1985, 128, 1–4. [Google Scholar] [CrossRef]
  7. Ledbetter, H.M. Sound velocities and elastic constants of steels 304, 310, and 316. Met. Sci. 1980, 14, 595–596. [Google Scholar] [CrossRef]
  8. Teklu, A.; Ledbetter, H.; Kim, S.; Boatner, L.A.; McGuire, M.; Keppens, V. Single-crystal elastic constants of Fe-15Ni-15Cr alloy. Met. Mater. Trans. A 2004, 35, 3149–3154. [Google Scholar] [CrossRef]
  9. Dong, Z.; Schönecker, S.; Chen, D.; Li, W.; Long, M.; Vitos, L. Elastic properties of paramagnetic austenitic steel at finite temperature: Longitudinal spin fluctuations in multicomponent alloys. Phys. Rev. B 2017, 96, 174415. [Google Scholar] [CrossRef] [Green Version]
  10. Vitos, L. The EMTO Method and Applications, Computational Quantum Mechanics for Materials Engineers; Springer: London, UK, 2007. [Google Scholar]
  11. Vitos, L.; Korzhavyi, P.A.; Johansson, B. Elastic Property Maps of Austenitic Stainless Steels. Phys. Rev. Lett. 2002, 88, 155501. [Google Scholar] [CrossRef] [PubMed]
  12. Hohenberg, P.; Kohn, W. Inhomogeneous Electron Gas. Phys. Rev. 1964, 136, B864. [Google Scholar] [CrossRef]
  13. Kohn, W.; Sham, L.J.; Sham, L. Self-Consistent Equations Including Exchange and Correlation Effects. Phys. Rev. 1965, 140, A1133–A1138. [Google Scholar] [CrossRef] [Green Version]
  14. Perdew, J.P.; Burke, K.; Ernzerhof, M. Generalized gradient approximation made simple. Phys. Rev. Lett. 1996, 77, 3865–3868. [Google Scholar] [CrossRef]
  15. Andersen, O.K.; Jepsen, O.; Krier, G. Lectures on Methods of Electronic Structure Calculations; World Scientific Publishing: Singapore, 1994. [Google Scholar]
  16. Andersen, O.K.; Arcangeli, C.; Tank, R.W.; Saha-Dasgupta, T.; Krier, G.; Jepsen, O.; Dasgupta, I. Third-generation TB-LMTO. MRS Online Proc. Libr. Arch. 1998, 491. [Google Scholar] [CrossRef]
  17. Vitos, L.; Skriver, H.; Johansson, B.; Kollár, J. Application of the exact muffin-tin orbitals theory: The spherical cell approximation. Comput. Mater. Sci. 2000, 18, 24–38. [Google Scholar] [CrossRef]
  18. Vitos, L. Total-energy method based on the exact muffin-tin orbitals theory. Phys. Rev. B 2001, 64, 014107. [Google Scholar] [CrossRef]
  19. Vitos, L.; Abrikosov, I.A.; Johansson, B. Anisotropic Lattice Distortions in Random Alloys from First-Principles Theory. Phys. Rev. Lett. 2001, 87, 156401. [Google Scholar] [CrossRef] [PubMed]
  20. Soven, P. Coherent-Potential Model of Substitutional Disordered Alloys. Phys. Rev. 1967, 156, 809–813. [Google Scholar] [CrossRef]
  21. Györffy, B.L. Coherent-Potential Approximation for a Nonoverlapping-Muffin-Tin-Potential Model of Random Substitutional Alloys. Phys. Rev. B 1972, 5, 2382–2384. [Google Scholar] [CrossRef]
  22. Kollár, J.; Vitos, L.; Skriver, H.L. Electronic Structure and Physical Properties of Solids: The Uses of the LMTO Method; Lecture Notes in Physics; Springer: Berlin, Germany, 2000. [Google Scholar]
  23. Gyorffy, B.L.; Pindor, A.J.; Staunton, J.; Stocks, G.M.; Winter, H. A first-principles theory of ferromagnetic phase transitions in metals. J. Phys. F Met. Phys. 1985, 15, 1337–1386. [Google Scholar] [CrossRef]
  24. Zhang, H.L.; Al-Zoubi, N.; Johansson, B.; Vitos, L. Alloying effects on the elastic parameters of ferromagnetic and paramagnetic Fe from first-principles theory. J. Appl. Phys. 2011, 110, 073707. [Google Scholar] [CrossRef]
  25. Zhang, H.L.; Punkkinen, M.P.J.; Johansson, B.; Hertzman, S.; Vitos, L. Single-crystal elastic constants of ferromagnetic bcc Fe-based random alloys from first-principles theory. Phys. Rev. B 2010, 81, 184105. [Google Scholar] [CrossRef]
  26. Delczeg-Czirjak, E.K.; Delczeg, L.; Ropo, M.; Kokko, K.; Punkkinen, M.P.J.; Johansson, B.; Vitos, L. Ab initio study of the elastic anomalies in Pd-Ag alloys. Phys. Rev. B 2009, 79, 085107. [Google Scholar] [CrossRef]
  27. Al-Zoubi, N.; Johansson, B.; Nilson, G.; Vitos, L. The Bain path of paramagnetic Fe-Cr based alloys. J. Appl. Phys. 2011, 110, 013708. [Google Scholar] [CrossRef]
  28. Al-Zoubi, N.; Skorodumova, N.V.; Medvedeva, A.; Andersson, J.; Nilson, G.; Johansson, B.; Vitos, L. Tetragonality of carbon-doped ferromagnetic iron alloys: A first-principles study. Phys. Rev. B 2012, 85, 014112. [Google Scholar] [CrossRef]
  29. Al-Zoubi, N.; Li, X.; Schönecker, S.; Johansson, B.; Vitos, L. Influence of manganese on the bulk properties of Fe-Cr-Mn alloys: A first-principles study. Phys. Scr. 2014, 89, 125702. [Google Scholar] [CrossRef]
  30. Al-Zoubi, N.; Schönecker, S.; Johansson, B.; Vitos, L. Assessing the Exact Muffin-Tin Orbitals method for the Bain path of metals. Philos. Mag. 2017, 97, 1243–1264. [Google Scholar] [CrossRef]
  31. Al-Zoubi, N. First-principles study of the structural and elastic properties of AuxV1–x and AuxNb1–x alloys. Philos. Mag. 2018, 98, 1099–1113. [Google Scholar] [CrossRef]
  32. Hill, R. The Elastic Behavior of a Crystalline Aggregate. Proc. Phys. Soc. Sect. A 1952, 65, 349. [Google Scholar] [CrossRef]
  33. Voigt, W. Elasticitatsconstunten isotroper Korper. Ann. Phys. 1889, 38, 573. [Google Scholar] [CrossRef]
  34. Reuss, A.; Angew, Z. Berechnung der Fliehgrenze von Mischkristallen auf Grund der Plastizittitsbedingung fiir Einkristalle. Math. Phys. 1929, 9, 49–58. [Google Scholar]
  35. Korzhavyi, P.A.; Ruban, A.V.; Abrikosov, I.A.; Skriver, H.L.; Korzhavyi, P. Madelung energy for random metallic alloys in the coherent potential approximation. Phys. Rev. B 1995, 51, 5773–5780. [Google Scholar] [CrossRef] [Green Version]
  36. Moruzzi, V.L.; Janak, J.F.; Schwarz, K. Calculated thermal properties of metals. Phys. Rev. B 1988, 37, 790–799. [Google Scholar] [CrossRef]
  37. Dyson, D.J.; Holmes, B. Effect of alloying additions on the lattice parameter of Austenite. J. Iron Steel Inst. 1970, 208, 469–474. [Google Scholar]
  38. Bain, E.C.; Dunkirk, N.Y. The nature of martensite. Trans. Am. Inst. Min. Metall. Eng. 1924, 70, 25. [Google Scholar]
  39. Söderlind, P.; Eriksson, O.; Wills, J.M.; Boring, A.M. Theory of elastic constants of cubic transition metals and alloys. Phys. Rev. B 1993, 48, 5844–5851. [Google Scholar] [CrossRef] [PubMed]
  40. Söderlind, P.; Wills, J.M.; Boring, A.M.; Eriksson, O. Trends of the elastic constants of cubic transition metals. Phys. Rev. Lett. 1992, 68, 2802–2805. [Google Scholar]
  41. Craievich, P.J.; Sanchez, J.M.; Watson, R.E.; Weinert, M. Structural instabilities of excited phases. Phys. Rev. B 1997, 55, 787–797. [Google Scholar] [CrossRef]
  42. Craievich, P.J.; Weinert, M.; Sanchez, J.M.; Watson, R.E. Local stability of nonequilibrium phases. Phys. Rev. Lett. 1994, 72, 3076–3079. [Google Scholar] [CrossRef] [PubMed]
  43. Grimvall, G.; Magyari-Köpe, B.; Ozolins, V.; Persson, K.A. Lattice instabilities in metallic elements. Rev. Mod. Phys. 2012, 84, 945–986. [Google Scholar] [CrossRef] [Green Version]
  44. Al-Zoubi, N.; Schönecker, S.; Li, X.; Li, W.; Johansson, B.; Vitos, L. Elastic properties of 4d transition metal alloys: Values and trends. Comput. Mater. Sci. 2019, 159, 273–280. [Google Scholar] [CrossRef]
  45. Kollár, J.; Vitos, L.; Johansson, B.; Skriver, H. Metal Surfaces: Surface, Step and Kink Formation Energies. Phys. Status Solidi B 2000, 217, 405–418. [Google Scholar] [CrossRef]
  46. Brooks, M.S.S.; Johansson, B. Exchange integral matrices and cohesive energies of transition metal atoms. J. Phys. F Met. Phys. 1983, 13, L197–L202. [Google Scholar] [CrossRef]
  47. Vitos, L.; Korzhavyi, P.A.; Johansson, B. Stainless steel optimization from quantum mechanical calculations. Nat. Mater. 2003, 2, 25–28. [Google Scholar] [CrossRef] [PubMed]
  48. Pugh, S.F. XCII. Relations between elastic moduli and plastic properties of polycrystalline pure metals. Philos. Mag. 1954, 45, 823–843. [Google Scholar] [CrossRef]
Figure 1. (a) Total energy change (Equation (1)) as a function of orthorhombic deformation δo of the fcc structure of a paramagnetic Fe0.59Cr0.2Ni0.2Al0.01 alloy. (b) Total energy change (Equation (2)) as a function of the monoclinic deformation δm of the fcc structure of a paramagnetic Fe0.59Cr0.2Ni0.2Al0.01 alloy. The red curves in (a) and (b) represent the polynomial fit of the total energy change. (c) The standard error in C′ and (d) the standard error in C44 of Fe0.6−xCr0.2Ni0.2Alx(x = 0.01, 0.02, 0.03, 0.04) alloys as a function of x.
Metals 09 00792 g001
Figure 2. Changes in the equilibrium lattice parameters (a(x)), based on Equation (7), of paramagnetic fcc Fe0.6−xCr0.2Ni0.2Mx (where M = Al, Co, Cu, Mo, Nb, Ti, V, and W; 0 x 0.08 ) quaternary alloys relative to the paramagnetic fcc Fe0.6Cr0.2Ni0.2 ternary alloy as a function of atomic concentration x.
Metals 09 00792 g002
Figure 3. Theoretical changes in single-crystal elastic constants (a) ΔC11(x), (b) ΔC12(x), (c) ΔC′(x), and (d) ΔC44(x) of paramagnetic fcc Fe0.6−xCr0.2Ni0.2Mx (M = Al, Co, Cu, Mo, Nb, Ti, V, and W; 0 x 0.08 ) quaternary alloys relative to the paramagnetic fcc Fe0.6Cr0.2Ni0.2 ternary alloy as a function of atomic concentration x.
Metals 09 00792 g003
Figure 4. (a) Calculated fcc (solid symbols) and bcc (open symbols) tetragonal shear constant C′ values and (b) the calculated total energy difference ΔEE = EbccEfcc) between the bcc and fcc structures of paramagnetic Fe0.6−xCr0.2Ni0.2Mx (M = Al, Co, Cu, Mo, Nb, Ti, V, and W; 0 x 0.08 ) quaternary alloys as a function of atomic concentration x.
Metals 09 00792 g004
Figure 5. Theoretical changes in polycrystalline elastic constants (a) ΔB(x), (b) ΔG(x), and (c) ΔE(x) of paramagnetic fcc Fe0.6−xCr0.2Ni0.2Mx (M = Al, Co, Cu, Mo, Nb, Ti, V, and W; 0 x 0.08 ) quaternary alloys relative to those of the paramagnetic fcc Fe0.6Cr0.2Ni0.2 ternary alloy, and (d) the B/G ratio as a function of atomic concentration x.
Metals 09 00792 g005
Figure 6. Theoretical Poisson’s ratio ν(x) of paramagnetic fcc Fe0.6−xCr0.2Ni0.2Mx (M = Al, Co, Cu, Mo, Nb, Ti, V, and W; 0 x 0.08 ) quaternary alloys as a function of the atomic concentration x.
Metals 09 00792 g006
Table 1. Theoretical (exact muffin-tin orbitals, EMTO) and experimental (Exp) [8] elastic constants (in GPa) for paramagnetic fcc Fe–Cr–Ni alloys. B/G and ν are dimensionless. In the last row, we present the percentage error between the experimental and theoretical elastic constants.
SystemC11C12CC44BEGB/Gν
Fe0.6Cr0.2Ni0.2 (EMTO)17712426.613114218170.12.030.288
Fe0.62Cr0.19Ni0.19 (Exp)20413335.512615719977.22.030.289
Percentage error (%)13.26.825.13.99.49.29.20.270.17
Table 2. Theoretical (EMTO) single-crystal elastic constants (in GPa) for paramagnetic fcc Fe–20Cr–20Ni–x%M (M = Al, Co, Cu, Mo, Nb, Ti, V, and W; 0 x 8 , where x is in atom %) alloys calculated at their lattice parameter aexp (in Å) estimated from Equation (7).
SystemaexpC11C12CC44
Fe–20Cr–20Ni3.58317712426.6131
Fe–20Cr–20Ni–1.0Al3.58817612525.4130
Fe–20Cr–20Ni–2.0Al3.59117612724.6129
Fe–20Cr–20Ni–3.0Al3.59317612923.2129
Fe–20Cr–20Ni–4.0Al3.59617713122.8128
Fe–20Cr–20Ni–2.0Co3.57718312528.7136
Fe–20Cr–20Ni–4.0Co3.56919012830.8140
Fe–20Cr–20Ni–6.0Co3.56119713132.7145
Fe–20Cr–20Ni–8.0Co3.55320413434.9149
Fe–20Cr–20Ni–0.5Cu3.58617712426.5130
Fe–20Cr–20Ni–1.0Cu3.58617712526.1130
Fe–20Cr–20Ni–1.5Cu3.58717812625.9129
Fe–20Cr–20Ni–2.0Cu3.58817812725.6129
Fe–20Cr–20Ni–0.5Mo3.58818112826.3130
Fe–20Cr–20Ni–1.0Mo3.59018112925.9130
Fe–20Cr–20Ni–1.5Mo3.59318113025.4130
Fe–20Cr–20Ni–2.0Mo3.59618013025.0130
Fe–20Cr–20Ni–0.5Nb3.58917612425.9130
Fe–20Cr–20Ni–1.0Nb3.59317612624.8129
Fe–20Cr–20Ni–1.5Nb3.59717512724.0128
Fe–20Cr–20Ni–2.0Nb3.60117612923.2127
Fe–20Cr–20Ni–0.5Ti3.58717712625.8130
Fe–20Cr–20Ni–1.0Ti3.58817612624.9129
Fe–20Cr–20Ni–1.5Ti3.59017712824.2128
Fe–20Cr–20Ni–2.0Ti3.59117612923.4128
Fe–20Cr–20Ni–1.0V3.58717612425.8130
Fe–20Cr–20Ni–2.0V3.58817712724.8129
Fe–20Cr–20Ni–3.0V3.59017712824.0128
Fe–20Cr–20Ni–4.0V3.59217713023.5127
Fe–20Cr–20Ni–0.5W3.58817912626.3131
Fe–20Cr–20Ni–1.0W3.59118112926.0131
Fe–20Cr–20Ni–1.5W3.59418213125.5131
Fe–20Cr–20Ni–2.0W3.59618413425.0131
Table 3. Theoretical (EMTO) polycrystalline elastic constants B, G, and E (in GPa); Poisson’s ratio ν; and B/G ratio for paramagnetic fcc Fe–20Cr–20Ni–x%M (M = Al, Co, Cu, Mo, Nb, Ti, V, and W; 0 x 8 , where x is in atom %) calculated at their experimental lattice parameter aexp [37] (in Å).
SystemaexpBGB/GEν
Fe–20Cr–20Ni3.58314270.12.031810.288
Fe–20Cr–20Ni–1.0Al3.58814268.62.061770.292
Fe–20Cr–20Ni–2.0Al3.59114367.62.121750.296
Fe–20Cr–20Ni–3.0Al3.59314566.02.191720.302
Fe–20Cr–20Ni–4.0Al3.59614665.42.241710.305
Fe–20Cr–20Ni–2.0Co3.57714573.71.961890.282
Fe–20Cr–20Ni–4.0Co3.56914977.11.931970.279
Fe–20Cr–20Ni–6.0Co3.56115380.51.902060.276
Fe–20Cr–20Ni–8.0Co3.55315784.11.872140.273
Fe–20Cr–20Ni–0.5Cu3.58614169.82.031800.288
Fe–20Cr–20Ni–1.0Cu3.58614269.32.051790.290
Fe–20Cr–20Ni–1.5Cu3.58714368.92.071780.292
Fe–20Cr–20Ni–2.0Cu3.58814468.52.101770.295
Fe–20Cr–20Ni–0.5Mo3.58814669.62.101800.294
Fe–20Cr–20Ni–1.0Mo3.59014769.22.121800.296
Fe–20Cr–20Ni–1.5Mo3.59314768.62.141780.298
Fe–20Cr–20Ni–2.0Mo3.59614768.22.151770.299
Fe–20Cr–20Ni–0.5Nb3.58914169.02.041780.290
Fe–20Cr–20Ni–1.0Nb3.59314367.72.101750.295
Fe–20Cr–20Ni–1.5Nb3.59714366.52.161730.299
Fe–20Cr–20Ni–2.0Nb3.60114565.42.221710.304
Fe–20Cr–20Ni–0.5Ti3.58714369.12.071780.292
Fe–20Cr–20Ni–1.0Ti3.58814268.02.091760.294
Fe–20Cr–20Ni–1.5Ti3.59014466.92.161740.299
Fe–20Cr–20Ni–2.0Ti3.59114565.92.201720.303
Fe–20Cr–20Ni–1.0V3.58714269.02.051780.290
Fe–20Cr–20Ni–2.0V3.58814467.82.121760.297
Fe–20Cr–20Ni–3.0V3.59014566.62.181730.301
Fe–20Cr–20Ni–4.0V3.59214665.82.221720.304
Fe–20Cr–20Ni–0.5W3.58814469.72.061800.291
Fe–20Cr–20Ni–1.0W3.59114669.62.101800.295
Fe–20Cr–20Ni–1.5W3.59414869.12.151790.298
Fe–20Cr–20Ni–2.0W3.59615168.72.201790.302

