Cast Structure in Alloy A286, an Iron-Nickel Based Superalloy
Abstract
1. Introduction
2. Materials and Methods
2.1. Metallographic Studies
2.2. Secondary Dendrite Arm Spacing
2.3. Segregation
3. Results
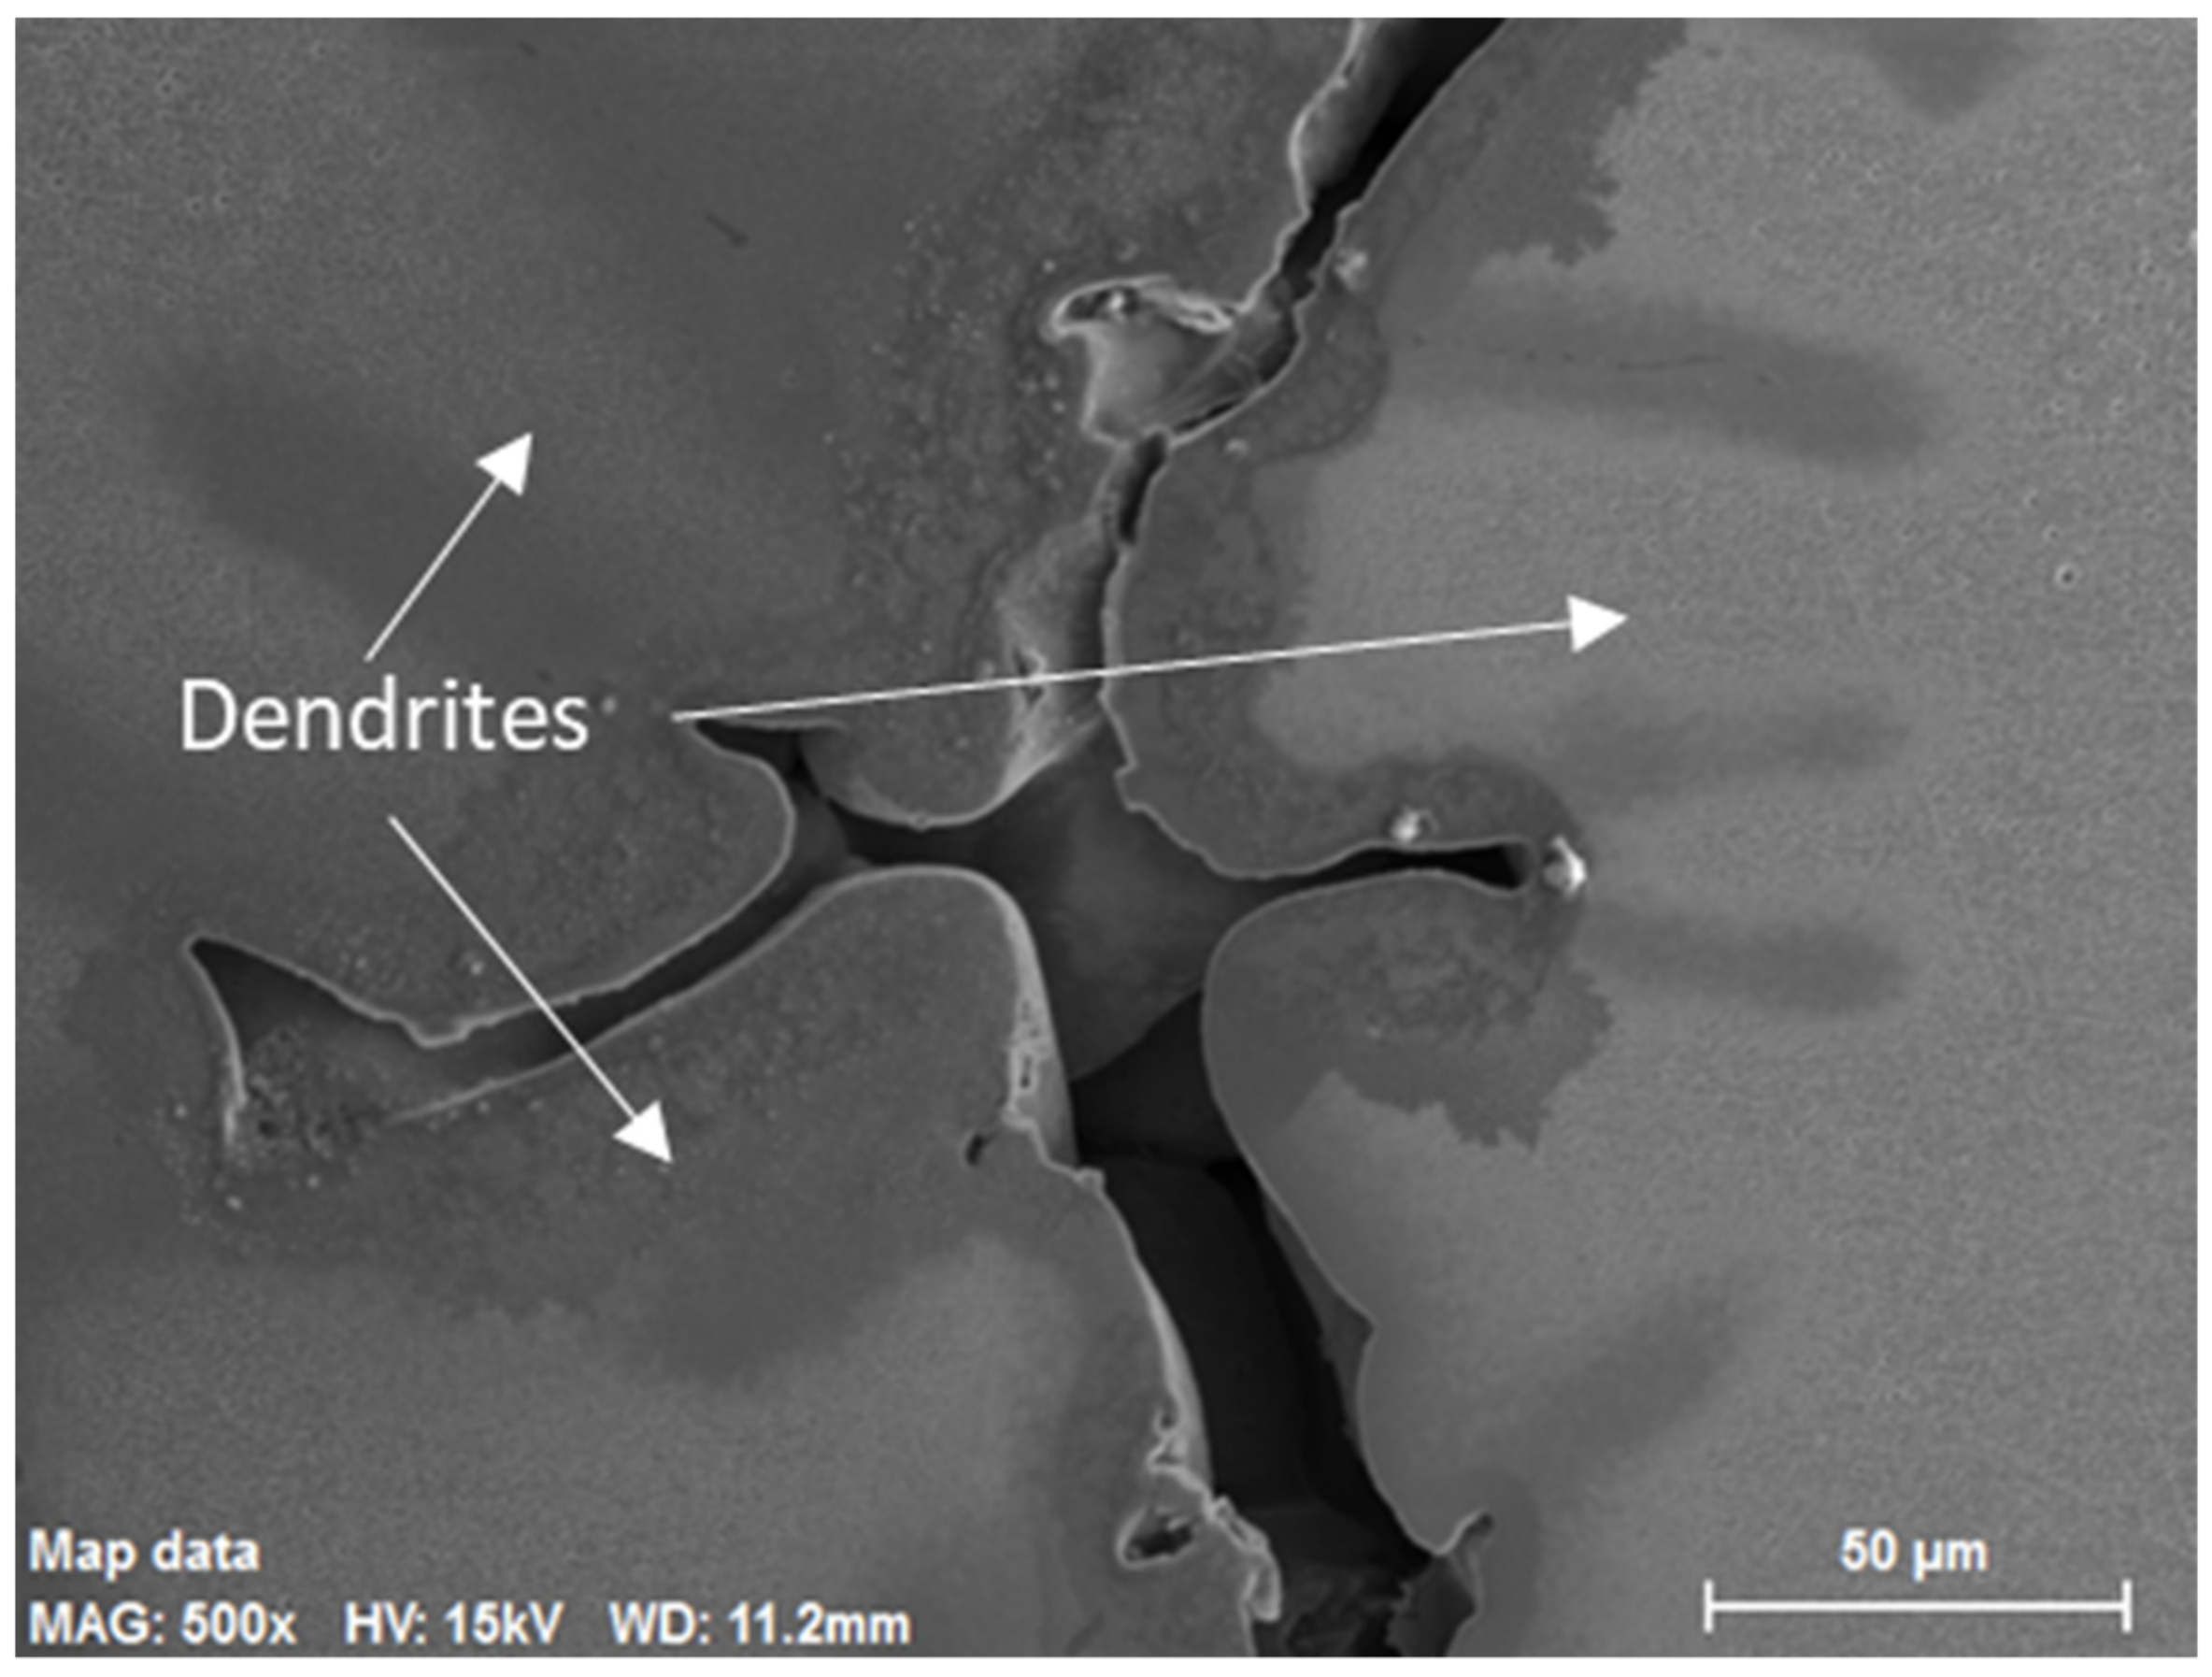
3.1. Structure
3.2. Dendrite Arm Spacing
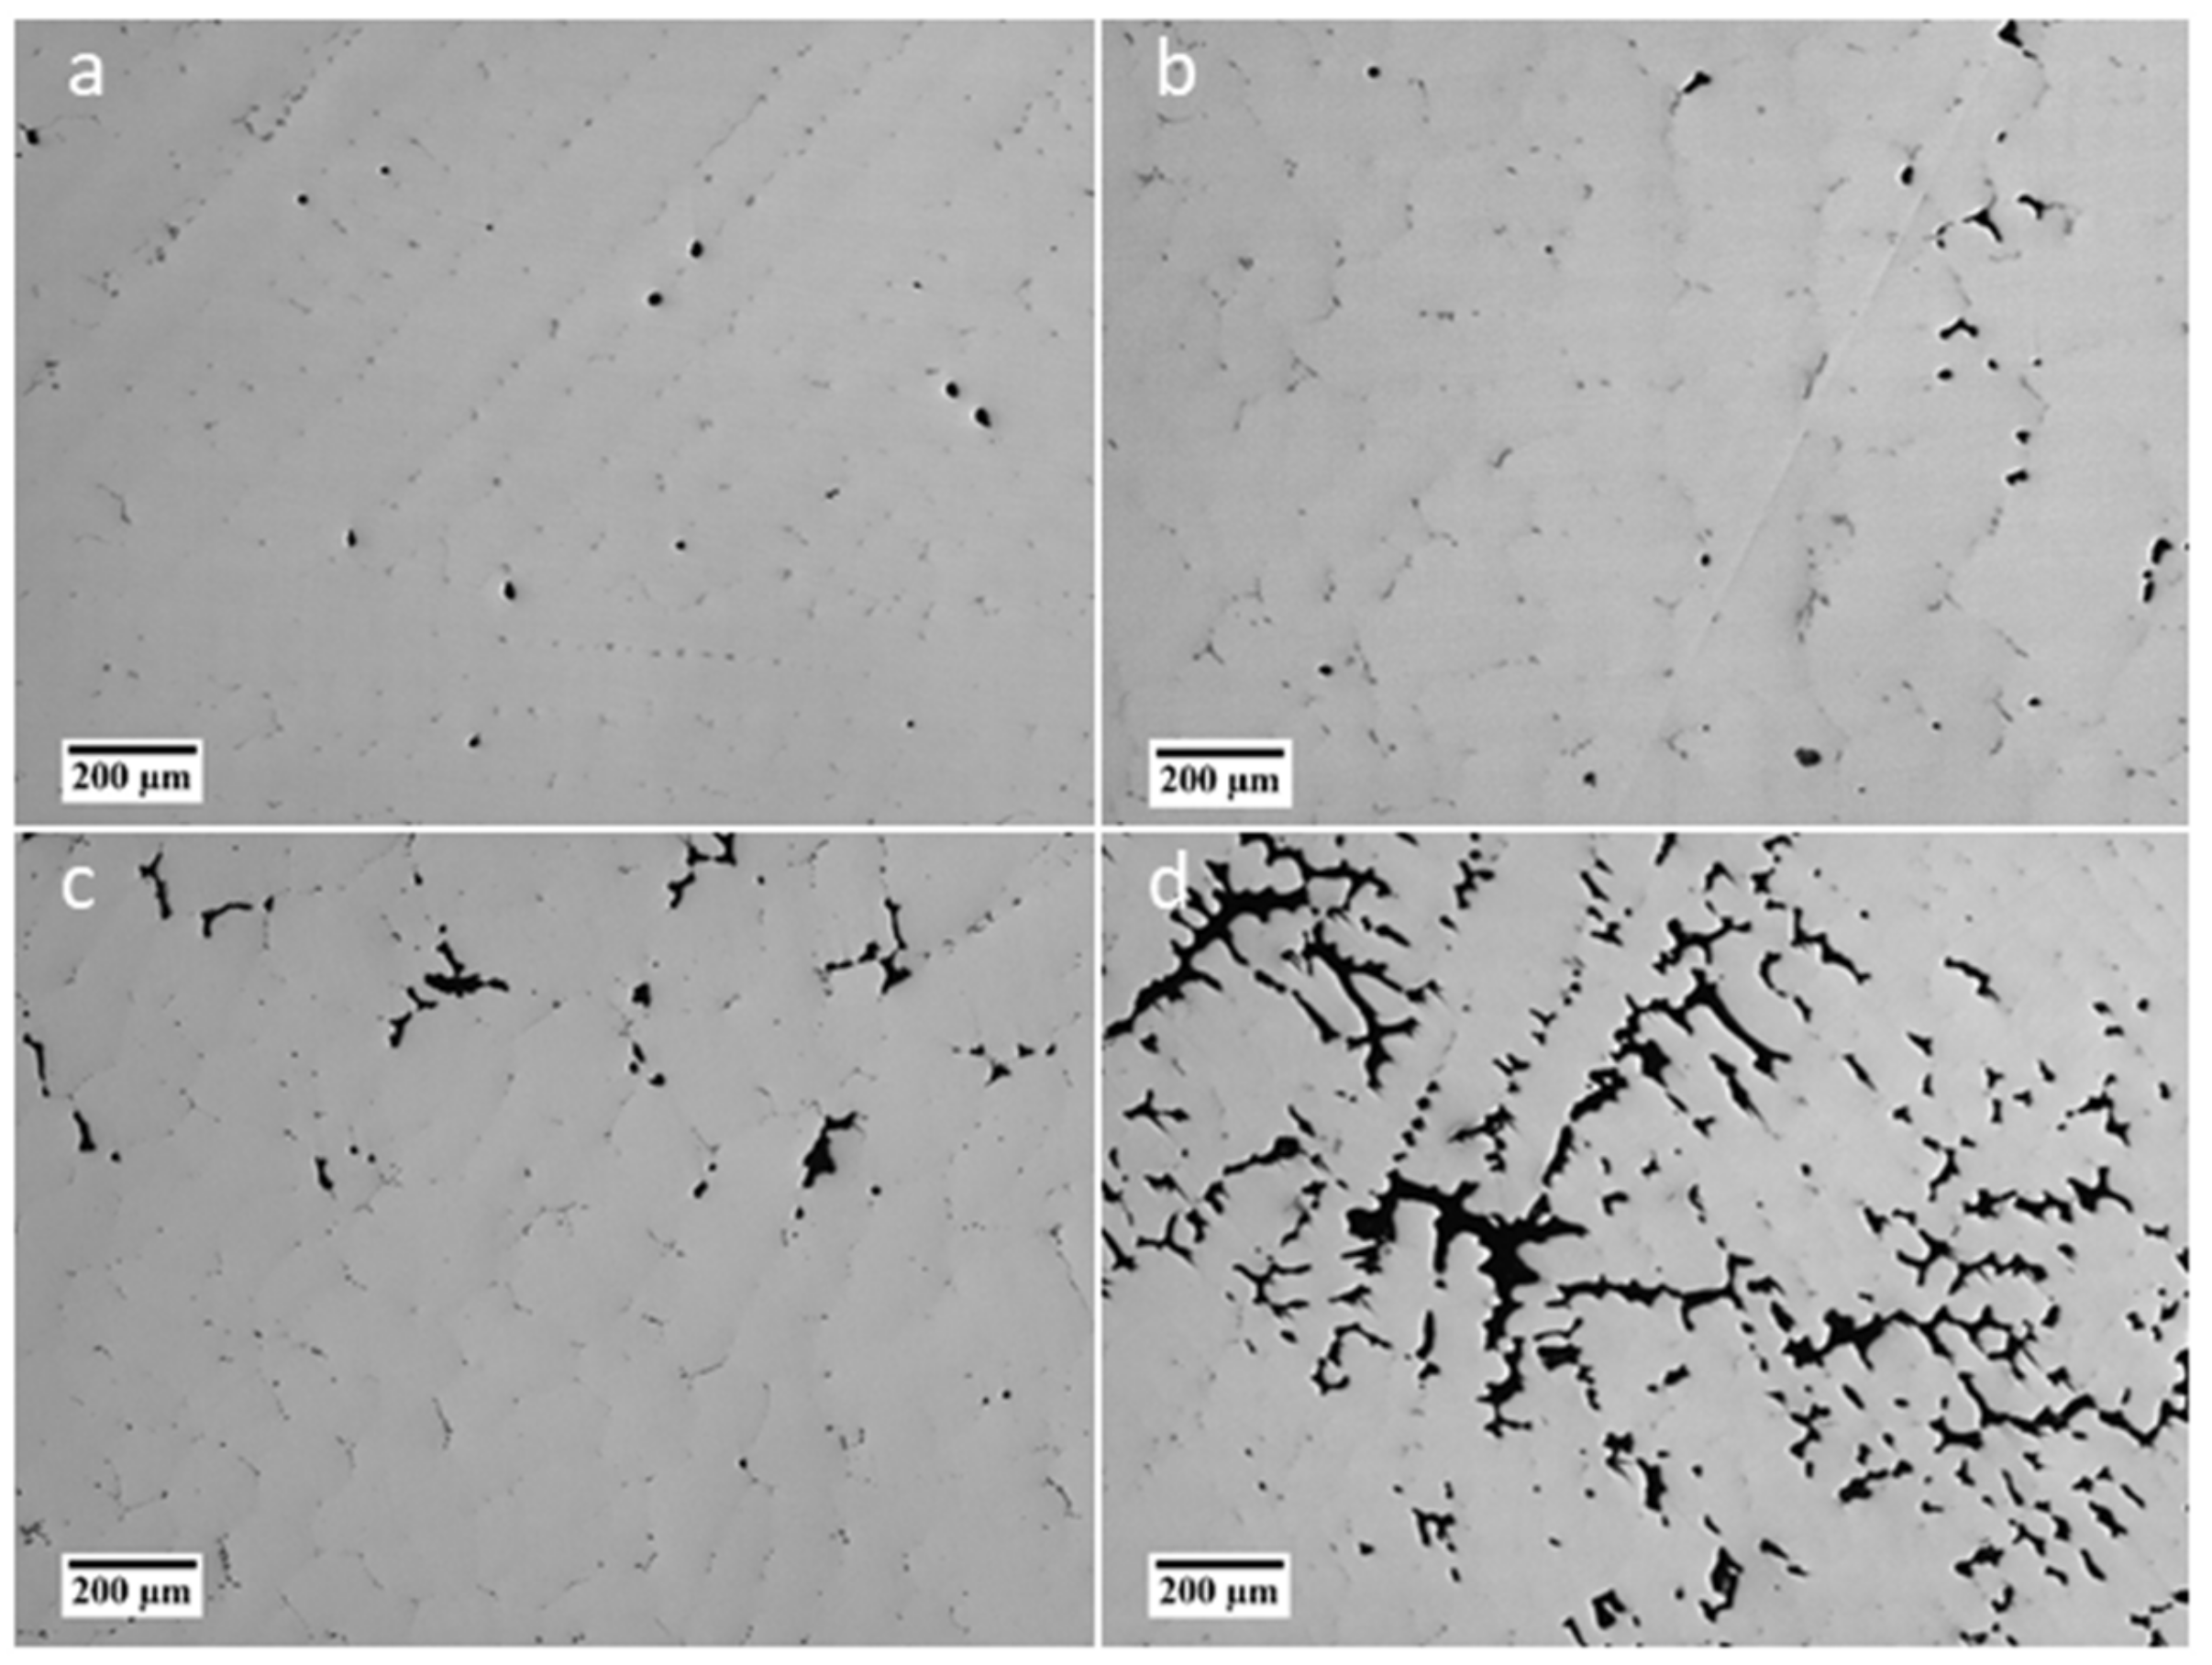
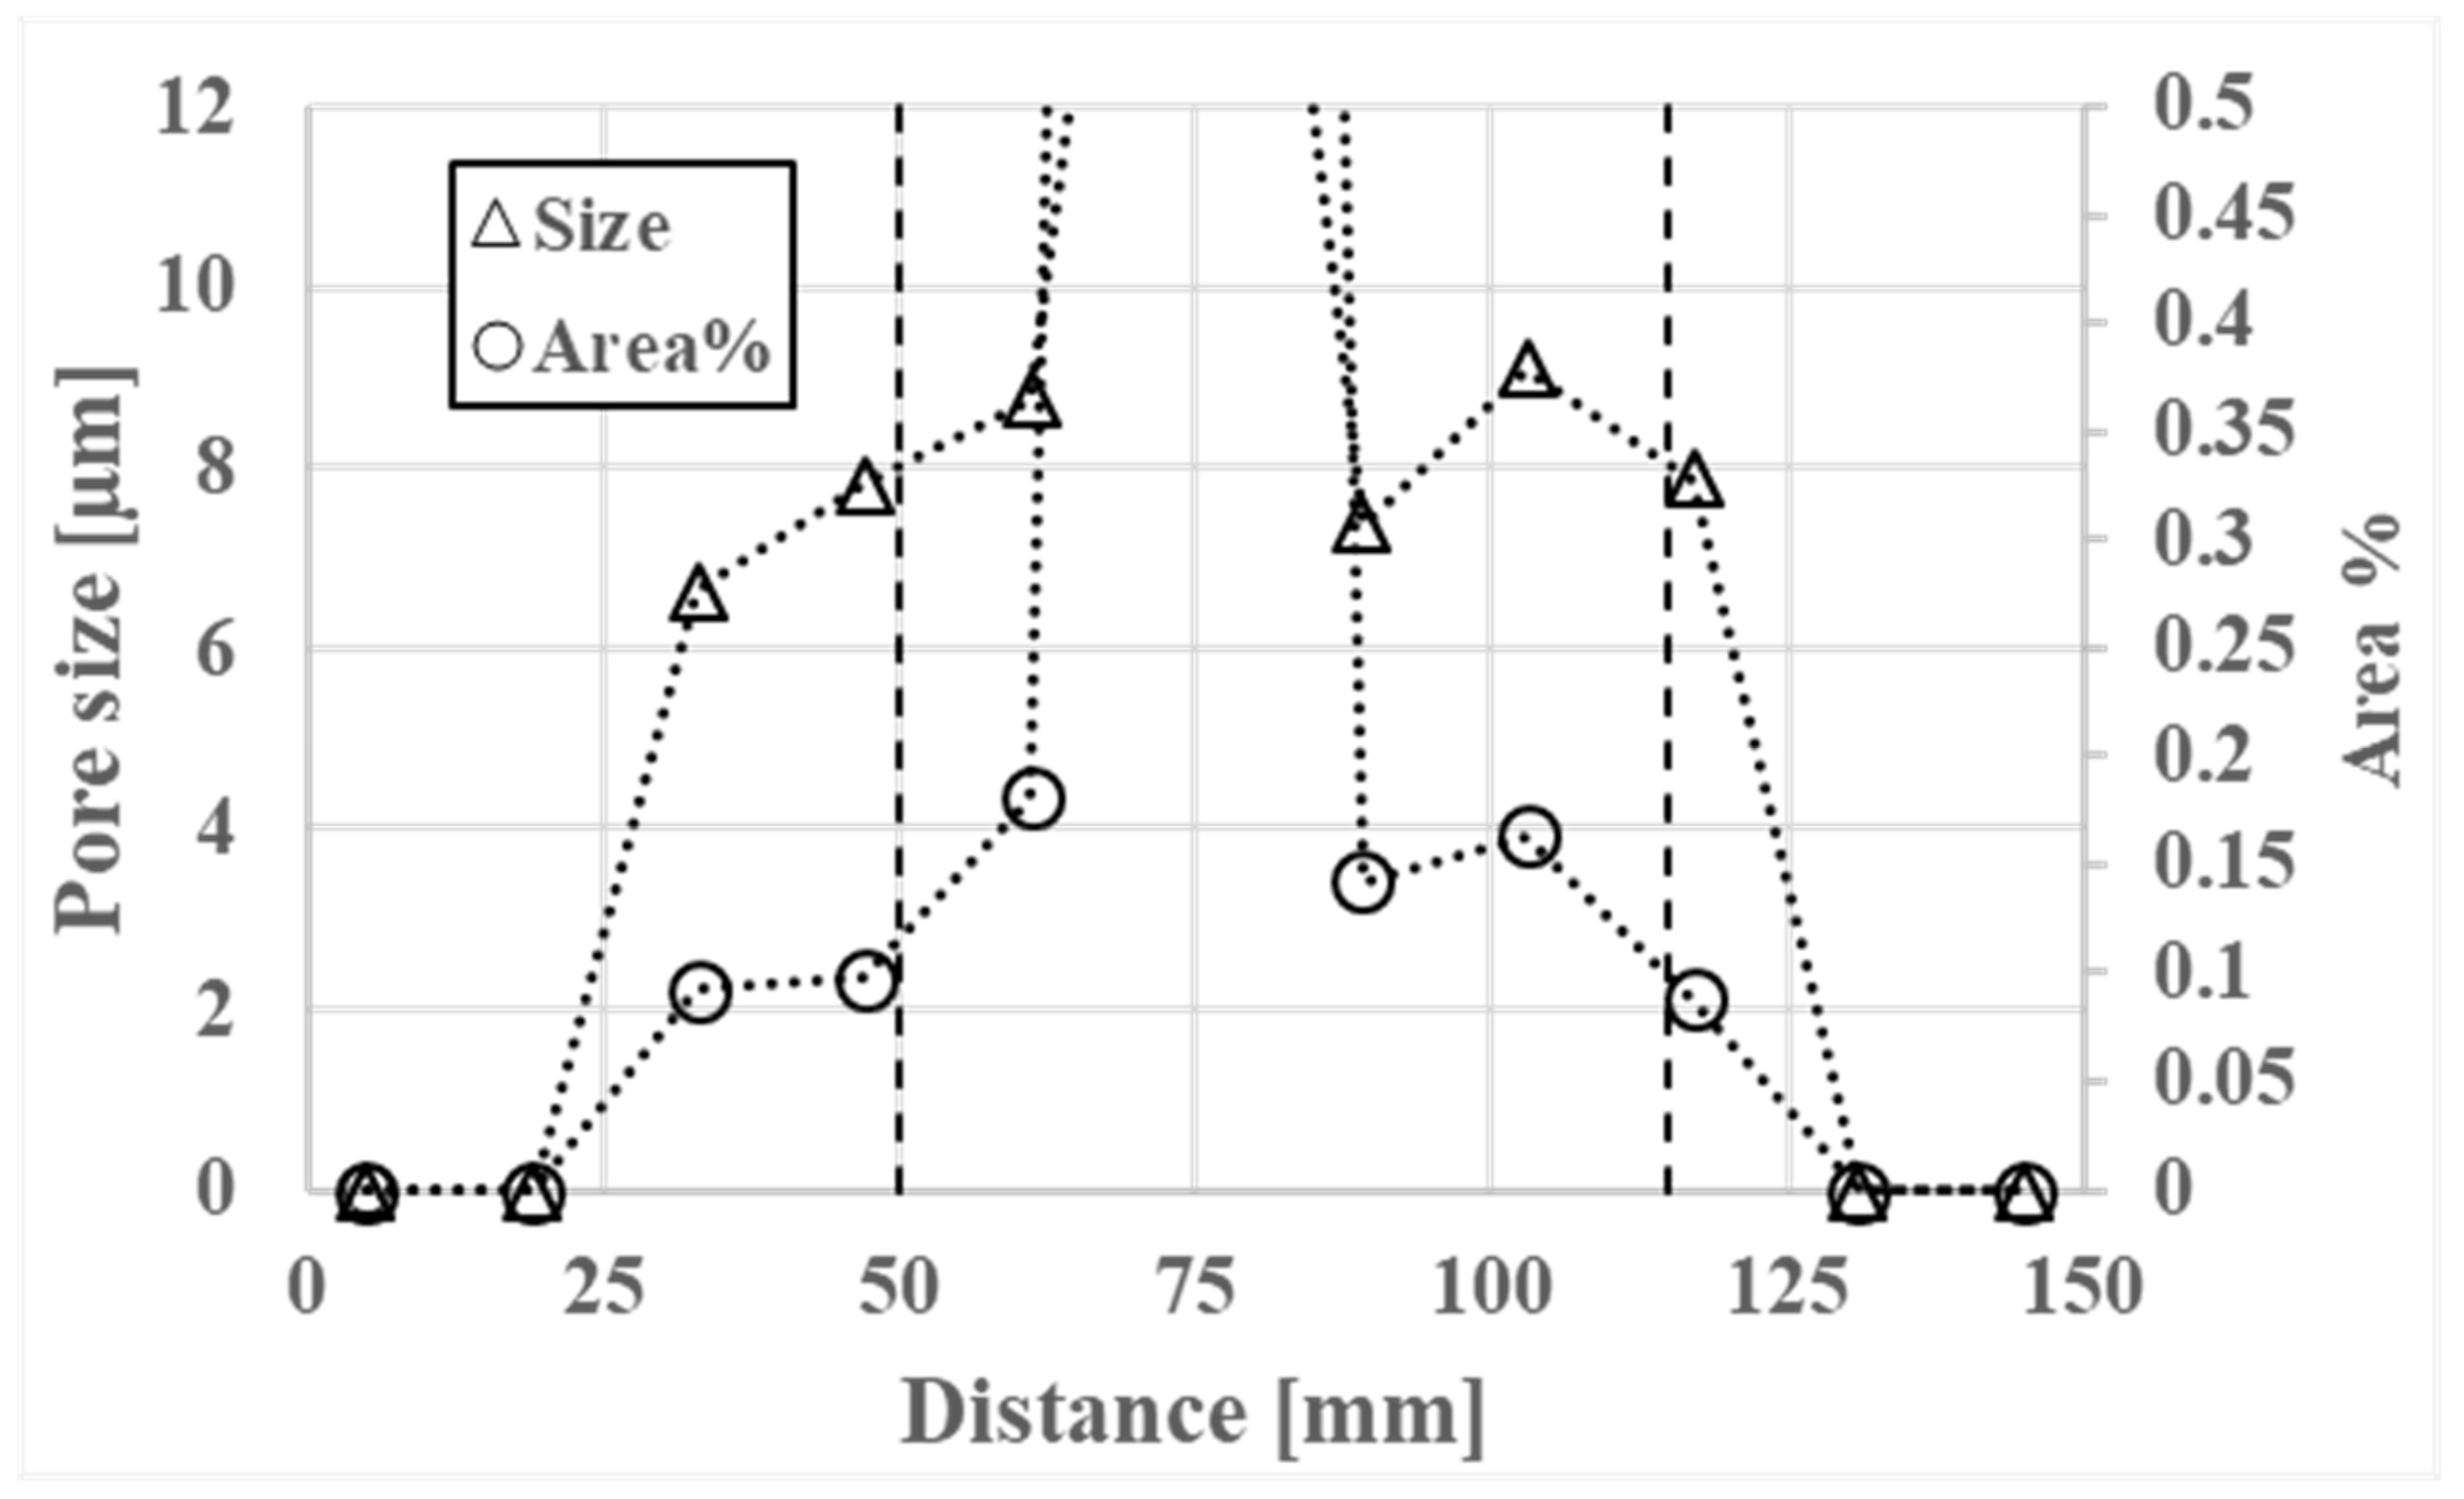
3.3. Porosity
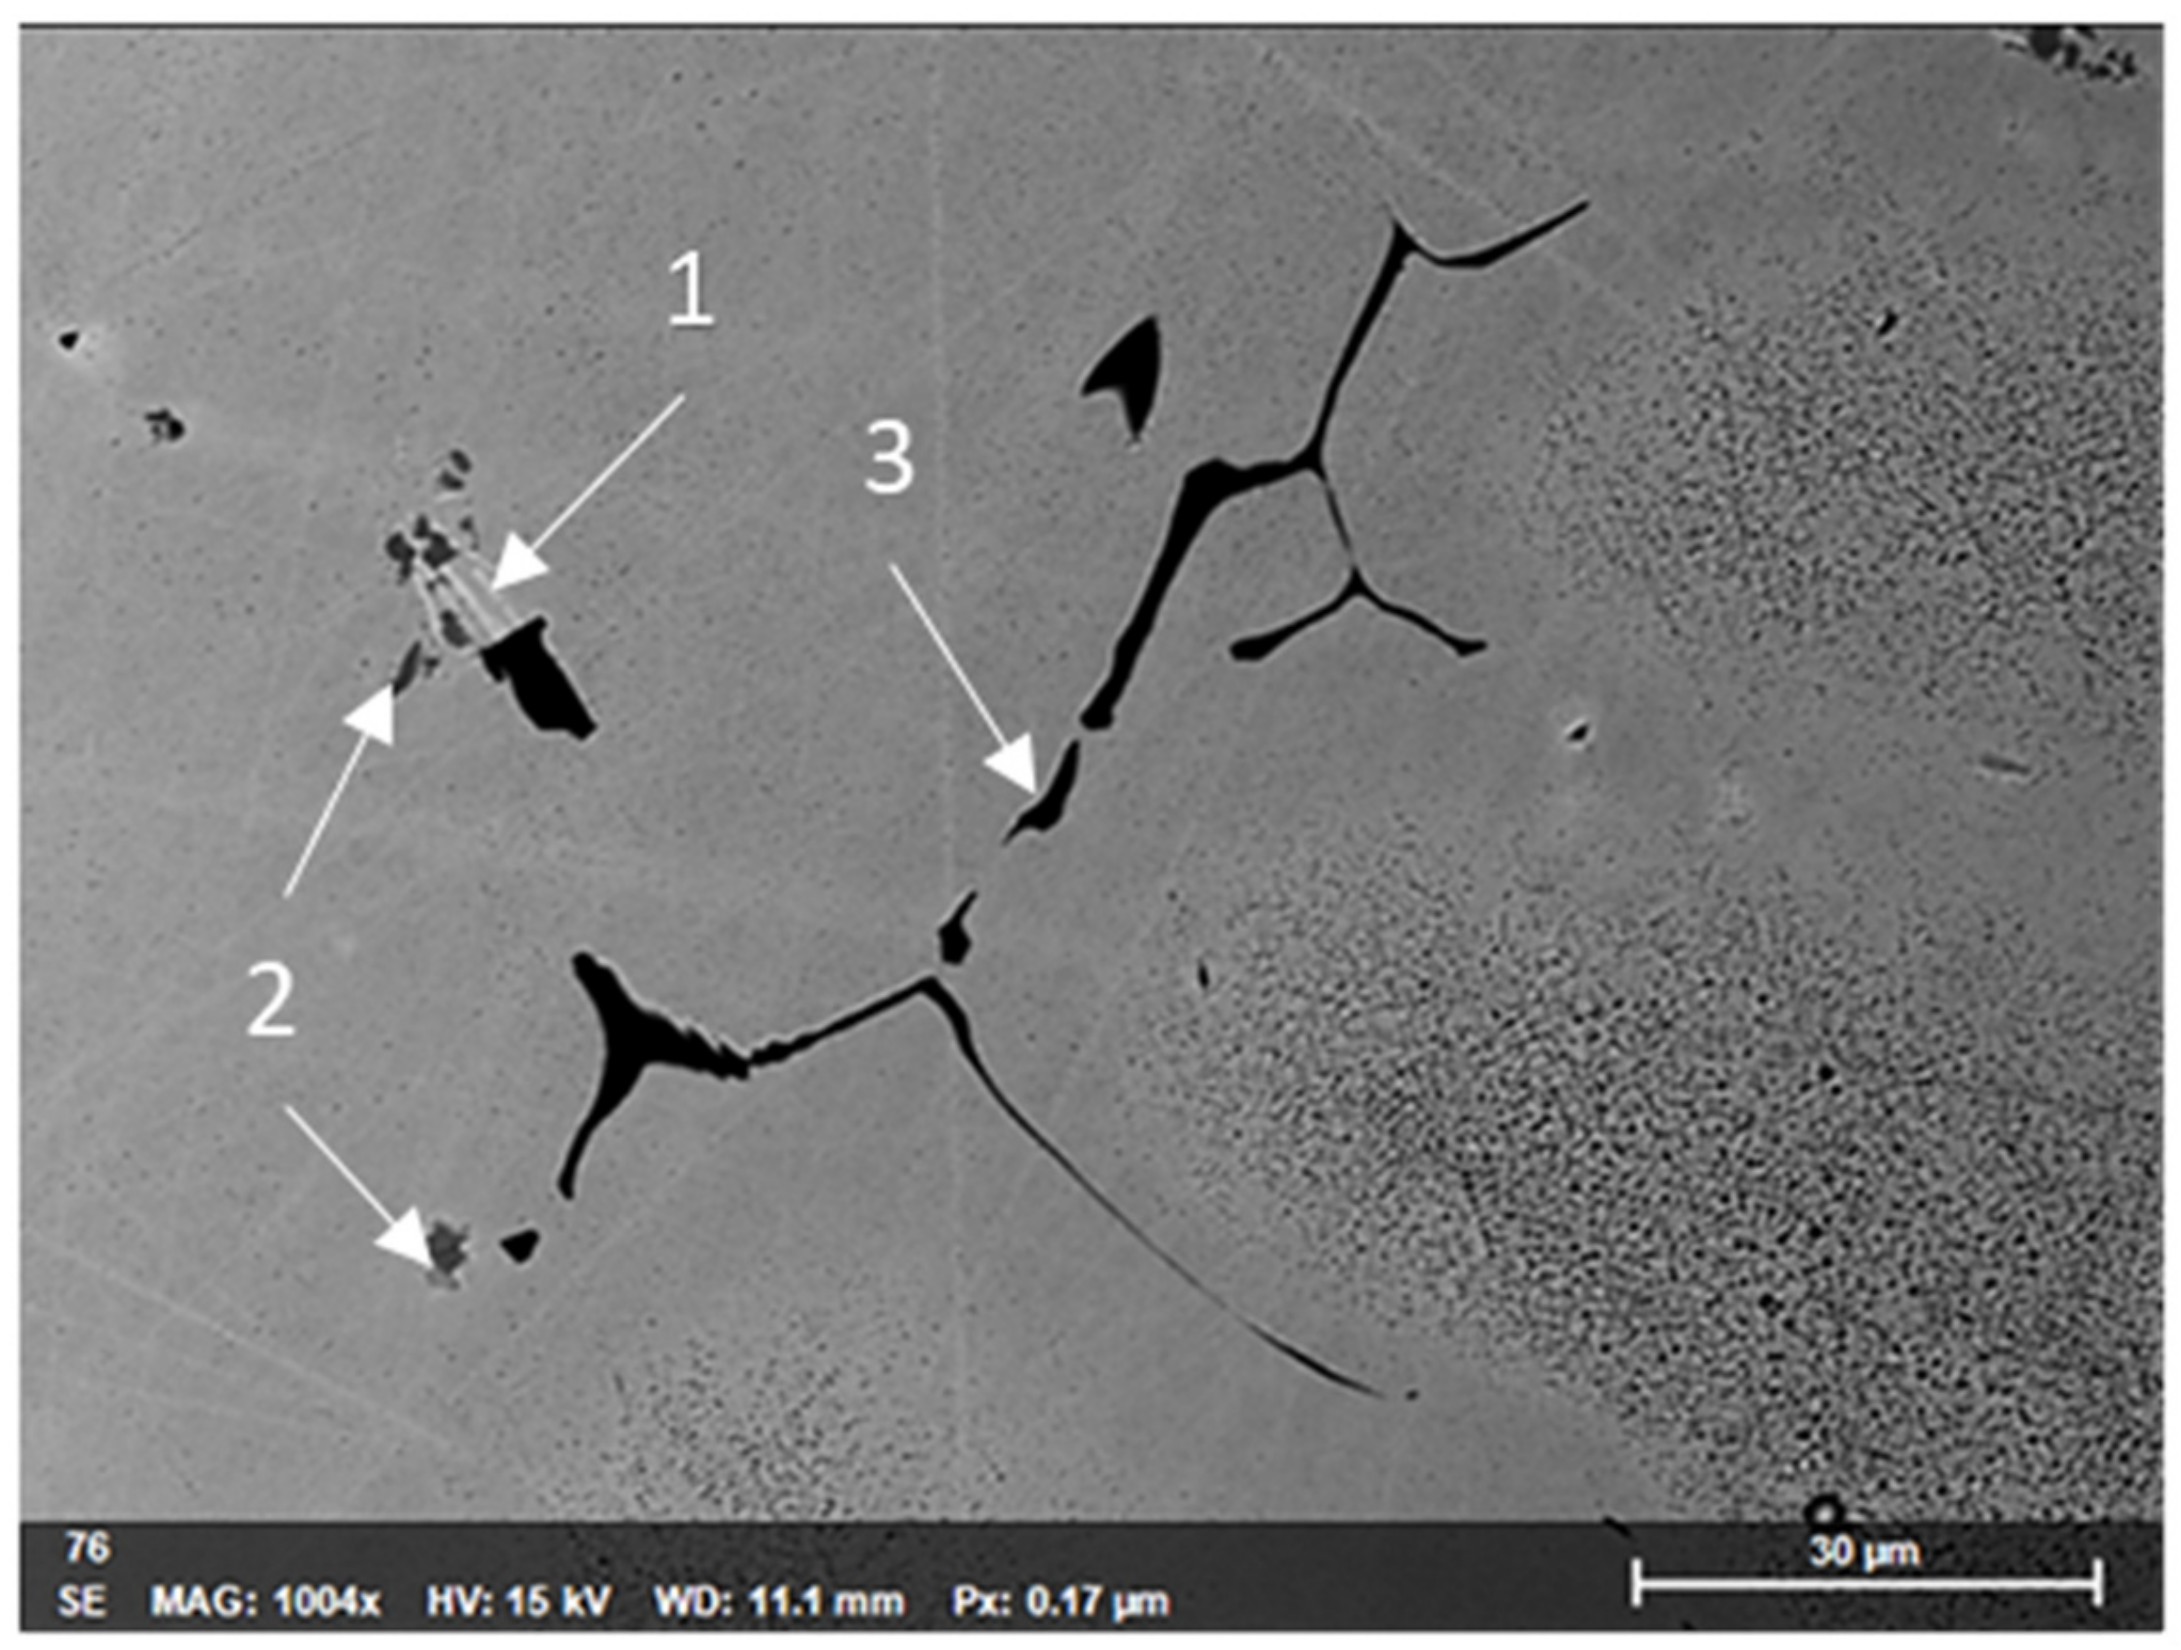
3.4. Precipitates of Intermetallic Phases, Carbides, and Non-Metallic Inclusions
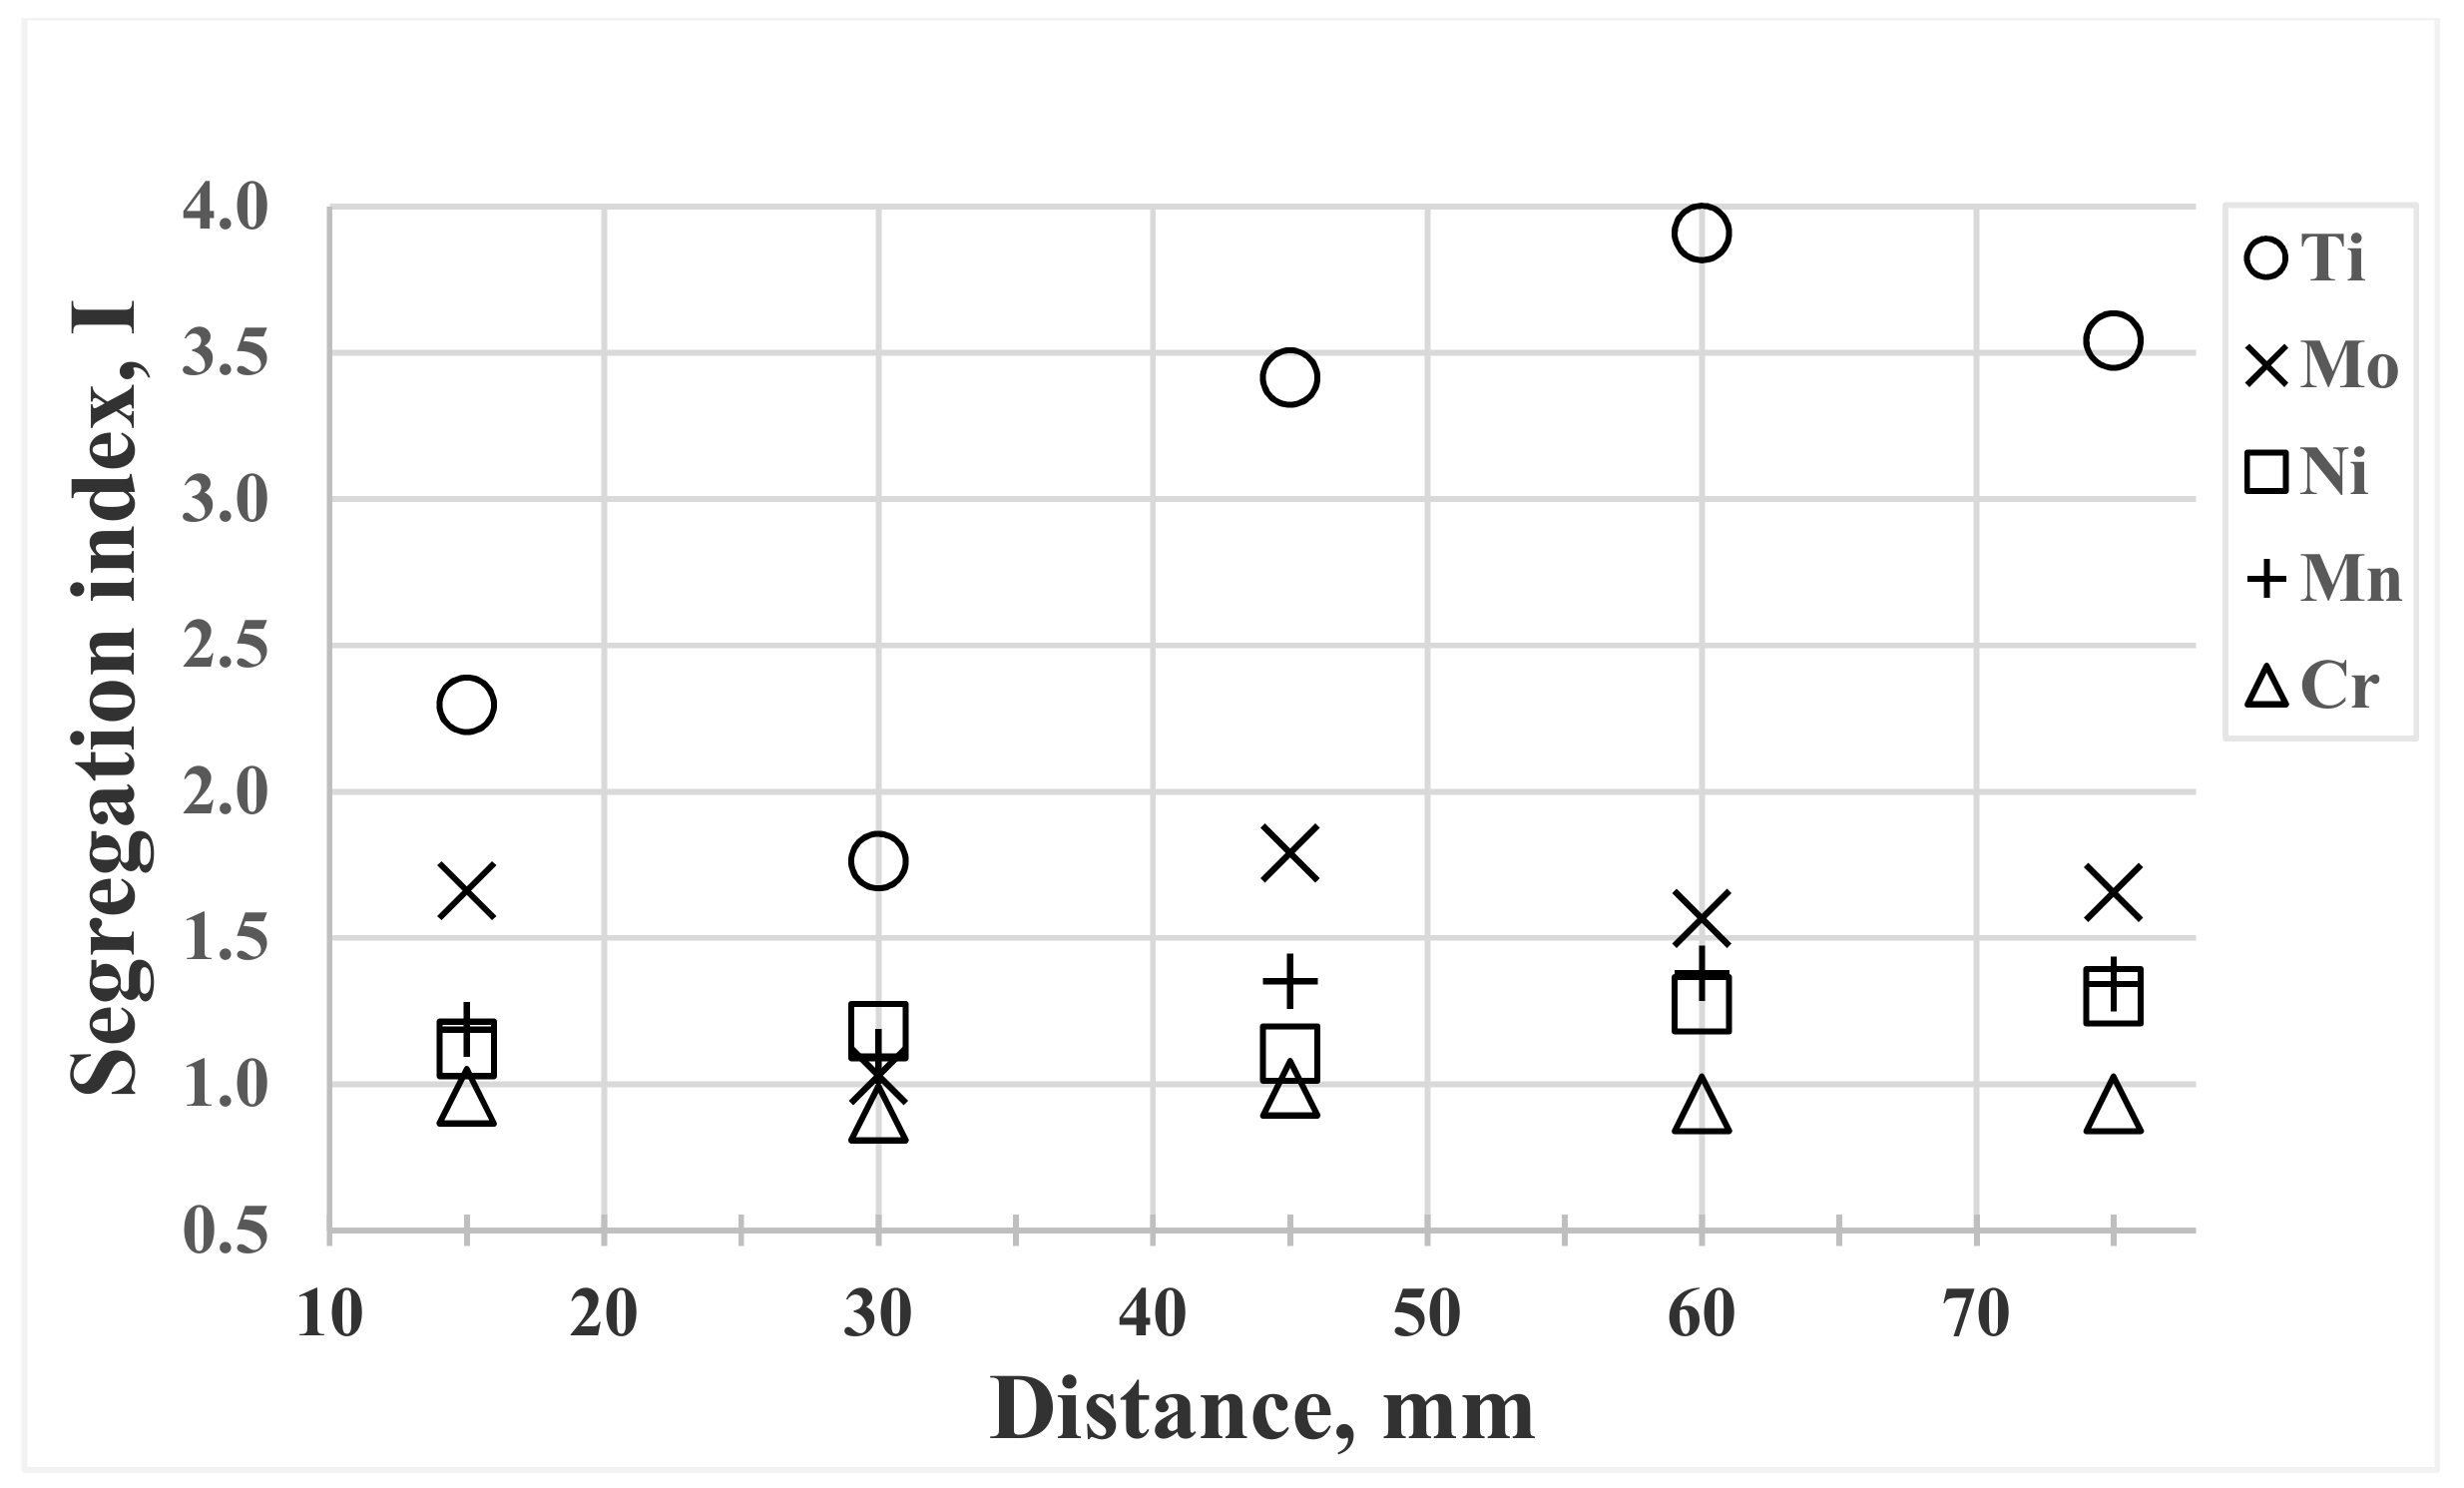
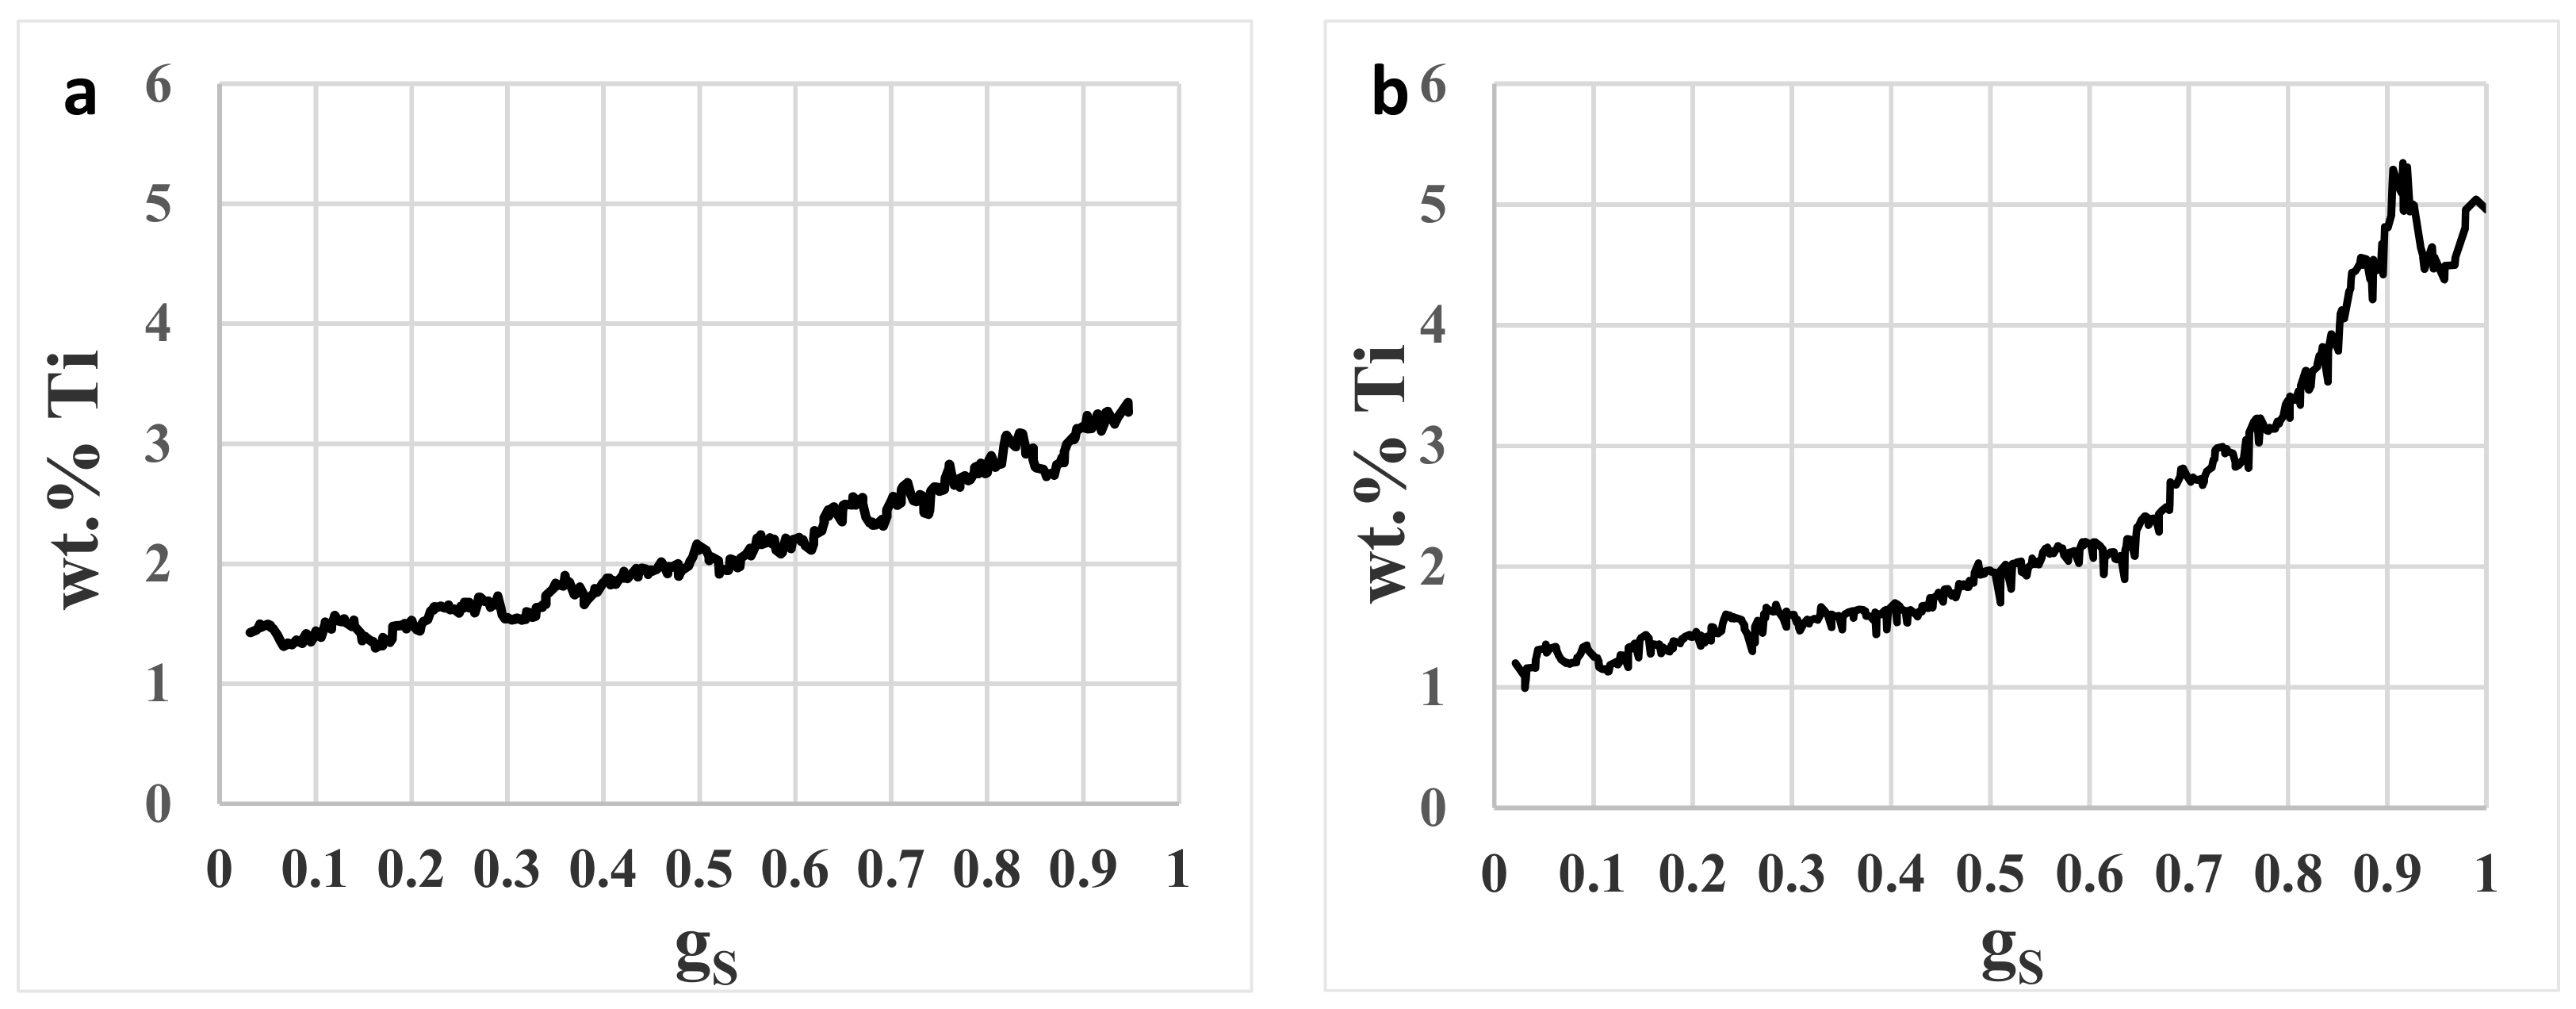
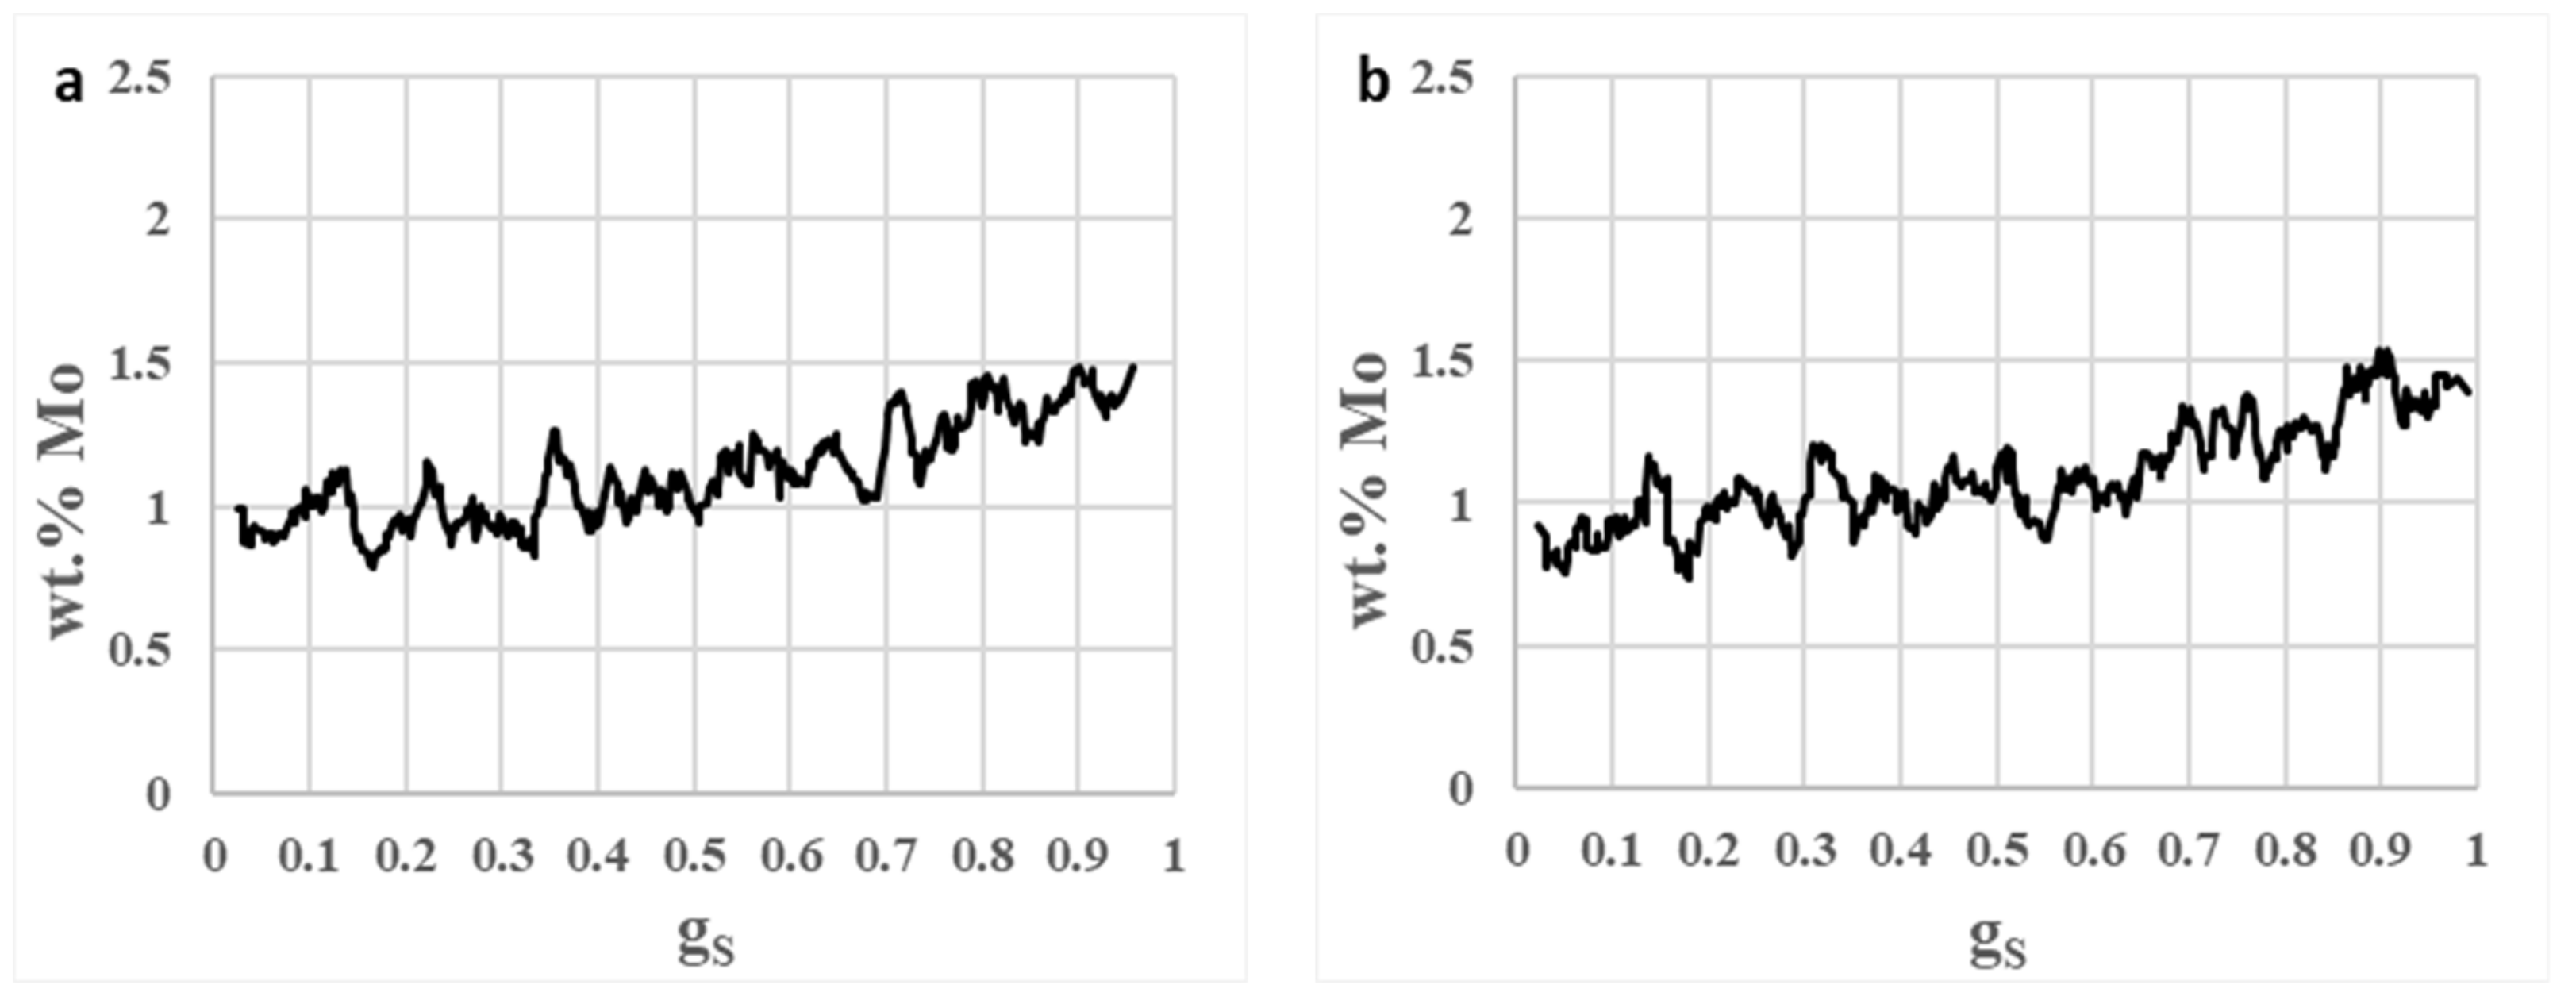
3.5. Segregation
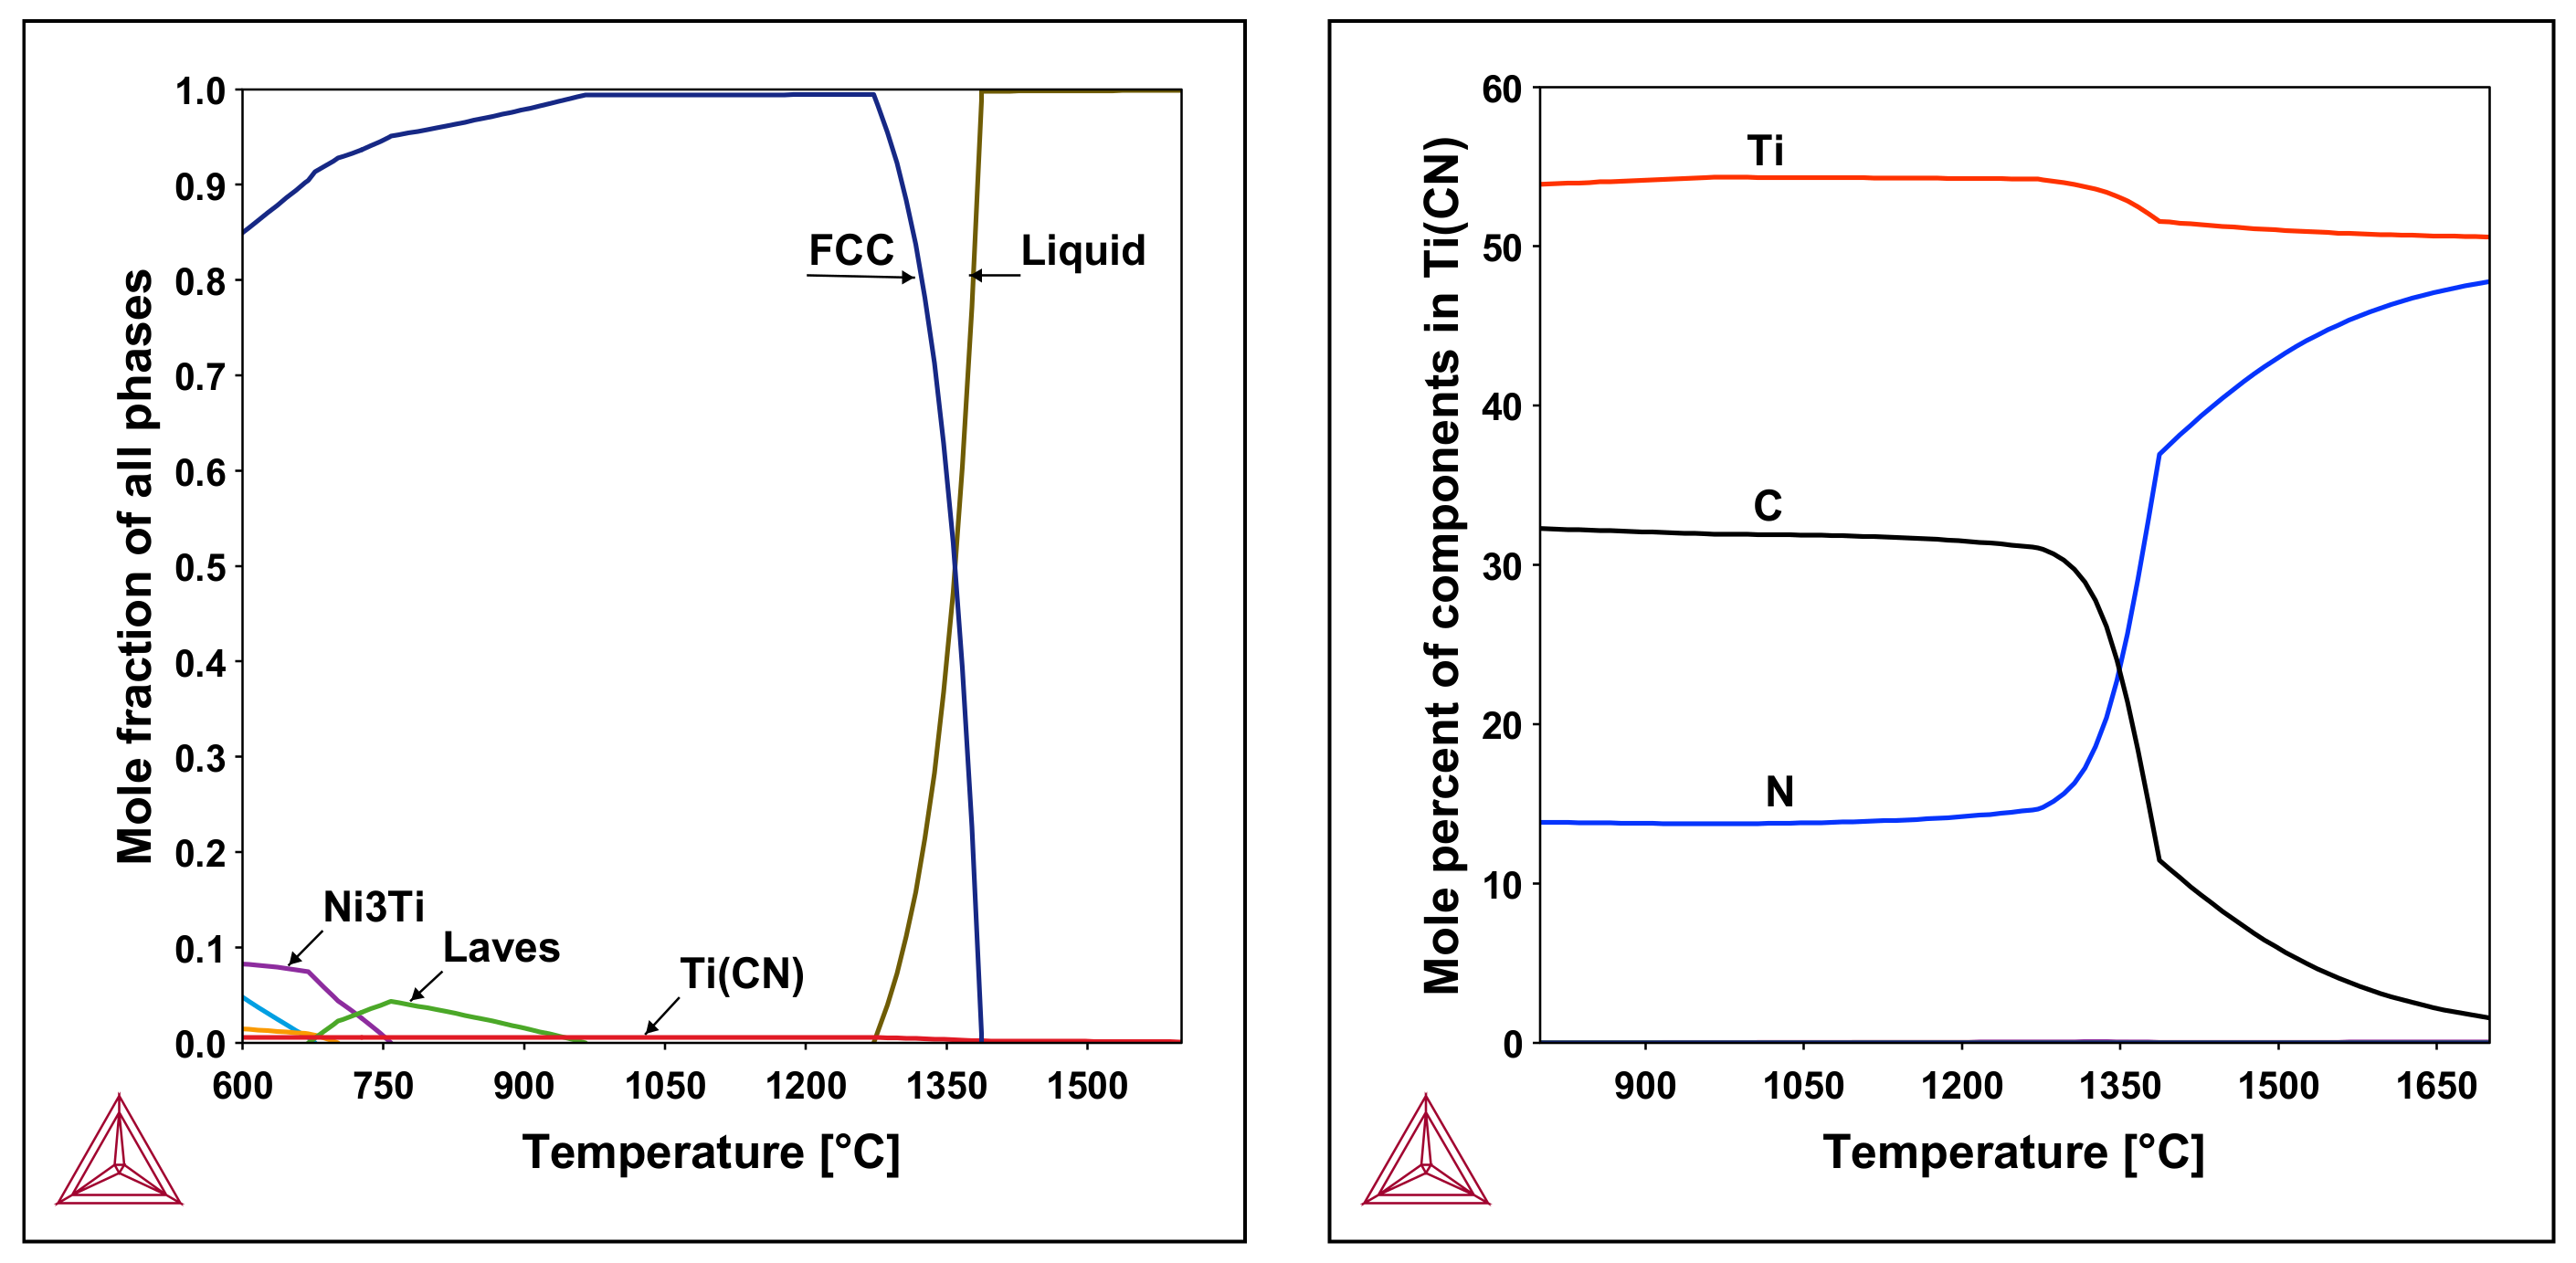
3.6. Theoretical Predictions
4. Discussion
5. Conclusions
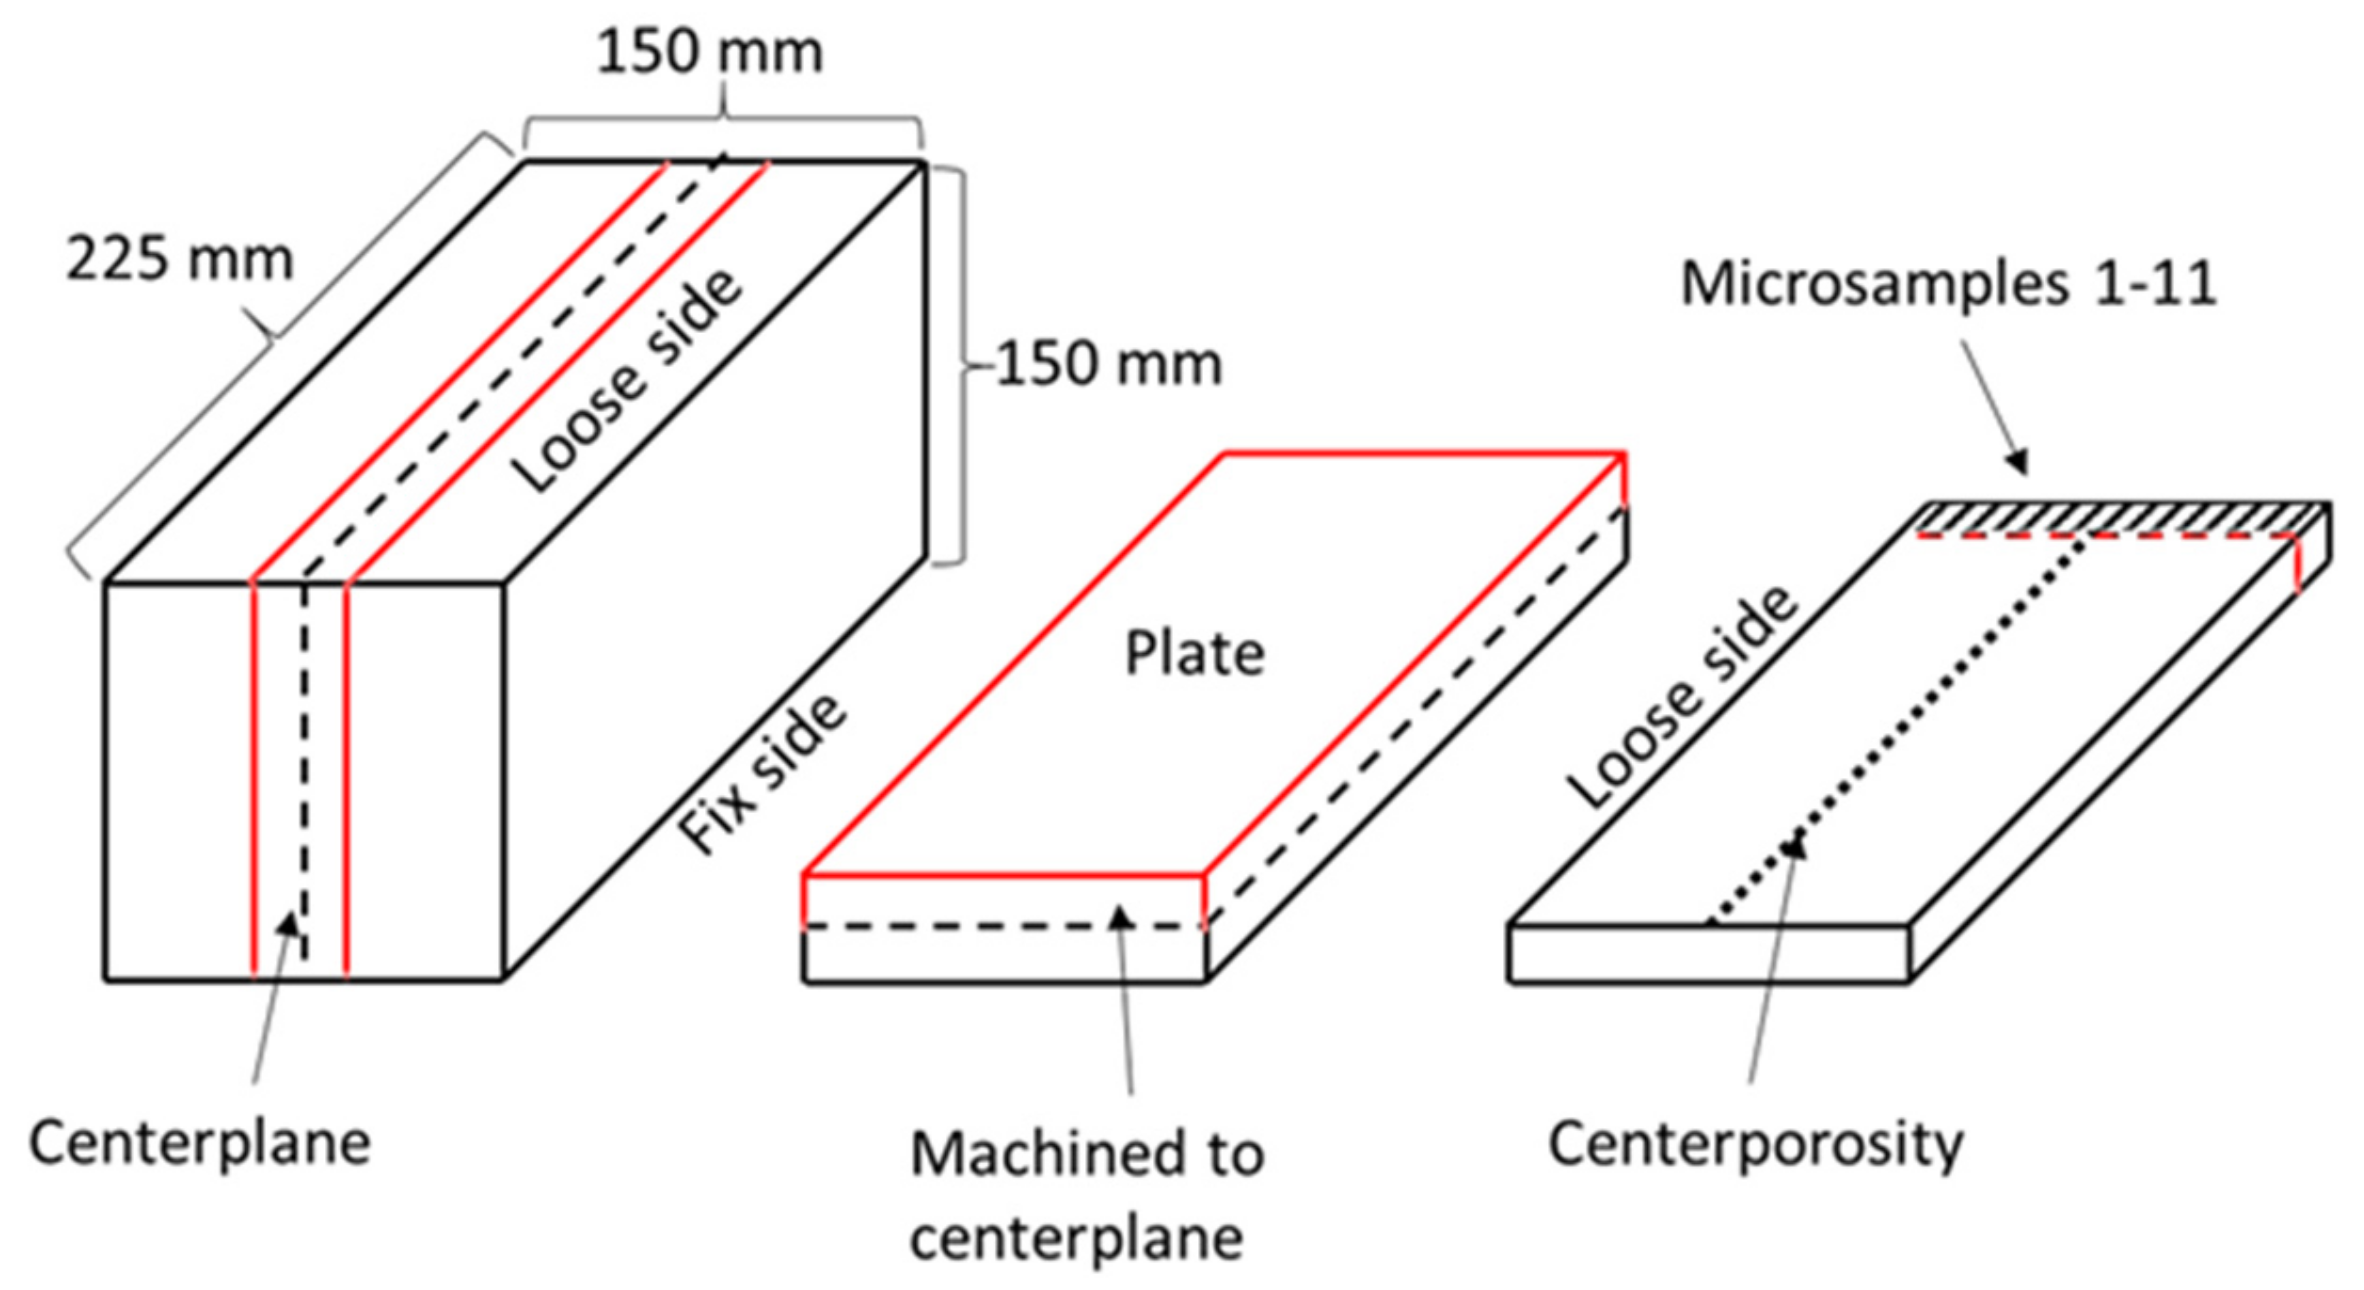
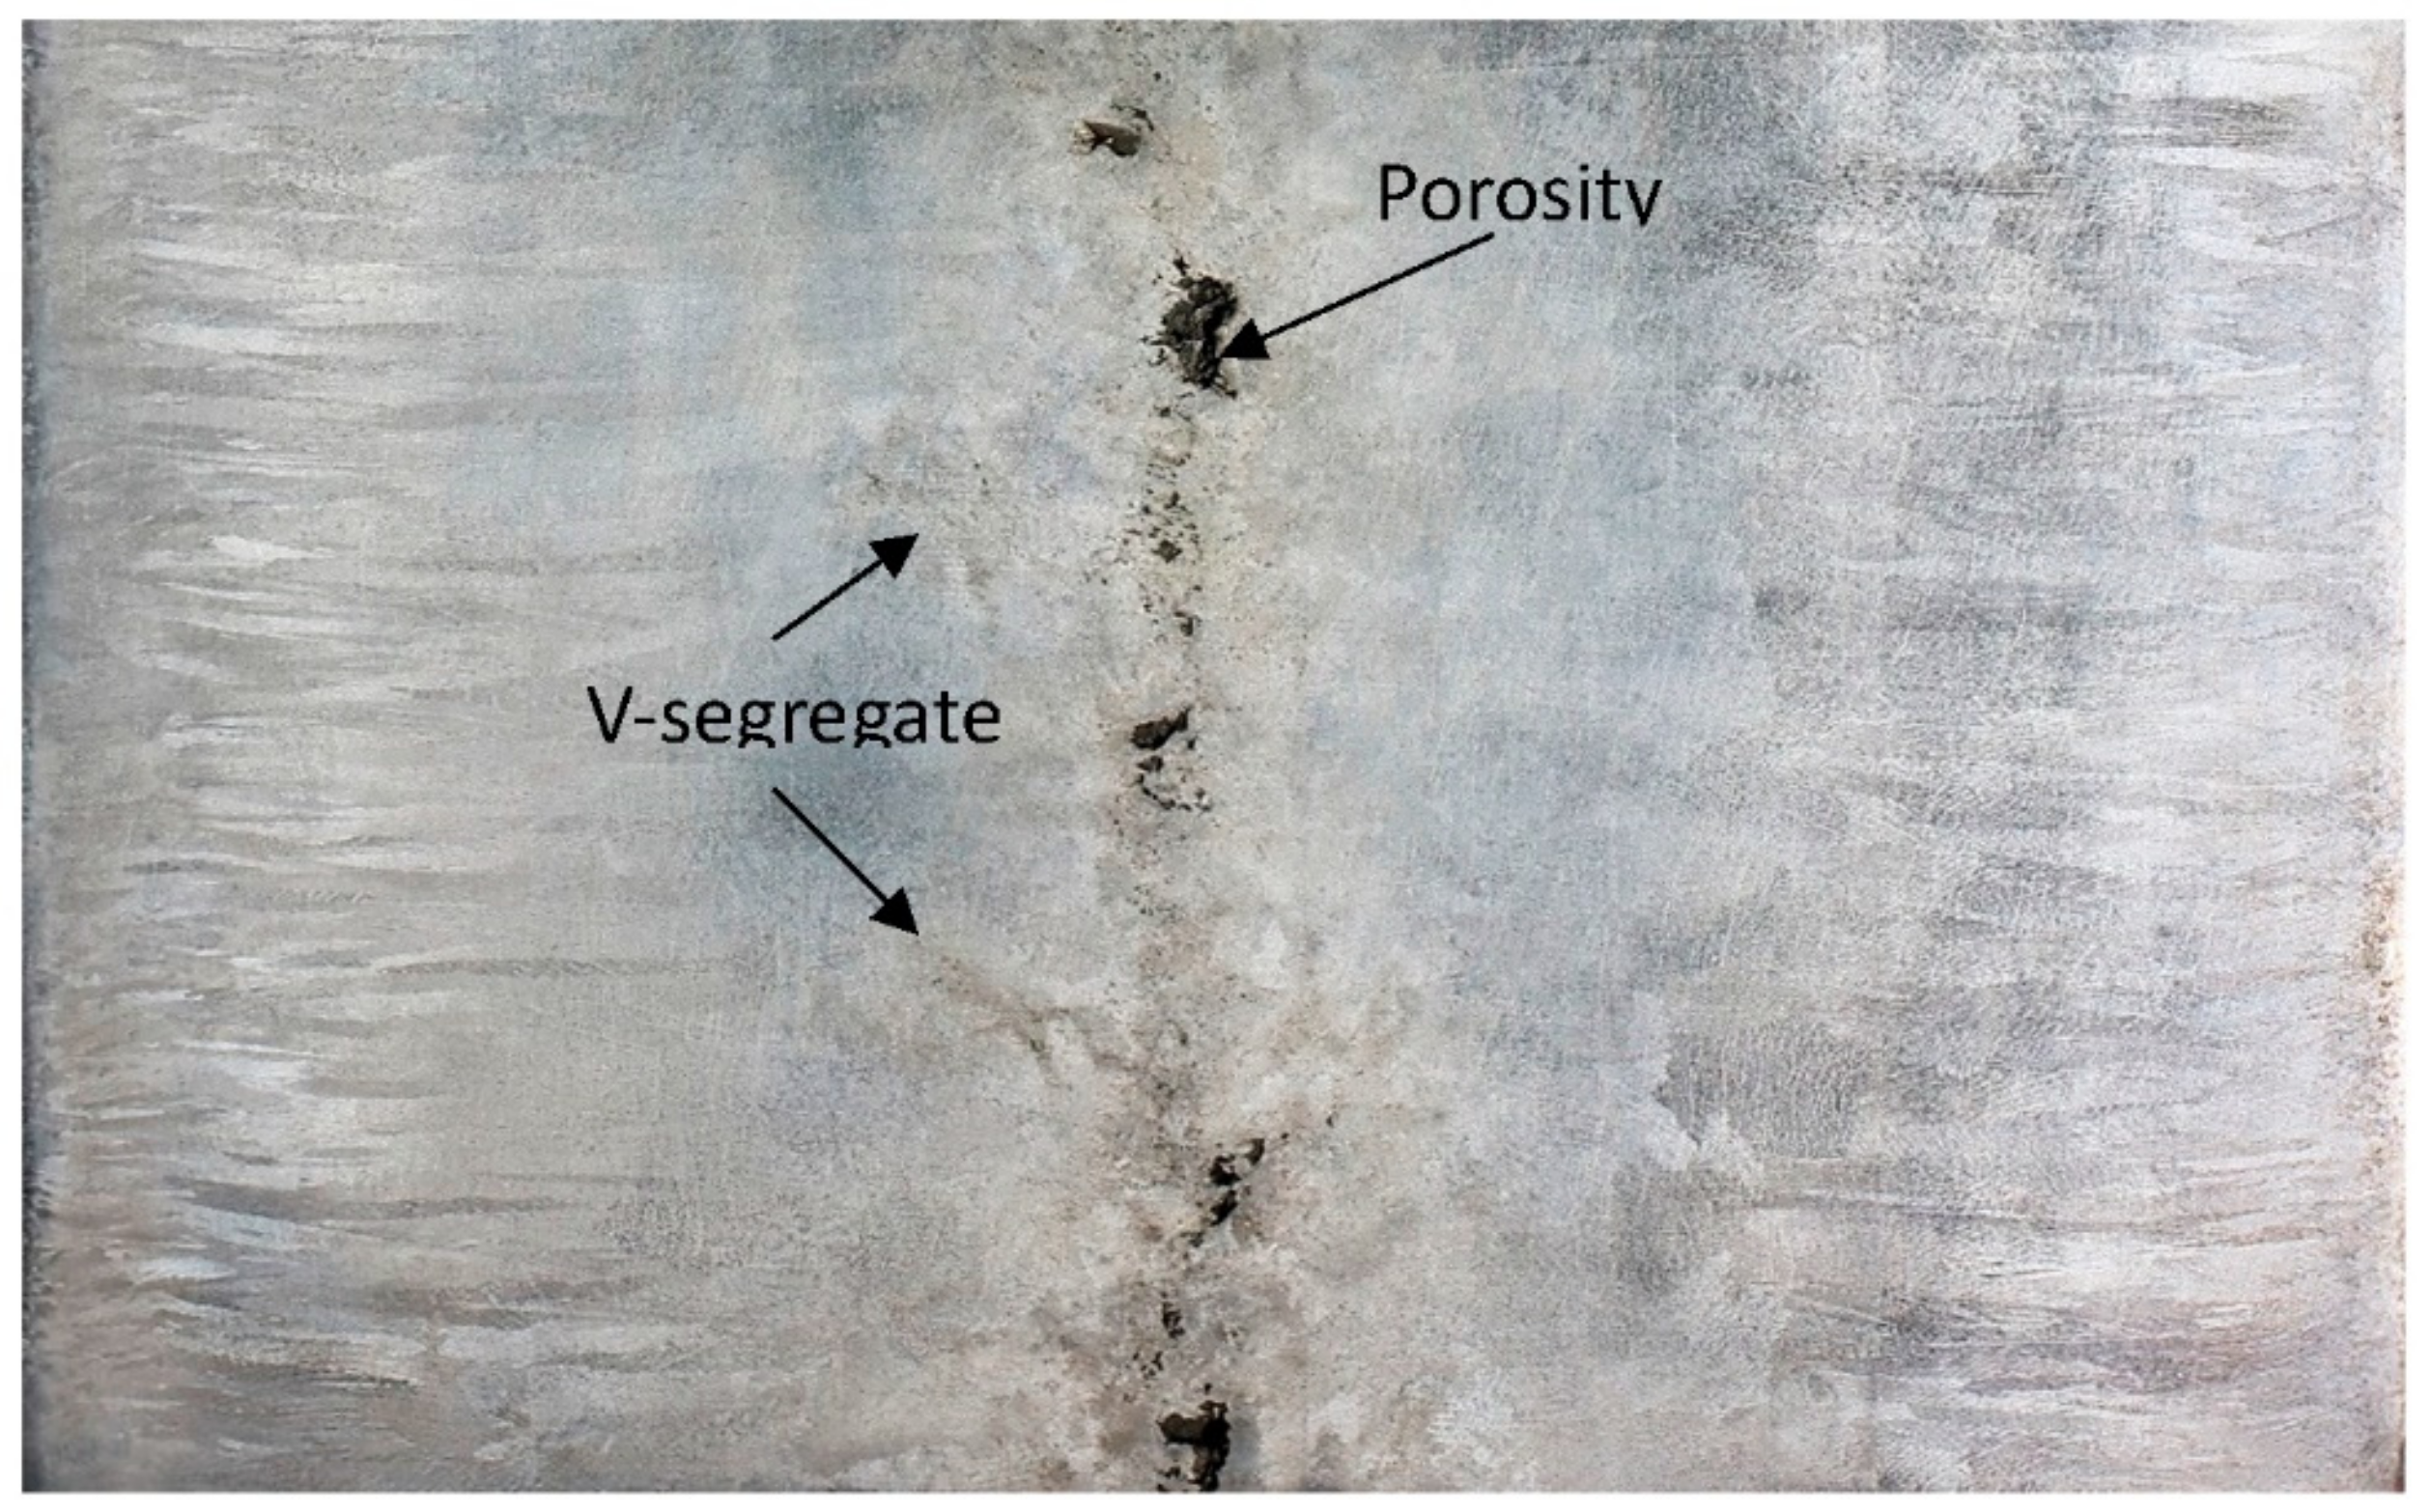
- The billets contain a large central porosity with a width of up to 10 mm.
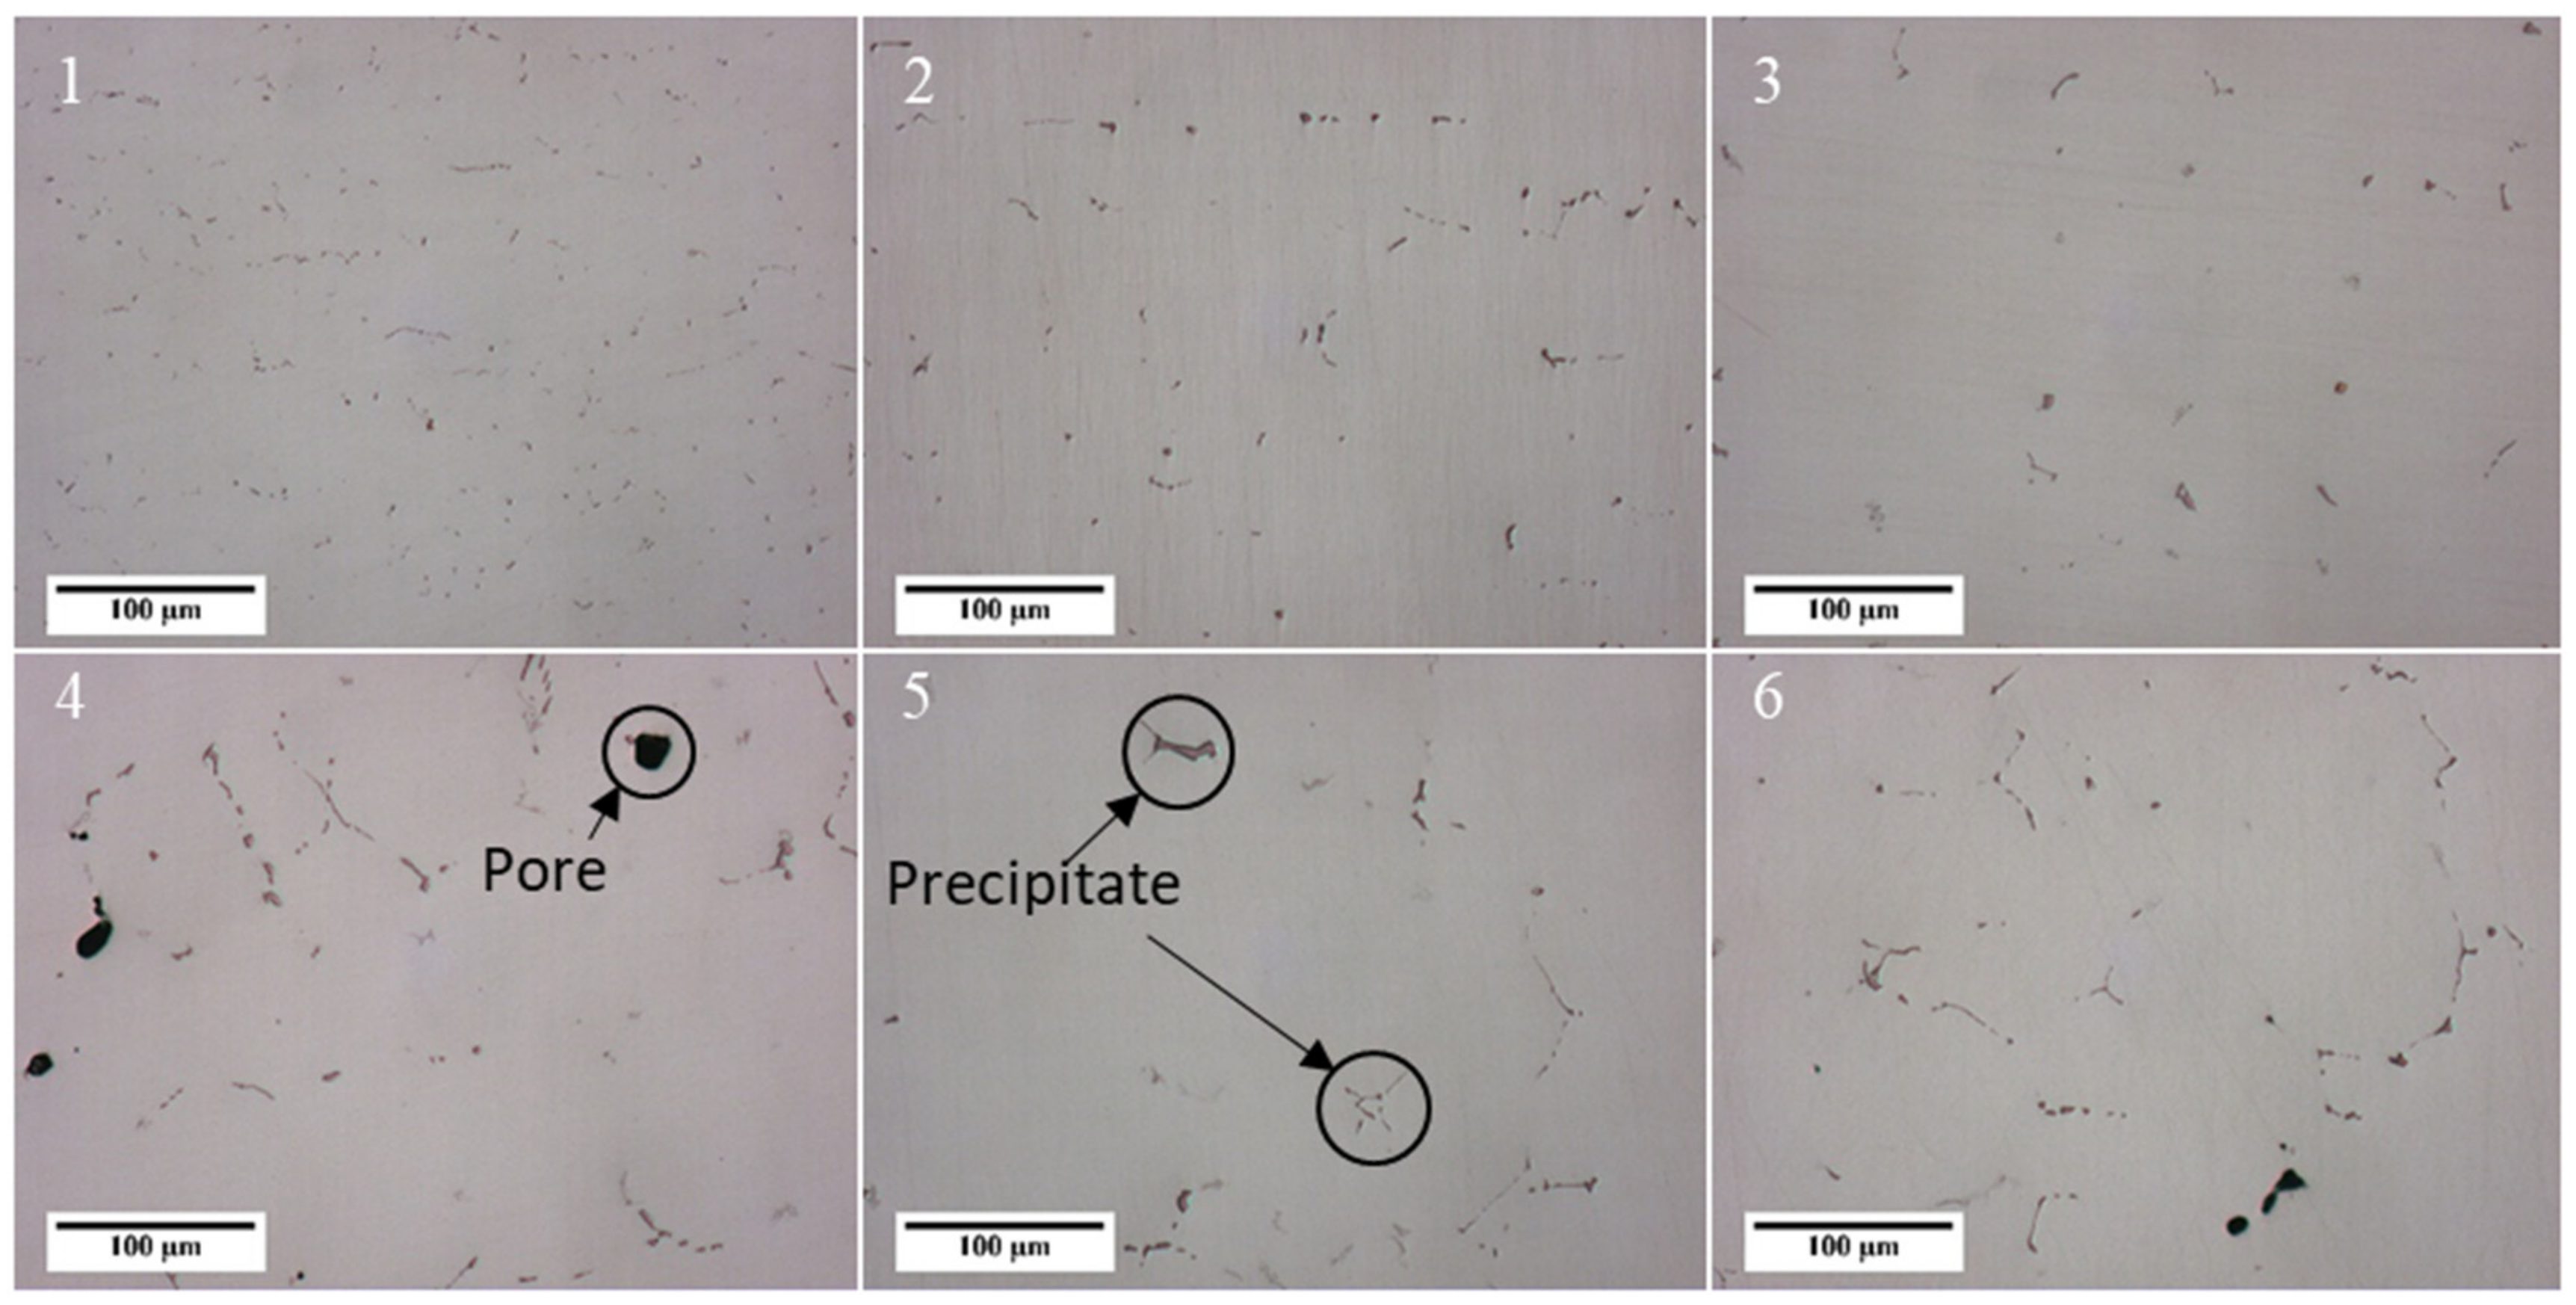
- Formation of small microporosities in the interdendritic areas start at 30 mm from the billet surface and continue inward to the billet center.
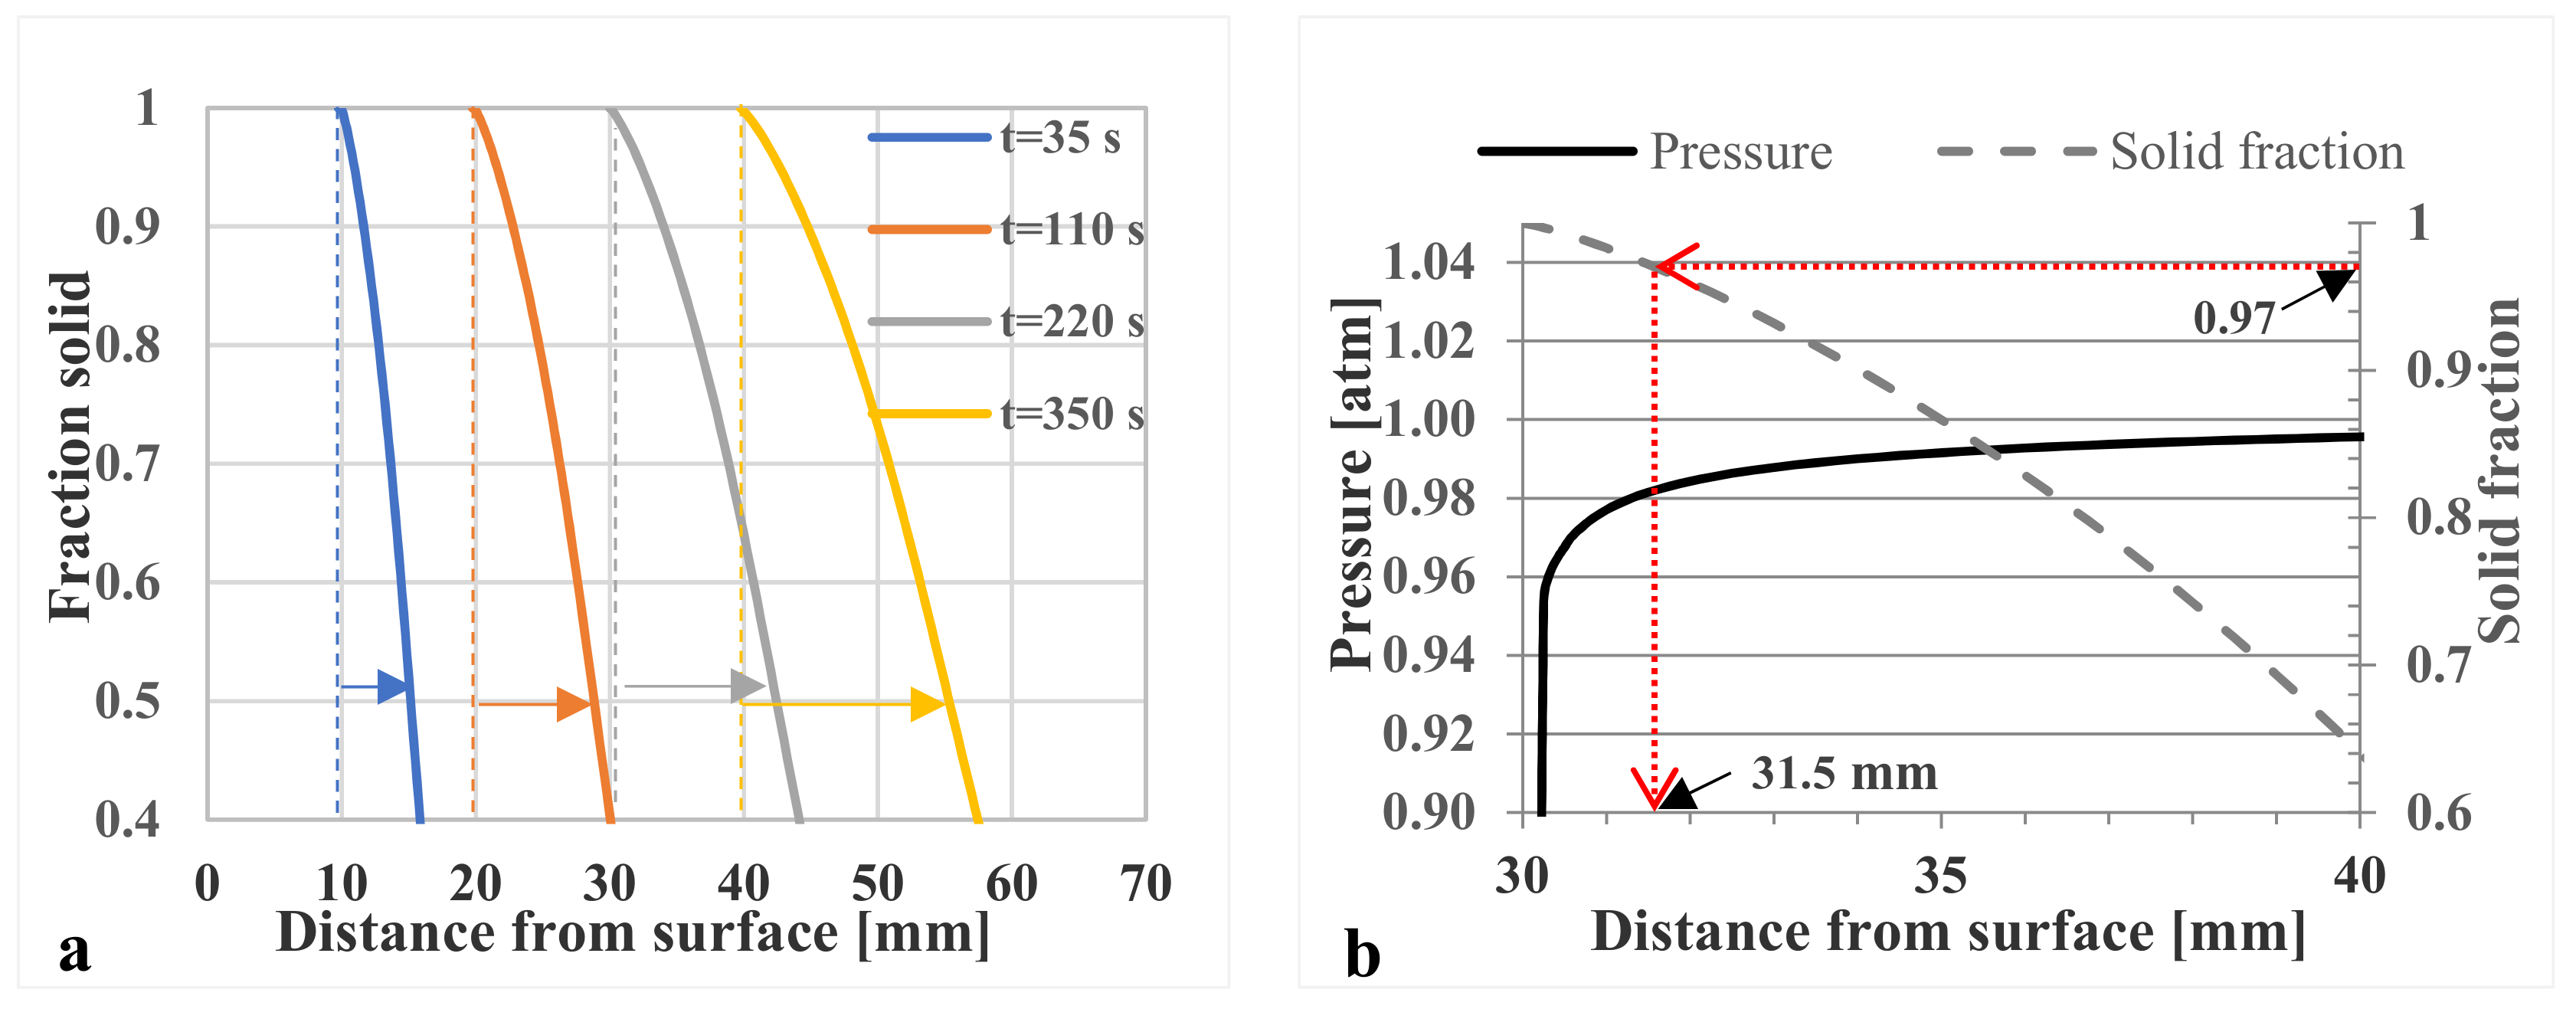
- The investigations with Darcy’s law show that the pressure drops significantly when fs > 0.97. However, when fs < 0.97 there is almost no resistance to liquid feeding.
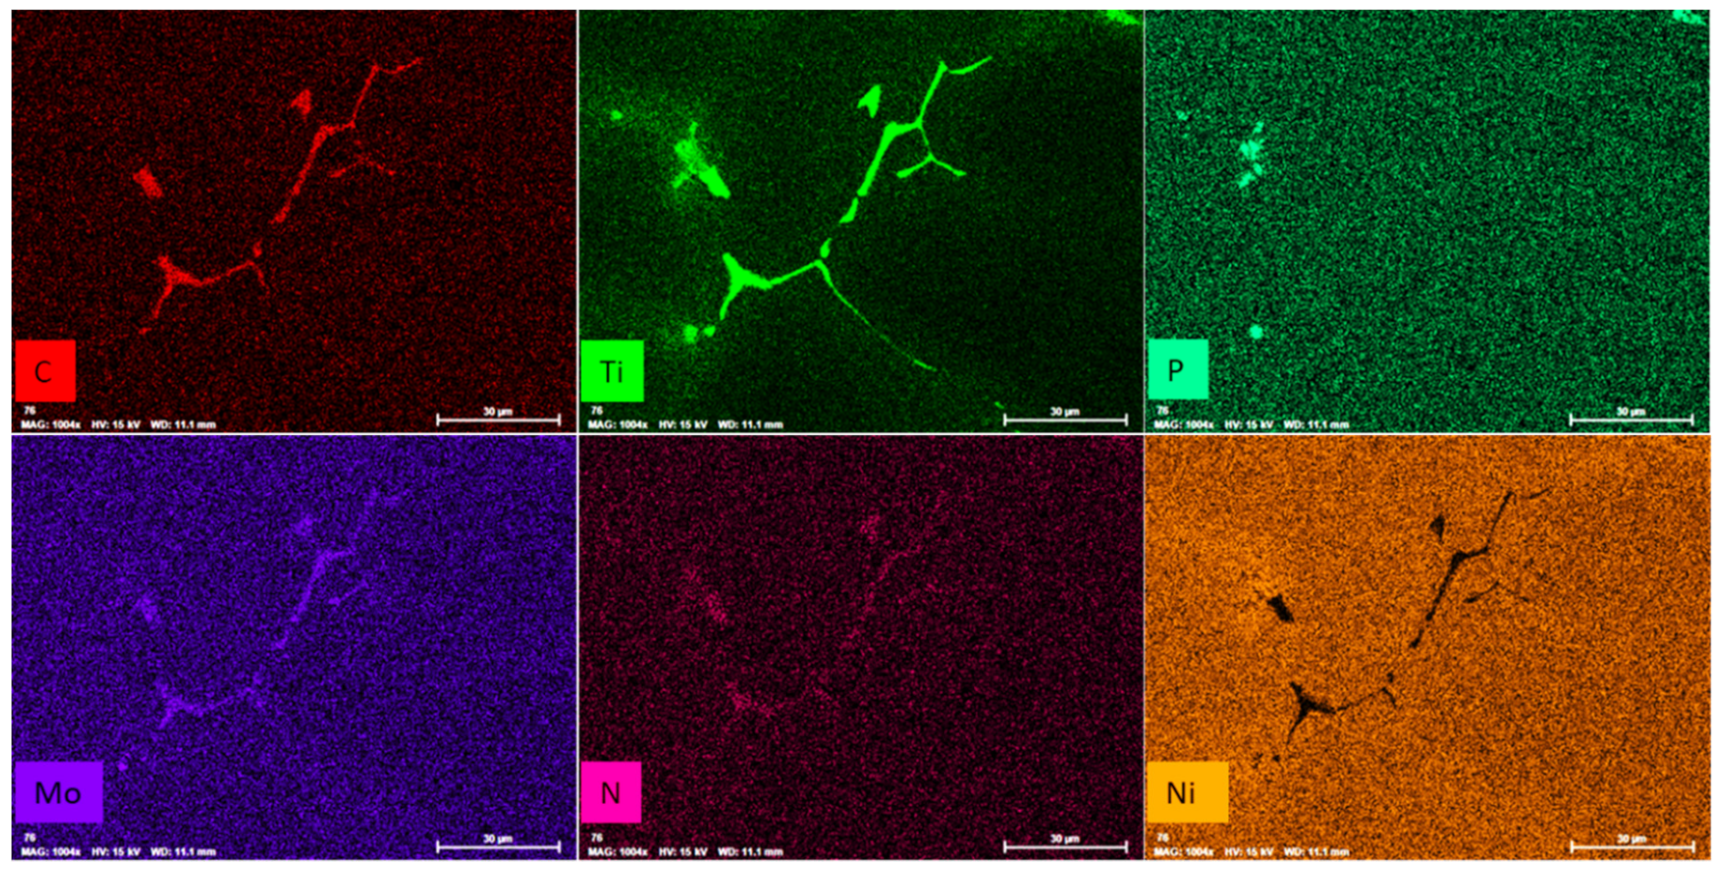
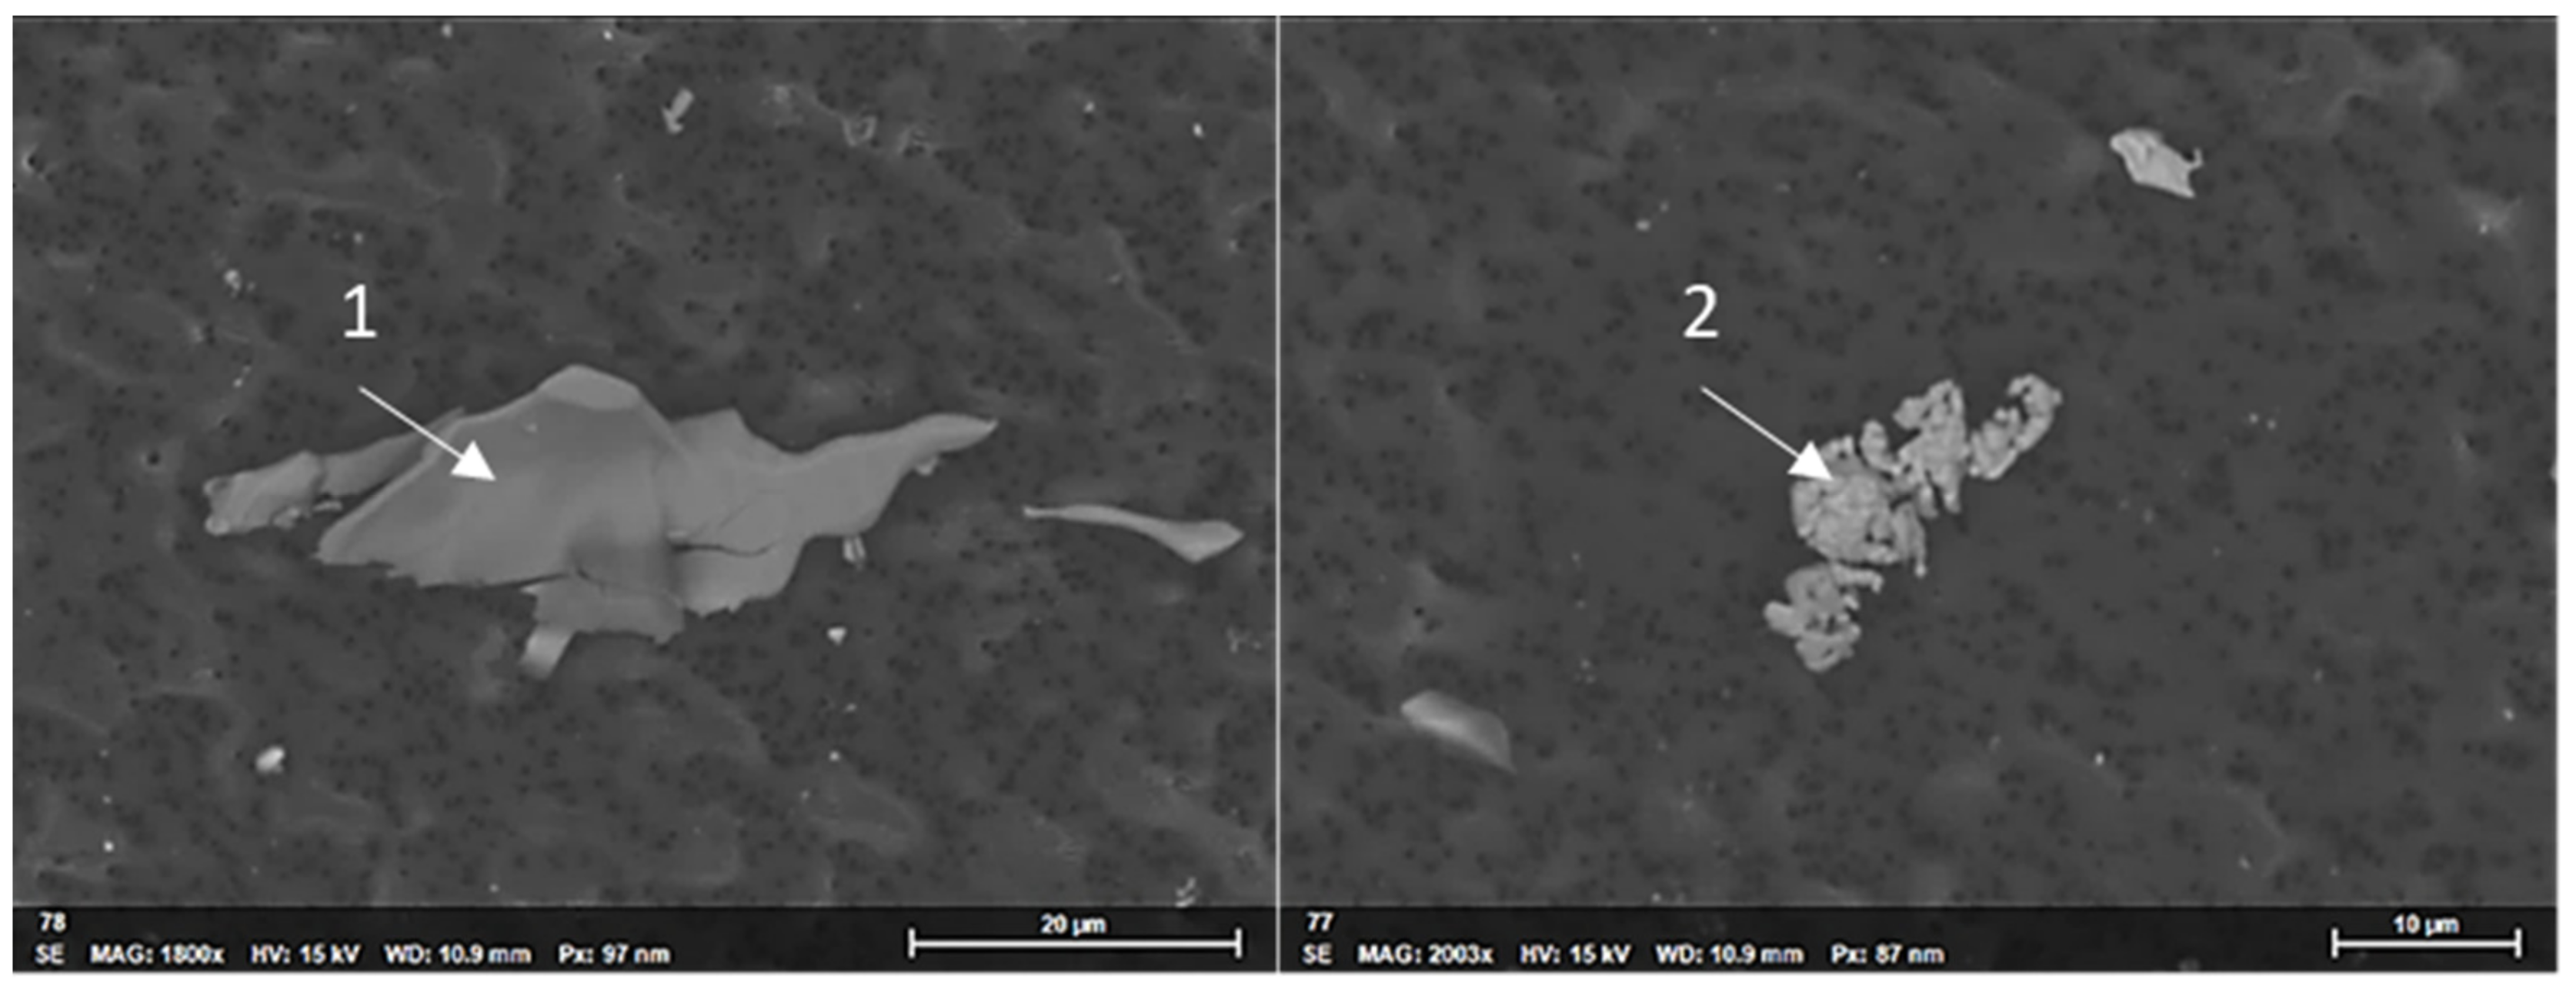
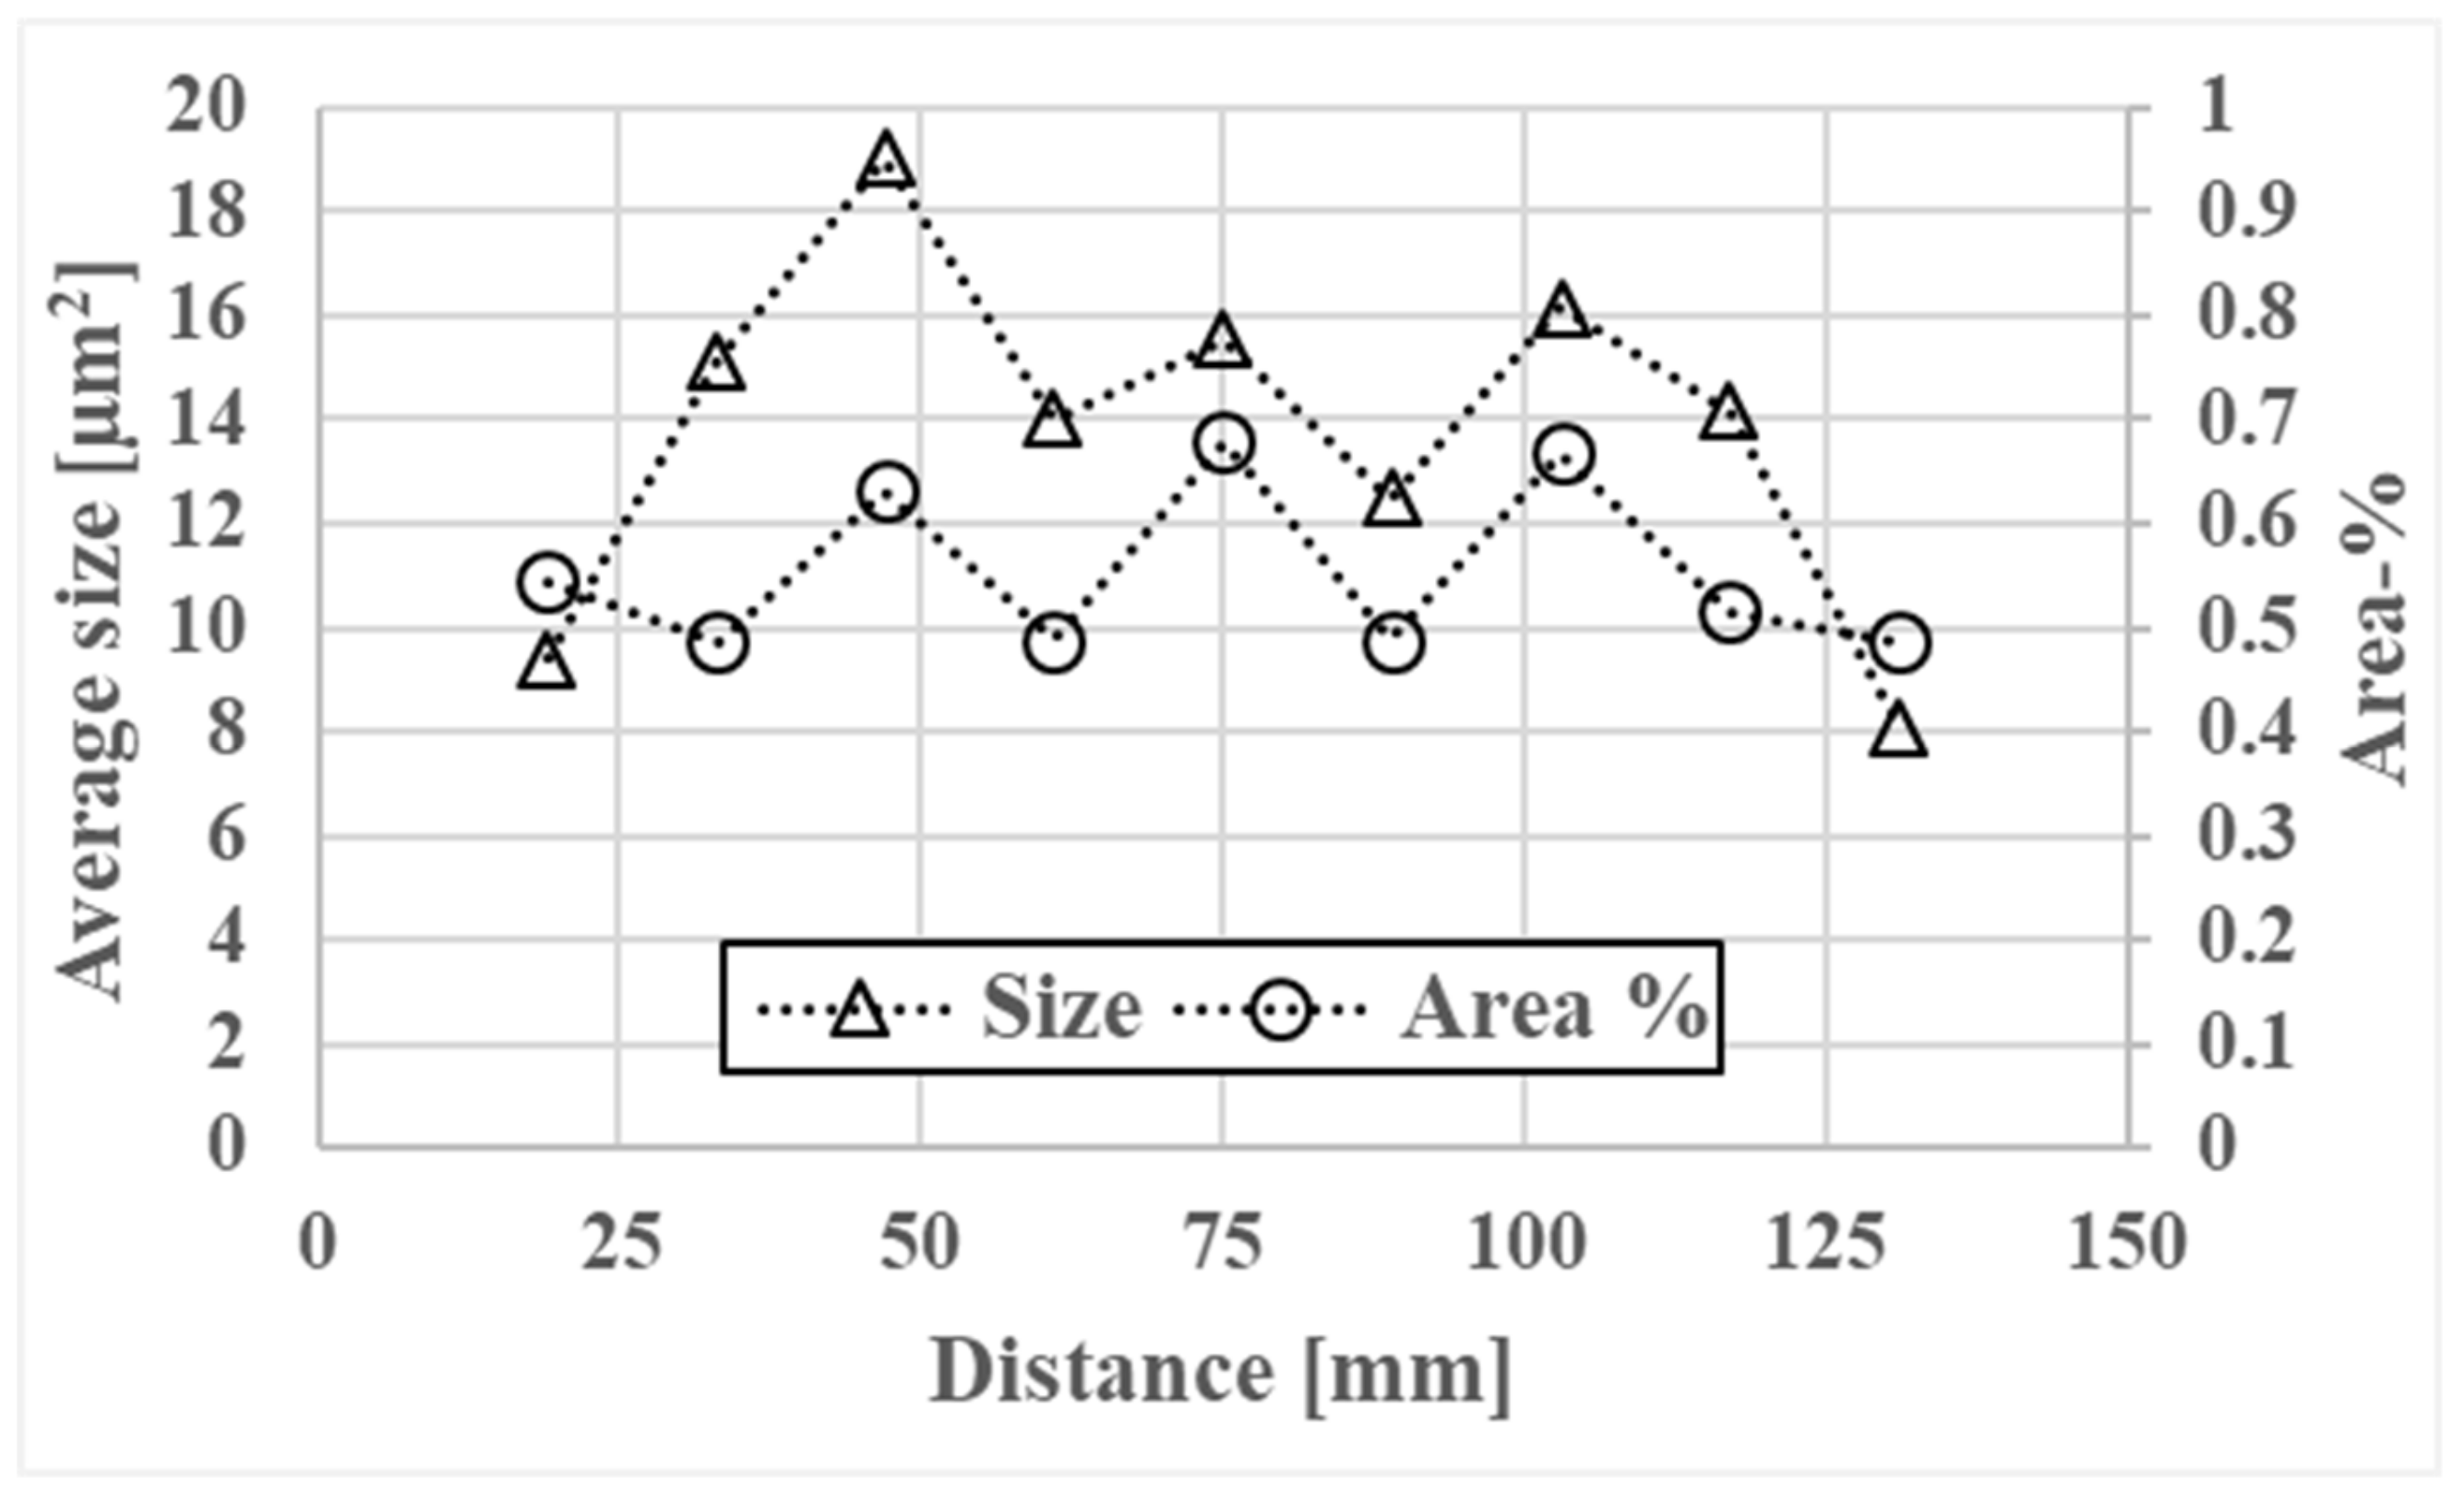
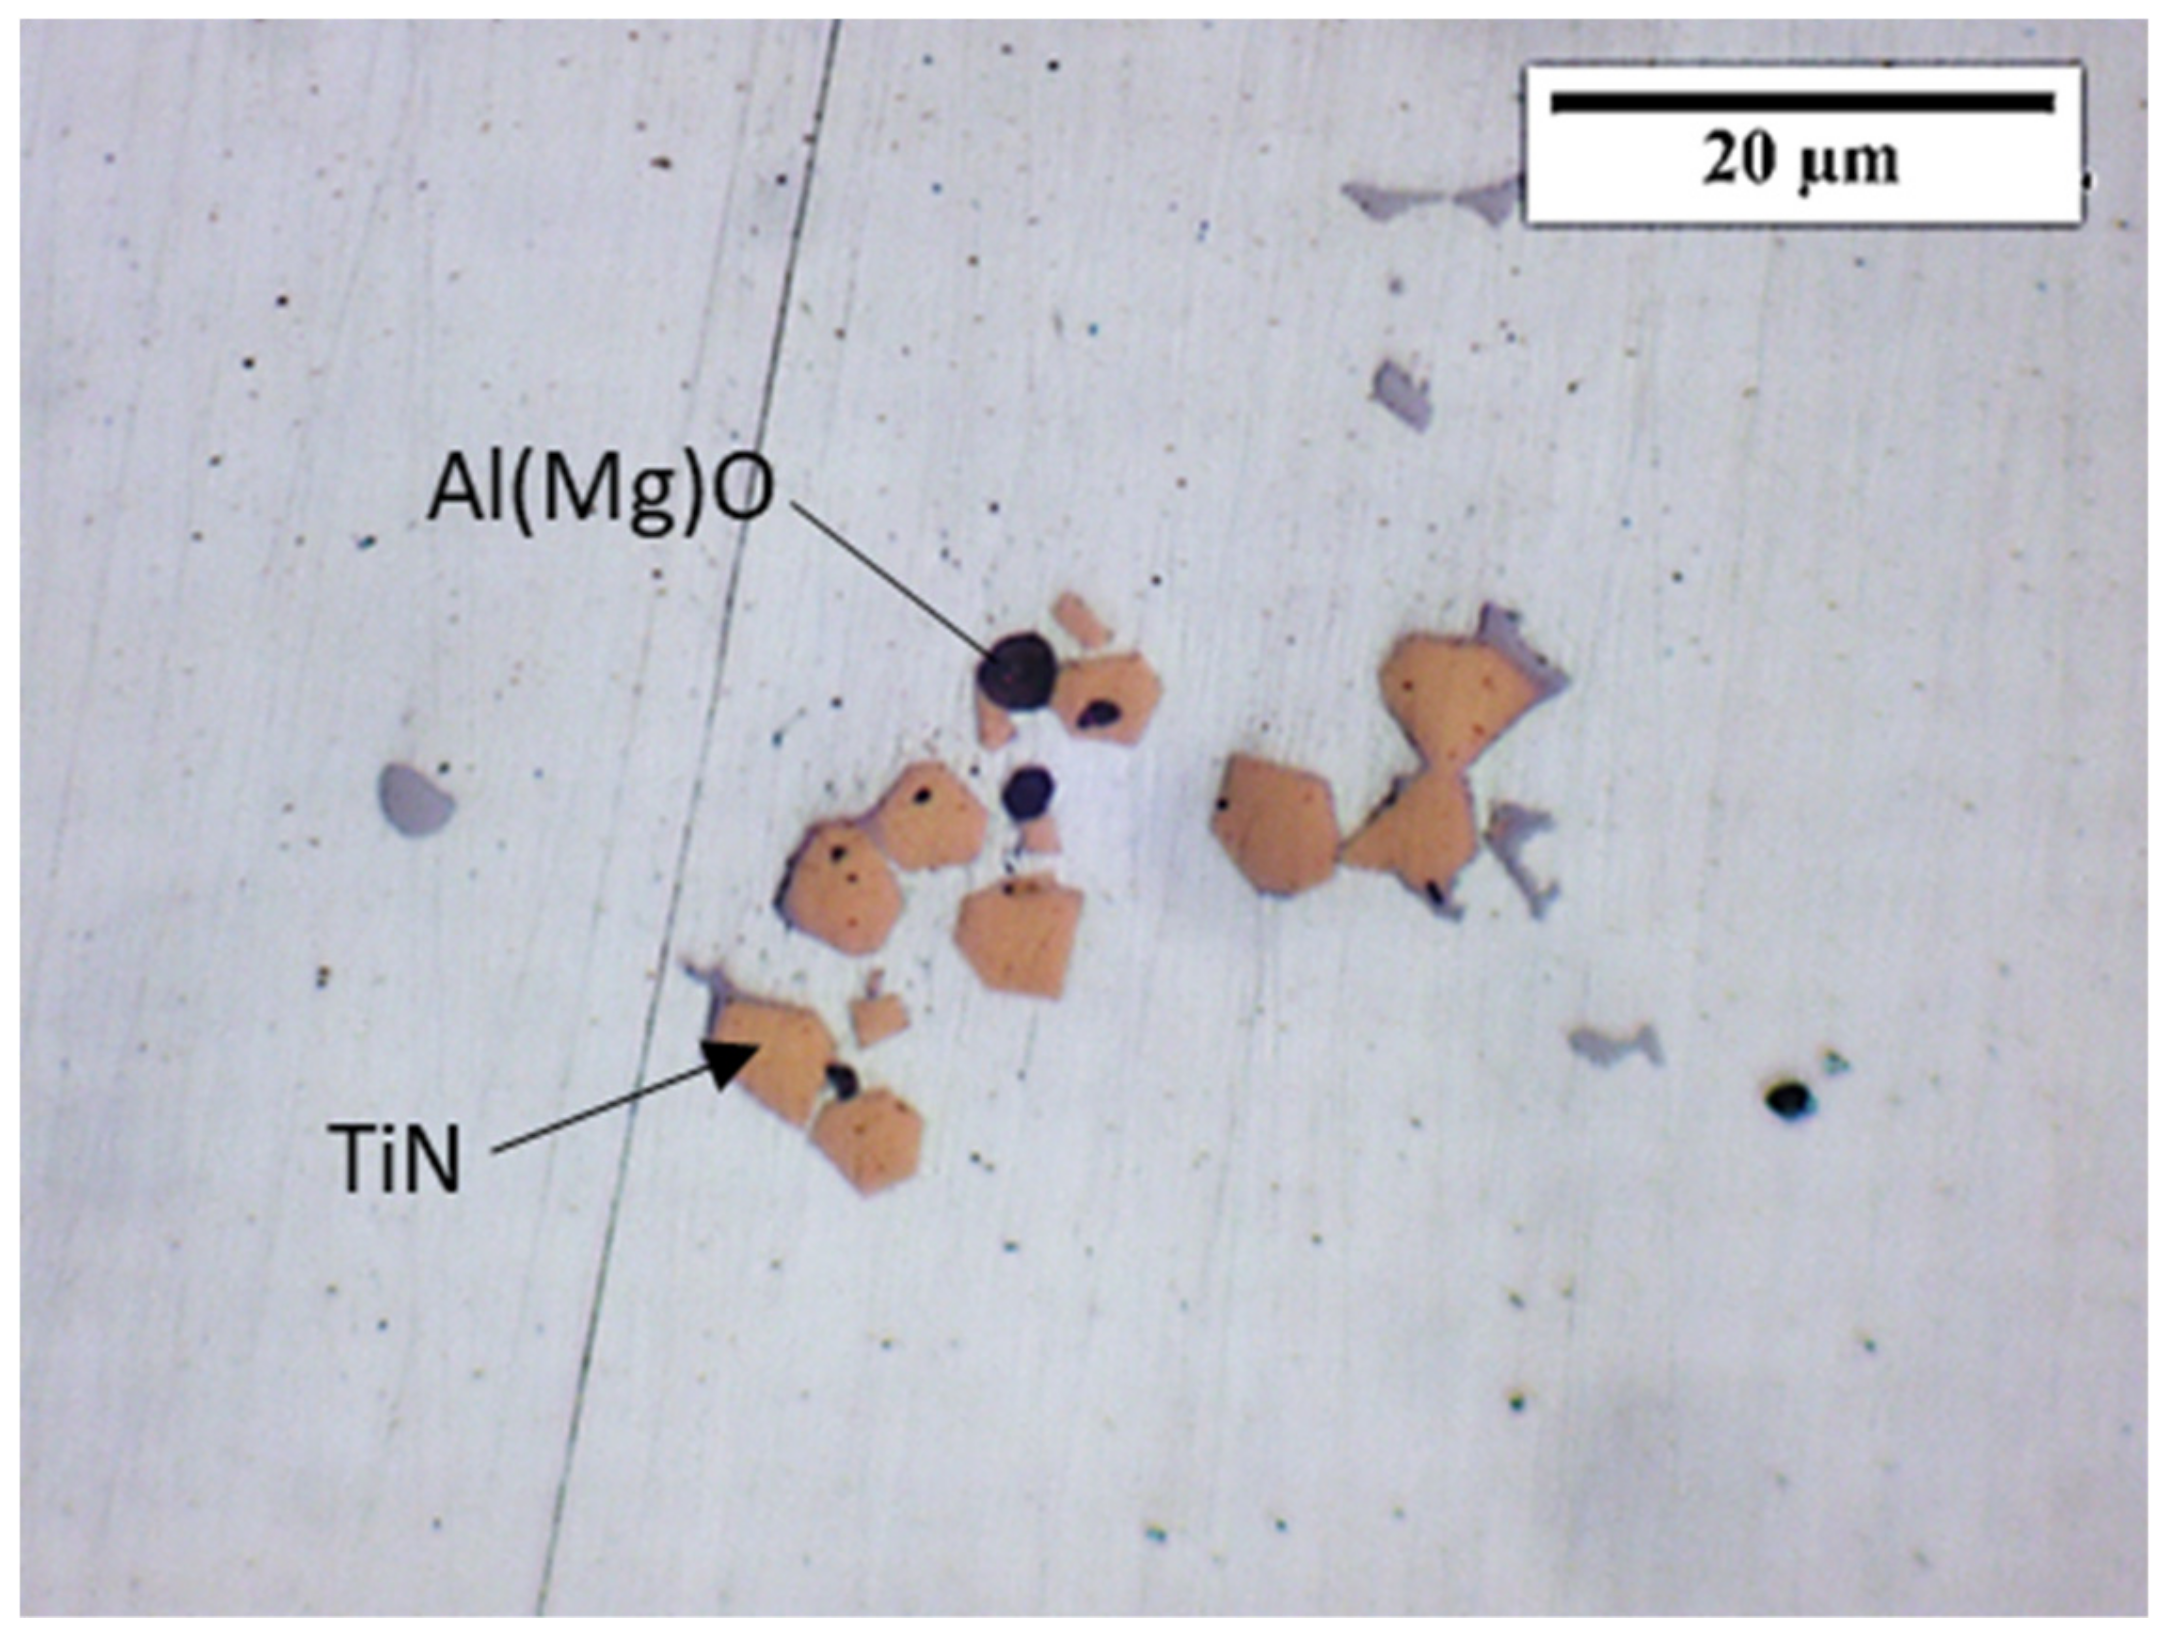
- All samples contain Ti(C,N), TiN, phosphides, and η-phase precipitates and the area fraction of those phases amounts to approximately 0.55% of the whole specimen.
- The presence of heavy microsegregation of Ti to interdendritic areas gives segregation index values of up to 3.9. Probably this will deteriorate the hot ductility properties of the cast billets.
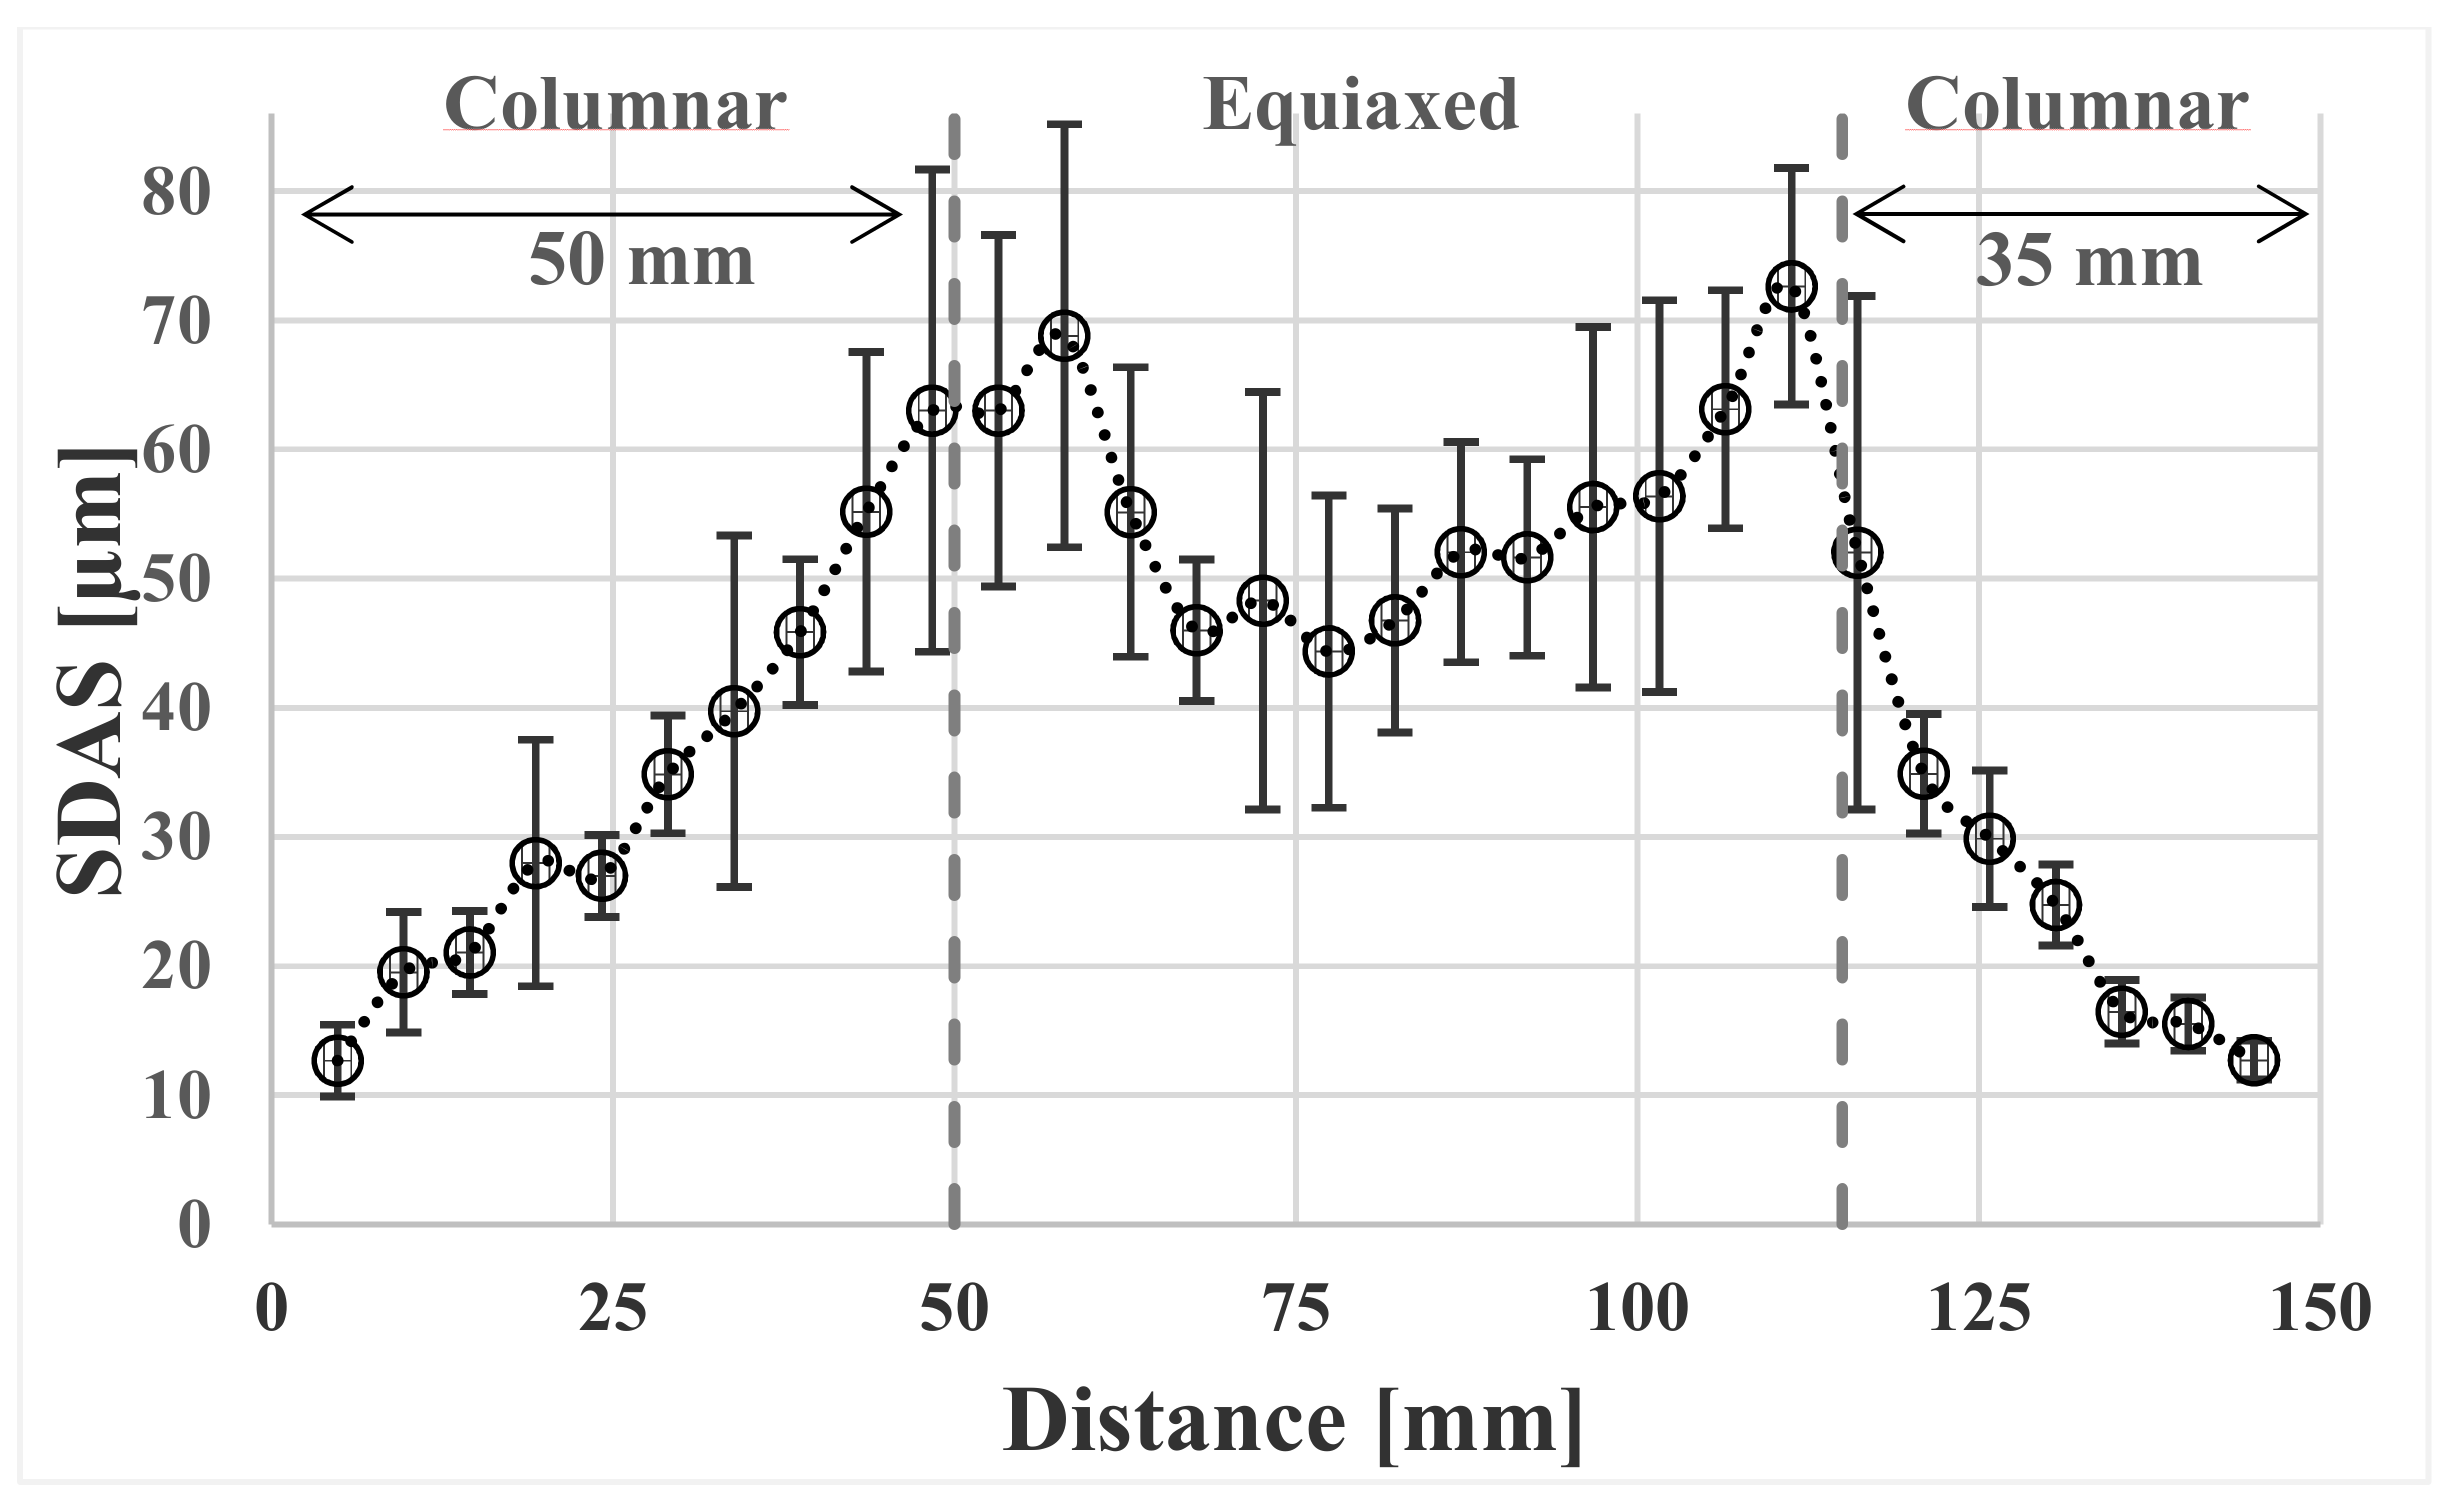
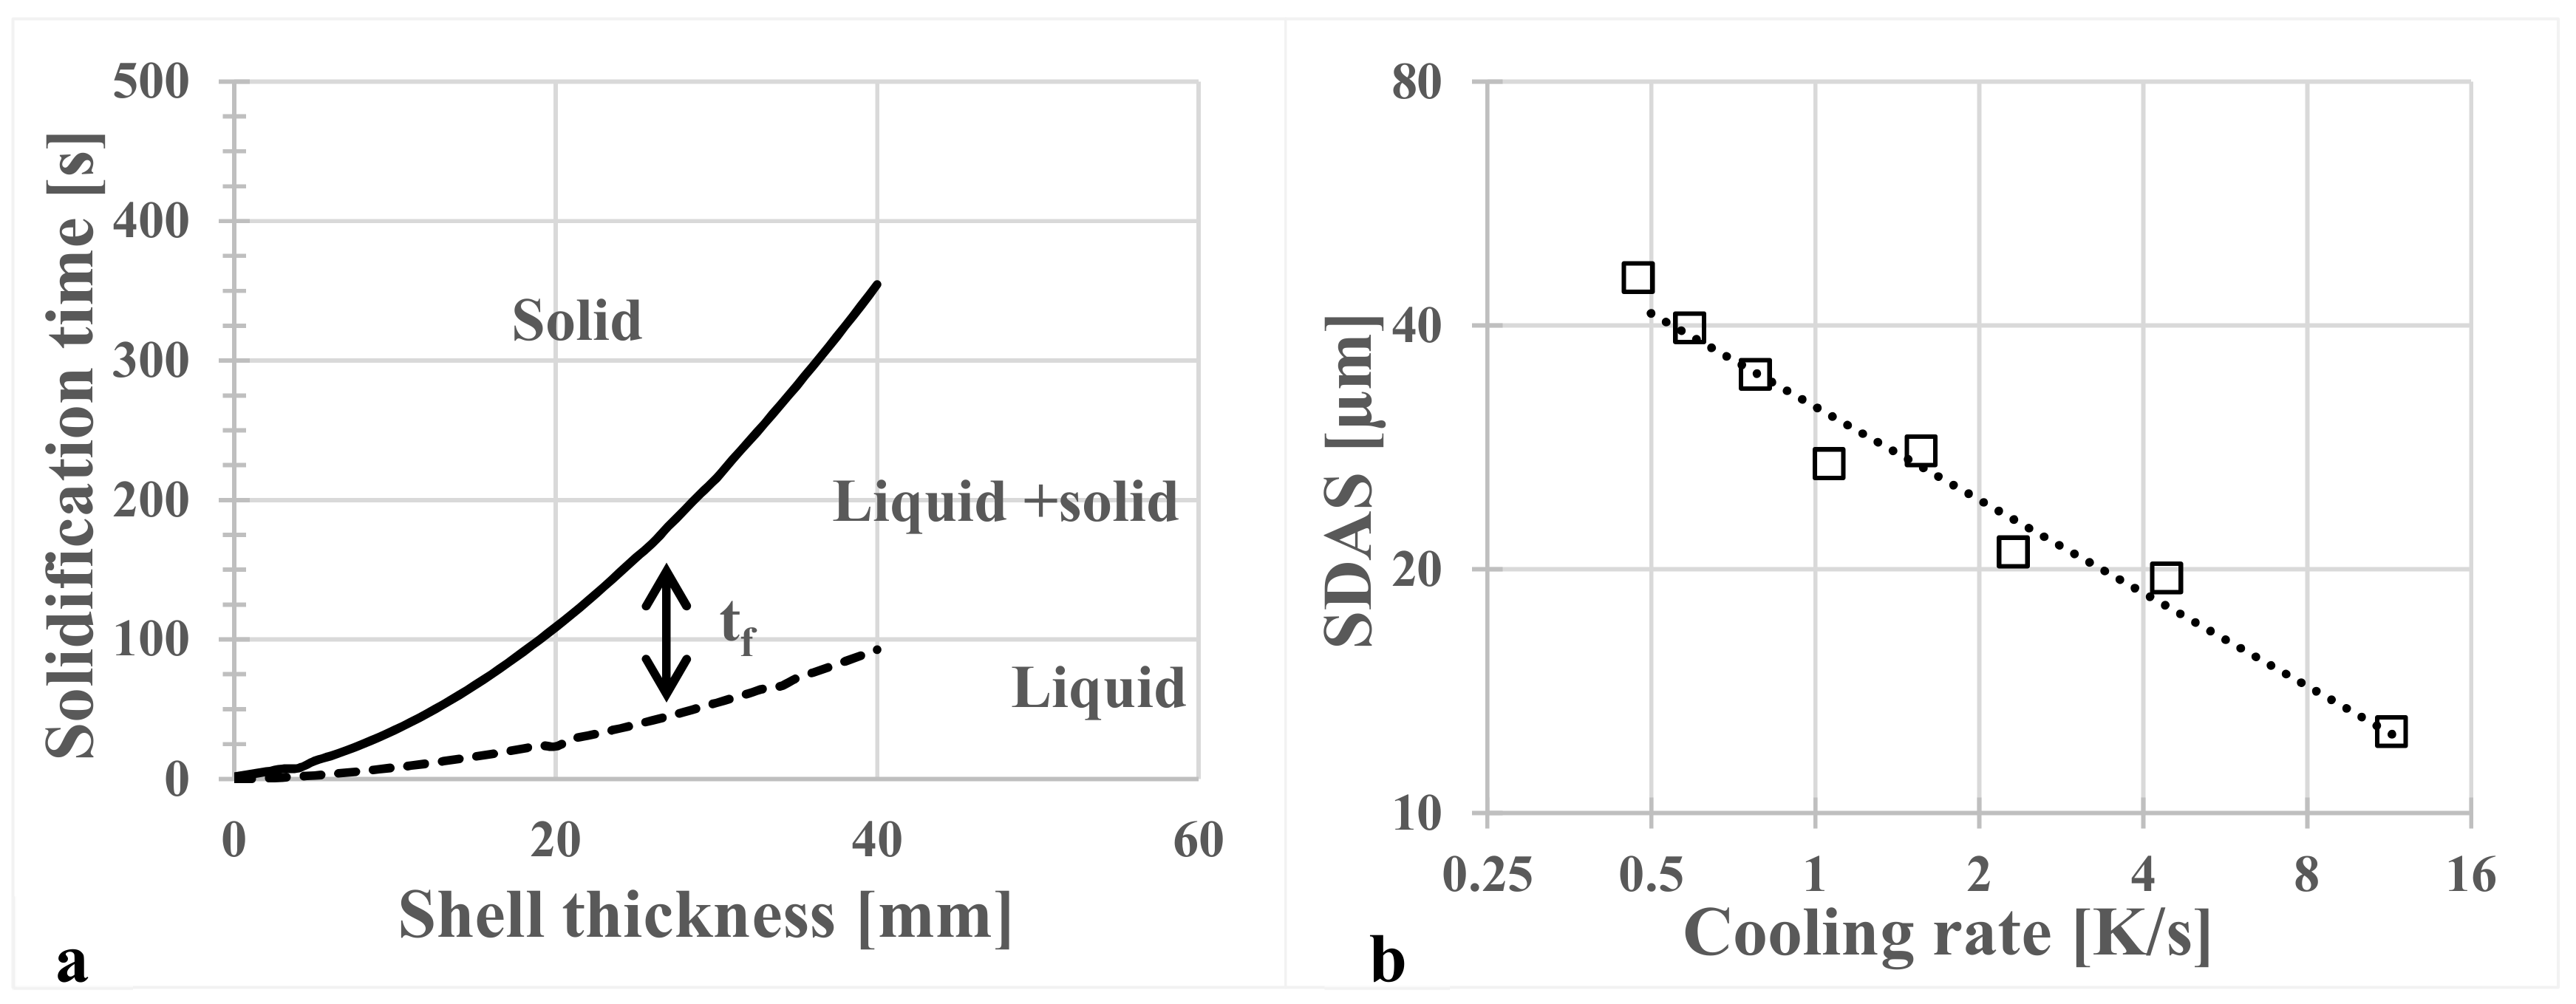
- The secondary dendrite arm spacing, λ2 in μm, was measured from the billet surface to the center. A curve fit of the SDAS values versus calculated cooling rates, dT/dt in K/s, gave the relation .
- The center of the billet exhibits an equiaxed structure. The reason for this could be the presence of spinel particles acting as inoculants.
Author Contributions
Funding
Acknowledgments
Conflicts of Interest
References
- Donachie, M.J.; Donachie, S.J. Superalloys: A Technical Guide, 2nd ed.; ASM International: Materials Park, OH, USA, 2002. [Google Scholar]
- Chen, S.; Zhao, M.; Rong, L. Effect of Ti content on the microstructure and mechanical properties of electron beam welds in Fe–Ni based alloys. Mater. Sci. Eng. A 2013, 571, 33–37. [Google Scholar] [CrossRef]
- Thompson, A.W.; Brooks, J.A. The mechanism of precipitation strengthening in an iron-base superalloy. Acta Metall. 1982, 30, 2197–2203. [Google Scholar] [CrossRef]
- Kusabiraki, K.; Takasawa, Y.; Ooka, T. Precipitation and growth of Gamma’-phases and Eta-phases in 53Fe-26Ni-15Cr alloy. ISIJ Int. 1995, 35, 542–547. [Google Scholar] [CrossRef][Green Version]
- Seifollahi, M.; Razavi, S.H.; Kheirandish, S.; Abbasi, S.M. The mechanism of eta phase precipitation in A286 superalloy during heat treatment. J. Mater. Eng. Perform. 2013, 22, 3063–3069. [Google Scholar] [CrossRef]
- De Cicco, H.; Luppo, M.I.; Gribaudo, L.M.; Ovejero-Garcia, J. Microstructural development and creep behavior in A286 superalloy. Mater. Charact. 2004, 52, 85–92. [Google Scholar] [CrossRef]
- ASM International. Heat-Resistant Materials Subject of New ASM Specialty Handbook; ASM International: Materials Park, OH, USA, 1997; Volume 152, p. 115. [Google Scholar]
- Zhao, M.J.; Guo, Z.F.; Liang, H.; Rong, L.J. Effect of boron on the microstructure, mechanical properties and hydrogen performance in a modified A286. Mater. Sci. Eng. A 2010, 527, 5844–5851. [Google Scholar] [CrossRef]
- Ducki, K.J.; Hetmańczyk, M.; Kuc, D. Analysis of the precipitation process of the intermetallic phases in a high-temperature Fe–Ni austenitic alloy. Mater. Chem. Phys. 2003, 81, 490–492. [Google Scholar] [CrossRef]
- Seifollahi, M.; Kheirandish, S.; Razavi, S.H.; Abbasi, S.M.; Sahrapour, P. Effect of eta phase on mechanical properties of the iron-based superalloy using shear punch testing. ISIJ Int. 2013, 53, 311–316. [Google Scholar] [CrossRef]
- Yamamoto, Y.; Muralidharan, G.; Brady, M.P. Development of L12-ordered Ni3(Al,Ti)-strengthened alumina-forming austenitic stainless steel alloys. Scr. Mater. 2013, 69, 816–819. [Google Scholar] [CrossRef]
- Li, C.W.; Yeh, A.C.; Chen, C.S.; Wang, W.R. Hot ductility loss in a Fe-Ni-based superalloy. Metals (Basel) 2015, 5, 2428–2434. [Google Scholar] [CrossRef]
- Lv, B.; Zhang, F.C.; Li, M.; Hou, R.J.; Qian, L.H.; Wang, T.S. Effects of phosphorus and sulfur on the thermoplasticity of high manganese austenitic steel. Mater. Sci. Eng. A 2010, 527, 5648–5653. [Google Scholar] [CrossRef]
- Kohno, M.; Honjo, T.; Tsuchiyama, T.; Kinoshita, S.; Takeda, Y.; Fujita, A.; Fujikawa, T.; Hizume, A. Effect of titanium content on mechanical-properties of a-segregation region in large A286 iron-base superalloy forgings. Tetsu Hagane 1990, 76, 1139–1146. [Google Scholar] [CrossRef]
- Weiss, S.; Mattissen, D.; Dudzinski, W. Microstructure of laser-beam-welded iron-based superalloy A286 after high-temperature creep. Adv. Eng. Mater. 2002, 4, 142–146. [Google Scholar] [CrossRef]
- Andersson, J.O.; Helander, T.; Höglund, L.; Shi, P.; Sundman, B. Thermo-Calc & DICTRA, computational tools for materials science. Calphad 2002, 26, 273–312. [Google Scholar] [CrossRef]
- Vandersluis, E.; Ravindran, C. Comparison of measurement methods for secondary dendrite arm spacing. Metallogr. Microstruct. Anal. 2017, 6, 89–94. [Google Scholar] [CrossRef]
- Choudhary, S.K.; Ganguly, S. Morphology and segregation in continuously cast high carbon steel billets. ISIJ Int. 2007, 47, 1759–1766. [Google Scholar] [CrossRef]
- Jernkontoret. A Guide to the Solidification of Steels; Ljungberg Tryckeri: Södertälje, Switzerland, 1977. [Google Scholar]
- Poole, W.J.; Mitchell, A.; Weinberg, F. Inoculating stainless steel with titanium nitride. High Temp. Mater. Process. 1997, 16, 173–182. [Google Scholar] [CrossRef]
- Lekakh, S.N.; Ge, J.; Richards, V.; O’Malley, R.; TerBush, J.R. Optimization of melt treatment for austenitic steel grain refinement. Metall. Mater. Trans. B 2017, 48, 406–419. [Google Scholar] [CrossRef]
- Suzuki, S.; Abiko, K.; Kimura, H. Chemical state of phosphorus segregated at grain boundaries in iron. Trans. Iron Steel Inst. Jpn. 1983, 23, 746–751. [Google Scholar] [CrossRef]
- Holmstrom, L.; Rogberg, B. Reduction of centre porosity and centre segregation by strand and final EMS in stainless and carbon steel blooms. In Proceedings of the 1st European Conference on Continuous Casting, Florence, Italy, 23–25 September 1991; p. 1. [Google Scholar]
- Siafakas, D.; Matsushita, T.; Lauenstein, Å.; Ekengård, J.; Jarfors, A.E.W. The influence of deoxidation practice on the As-cast grain size of austenitic manganese steels. Metals (Basel) 2017, 7, 186. [Google Scholar] [CrossRef]
- Flemings, M.C. Solidification processing. Metall. Trans. 1974, 5, 2121–2134. [Google Scholar] [CrossRef]
- Kirkwood, D.H. A simple model for dendrite arm coarsening during solidification. Mater. Sci. Eng. 1985, 73, L1–L4. [Google Scholar] [CrossRef]
- Okamoto, T.; Kishitake, K.; Murakami, K. Solidification structure and segregation in iron-chromium-nickel alloys. Trans. Iron Steel Inst. Jpn. 1981, 21, 641–648. [Google Scholar] [CrossRef]
- Committee, A.I.H.; Lampman, S.; Moosbrugger, C.; DeGuire, E.; Metals, A.S.F. ASM Handbook: Casting; ASM International: Materials Park, OH, USA, 2008; Volume 15. [Google Scholar]
- Darcy, H.P.G. Les Fontaines Publiques de la Ville de Dijon. Exposition et Application Des Principes à Suivre et Des Formules à Employer Dans Les Questions de Distribution D’eau; Victor Dalamont: Paris, France, 1856. [Google Scholar]
- Tiryakioğlu, M. On the permeability of columnar dendritic networks in solidifying metals. Mater. Sci. Technol. 2019, 35, 632–636. [Google Scholar] [CrossRef]
- Minakawa, S.; Samarasekera, I.V.; Weinberg, F. Centerline porosity in plate castings. Metall. Trans. B 1985, 16, 823–829. [Google Scholar] [CrossRef]



| Component | Ni | Cr | Ti | Mn | Mo | Si | V | Al | Cu | P | C | Fe |
|---|---|---|---|---|---|---|---|---|---|---|---|---|
| wt % | 24.4 | 14.5 | 2.13 | 1.29 | 1.18 | 0.21 | 0.20 | 0.19 | 0.17 | 0.018 | 0.04 | bal. |
| Composition in at % | C | Si | P | Ti | Cr | Mn | Fe | Ni | Mo |
|---|---|---|---|---|---|---|---|---|---|
| 1-Nickel rich bright grey phase | - | 0.27 | - | 20.8 | 2.86 | 0.71 | 15.8 | 59.05 | - |
| 2-Phosphorous rich dark grey phase | - | 1.02 | 18.2 | 36.3 | 5.37 | - | 24.1 | 9.78 | 0.55 |
| 3-Titanium rich black phase | 33.7 | 0.09 | - | 58 | 1.24 | - | 2.79 | 1.61 | 2.51 |
| Composition in at % | C | Si | P | Ti | Mo | Ni | Cr | Fe | S |
|---|---|---|---|---|---|---|---|---|---|
| 1-TiC | 63.9 | - | - | 34.5 | 1.4 | - | - | - | - |
| 2-Phospide | 35.5 | 1.0 | 11.3 | 20.1 | - | 14.6 | 2.7 | 13.2 | 1.0 |
| Distance | Ti | Mo | Ni | Mn | Cr |
|---|---|---|---|---|---|
| 15 mm | 2.3 | 1.7 | 1.1 | 1.2 | 1.0 |
| 60 mm | 3.9 | 1.6 | 1.3 | 1.4 | 0.9 |
| Casting Speed [m/min] | TL [°C] | TS [°C] | Tsurface [°C] | ksolid/kliquid [W/(m*K)] | ΔH [kJ/kg] | cp, solid/cp, liquid [J/(kg*K)] |
|---|---|---|---|---|---|---|
| 2 | 1387 | 1270 | 1000 | * 30/26 | * 260 | * 0.55/0.72 |
| Shrinkage β | VL [m/s] | λ1 [μm] | Dynamic Viscosity [kg/m·s] |
|---|---|---|---|
| 0.03 | 364 | 0.005 |
© 2019 by the authors. Licensee MDPI, Basel, Switzerland. This article is an open access article distributed under the terms and conditions of the Creative Commons Attribution (CC BY) license (http://creativecommons.org/licenses/by/4.0/).
Share and Cite
Frisk, R.; Andersson, N.Å.I.; Rogberg, B. Cast Structure in Alloy A286, an Iron-Nickel Based Superalloy. Metals 2019, 9, 711. https://doi.org/10.3390/met9060711
Frisk R, Andersson NÅI, Rogberg B. Cast Structure in Alloy A286, an Iron-Nickel Based Superalloy. Metals. 2019; 9(6):711. https://doi.org/10.3390/met9060711
Chicago/Turabian StyleFrisk, Robin, Nils Å. I. Andersson, and Bo Rogberg. 2019. "Cast Structure in Alloy A286, an Iron-Nickel Based Superalloy" Metals 9, no. 6: 711. https://doi.org/10.3390/met9060711
APA StyleFrisk, R., Andersson, N. Å. I., & Rogberg, B. (2019). Cast Structure in Alloy A286, an Iron-Nickel Based Superalloy. Metals, 9(6), 711. https://doi.org/10.3390/met9060711


