Article

Resistance Spot Welding of SUS316L Austenitic/SUS425 Ferritic Stainless Steels: Weldment Characteristics, Mechanical Properties, Phase Transformation and Solidification

by
Teerawut Khuenkaew
and
Kannachai Kanlayasiri
*
Department of Industrial Engineering, Faculty of Engineering, King Mongkut’s Institute of Technology Ladkrabang, Bangkok 10520, Thailand
*
Author to whom correspondence should be addressed.
Metals 2019, 9(6), 710; https://doi.org/10.3390/met9060710
Submission received: 9 May 2019 / Revised: 29 May 2019 / Accepted: 30 May 2019 / Published: 24 June 2019

Abstract

:
This research examines the weldment characteristics and mechanical properties of lap joints of SUS316L/SUS425 stainless steels using resistance spot welding under variable weld currents and welding times. The weld current was varied between 7.0, 8.5, and 10.0 kA, and the welding time between 25, 38, and 50 cycles. The weldment quality characteristics under study were the depth of fusions, indentation depths, and nugget diameter, and the mechanical properties included the tensile shear force (TSF) and micro Vickers hardness. Phase transformation and solidification were characterized using scanning electron microscopy and energy dispersive X-ray spectrometry, together with Schaeffler and pseudo-binary predictive phase diagrams. The results revealed that the weldment quality was positively correlated with weld current and welding time, as were the TSF and micro hardness. The optimal welding condition was achieved under a 10.0 kA weld current and 25-cycle welding time. Under the optimal condition, the fusion zone exhibited compression-direction columnar grains consisting of austenite, ferrite, and martensite and the solidification was of ferrite plus Widmanstatten austenite.

1. Introduction

Resistance spot welding (RSW) is commonly used in the automotive, aviation, and manufacturing sectors because of its simplicity, automatability, ease of maintenance, and cost-effectiveness [1,2,3]. Specifically, in the automotive industry, dissimilar ferritic and austenitic stainless steel grades are widely utilized in exhaust pipes due to their attractive appearance, weldability, and corrosion-resistance [4]. More specifically, sections of the exhaust subjected to lower temperatures are made of ferritic stainless steel, while those exposed to high temperatures are made of austenitic stainless steel. Applying RSW to dissimilar stainless steel grades renders the weld nugget prone to cracking due to high heat input, and the likelihood is multiplied if unsuited electrode caps are used, causing accumulative residual stress [4,5]. In the automotive sector, solidification cracking normally develops in the welding of stainless steels with different metallurgical, physical, and mechanical properties [6], leading to excessive noise, vibration, and compromised strength [7].
Liu et al. [8] investigated the RSW microstructure and mechanical performance of austenite stainless CRHS301LN and reported martensite transformation at interfacial fractures. Specifically, martensite induced weldment fatigue and subsequent fractures. Moshayedi and Sattari-Far [9] investigated the effect of weld current and welding time on the RSW quality of AISI304 stainless steel, and reported that weld current and welding time were positively correlated with nugget size, with the weld current playing a more dominant role. In addition, the magnitude of residual stress in the inner nugget was greater than that in the outer one, and the residual stress was inversely correlated with the weld current and welding time. Jagadeesha [10] studied the effect of weld current and welding time on the ultimate tensile shear strength of RSW of AISI316L of 1.6 mm in thickness; and reported two failure modes: tearing for larger weld nuggets and shearing for smaller ones. Kianersi et al. [5] optimized the RSW parameters of AISI316L stainless steel in terms of nugget size, mechanical properties, and phase transformation. Alizadeh-Sh et al. [11] documented the relationship between the RSW thermal cycle of AISI430 stainless steel and the microstructure, mechanical properties, and phase transformation of weldments. Vignesh et al. [12] proposed the optimal RSW welding parameters for AISI316L/2205 duplex stainless steels and reported the presence of ferrite in the heat affected zone of both materials. Bina et al. [13] reported that an elevated weld current for RSW of AISI430/AISI304 stainless steels increased the weld nugget dimension and weldment strength. The weldment however suffered from the pullout failure mode. Essoussi et al. [14] reported mechanical performance for austenite AISI 304(ASS) and ferrite AISI 1000 steel grade (FS), and the three patterns of weldment of RSW (ASS/ASS, ASS/FS, FS/FS) which were found to have the highest tensile shear strength were ASS/ASS, ASS/FS and FS/FS respectively, and the failure mode depended on the nugget size and morphology. Alenius et al. [15] studied the mechanical properties of RSW dissimilar joints for austenite stainless/galvanized steels, and reported that the presence of full martensite in the weld nugget the strength of spot weld joints depends on the strength and thickness of the base material. Sun et al. [16] investigated the effects of the fusion zone size on the failure modes, static strength and energy absorption for RSW of DP800/TRIP800 under a lap shear loading condition. The study showed that fusion zone size is the most critical factor in weld quality.
Despite numerous publications on the effect of heat input on the RSW of dissimilar stainless steels, research on the microstructure and solidification of RSW weldment, particularly in the fusion zone, is limited. This fact could be attributed to measurement challenges inherent in the RSW of two stainless steels with diverse physical and mechanical properties, in addition to the rapid cooling rates of the RSW technology.
Thus, this research investigates the weldment quality and mechanical properties of lap joints of dissimilar SUS316L and SUS425 stainless steels using RSW under variable weld currents and welding times. The weldment quality characteristics included the depth of fusions, indentation depths, and nugget diameter and the mechanical properties under study were TSF and micro hardness. The weldment characteristics were determined by optical microscopy, TSF by a universal testing machine, and the micro hardness by a Vickers hardness tester. In addition, the microstructure analysis of weldments was carried out to characterize phase transformation and solidification.

2. Materials and Methods

2.1. Materials and Welding Process

The base metals were SUS316L and SUS425 stainless steel sheets of 1.5 mm thickness. Table 1, Table 2 and Table 3 respectively tabulate the chemical composition, mechanical and physical properties of the base metals. The base metals were individually cut into plates of 125 mm x 40 mm (LxW) in dimension and lap jointed according to the JIS Z3139 standard. The weld configuration was SUS316L on top of a SUS425 specimen and spot-welded using a 50 kVA AC, 50 Hz RSW machine, with a pair of CrCuZr alloy electrode caps with a 13 mm outer diameter and 30 mm radius. In the experiment, the weld current was varied between 7.0, 8.5, and 10.0 kA and the welding time varied between 25, 38, and 50 cycles (1 cycle = 0.02 s). Meanwhile, the electrode force, squeeze time, holding time, and weld atmosphere remained constant (Table 4).

2.2. Metallographic Assessment

After spot welding, the lap joint was cross-sectioned in a transverse direction. The sectioned specimen was prepared in accordance with the ASTM E407-99 standard. The five quality metrics of weldment were measured by optical microscopy (OM, Keyence VHX-600, Wanaque, NJ, USA) and the schematic is shown in Figure 1. The microstructures of the weld nuggets were respectively characterized by optical microscopy and scanning electron microscopy (SEM, Jeol JSM-6510LV, Tokyo, Japan). Energy dispersive X-ray spectrometry (EDS, Oxford X-Max IE350, High Wycombe, UK) was utilized to investigate the chemical composition. The micro hardness profile of weldment (i.e., the base metals, heat affected zone, and fusion zone) was determined using a Vickers hardness tester (Future tech FV-700, Kanagawa, Japan) with a load of 50 g for 10 s. The TSFs of lap joints were assessed by a universal testing machine (SHIMADZU Ag-100, Kyoto, Japan) with a travel speed of 10 mm min−1.

3. Results and Discussion

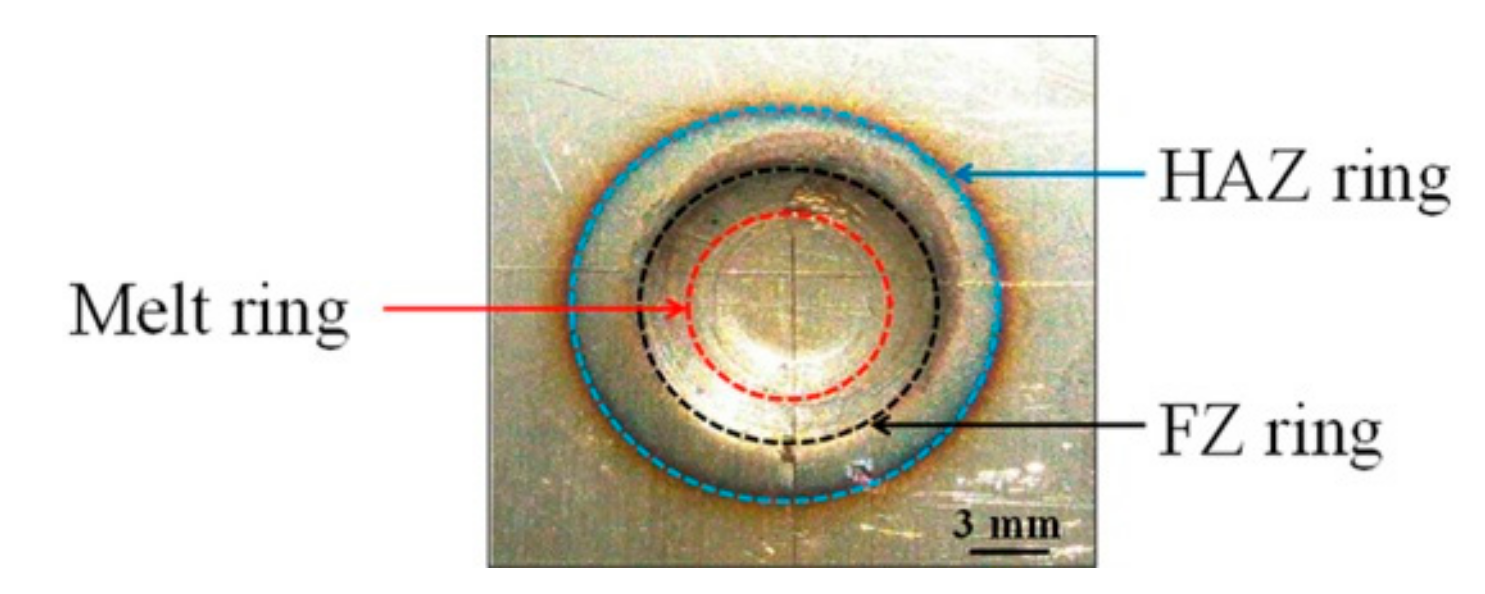
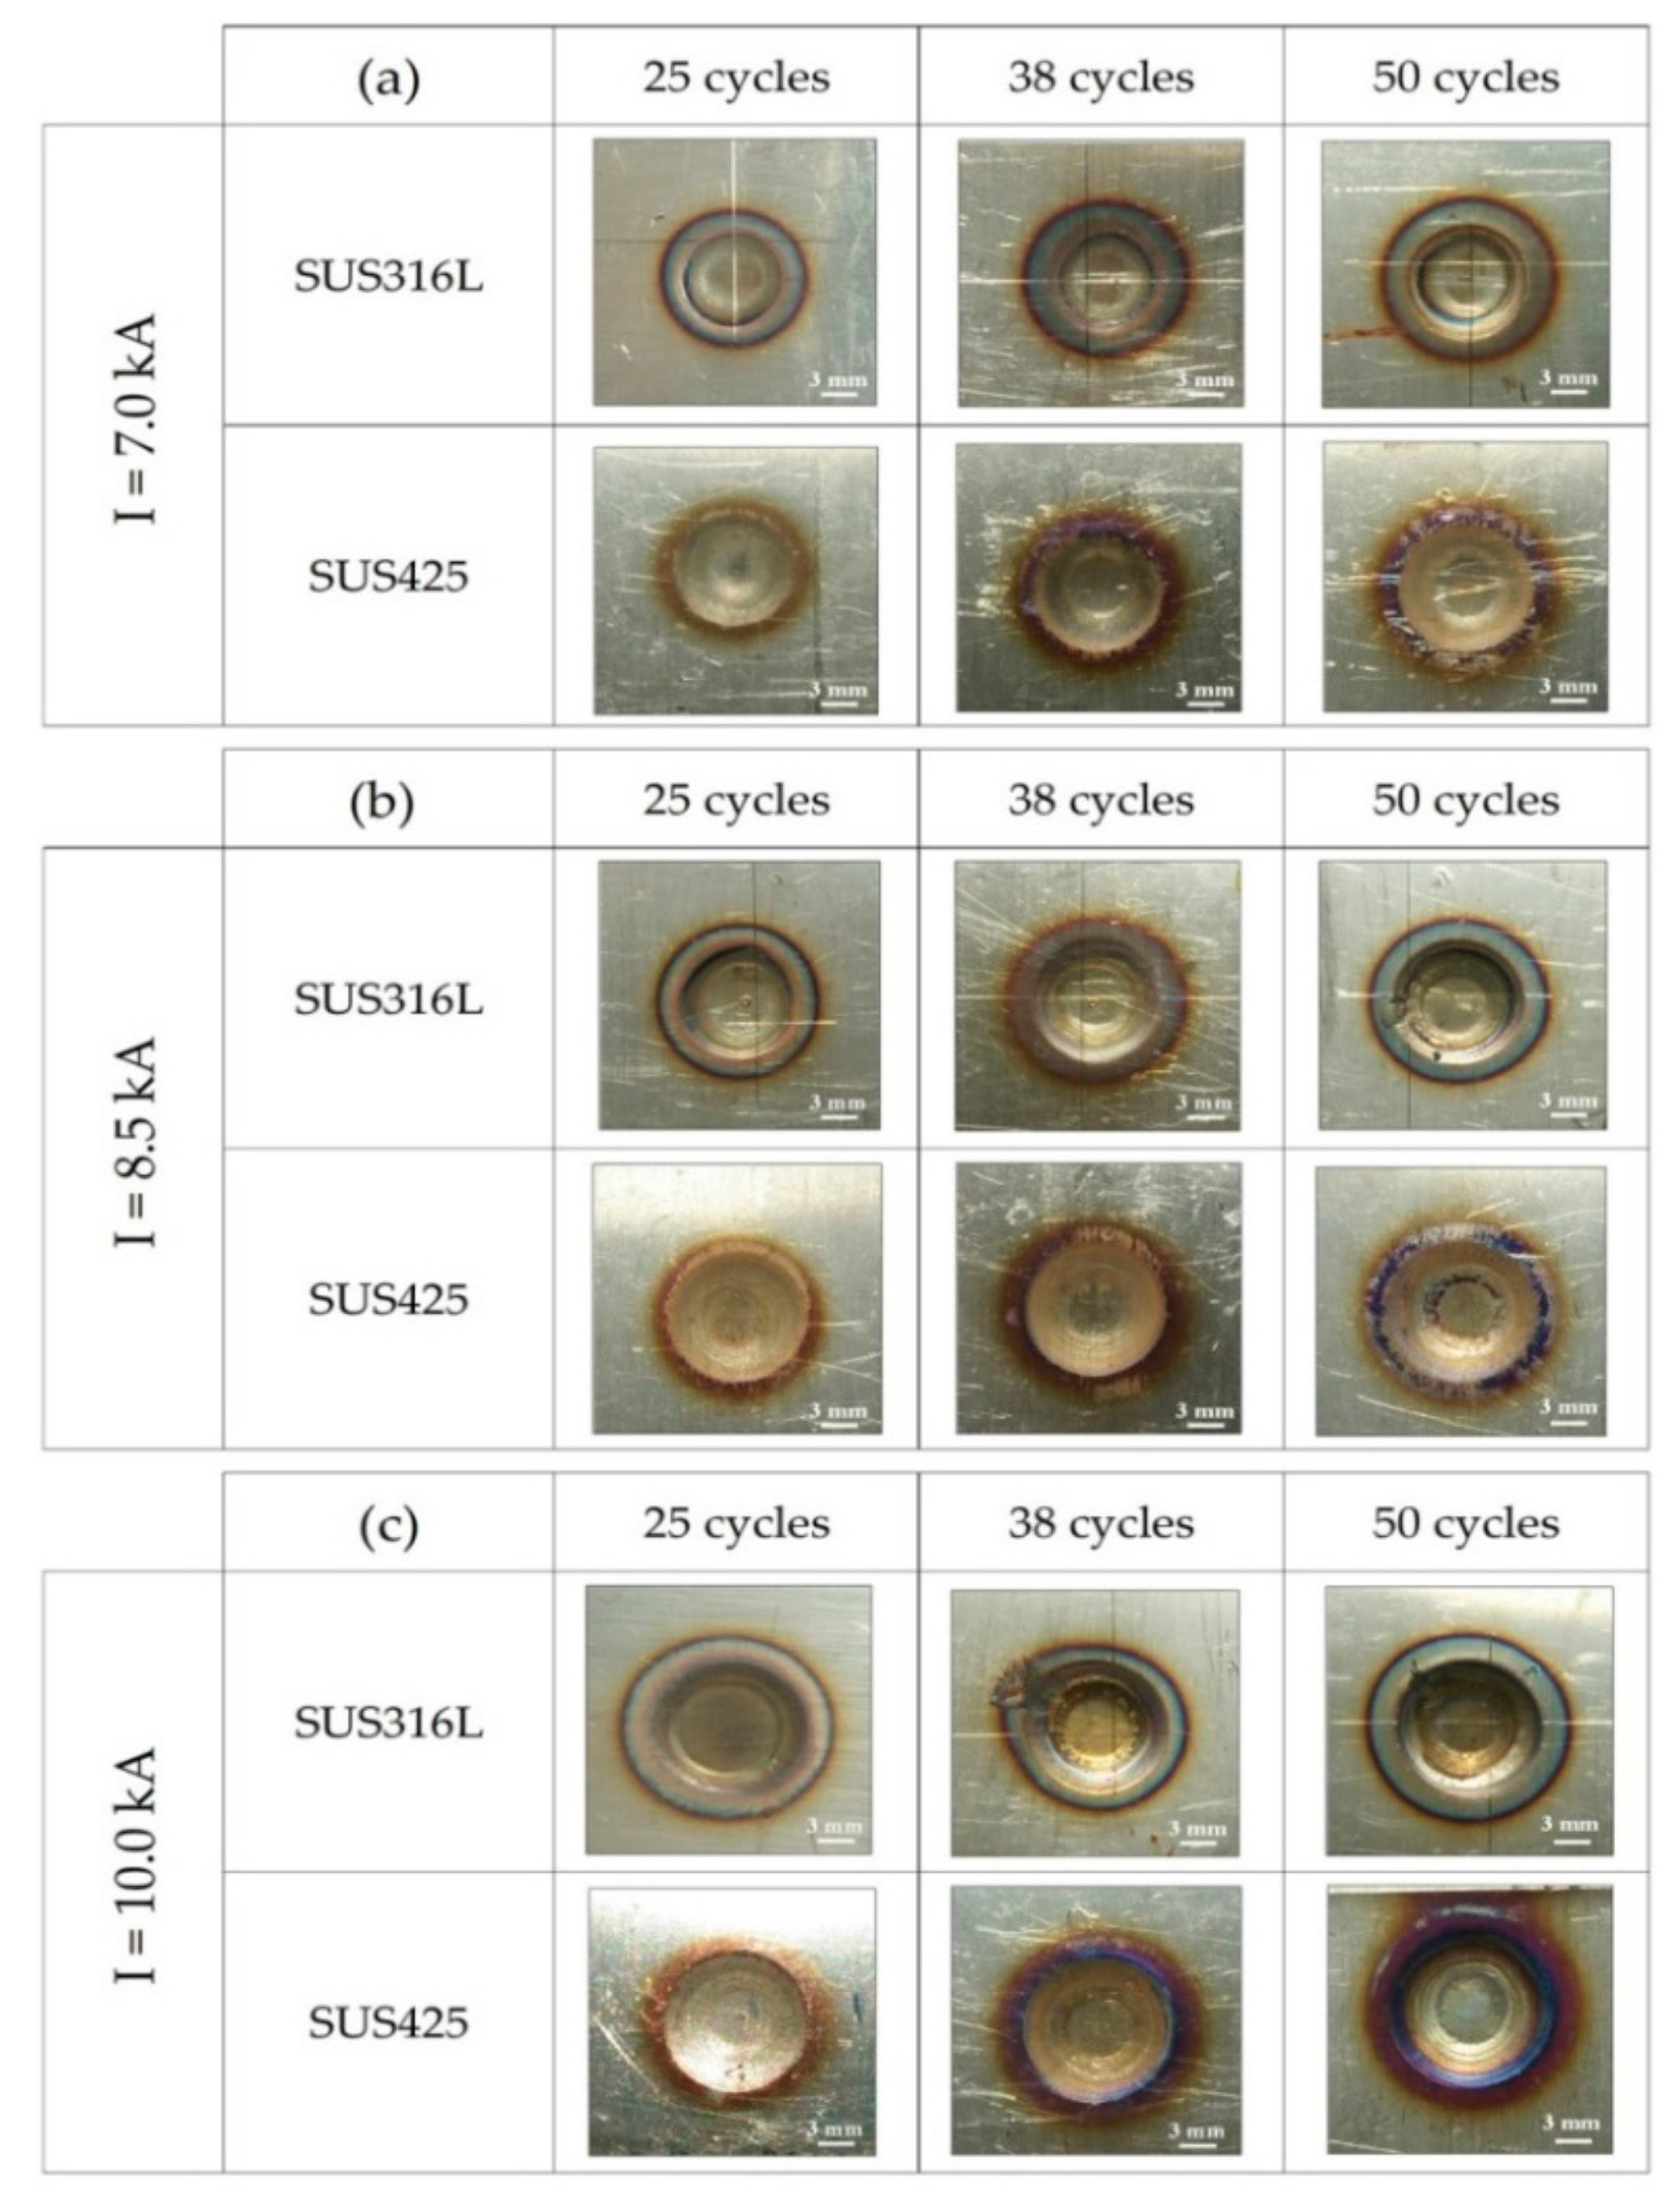
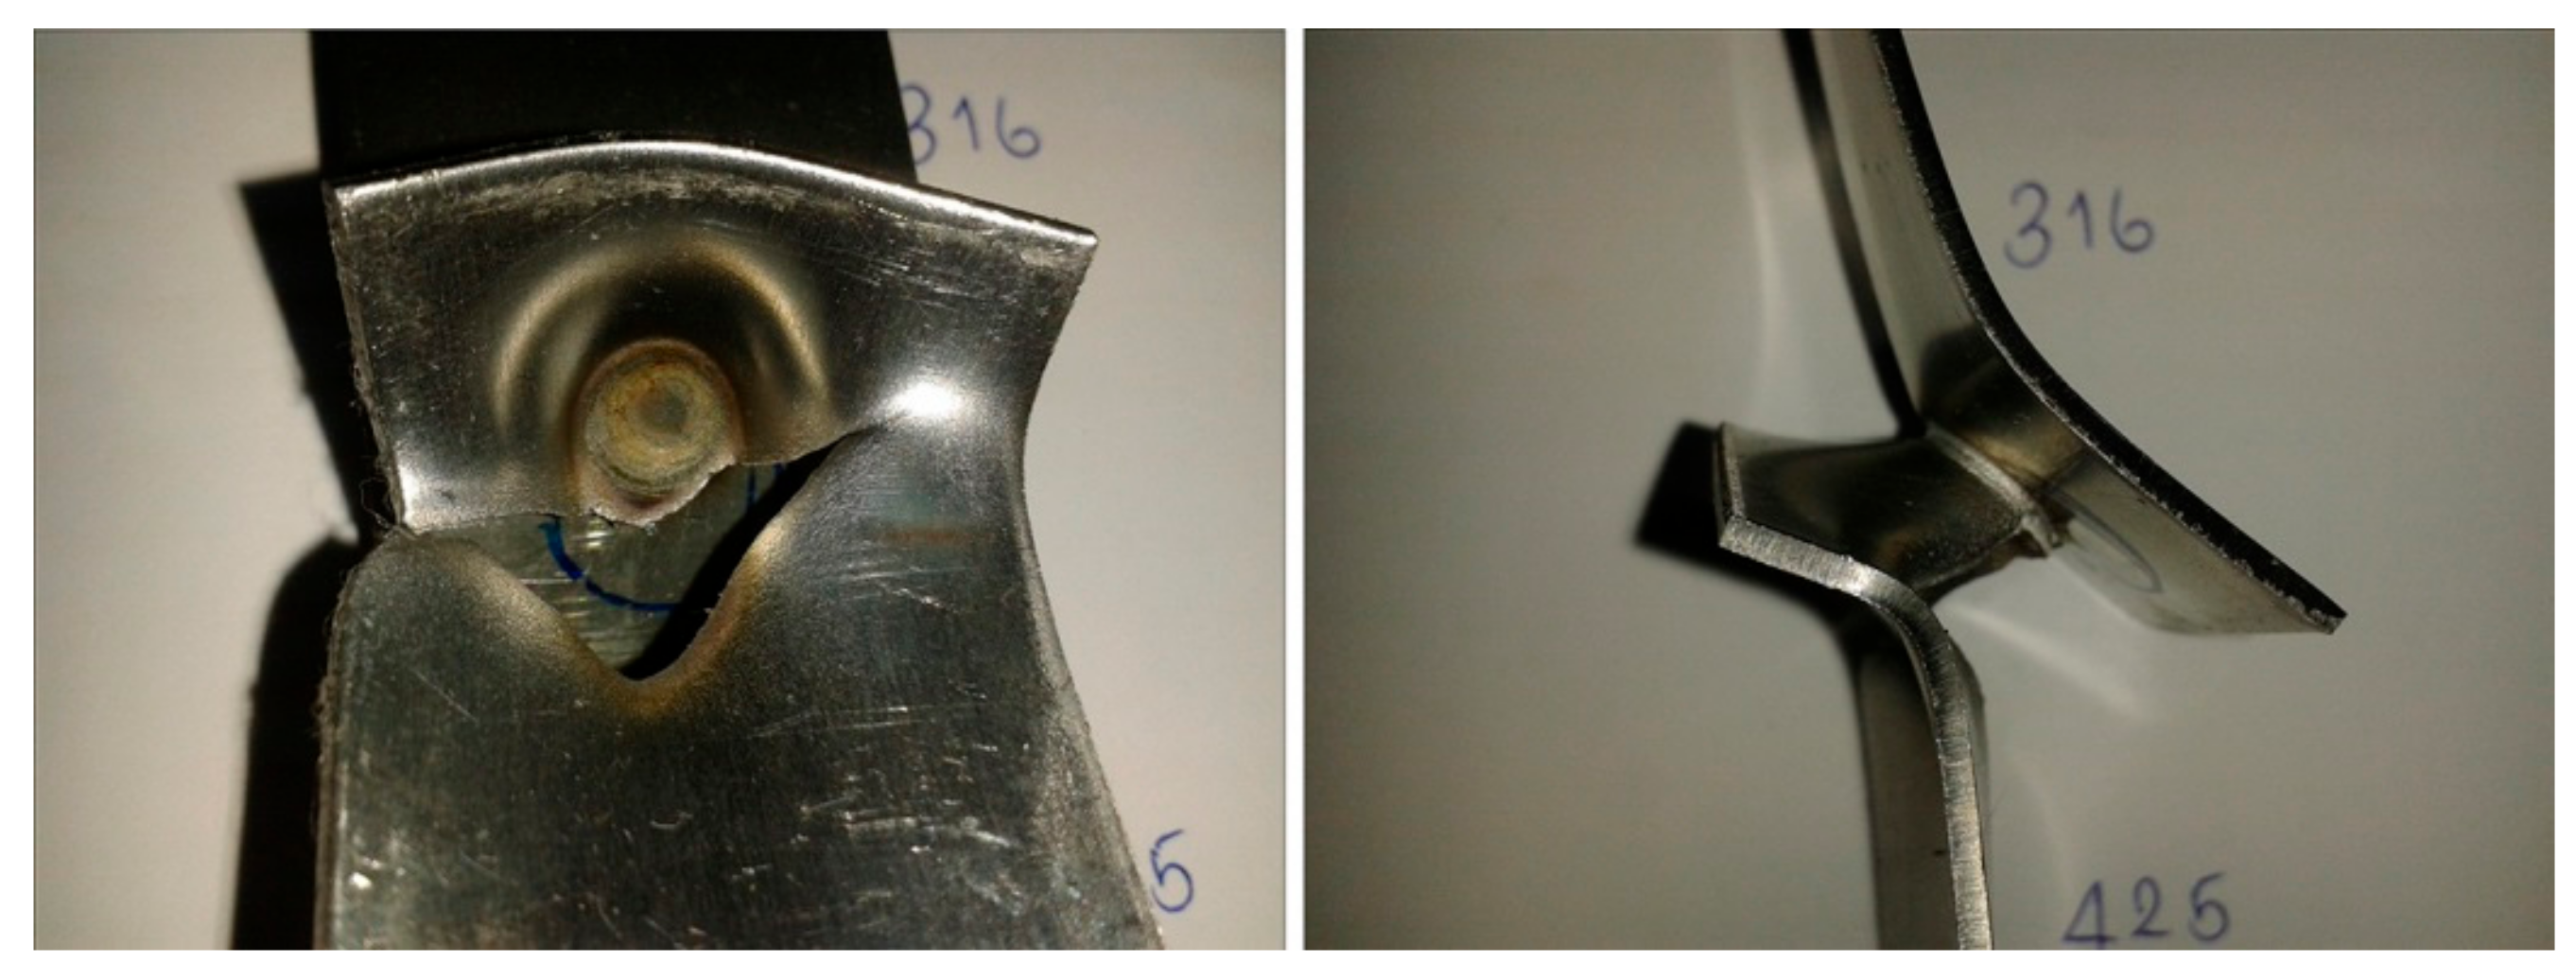
3.1. Weldment Appearance

Figure 2 illustrates the visual appearance of the SUS316L/SUS425 resistance spot welded joint, consisting of three rings: the melt ring, fusion zone (FZ) ring, and heat affected zone (HAZ) ring.
Figure 3a–c respectively illustrates the visual appearances of SUS316L/SUS425 lap joints under 7.0, 8.5, and 10.0 kA weld currents, given 25, 38, and 50-cycle welding times. Ideally, the appearance of a spot weld should be relatively smooth, round or oval, and free from expulsion, electrode deposit pits and cracking [17]. The color of the lap joints varied, depending on weld current and time [18]. Specifically, with elevated weld current and time, the welding appearance exhibited a canary yellow color due to excessive thermal energy. In the figure, the joint appearance was generally enhanced with the increase of weld current and time, except the 8.5 kA/50-cycle, 10.0 kA/38-cycle, and 10.0 kA/50-cycle conditions, where expulsion and electrode deposit pits were observed on the SUS316L side which was attributable to the high heat input. In addition, the diameters of the three rings (the melt, HAZ, and FZ rings) were positively correlated with the weld current and time.

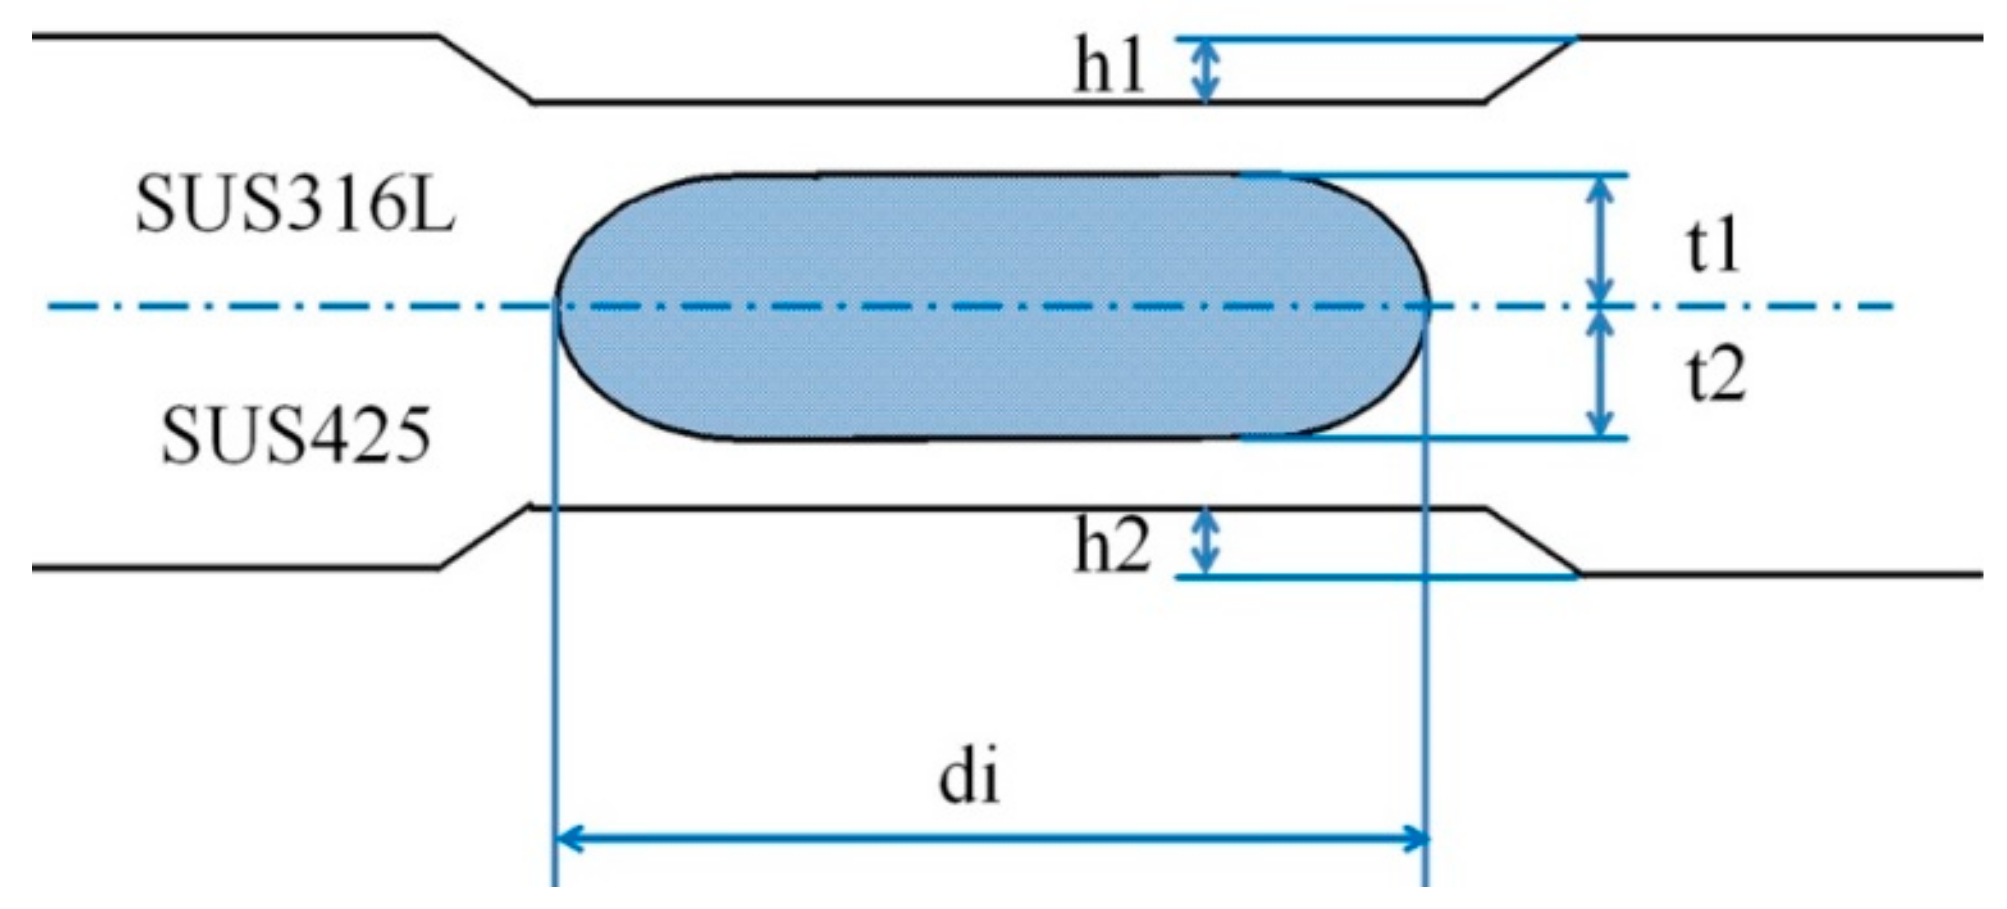
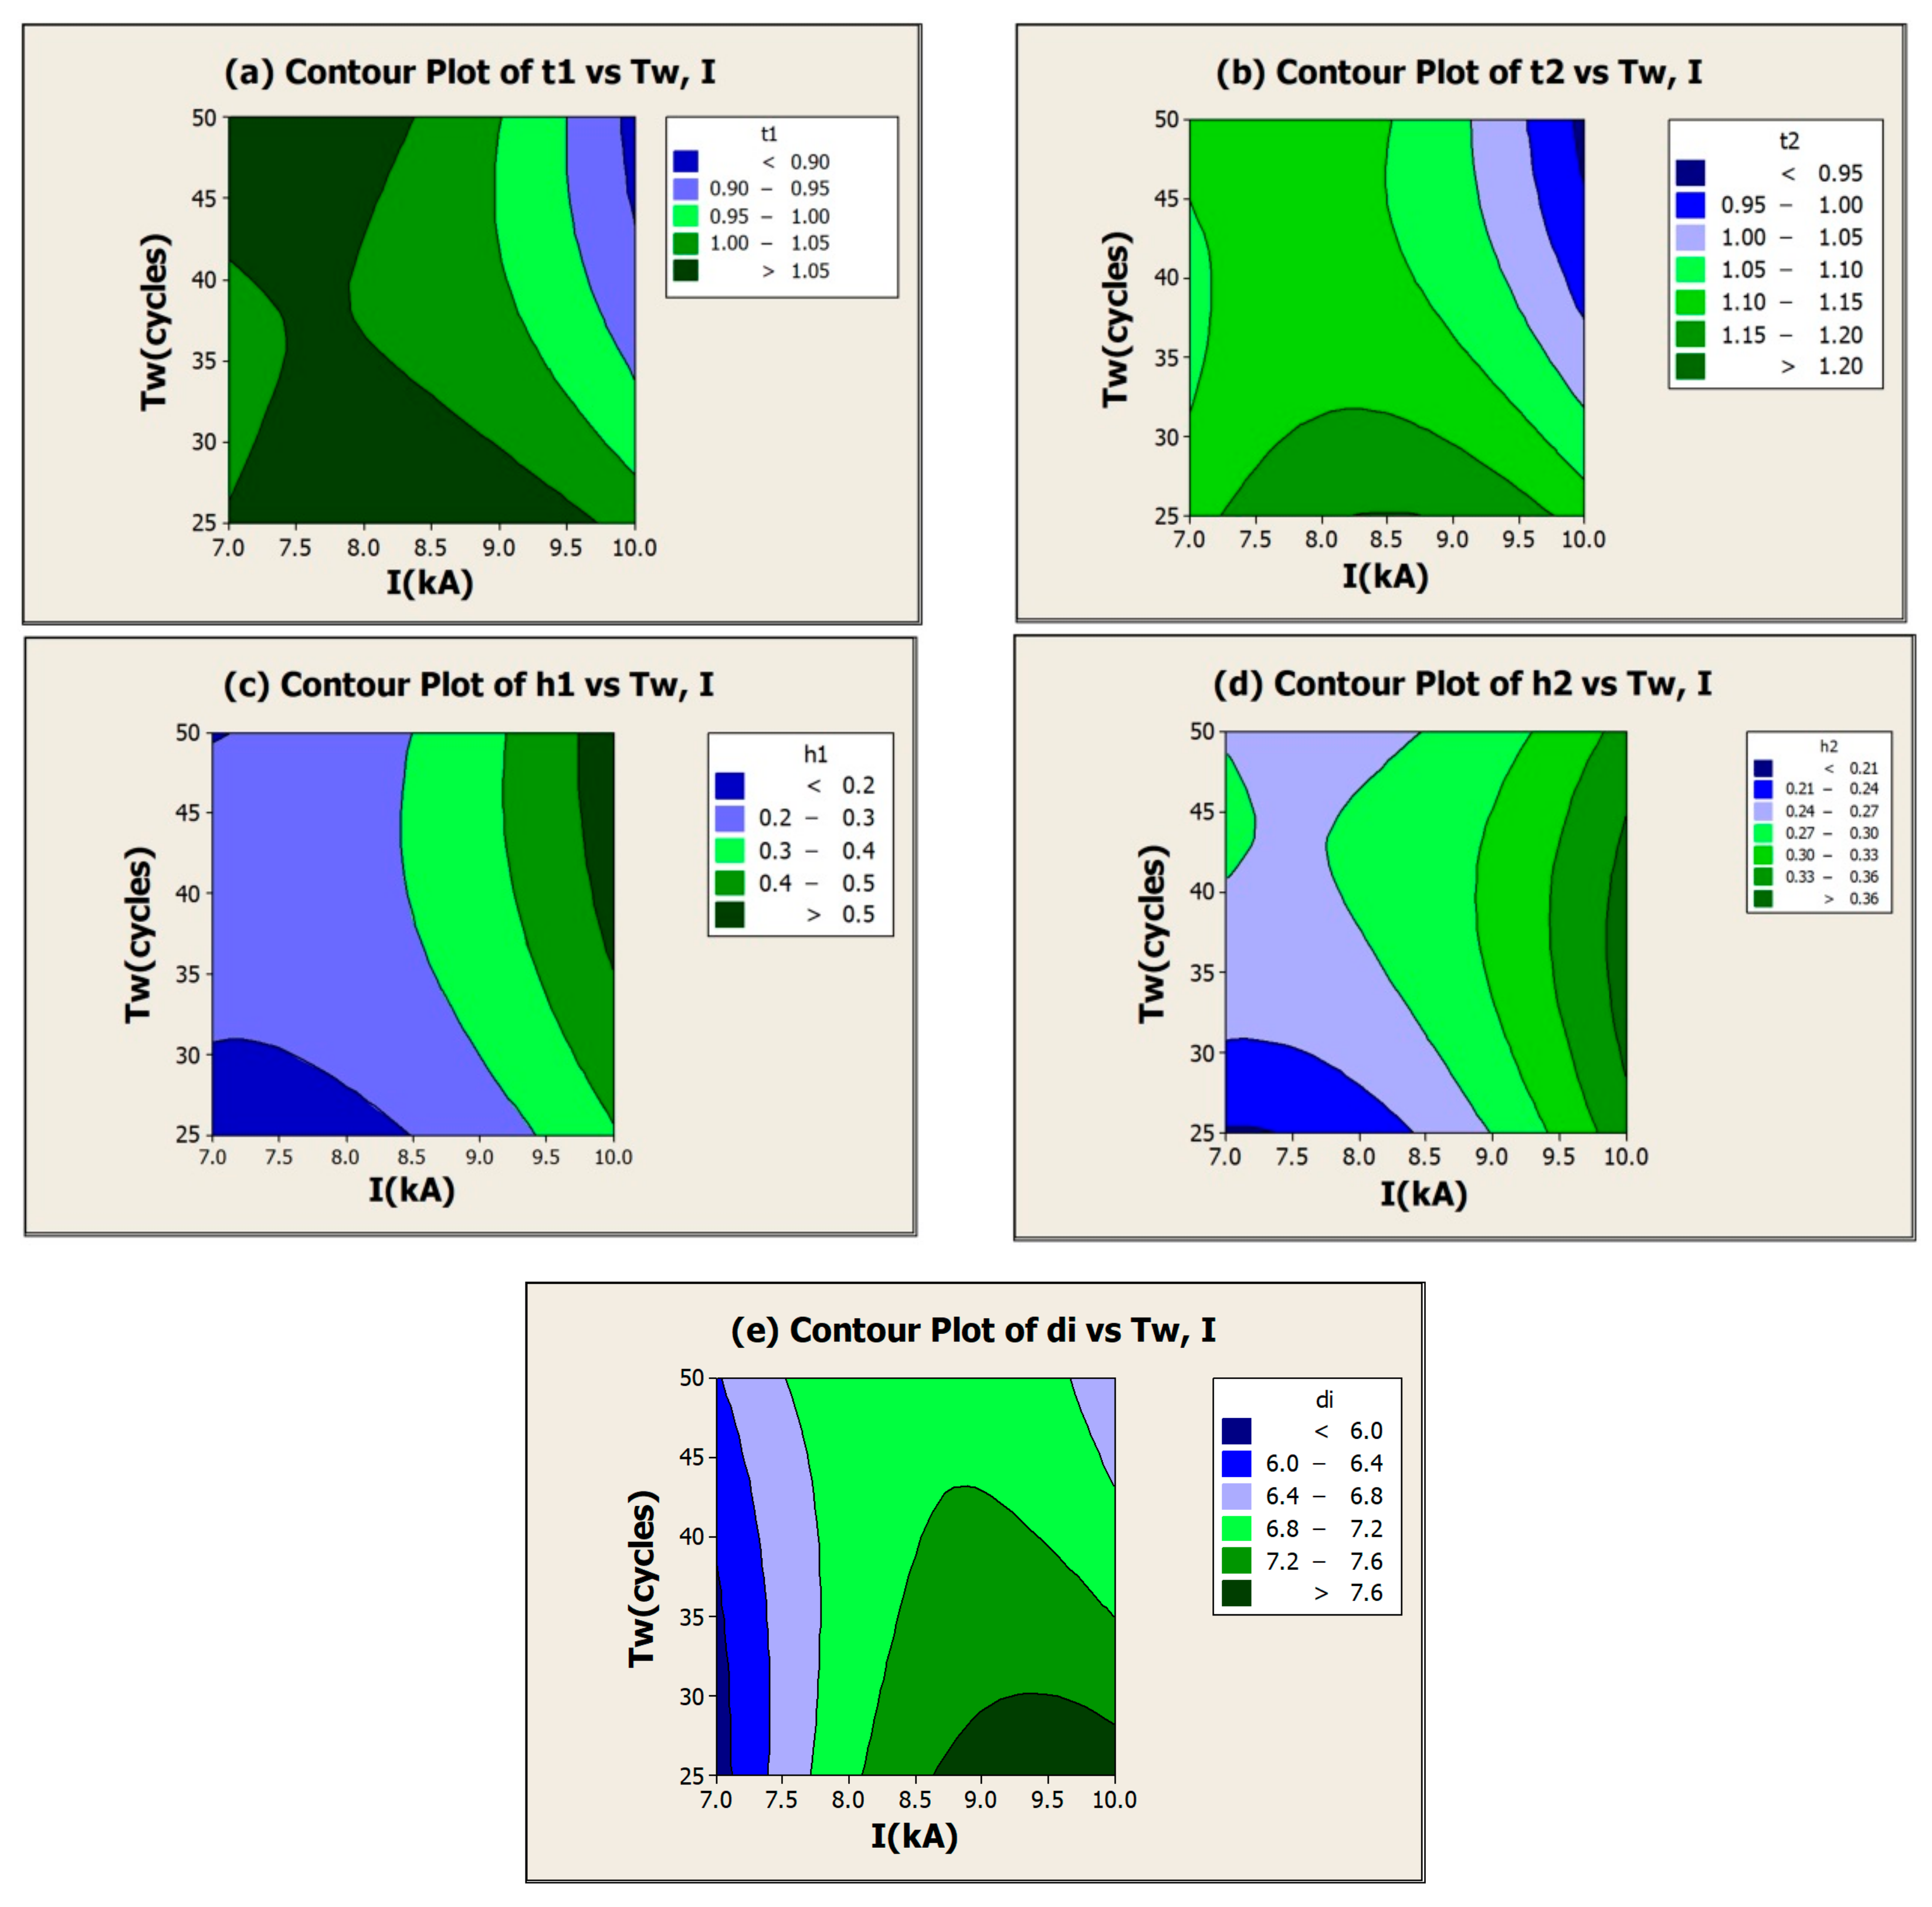
3.2. Weldment Quality Metrics

Figure 4 illustrates the macrostructure of SUS316L/SUS425 RSW joints under 7.0, 8.5, and 10.0 kA weld currents, given 25, 38, and 50-cycle welding times. The weldment quality was assessed by five quality metrics: depth of fusion (t1, t2), indentation depth (h1, h2), and nugget diameter (di). Each test was repeated three times and the average value was reported. As per JIS Z3140, the lap-joint depth of fusion and indentation depth should be 20%–80% (0.3–1.2 mm) and less than 30% (<0.45 mm) of the thickness of the thinner material, respectively, and the nugget diameter should be larger than 5.2 mm. In the figure, the weldment quality generally improved with increases in the weld current and time, except under 8.5 kA/50-cycle (Figure 4f), 10.0 kA/38-cycle (Figure 4h), and 10.0 kA/50-cycle conditions (Figure 4i).
Table 5 illustrates the experimental results on the depth of fusions (t1, t2), indentation depths (h1, h2), and nugget diameter (di) of SUS316L/SUS425 weldments. Figure 5a–e respectively illustrate the contour plots of the effect of the weld current and welding time. The optimal operating condition for each quality metric could be selected from the contour plot. However, the optimal operating condition for each quality metric was not similar. The multi-objective optimization for all quality metrics is shown in Section 3.5 of this paper. It should be noted that, in comparison, the SUS425 depth of fusion was deeper due to lower hardness, tensile strength, and elongation [18] and for h1 and h2, the heat input induced an expansion in the workpiece dimension, whereby the magnitude depended on the type of metal [14]. Specifically, the SUS316L thermal expansion was greater than that of SUS425, while the thermal conductivity was lower, resulting in greater t2 and h2 on the SUS425 side. In this current research, the occurrence of weldment expulsion was observed, which was attributable to excessive thermal energy. The expulsion increased the indentation depth and decreased the depth of fusion. For the nugget size, by comparison, the weld current played a more decisive role in the nugget diameter. In addition, the electrical resistivities of base metals influenced the weldment quality, whereby greater electrical resistivity required a greater thermal input. Specifically, the electrical resistivity of SUS316L at 20 °C (75 μΩ·m) is greater than SUS425 (61 μΩ·m).

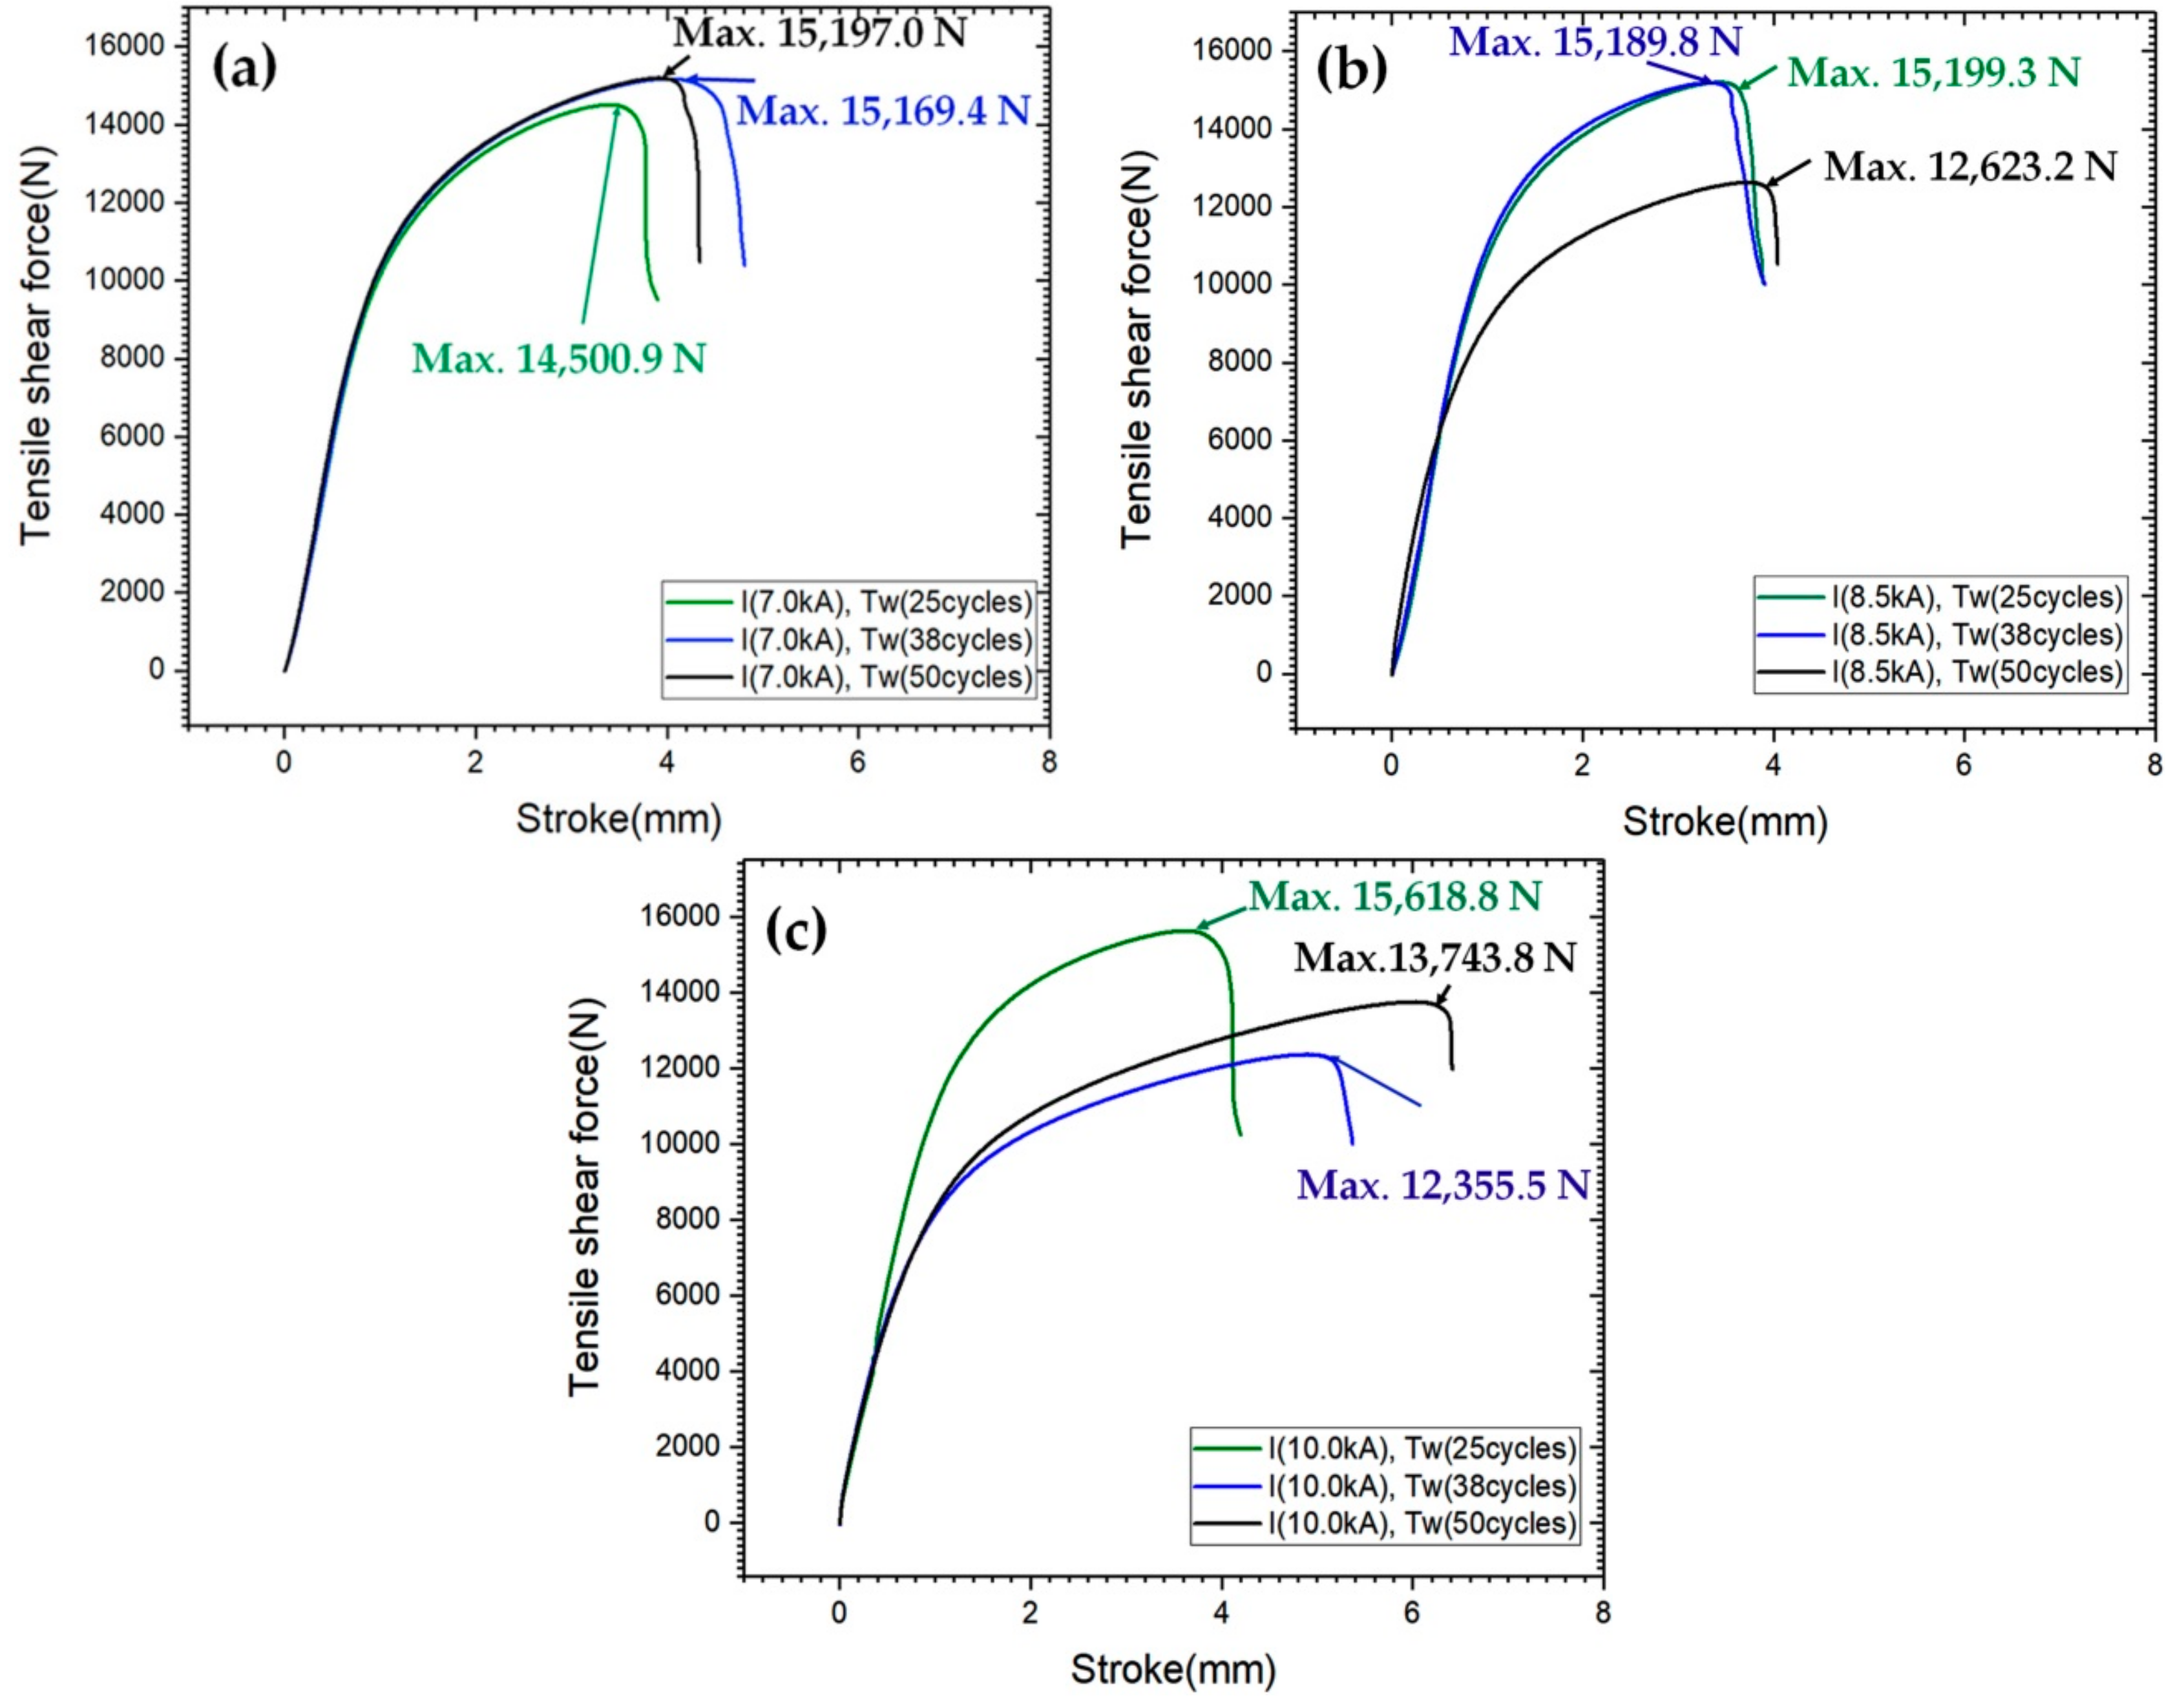
3.3. Tensile Shear Force

Test specimens were prepared according to JIS Z3139, and, according to JIS Z3140, the tensile shear force for a metal sheet of 1.5 mm thickness should be greater than 7650 N. Figure 6a–c respectively illustrate the average value of the tensile shear force of lap joints at 7.0, 8.5, and 10.0 kA weld currents, given 25, 38, and 50-cycle welding times. In Figure 6a, under 7.0 kA weld current, TSF increased with the increase in welding time. In other words, the TSF and welding time, given a 7.0 kA weld current, were positively correlated. In Figure 6b, at 8.5 kA, the TSFs were almost identical (15,200 N) for 25- and 38-cycle welding times but decreased under an elevated welding time (50 cycles). In Figure 6c, under a 10.0 kA weld current, the maximum TSF (15,618.8 N) was achieved at a 25-cycle welding time and decreased with the increase in the welding time. In essence, TSF is governed by the weld current and welding time. Specifically, elevated heat input increased the nugget size and TSF [13,19]. However, excessive heat input induced expulsion, thereby decreasing nugget size and nugget strength [20]. In this current research, TSF associated with all experimental conditions satisfied the JIS Z3140 threshold (>7650 N). Meanwhile, the optimal TSF (15,618.8 N) was achieved under a 10.0 kA weld current and 25-cycle welding time.
Figure 7 illustrates the surface fracture of the pullout failure mode. The fracture failure occurred in all experimental conditions and was initiated from the HAZ on the SUS425 side. The fracture was attributable to the counteraction between stress and tensile force [21] and the low hardness of SUS425. In contrast, no fracture developed on the SUS316L side due to high tensile strength [13].

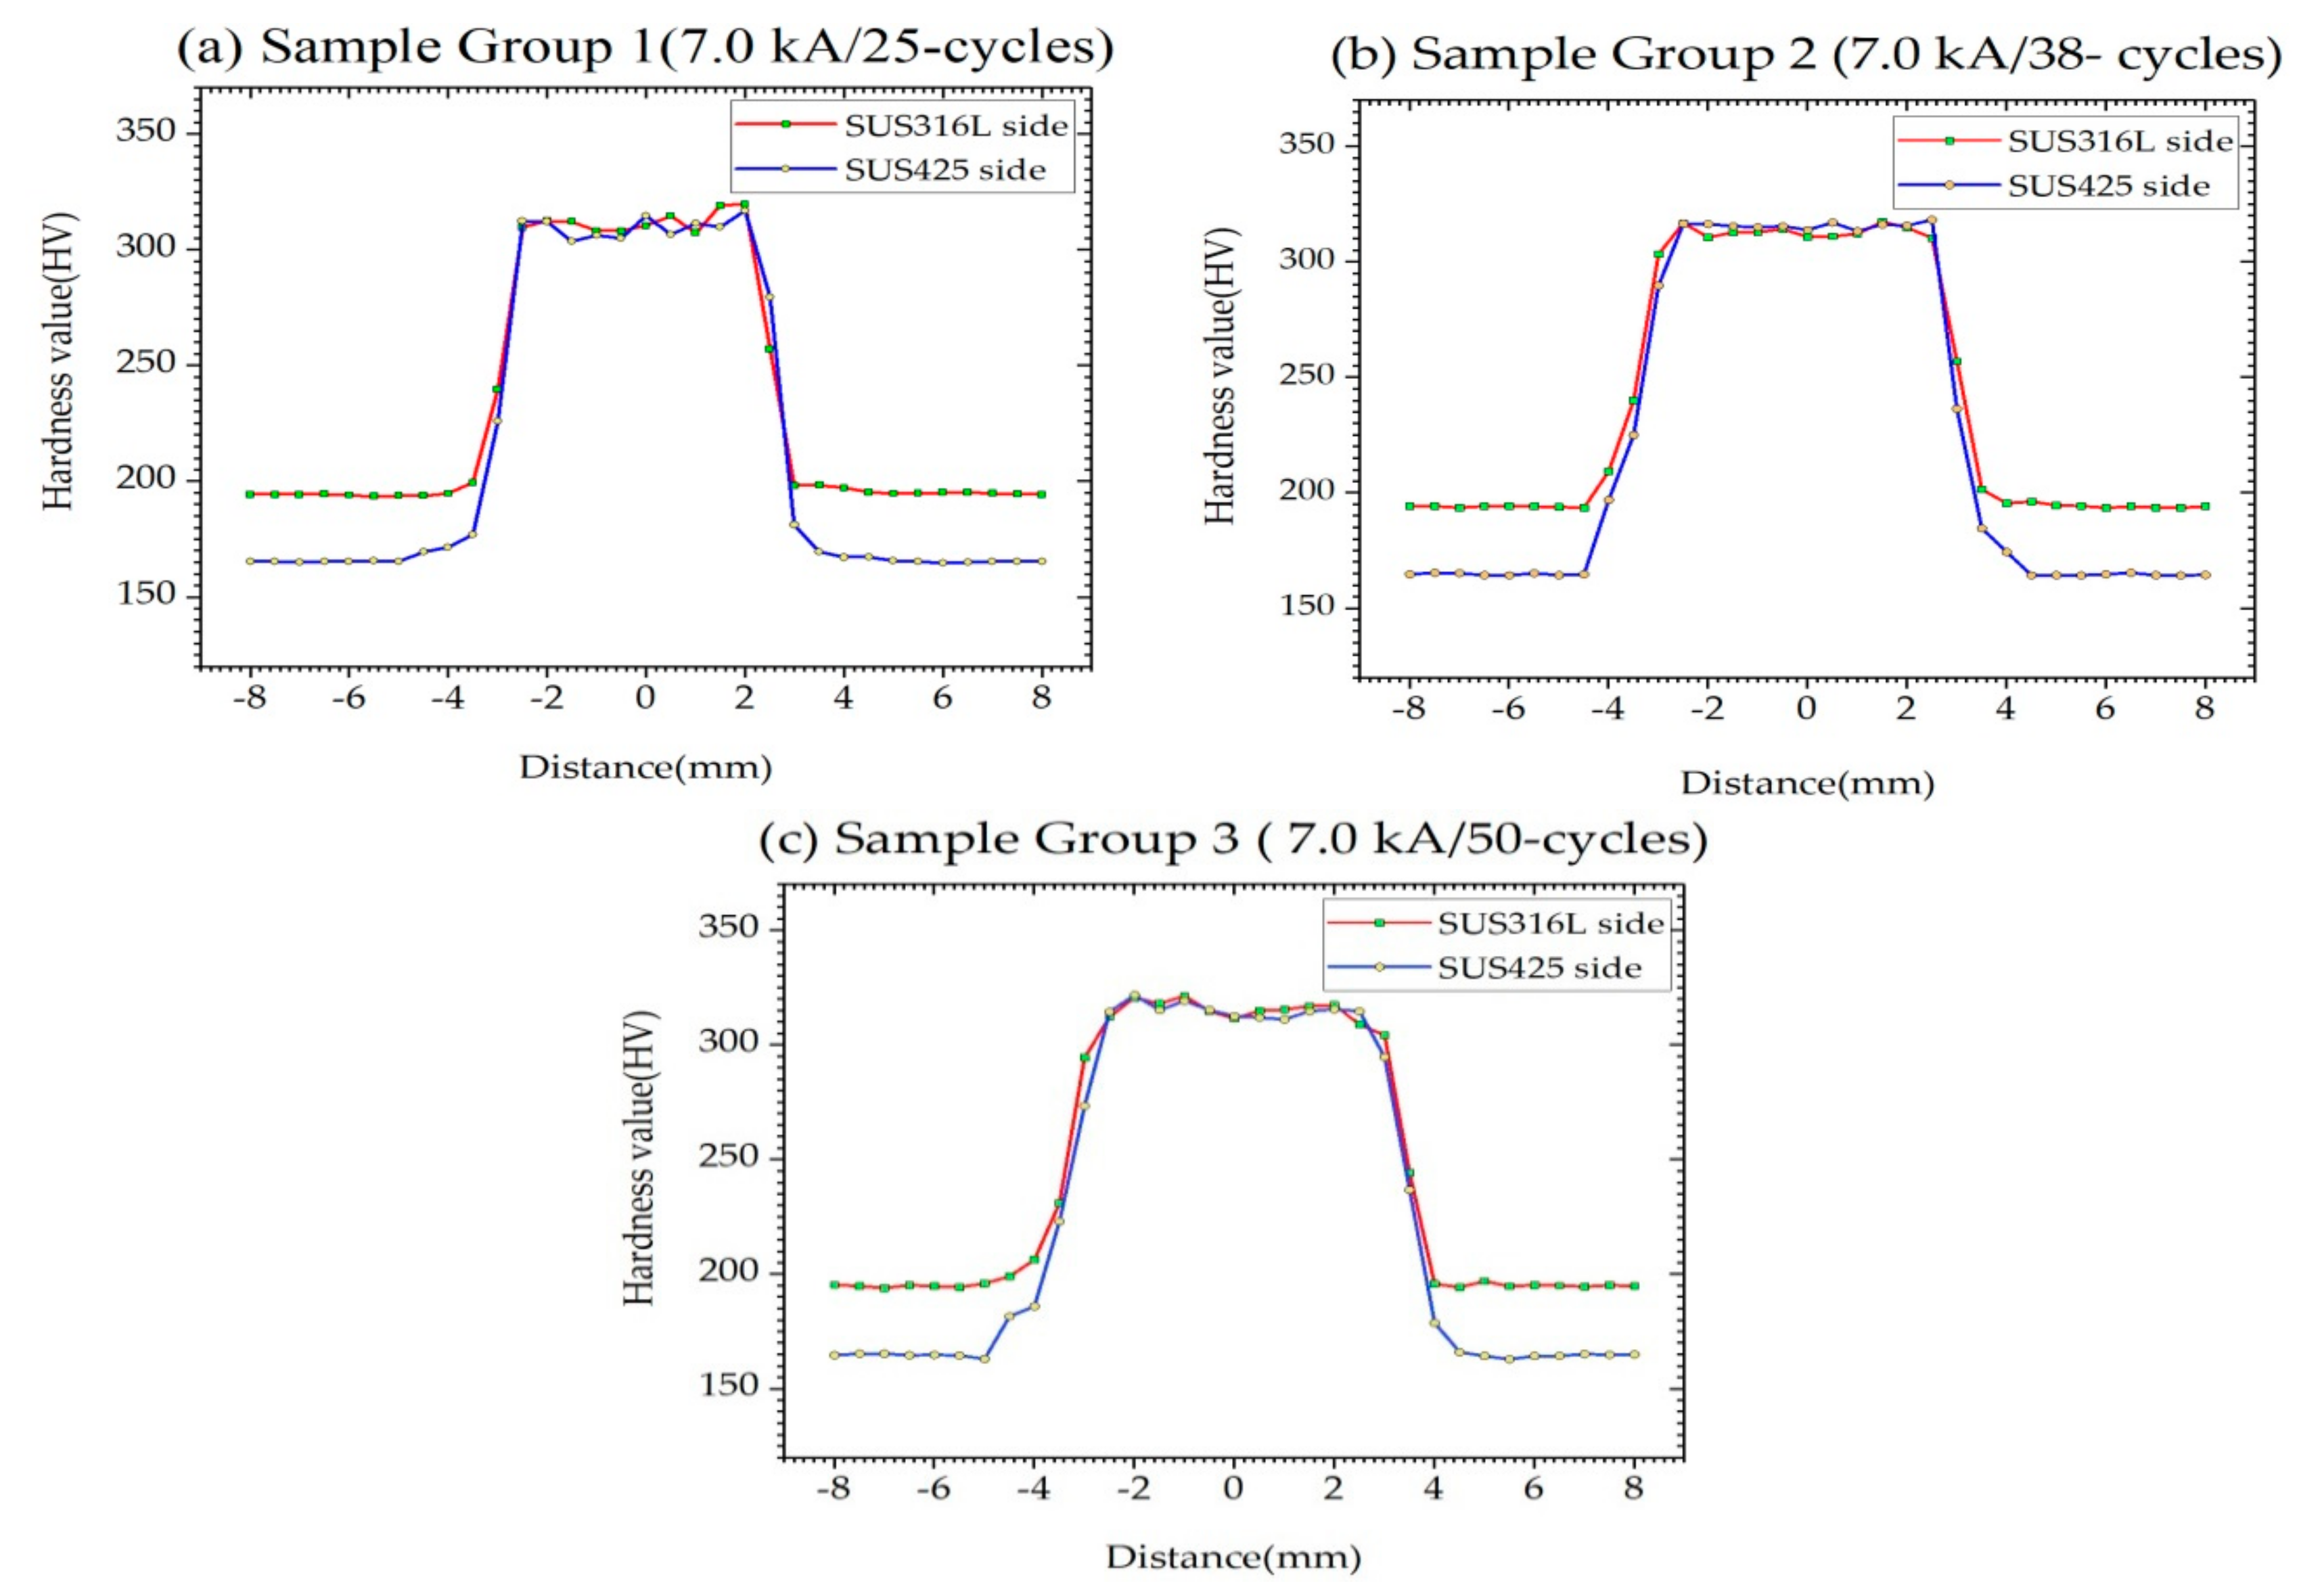
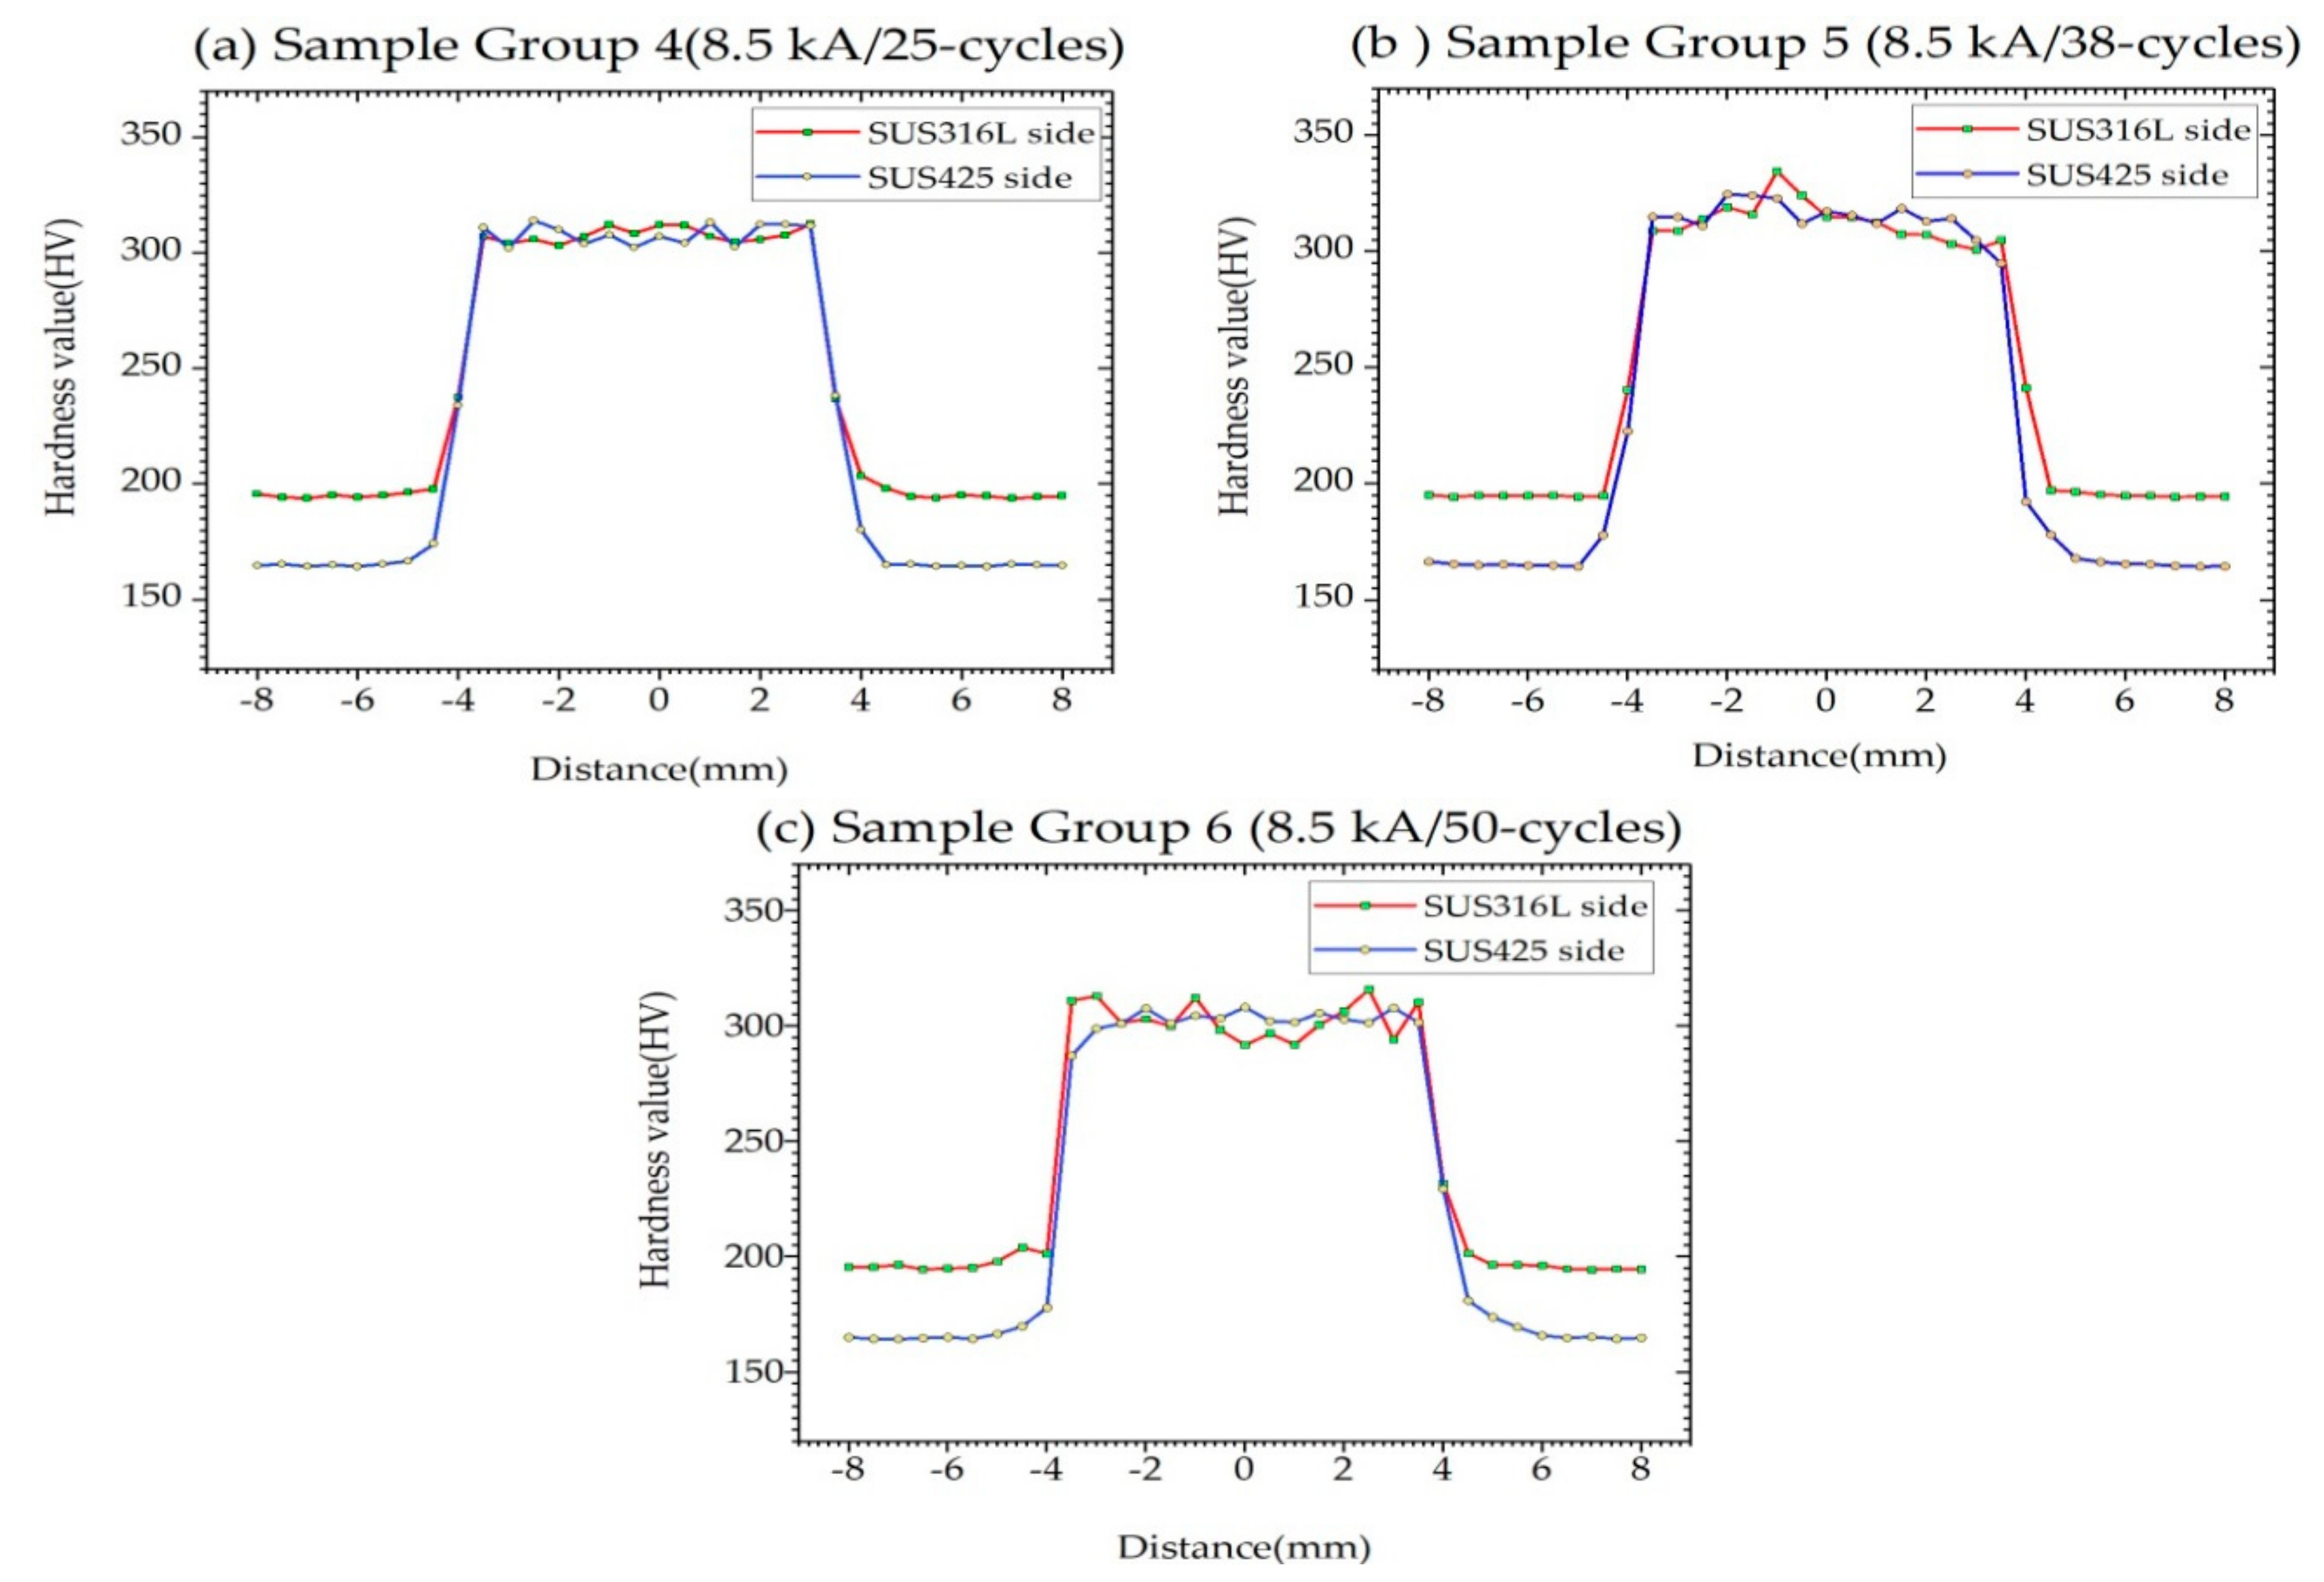
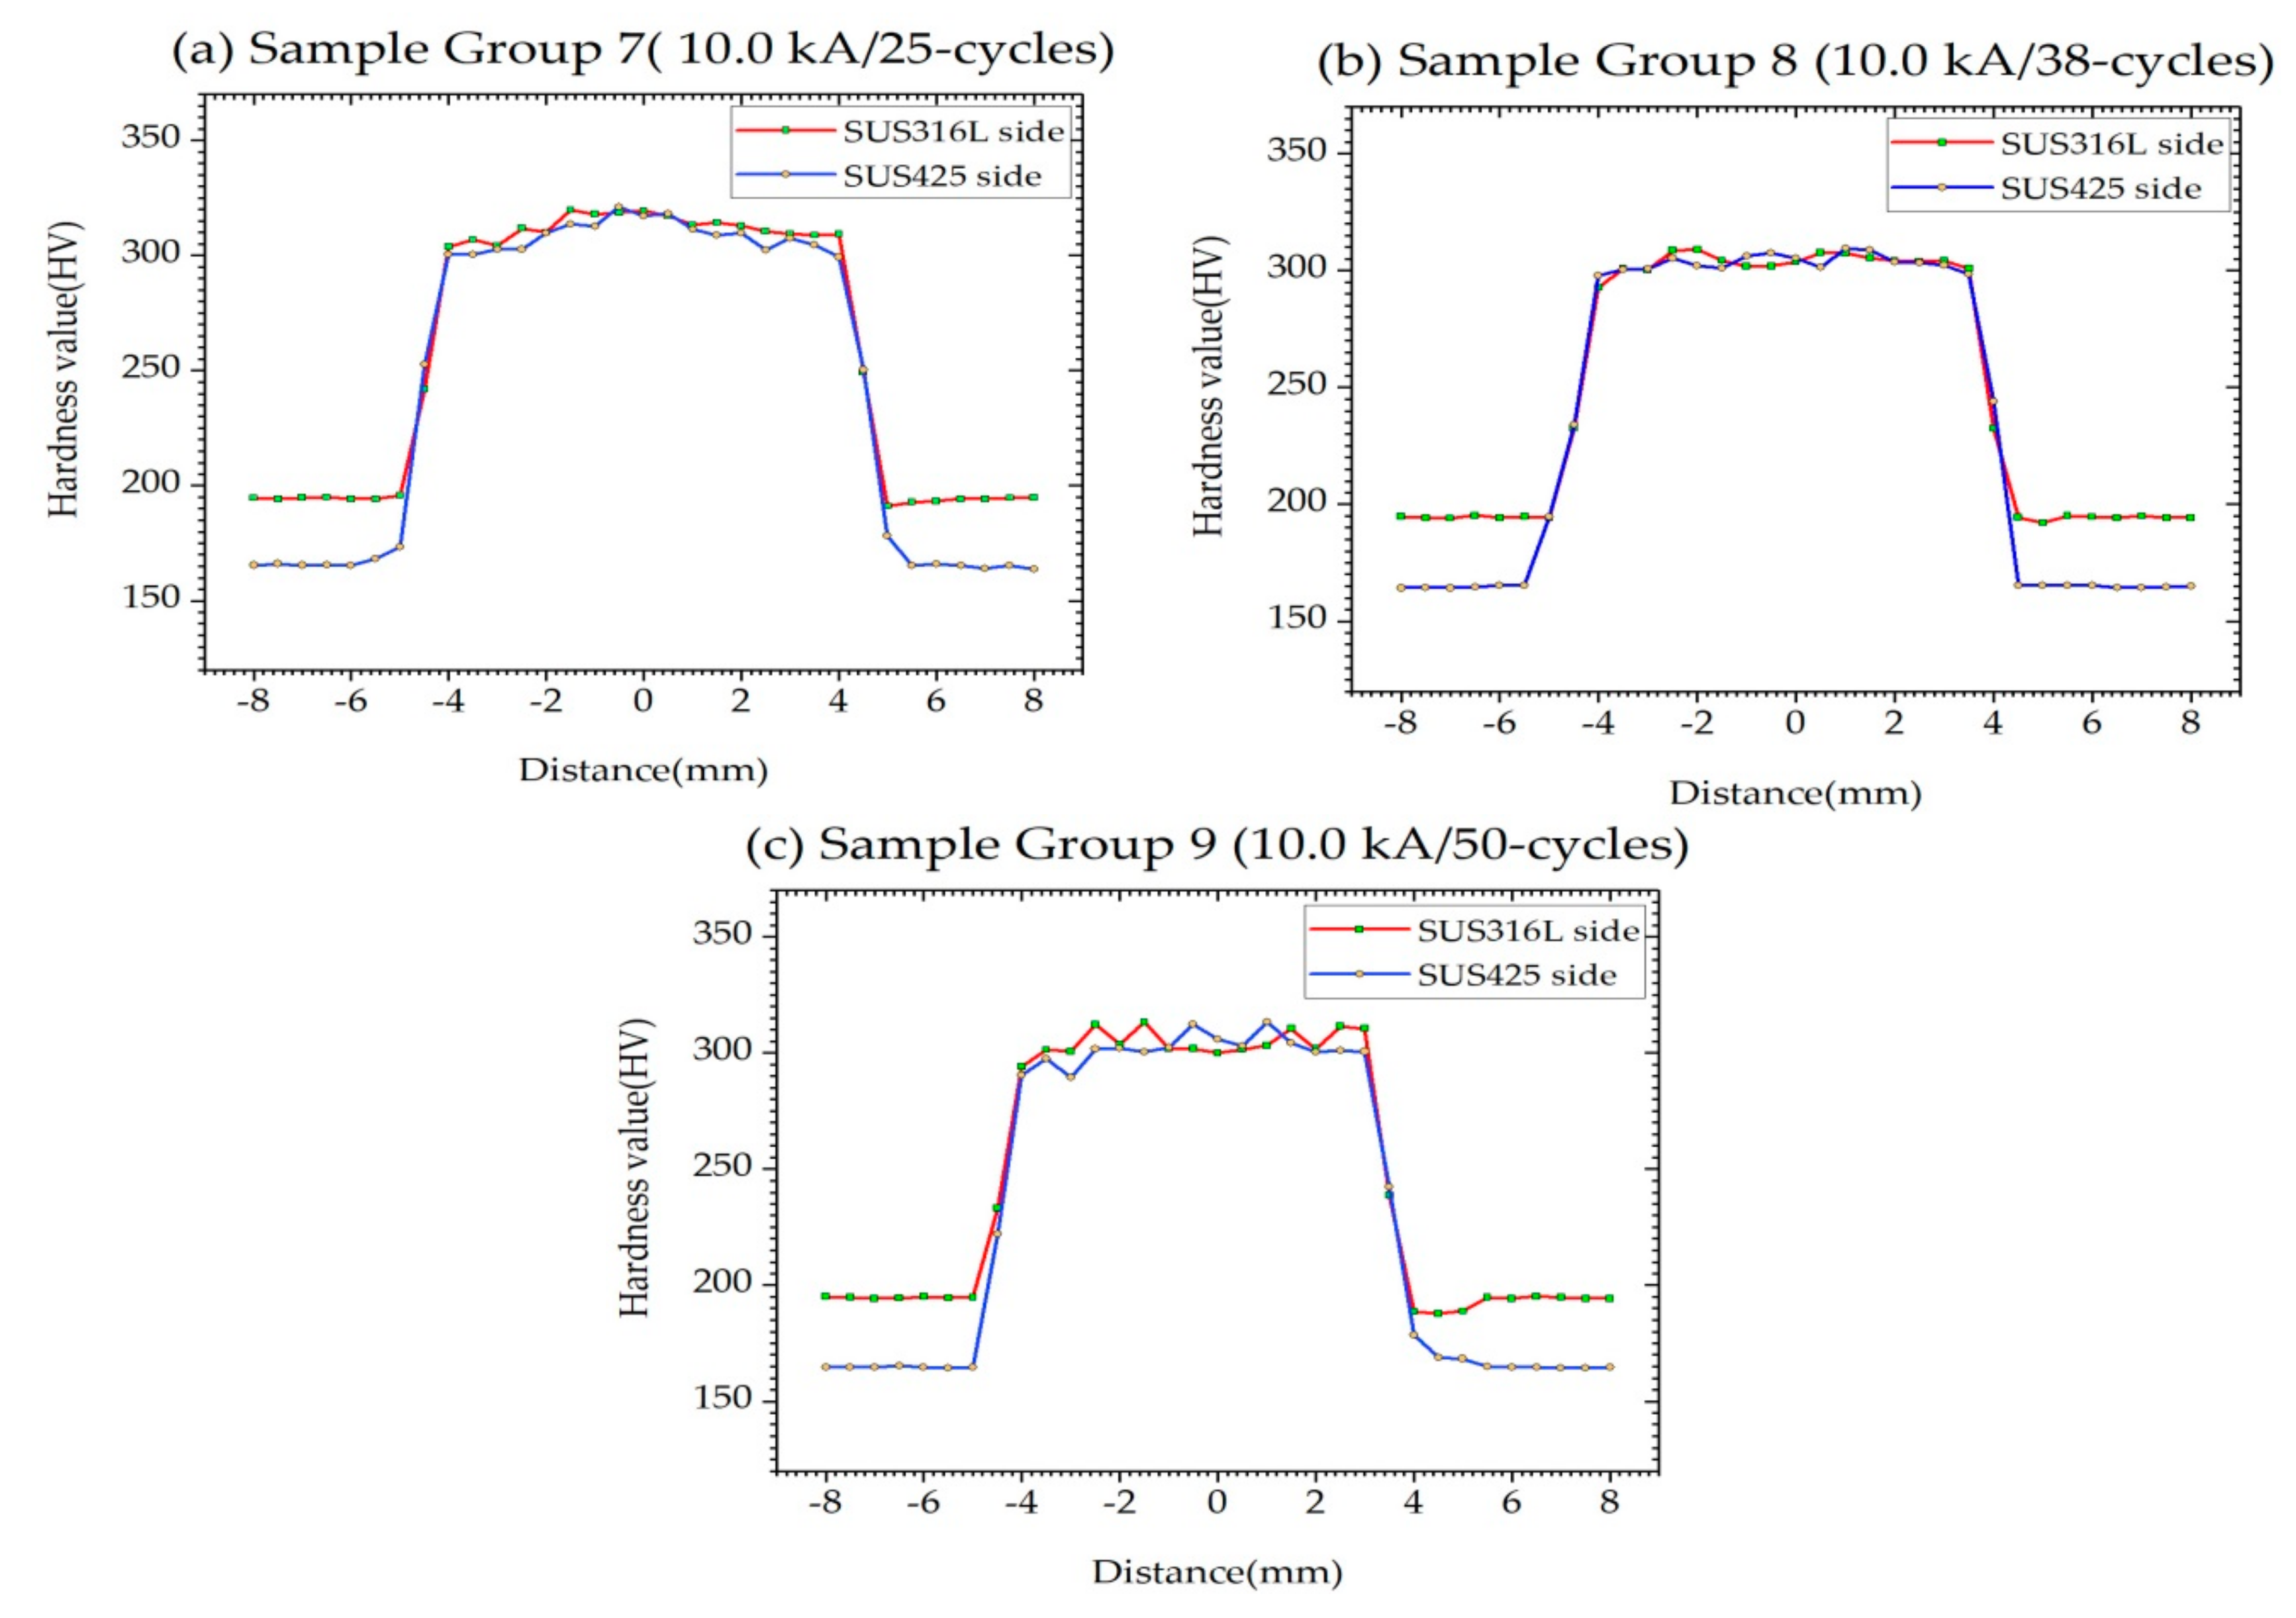
3.4. Weldment Micro Hardness

The micro Vickers hardness measurements were carried out on the base materials (BM), HAZ and FZ of welded specimens. Figure 8, Figure 9 and Figure 10 respectively illustrate the micro hardness profiles of welded specimens under 7.0, 8.5, and 10.0 kA weld currents, given 25, 38, and 50-cycle welding times. The overall results showed that, by comparison, the micro hardness of SUS425 and its BM and HAZ were lower due to the full ferrite phase. The micro hardnesses of the FZ of SUS316L and SUS425 were almost identical. In general, the micro hardnesses of the HAZ and FZ increased with weld current and welding time. Specifically, the micro hardnesses of SUS316L and SUS425 were 194.4 HV and 165.0 HV, and the corresponding micro hardnesses of HAZ were 236–263 HV and 231–248 HV. The micro hardnesses of FZ for all experimental conditions were 300–320 HV, which was attributable to the presence of martensite.

3.5. Optimization of Welding Parameters

In optimization, this research took into consideration the weldment quality (i.e., five quality metrics) with minimal expulsion and tensile shear force. In spot welding, expulsion normally occurred in the event of high heat input, leading to the loss of molten metal [22]. Moreover, expulsion increased the indentation depth while reducing the depth of fusion, nugget diameter and tensile shear force. Generally, tensile shear force increased with an increase in the weld current and welding time. Based on the weldment quality metrics and TSF, the optimal welding condition is shown in Table 6, and is consistent with previous work of the authors [23]. In the microstructure analysis, the weld current was varied between 7.0, 8.5, and 10.0 kA while the welding time remained constant at 25 cycles.

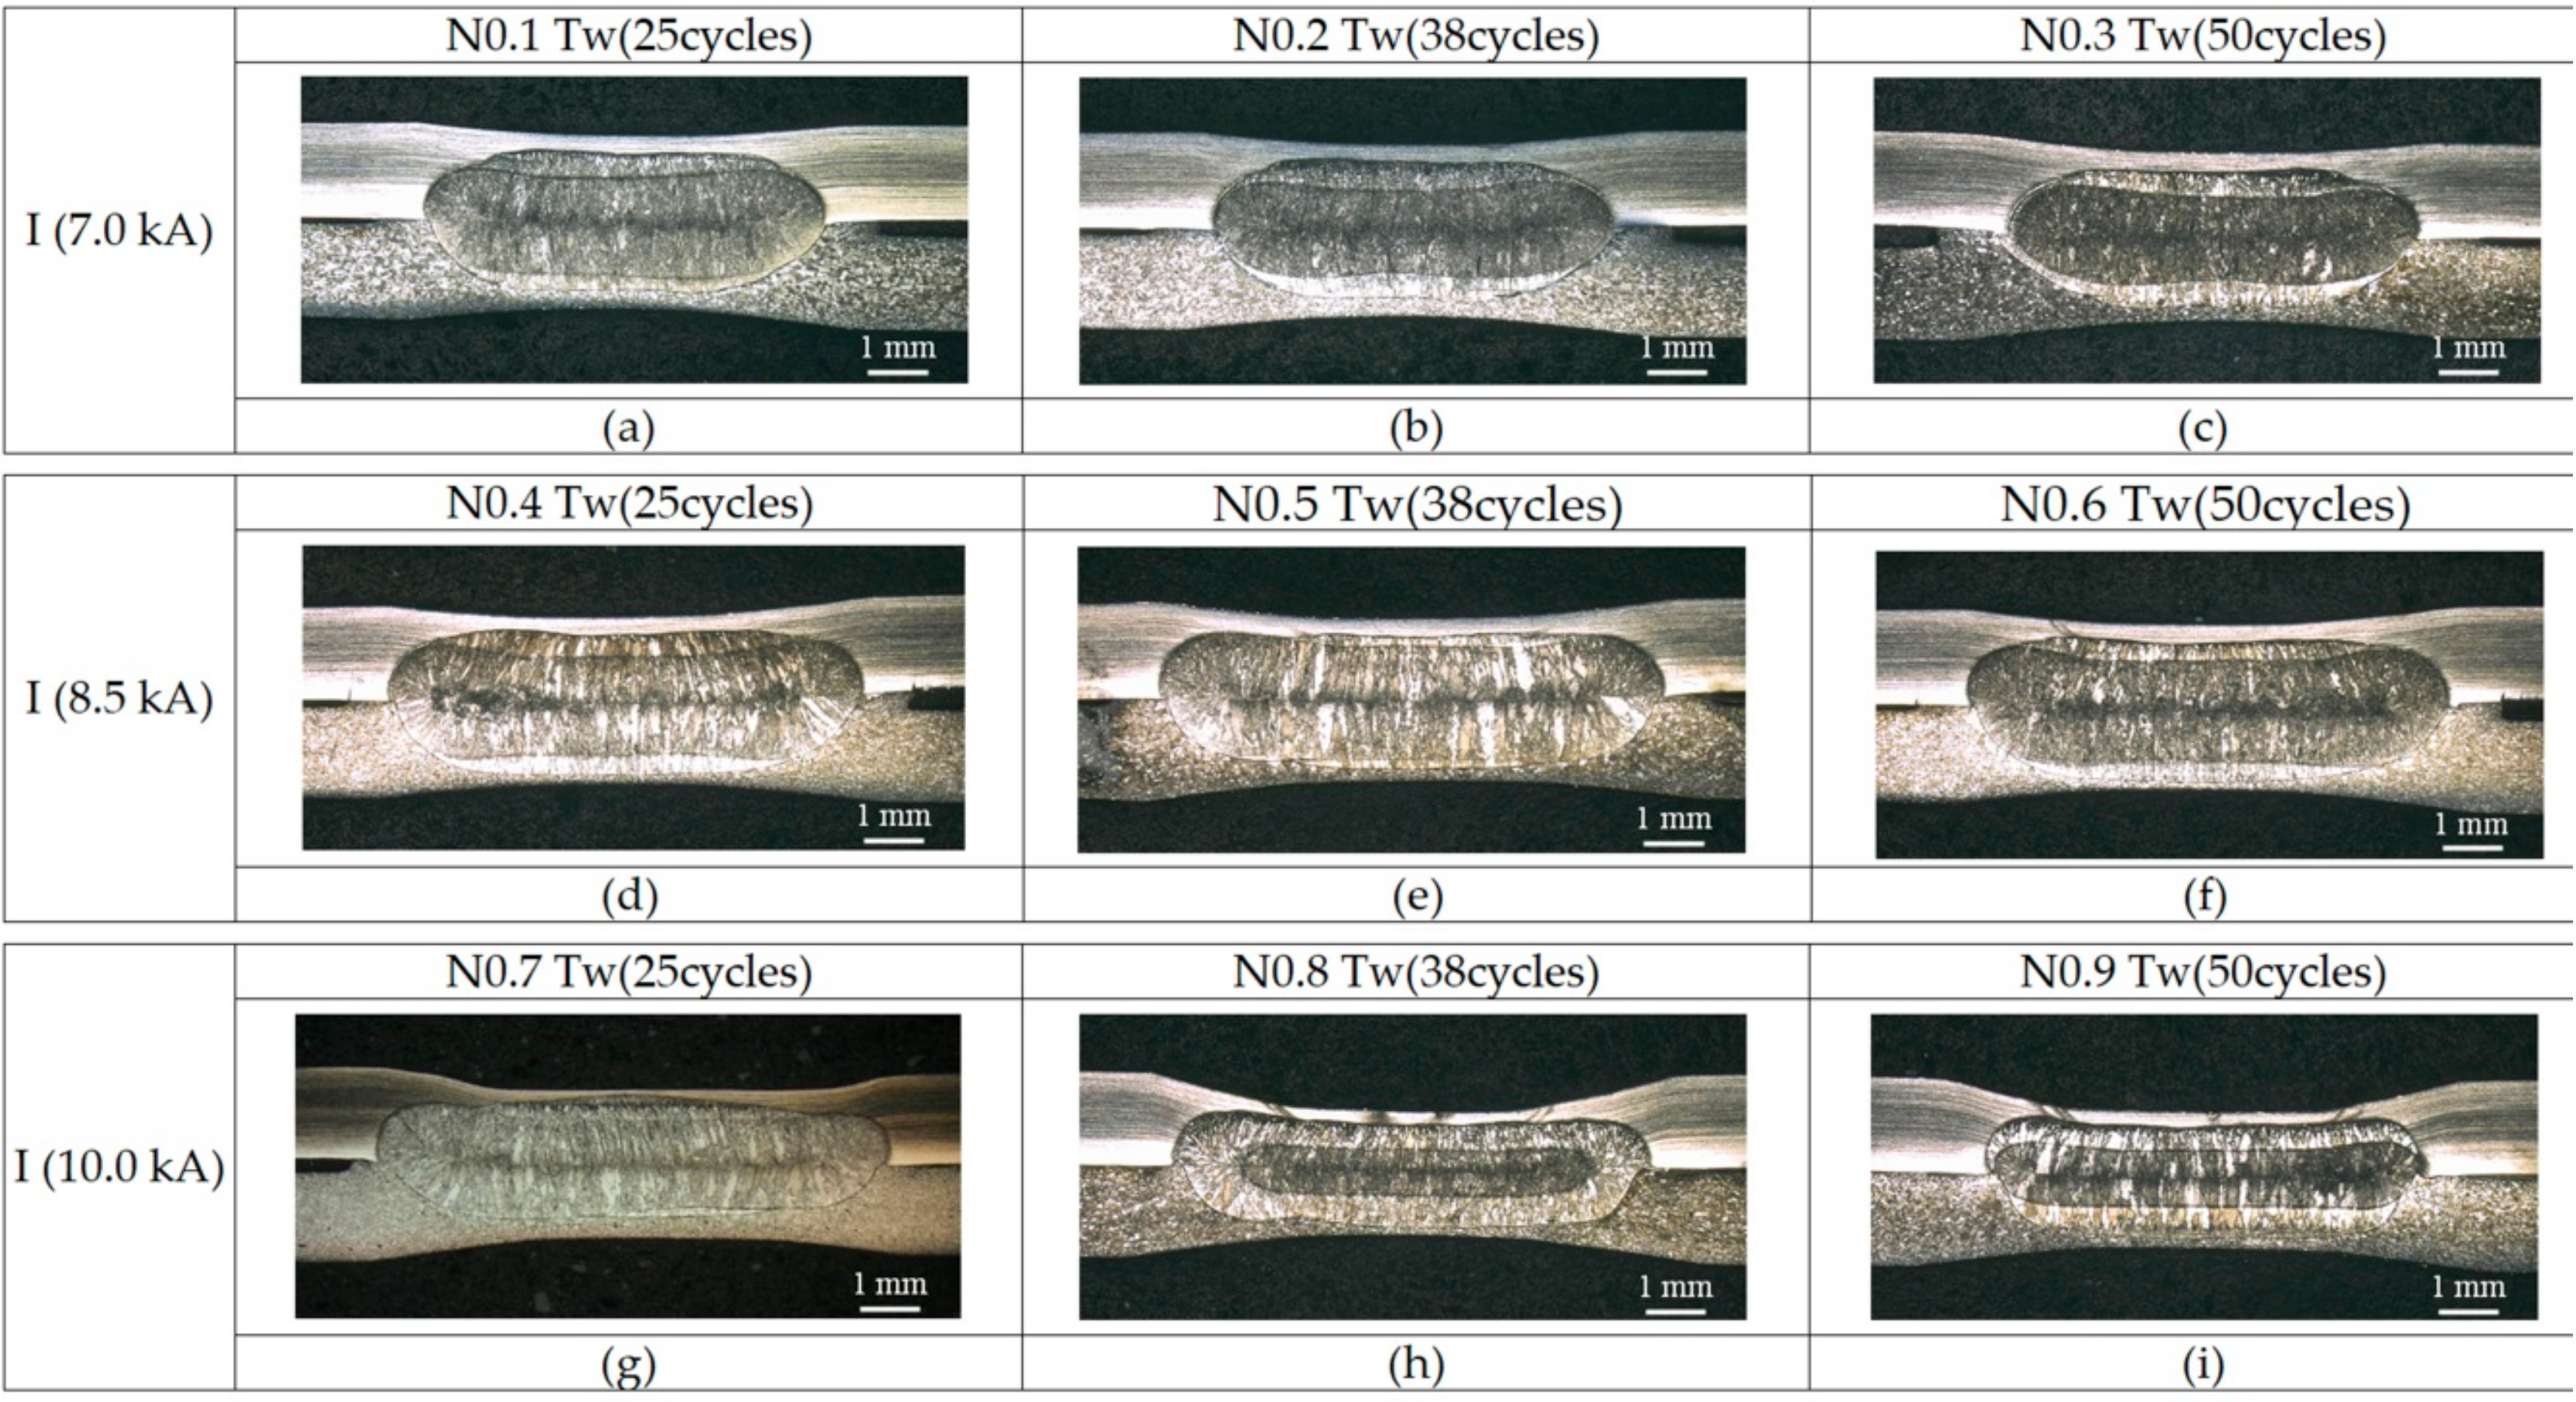
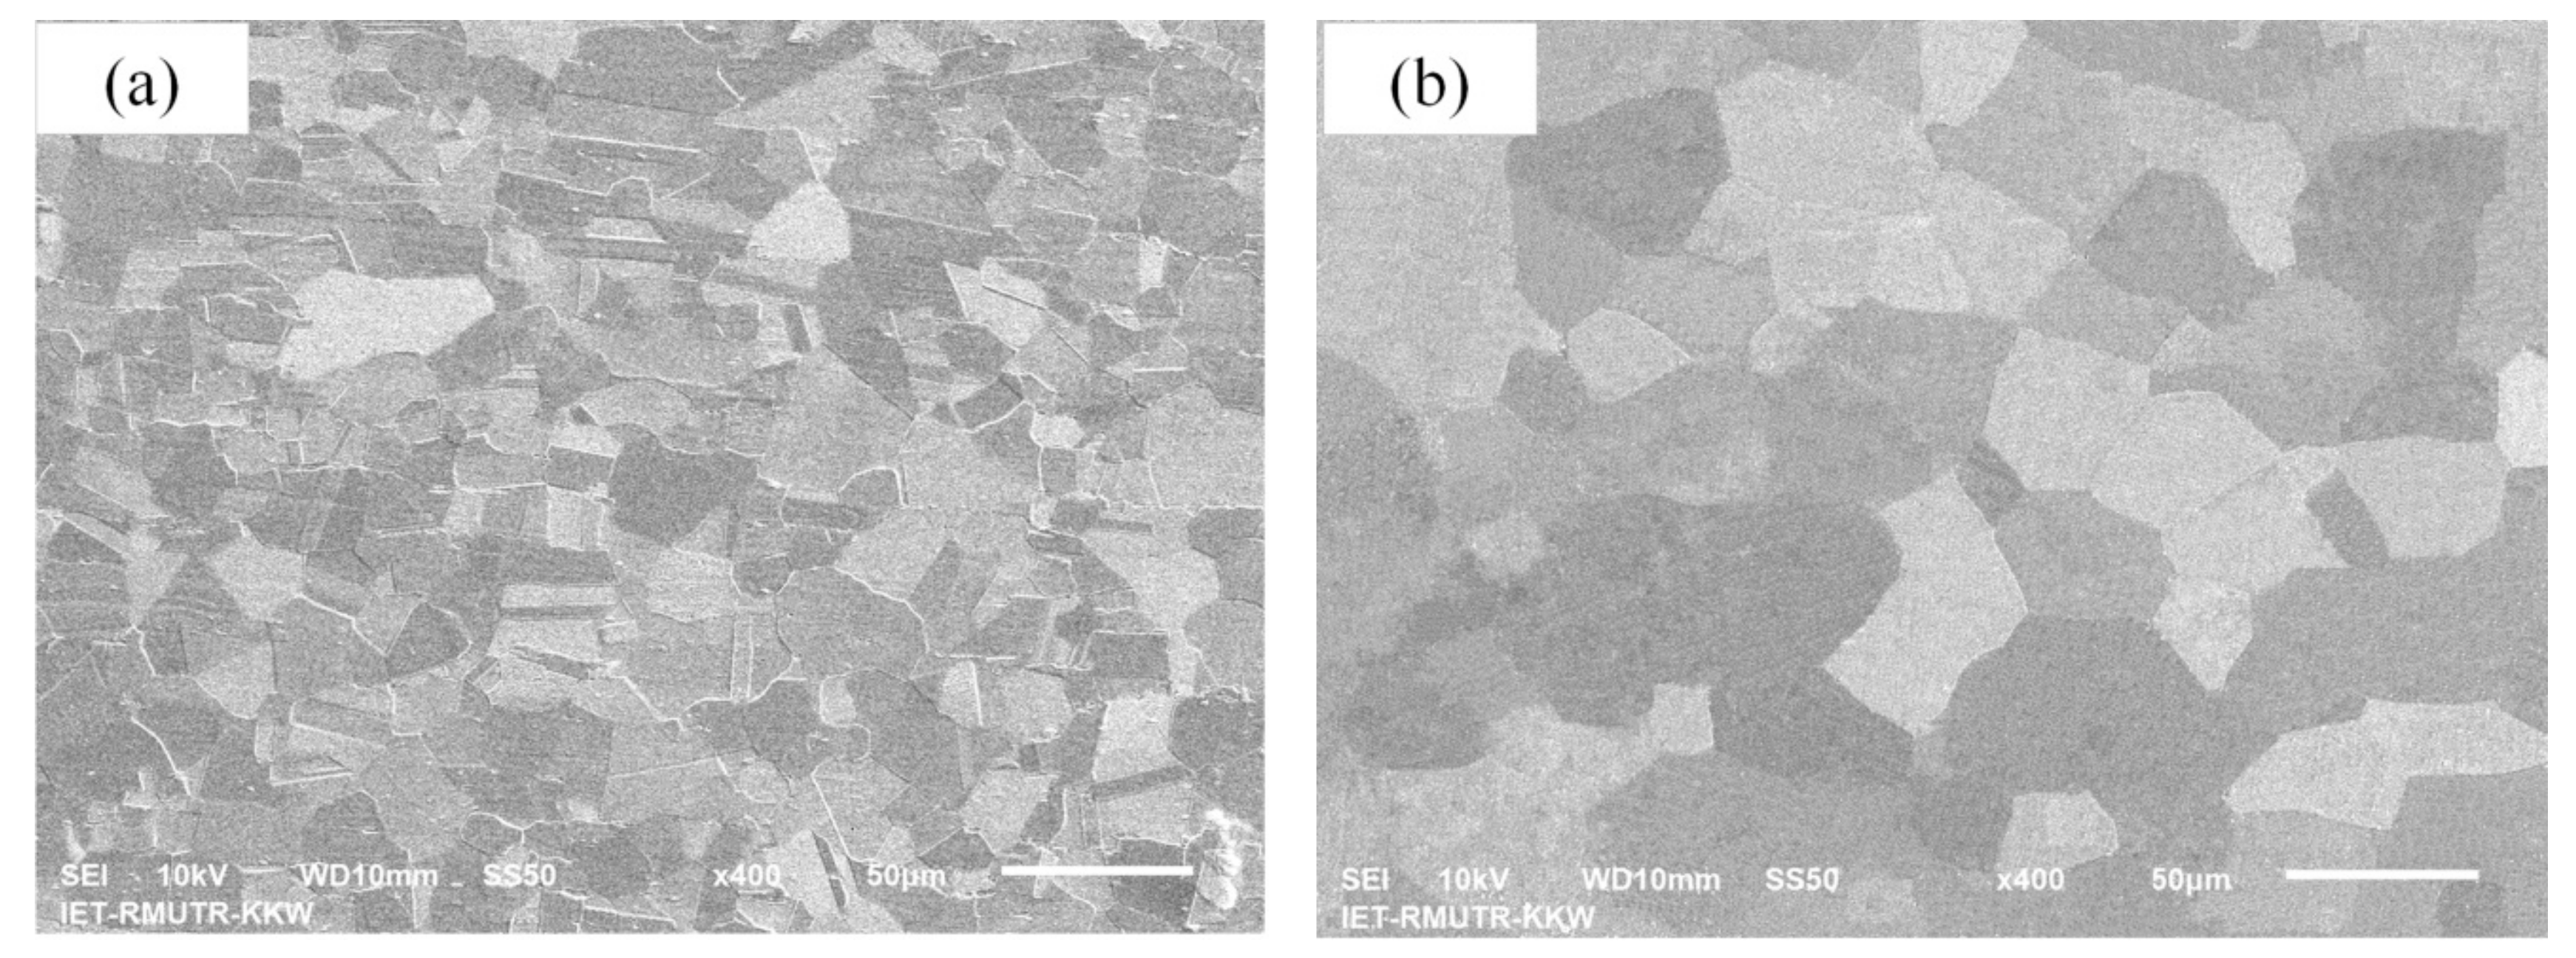
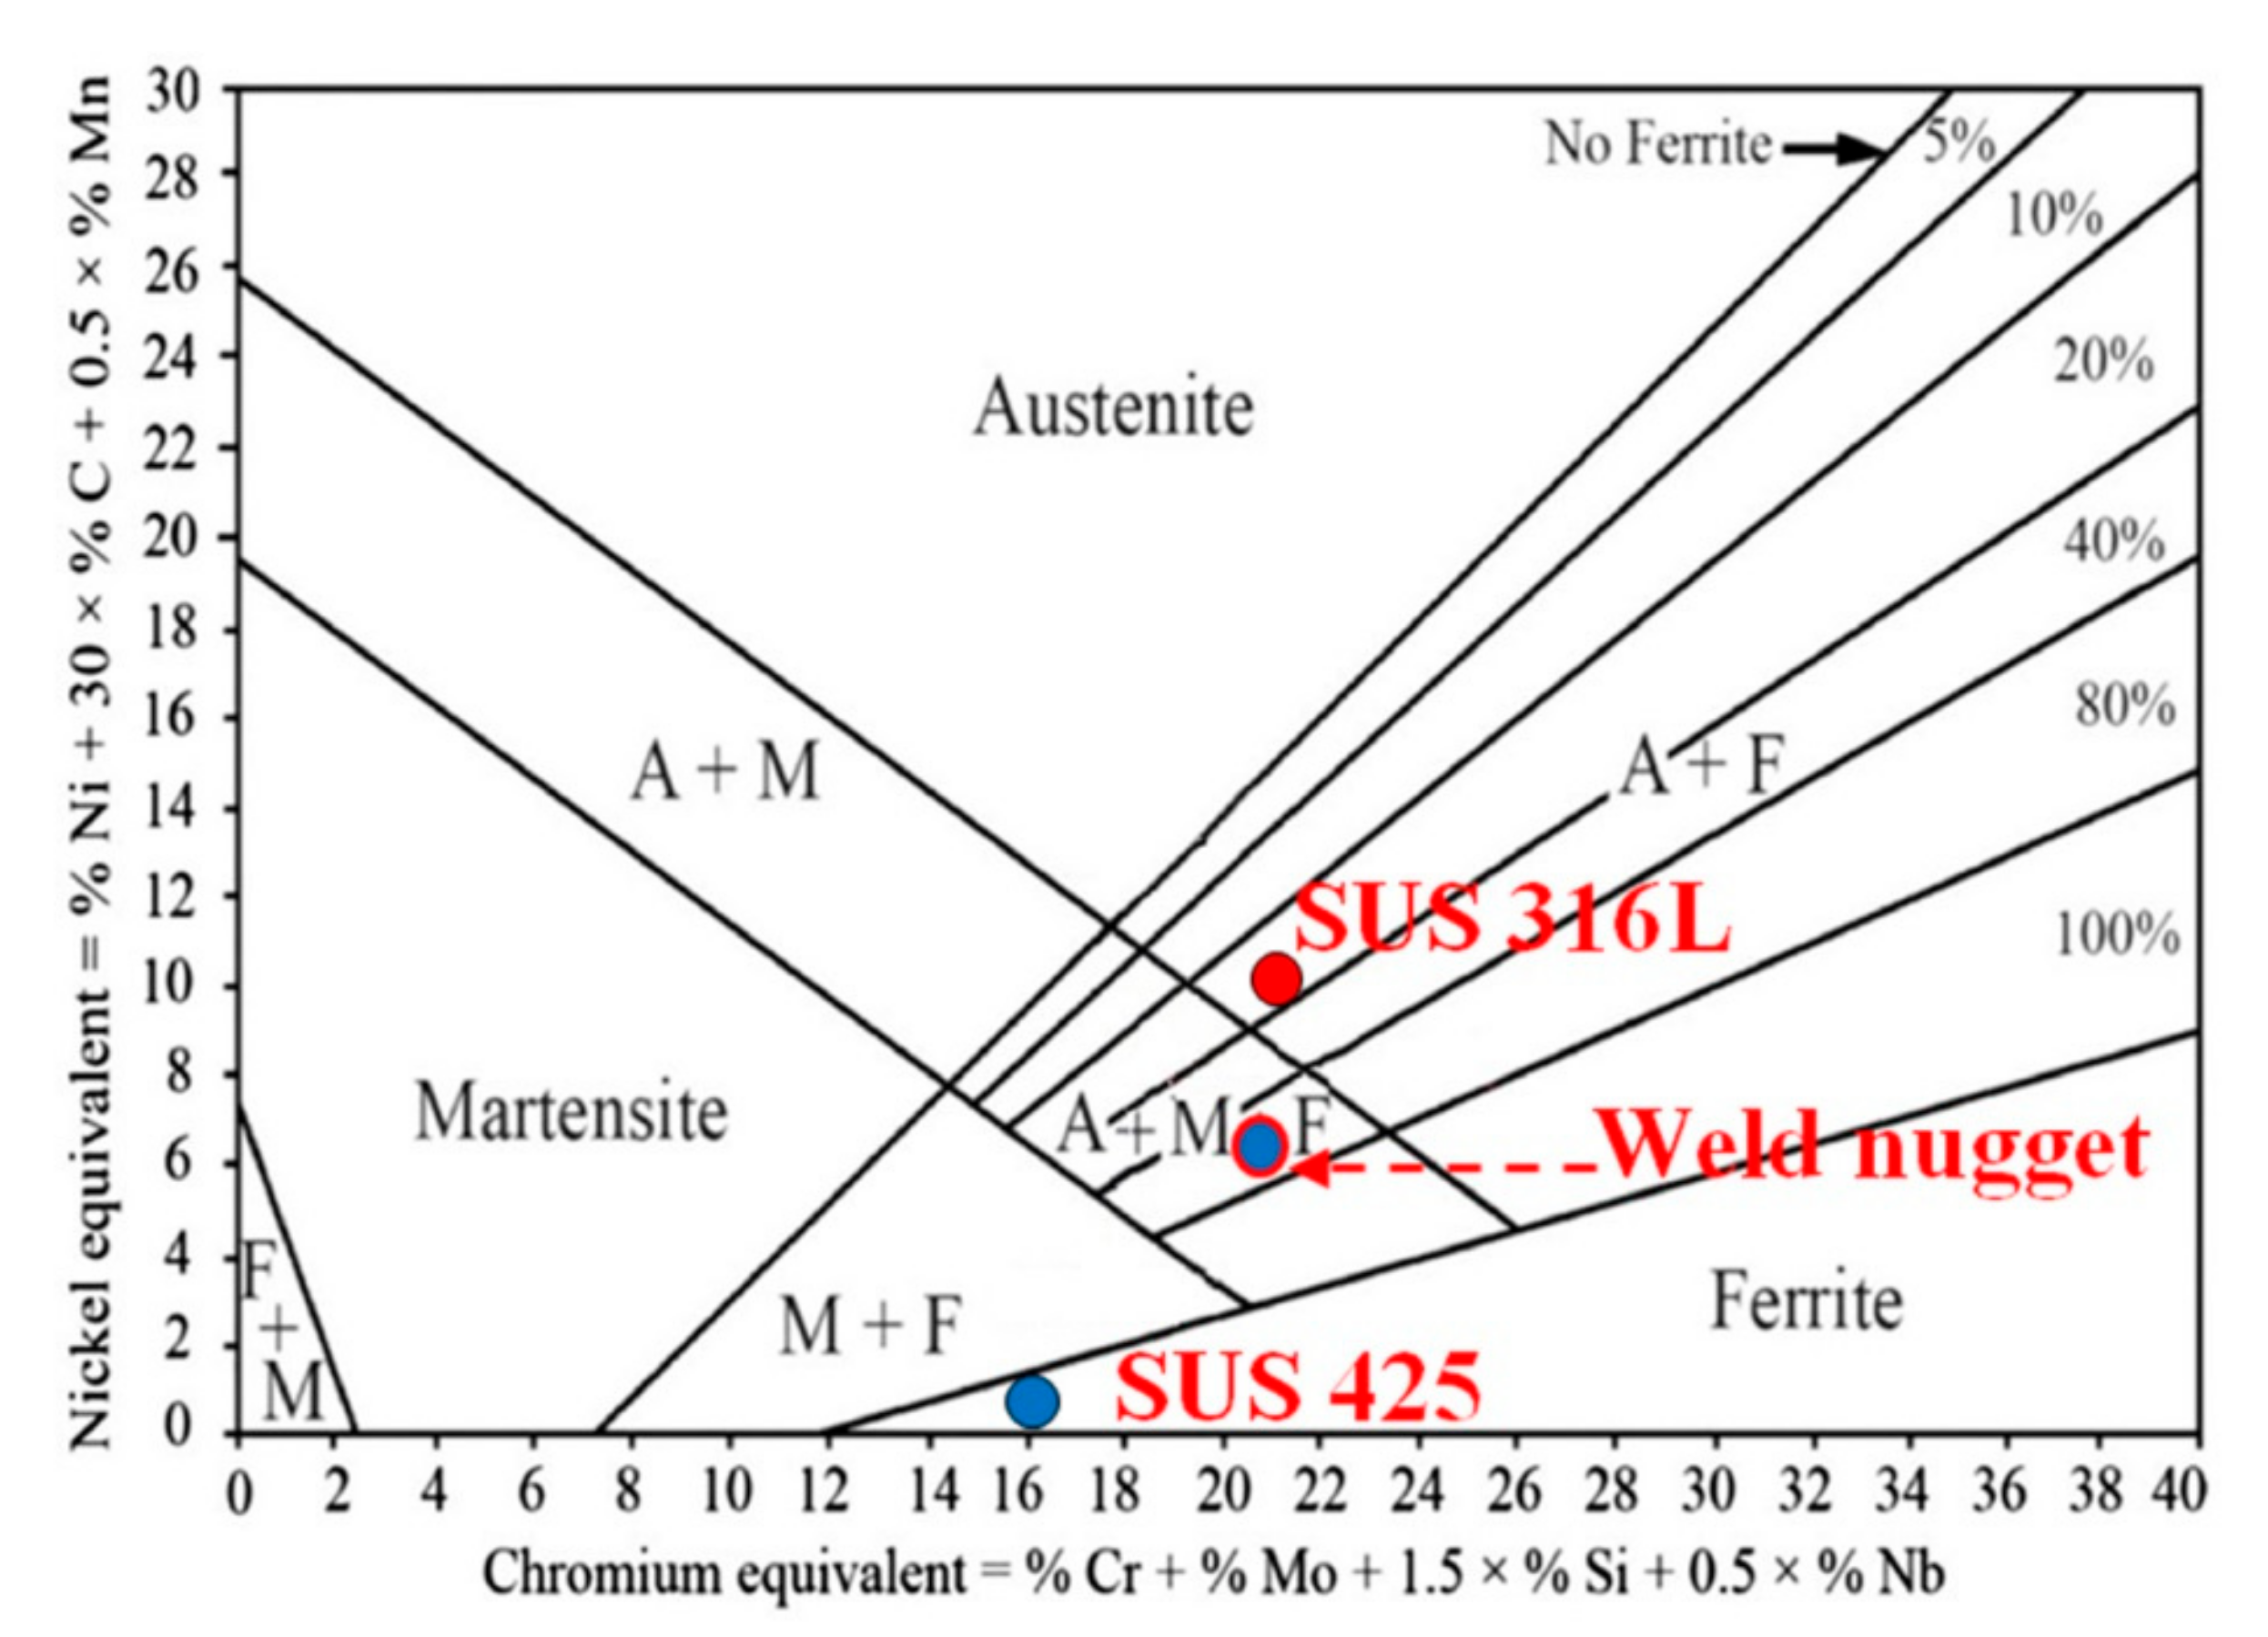
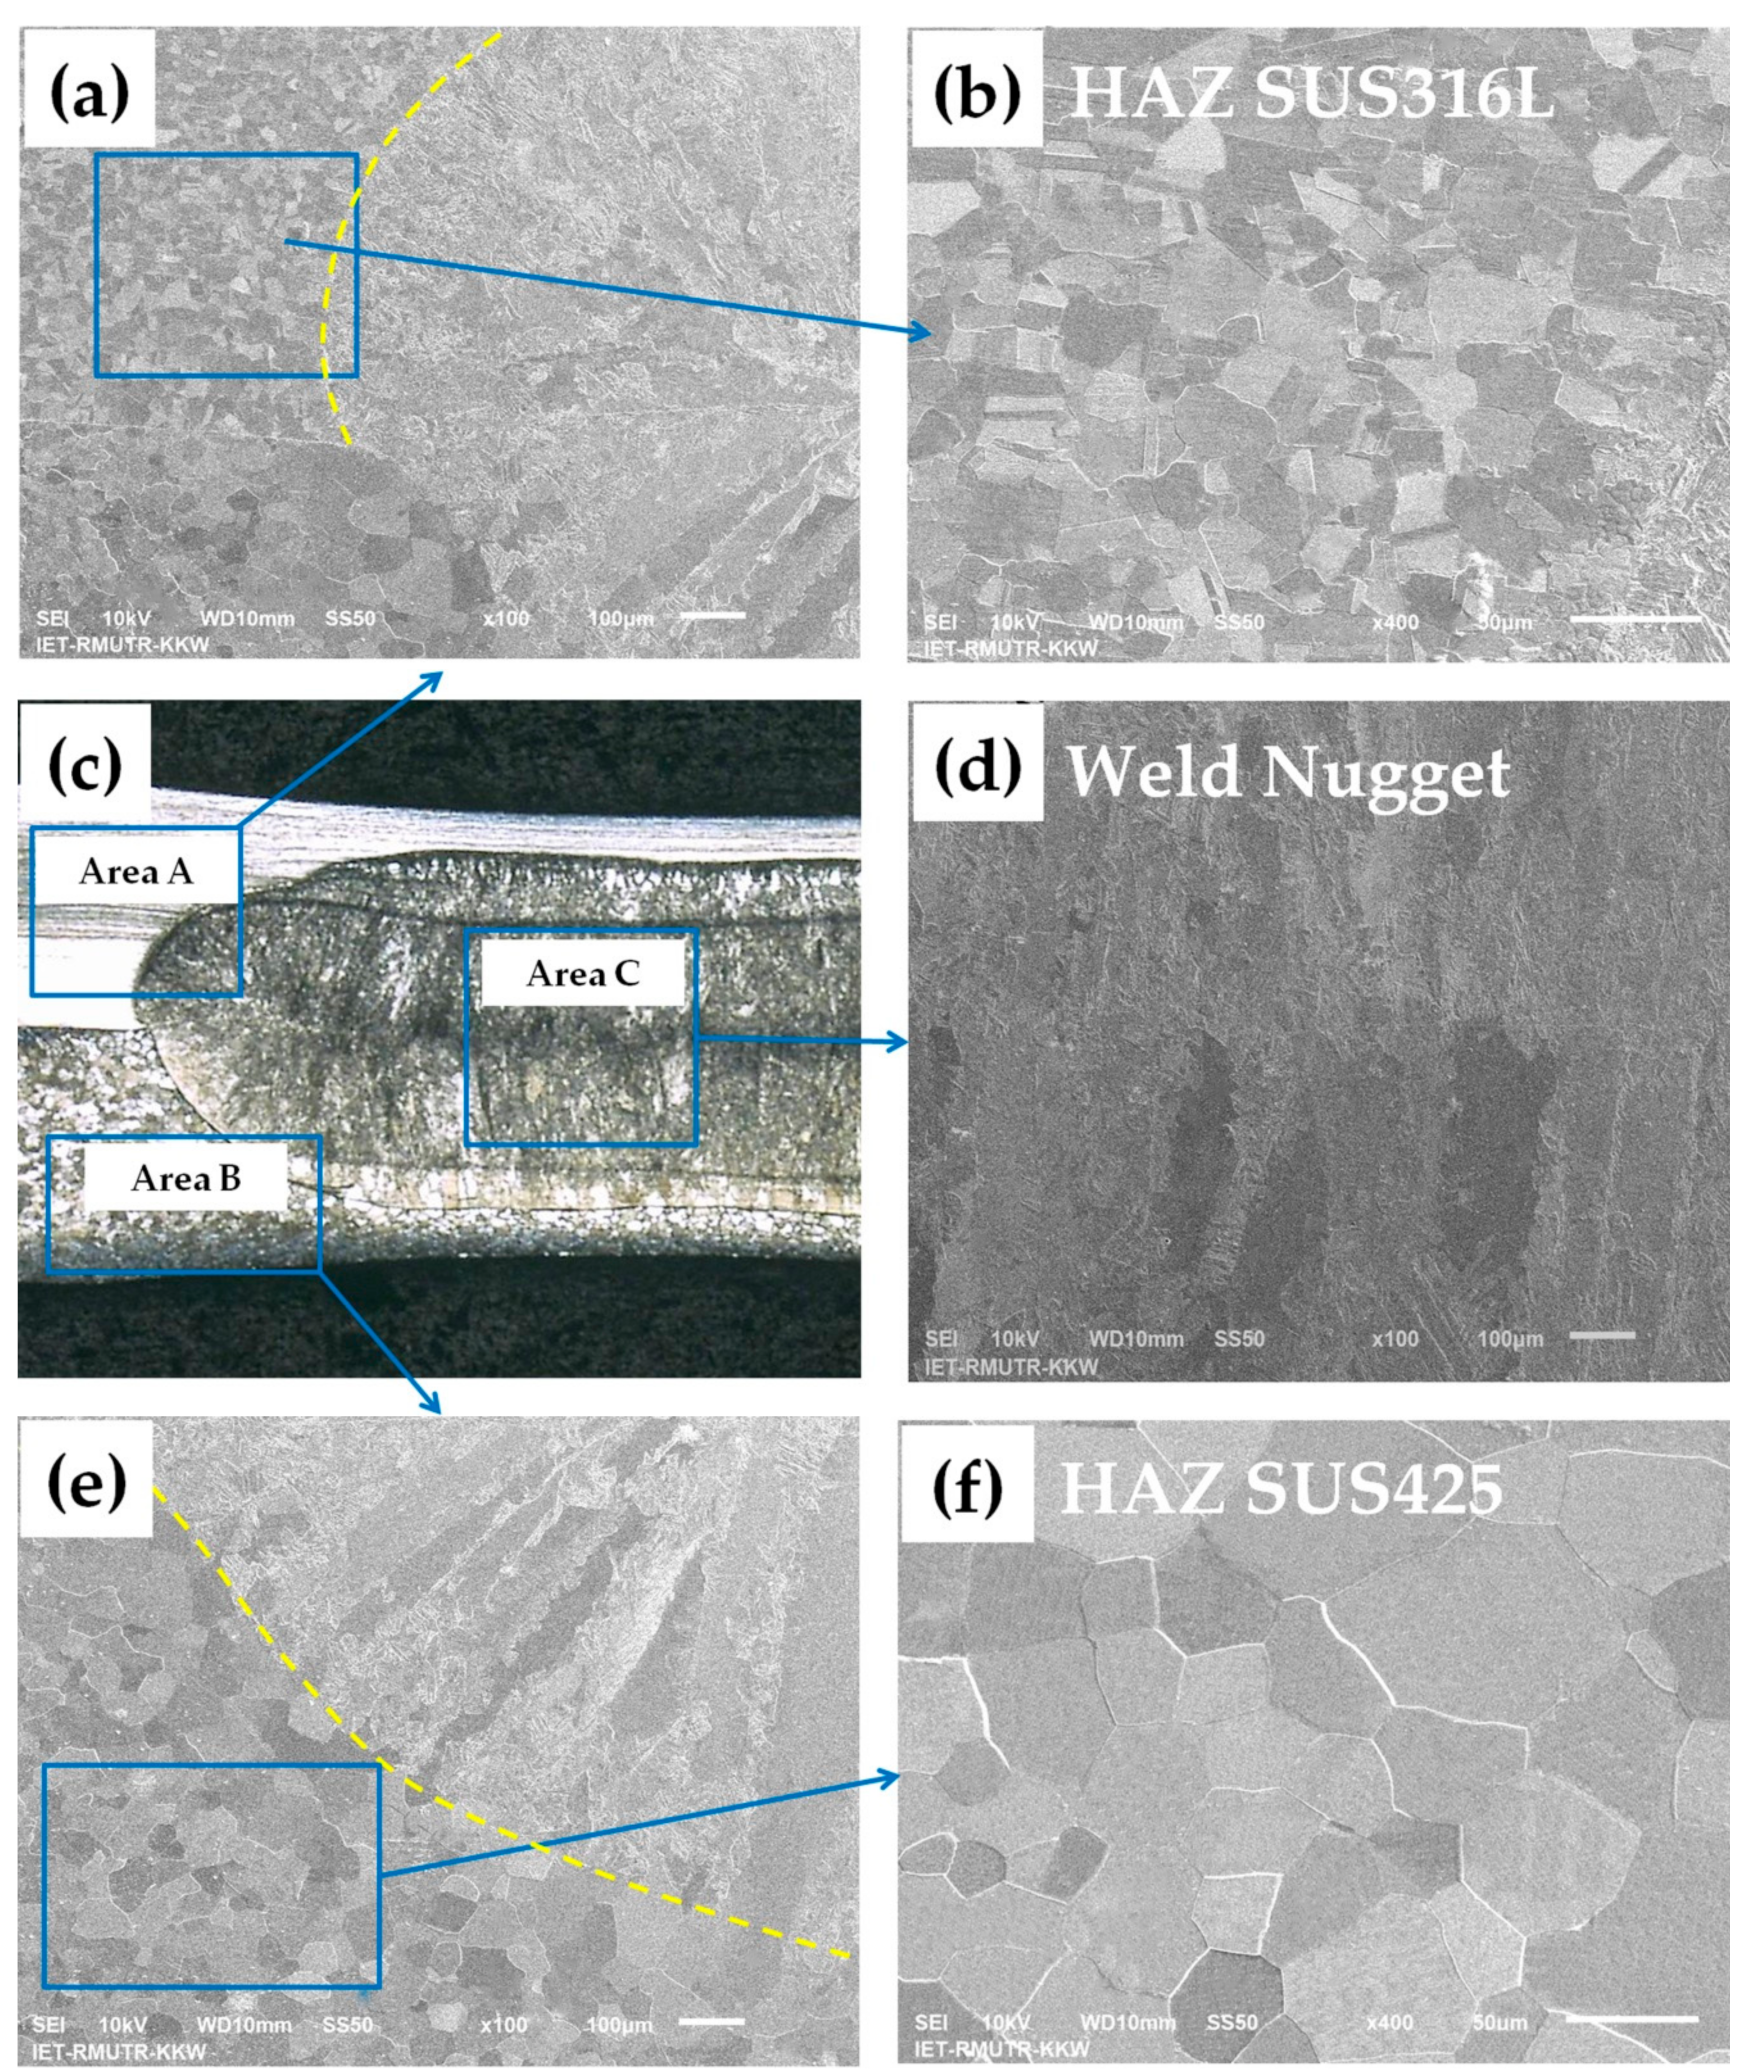
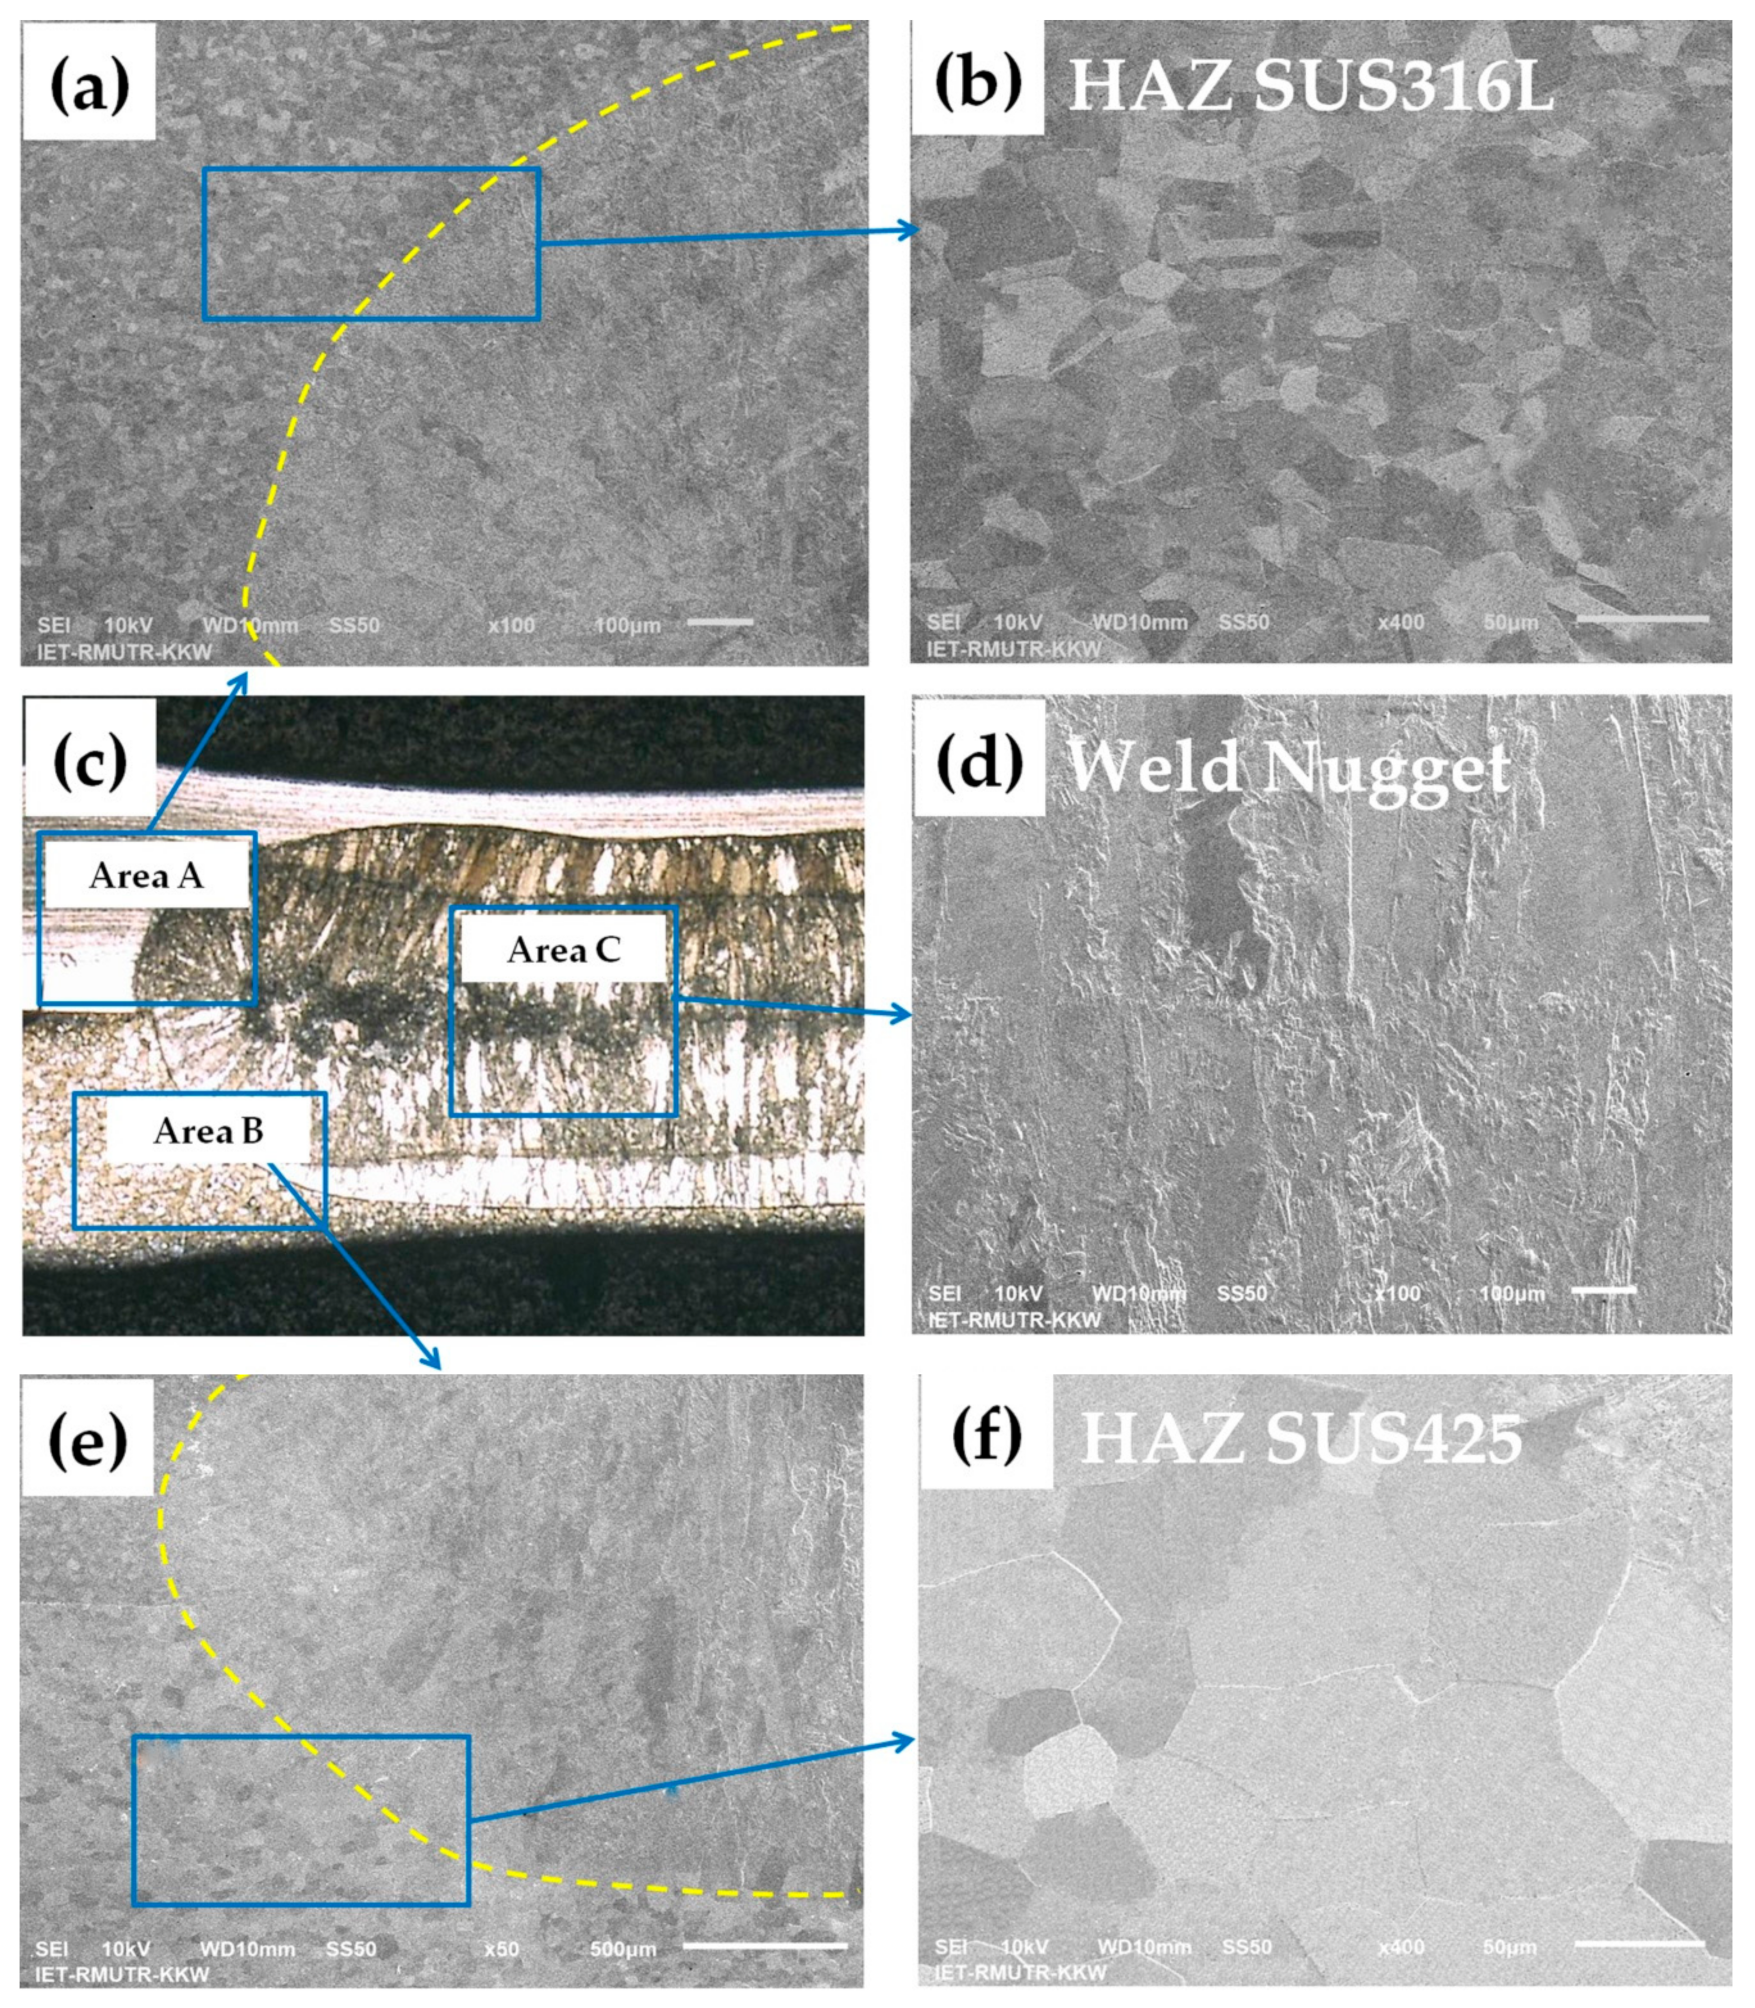
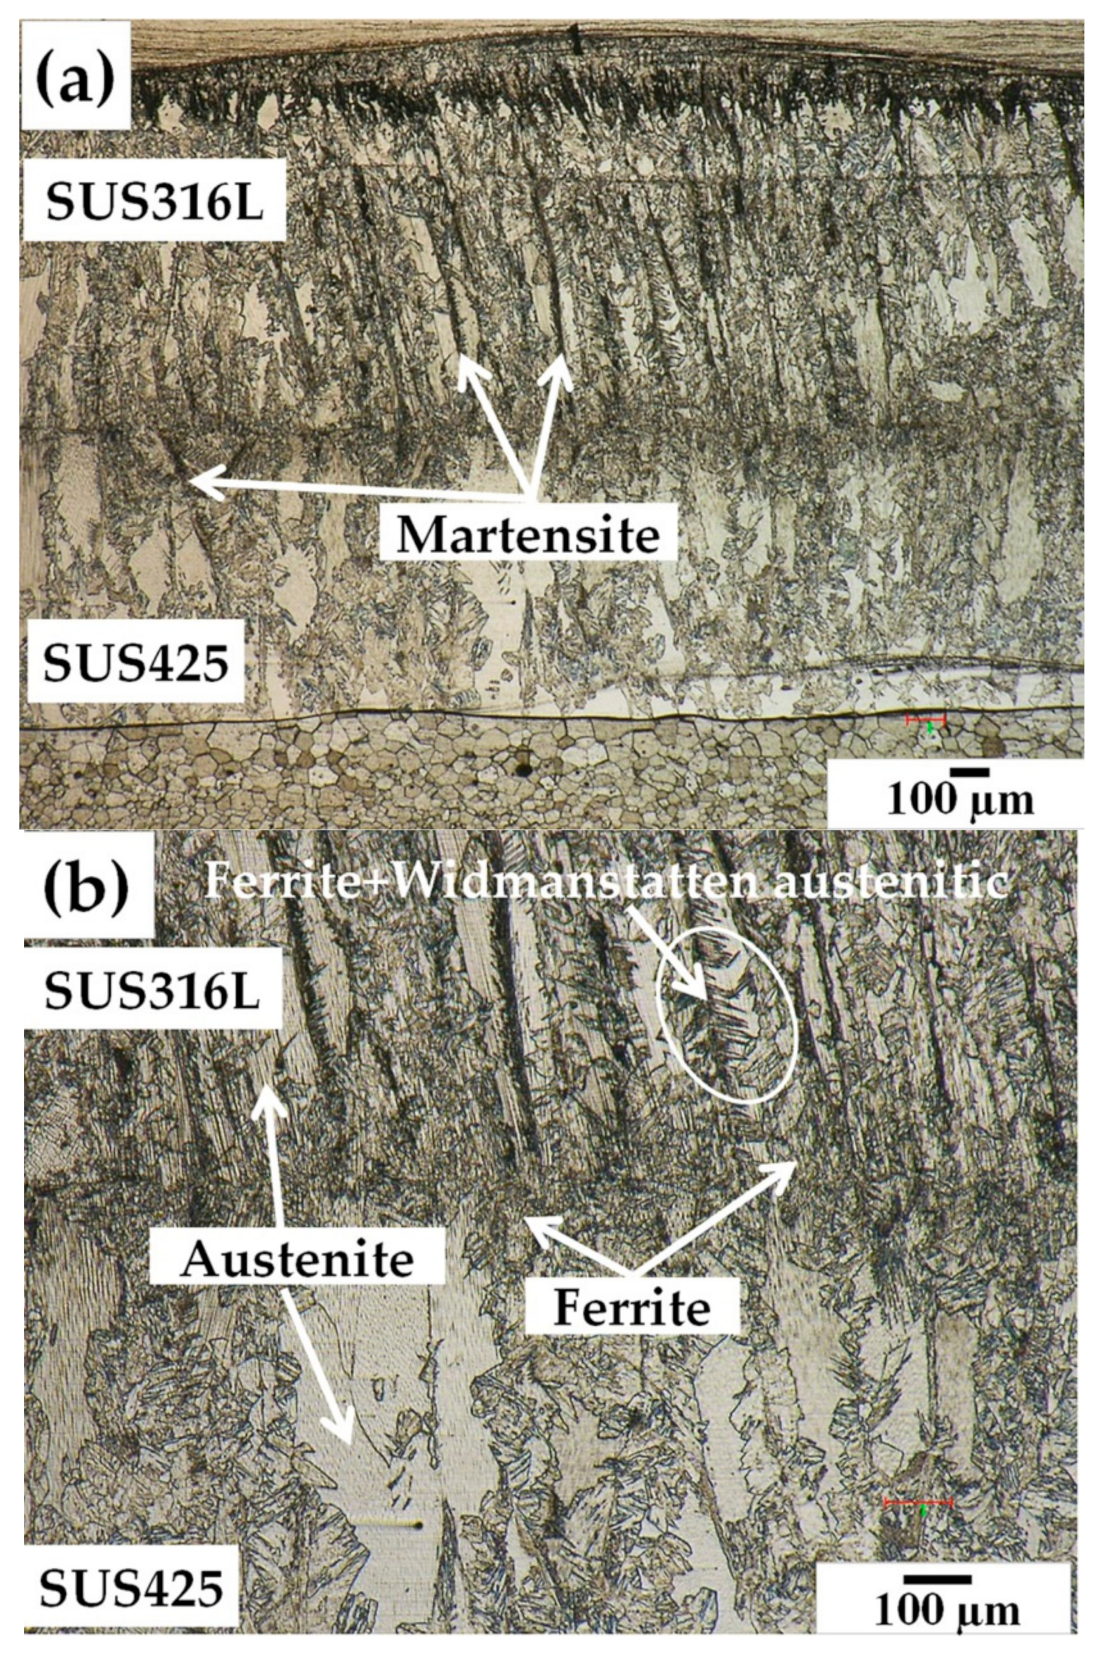
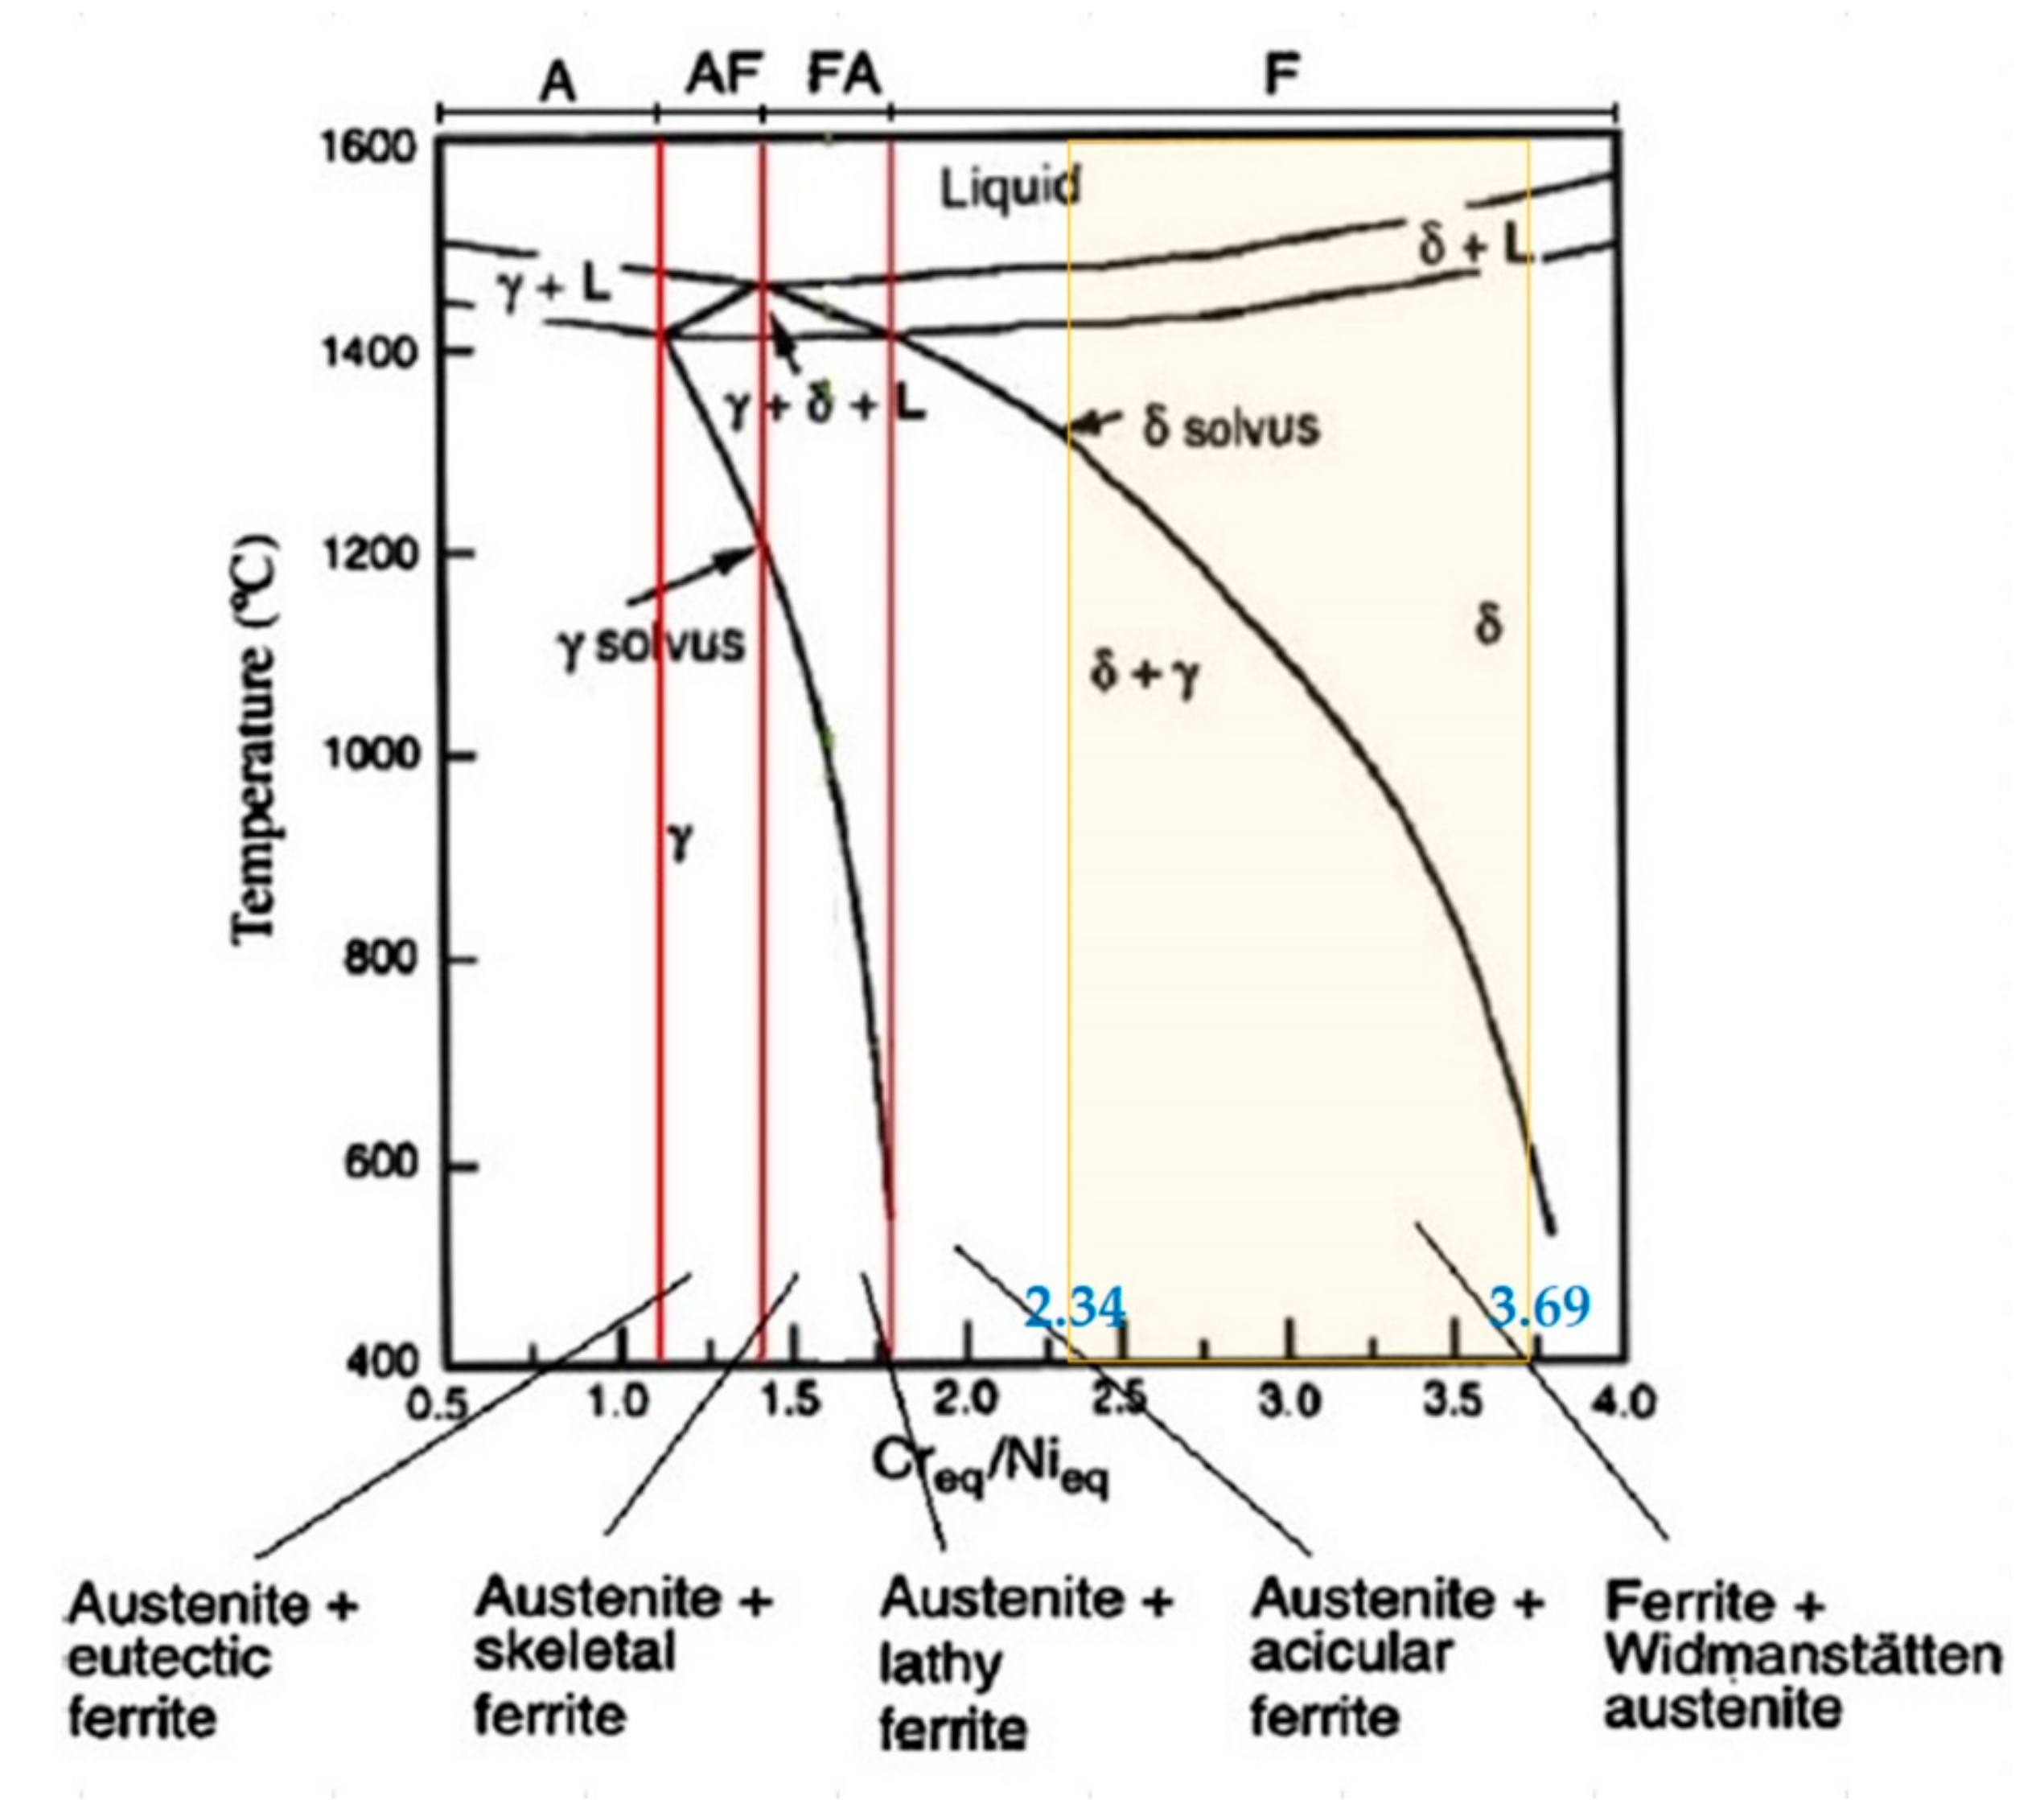
3.6. The Weldment Microstructure

Figure 11 illustrates the schematic of the area-specific microstructure analysis, consisting of areas A (sections of SUS316L and nugget), B (sections of SUS425 and nugget), and C (weld nugget). Specifically, area A represents the BM (SUS316L) and HAZ; area B the BM (SUS425) and HAZ; and area C the FZ. The microstructure analysis was carried out using OM and SEM; and the chemical composition was carried out using EDS.
Figure 12a,b respectively illustrates the microstructure of SUS316L austenitic and SUS425 ferritic stainless steels. The chromium equivalent (Creq) and nickel equivalent (Nieq) were then determined using EDS. The EDS chemical composition was superimposed on the Schaeffler phase diagram (Figure 13). The Creq and Nieq of SUS 316L were 20.84 and 10.06, and those of SUS425 were 16.48 and 0.37, respectively. The microstructure of SUS316L was austenitic and ferritic, while that of SUS425 was fully ferritic. The grain of SUS316L was less coarse than SUS425.
Figure 14, Figure 15 and Figure 16 respectively illustrate the cross-sectional microstructure under 7.0, 8.5 and 10.0 kA weld currents, given a 25-cycle welding time. Specifically, Figure 14a,b, Figure 15a,b and Figure 16a,b, respectively depict area A (SUS316L and HAZ) of the welded specimens under 7.0, 8.5, and 10.0 kA weld currents, given a 25-cycle welding time. The results indicated that SUS316L stainless steel exhibited no phase transformation during RSW, giving rise to larger weld nuggets and HAZ. Figure 14c, Figure 15c and Figure 16c, respectively depict areas A, B, and C under 7.0, 8.5, and 10.0 kA weld currents. Figure 14d, Figure 15d, and Figure 16d respectively show area C (weld nugget or FZ) of welded specimens under 7.0, 8.5, and 10.0 kA weld currents, given a 25-cycle welding time. The FZ were identical for all experimental conditions, exhibiting compression-direction columnar grains [9,24] containing austenite, ferrite and martensite. The volume fractions of austenite, ferrite and martensite were positively correlated with the weld current and welding time, contributing to the variation in the weld nugget microstructure. Figure 14e–f, Figure 15e–f, and Figure 16e–f, respectively depict area B (SUS425 and HAZ) of welded specimens under 7.0, 8.5, and 10.0 kA weld currents, given a 25-cycle welding time. The heat input induced no phase transformation rather ferritic grain growth was exhibited (i.e., coarser grains). The coarser grains of SUS425 HAZ weakened its toughness and strength [25]. Superimposed on the Schaeffler phase diagram, the Creq and Nieq of SUS316L were 23.36 and 12.79 and those of SUS425 were 19.16 and 0.71, respectively. The microstructure of SUS316L was austenitic and ferritic, while that of SUS425 was ferritic.
Table 7 tabulates the EDS chemical composition of welded specimens under variable weld currents, given a 25-cycle welding time. The chemical composition of weldments was positively correlated with the weld current and welding time. Specifically, elevated weld currents caused Cr content the SUS425 side to increase and Ni content the SUS316L side to decrease. In addition, the heat input resulted in the presence of Ni in the FZ on the SUS425 side, and Ni continued to increase as the weld current increased from 7.0 kA to 8.5 kA but declined under 10.0 kA weld current. However, Mo decreased with the increase of weld current (7.0 kA to 8.5 kA) and then inclined under a 10.0 kA weld current while Si decreased with an increase in the weld current.
The microstructure of FZ of SUS316L/SUS425 RSW could be predicted using the Schaeffler phase diagram (Figure 13), and the results are tabulated in Table 8, in which Creq and Nieq were 19.74–21.98 and 5.93–8.53, respectively, indicating the presence of austenite plus martensite plus ferrite. The austenite plus martensite plus ferrite phase improved yield strength and hardness while decreasing elongation [25]. Figure 17a,b respectively depict the 100x and 200x OM images of the FZ of SUS316L/SUS425 RSW at the optimal welding condition (10.0 kA/25-cycle). The microstructure of FZ coincided with the prediction of the Schaeffler phase diagram (Figure 13).
In Figure 18, the FeCrNi pseudo-binary diagram at 70% Fe [5] was utilized to predict the solidification mode of the FZ of SUS316L/SUS425 RSW. The Creq/Nieq ratios of FZ of SUS316L/SUS425 RSW were 2.34–3.69 (Table 8), which were sufficient to induce solidification by delta ferrite (δ-ferrite), followed by transformation into ferrite and austenite and some martensite, especially during rapid cooling. In Figure 18, solidification initiated in the ferrite austenite (FA) mode, resulting in the segregation of gamma from ferrite and alpha from austenite [26] and causing the solidification to finish in the ferrite (F) mode.
Figure 19a–c respectively illustrates the SEM images of the solidification mode of SUS316L/ SUS425 RSW under 7.0, 8.5, 10.0 kA weld currents, given a 25-cycle welding time. In Figure 19a under a 7.0 kA weld current, the solidification was in the FA mode, consisting of austenite plus lathy δ-ferrite in the FZ. In Figure 19b, under an 8.5 kA weld current, the solidification was of austenite plus acicular with δ-ferrite. In Figure 19c, given the optimal welding condition of 10.0 kA/25-cycle, the solidification was of F mode with ferrite plus Widmanstatten austenite. Under the optimal welding condition, Cr and Mo were highly diffused in ferrite, resulting in a substantial volume fraction of δ-ferrite in the FZ.

4. Conclusions

This research investigated the RSW weldment quality and mechanical properties of SUS316L/SUS425 lap joints under variable weld currents (7.0, 8.5, and 10.0 kA) and welding times (25, 38, and 50 cycles). The weldment quality characteristics included the depth of fusions, indentation depths, and nugget diameter, and the mechanical properties under study were the TSF and micro Vickers hardness. Furthermore, the microstructure analysis of the weldments was performed to characterize phase transformation and solidification. Phase transformation was predicted using SEM and EDS alongside a Schaeffler phase diagram and Fe Cr Ni diagram with 70% Fe. The results showed that, with elevated weld current and time, the welding appearance exhibited a canary yellow color due to excessive thermal energy. In addition, the diameters of the melt, HAZ, and FZ rings were positively correlated with the weld current and time. The weldment quality generally improved with an increase in weld current and time, except under 8.5 kA/50-cycle, 10.0 kA/38-cycle, and 10.0 kA/50-cycle conditions. The optimal weldment quality was realized under a 10.0 kA weld current and 25-cycle welding time. TSF was subject to the weld current and welding time, whereby an elevated heat input increased the nugget size and TSF. However, excessive heat input induced expulsion and nugget strength. In this current research, the optimal TSF was achieved under 10.0 kA/25-cycle condition. Fracture failure nevertheless occurred in all experimental conditions and was initiated from the HAZ on SUS425 side. Under the optimal welding condition, the micro hardness of SUS425 and its HAZ were lower due to the full ferrite phase, while that of FZ of SUS316L and SUS425 were almost identical. The micro hardnesses of HAZ and FZ increased with the weld current and welding time. Moreover, the FZ exhibited compression-direction columnar grains, containing austenite, ferrite and martensite. In addition, the volume fractions of austenite, ferrite and martensite were positively correlated with weld current and welding time. The finding also revealed that the solidification was in the ferrite mode with ferrite plus Widmanstatten austenite under the optimal condition. This could be attributed to the high diffusion of Cr and Mo in ferrite, giving rise to a substantial δ-ferrite volume fraction in the fusion zone.

Author Contributions

Conceptualization, K.K.; Data curation, T.K.; Formal analysis, K.K. and T.K.; Investigation, T.K.; Methodology, K.K. and T.K.; Supervision, K.K.; Validation, K.K.; Writing—original draft, T.K.; Writing—review & editing, K.K.

Funding

This research and the APC were funded by Faculty of Engineering, King Mongkut’s Institute of Technology Ladkrabang.

Conflicts of Interest

The authors declare no conflict of interest.

References

  1. Wei, P.S.; Wu, T.H. Workpiece property effects on nugget microstructure determined by heat transfer and solidification rate during resistance spot welding. Int. J. Therm. Sci. 2014, 86, 421–429. [Google Scholar] [CrossRef]
  2. Kim, J.H.; Cho, Y.; Jang, Y.H. Estimation of the weldability of single-sided resistance spot welding. J. Manuf. Syst. 2013, 32, 505–512. [Google Scholar] [CrossRef]
  3. Eisazadeh, H.; Hamedi, M.; Halvaee, A. New parametric study of nugget size in resistance spot welding process using finite element method. Mater. Des. 2010, 31, 149–157. [Google Scholar] [CrossRef]
  4. Kocabekir, B.; Kaçar, R.; Gündüz, S.; Hayat, F. An effect of heat input, weld atmosphere and weld cooling conditions on the resistance spot weldability of 316L austenitic stainless steel. J. Mater. Process. Technol. 2008, 195, 327–335. [Google Scholar] [CrossRef]
  5. Kianersi, D.; Mostafaei, A.; Amadeh, A.A. Resistance spot welding joints of AISI 316L austenitic stainless steel sheets: Phase transformations, mechanical properties and microstructure characterizations. Mater. Des. 2014, 61, 251–263. [Google Scholar] [CrossRef]
  6. Hsieh, C.-C.; Lin, D.-Y.; Chen, M.-C.; Wu, W. Microstructure, Recrystallization, and Mechanical Property Evolutions in the Heat-Affected and Fusion Zones of the Dissimilar Stainless Steels. Mater. Trans. 2007, 48, 2898–2902. [Google Scholar] [CrossRef] [Green Version]
  7. Min, D.; Liu, S.; Hong, H.; Tao, P.; Zhang, P. Strength and infrared assessment of spot-welded sheets on ferrite steel. Mater. Des. 1980-2015 2013, 52, 353–358. [Google Scholar] [CrossRef]
  8. Liu, W.; Wang, R.; Han, J.; Xu, X.; Li, Q. Microstructure and mechanical performance of resistance spot-welded cold-rolled high strength austenitic stainless steel. J. Mater. Process. Technol. 2010, 210, 1956–1961. [Google Scholar] [CrossRef]
  9. Moshayedi, H.; Sattari-Far, I. Resistance spot welding and the effects of welding time and current on residual stresses. J. Mater. Process. Technol. 2014, 214, 2545–2552. [Google Scholar] [CrossRef]
  10. Jagadeesha, T. Experimental studies in weld nugget strength of resistance spot-welded 316L austenitic stainless steel sheet. Int. J. Adv. Manuf. Technol. 2017, 93, 505–513. [Google Scholar] [CrossRef]
  11. Alizadeh-Sh, M.; Marashi, S.P.H.; Pouranvari, M. Resistance spot welding of AISI 430 ferritic stainless steel: Phase transformations and mechanical properties. Mater. Des. 1980-2015 2014, 56, 258–263. [Google Scholar] [CrossRef]
  12. Vignesh, K.; Elaya Perumal, A.; Velmurugan, P. Optimization of resistance spot welding process parameters and microstructural examination for dissimilar welding of AISI 316L austenitic stainless steel and 2205 duplex stainless steel. Int. J. Adv. Manuf. Technol. 2017, 93, 455–465. [Google Scholar] [CrossRef]
  13. Bina, M.H.; Jamali, M.; Shamanian, M.; Sabet, H. Investigation on the resistance spot-welded austenitic/ferritic stainless steel. Int. J. Adv. Manuf. Technol. 2014, 75, 1371–1379. [Google Scholar] [CrossRef]
  14. Essoussi, H.; Elmouhri, S.; Ettaqi, S.; Essadiqi, E. Microstructure and mechanical performance of resistance spot welding of AISI 304 stainless steel and AISI 1000 series steel. Procedia Manuf. 2019, 32, 872–876. [Google Scholar] [CrossRef]
  15. Alenius, M.; Pohjanne, P.; Somervuori, M.; Hanninen, H. Exploring the Mechanical Properties of Spot Welded Dissimilar Joints for Stainless and Galvanized Steels. Weld. J. 2006, 85, 305–313. [Google Scholar]
  16. Sun, X.; Stephens, E.V.; Khaleel, M.A. Effects of fusion zone size and failure mode on peak load and energy absorption of advanced high strength steel spot welds under lap shear loading conditions. Eng. Fail. Anal. 2008, 15, 356–367. [Google Scholar] [CrossRef]
  17. Zhang, H.; Senkara, J. Resistance Welding Fundamentals and Applications, 2nd ed.; Taylor & Francis Group: Abingdon, UK, 2011. [Google Scholar]
  18. Khuenkaew, T.; Kanlayasiri, K. Selection of electrode tips for the resistance spot welding of dissimilar stainless steels. MATEC Web Conf. 2018, 192, 01007. [Google Scholar] [CrossRef]
  19. Tutar, M.; Aydin, H.; Bayram, A. Effect of weld current on the microstructure and mechanical properties of a resistance spot-welded TWIP steel sheet. Metals 2017, 7, 519. [Google Scholar] [CrossRef]
  20. Moshayedi, H.; Sattari-Far, I. Numerical and experimental study of nugget size growth in resistance spot welding of austenitic stainless steels. J. Mater. Process. Technol. 2012, 212, 347–354. [Google Scholar] [CrossRef]
  21. Hayat, F. The effects of the welding current on heat input, nugget geometry, and the mechanical and fractural properties of resistance spot welding on Mg/Al dissimilar materials. Mater. Des. 2011, 32, 2476–2484. [Google Scholar] [CrossRef]
  22. Yuan, X.; Li, C.; Chen, J.; Li, X.; Liang, X.; Pan, X. Resistance spot welding of dissimilar DP600 and DC54D steels. J. Mater. Process. Technol. 2017, 239, 31–41. [Google Scholar] [CrossRef]
  23. Khuenkaew, T.; Kanlayasiri, K. Optimizing the resistance spot-welding process for dissimilar stainless steels. IOP Conf. Ser. Mater. Sci. Eng. 2018, 361, 012005. [Google Scholar] [CrossRef]
  24. Li, Y.; Wei, Z.; Li, Y.; Shen, Q.; Lin, Z. Effects of cone angle of truncated electrode on heat and mass transfer in resistance spot welding. Int. J. Heat Mass Transf. 2013, 65, 400–408. [Google Scholar] [CrossRef]
  25. Charde, N.; Rajkumar, R. Investigating spot weld growth on 304 austenitic stainless steel (2 mm) sheets. J. Eng. Sci. Technol. 2013, 8, 69–76. [Google Scholar]
  26. Mohammed, G.R.; Ishak, M.; Aqida, S.N.; Abdulhadi, H.A. Effects of heat input on microstructure, corrosion and mechanical characteristics of welded austenitic and duplex stainless steels: A review. Metals 2017, 7, 39. [Google Scholar] [CrossRef]
Figure 1. Cross-sectional schematic of SUS316L/SUS425 weldment in a transverse direction, where t1 and t2 are the depth of fusion, h1 and h2 the indentation depth, and di is the nugget diameter.
Metals 09 00710 g001
Figure 2. Appearance of the SUS316L/SUS425 resistance spot welded joint.
Metals 09 00710 g002
Figure 3. Visual appearances of SUS316L/SUS425 lap joints under 25-, 38-, 50-cycle welding times: (a) 7.0; (b) 8.5; (c) 10.0 kA weld currents.
Metals 09 00710 g003
Figure 4. Macrostructure of RSW joints under welding parameters: weld current(kA)/welding time(cycles) (a) 7.0/25; (b) 7.0/38; (c) 7.0/50; (d) 8.5/25; (e) 8.5/38; (f) 8.5/50; (g) 10.0/25; (h) 10.0/38; (i) 10.0/50.
Metals 09 00710 g004
Figure 5. Effect of weld current and welding time on weldment quality metrics: (a) t1; (b) t2; (c) h1; (d) h2; (e) di.
Metals 09 00710 g005
Figure 6. Tensile shear force of lap joints under 25, 38, and 50-cycle welding times given weld currents of: (a) 7.0; (b) 8.5; (c) 10.0 kA.
Metals 09 00710 g006
Figure 7. Tensile surface fracture of the pullout failure mode.
Metals 09 00710 g007
Figure 8. Micro hardness profiles of welded specimens given a 7.0 kA weld current: (a) 25; (b) 38; (c) 50-cycle welding times.
Metals 09 00710 g008
Figure 9. Micro hardness profiles of welded specimens given an 8.5 kA weld current: (a) 25; (b) 38; (c) 50-cycle welding times.
Metals 09 00710 g009
Figure 10. Micro hardness profiles of welded specimens given a 10.0 kA weld current: (a) 25; (b) 38; (c) 50-cycle welding times.
Metals 09 00710 g010
Figure 11. Schematic of area-specific microstructure analysis.
Metals 09 00710 g011
Figure 12. SEM images of the base metals: (a) SUS316L; (b) SUS425.
Metals 09 00710 g012
Figure 13. Schaeffler phase diagram.
Metals 09 00710 g013
Figure 14. Cross-sectional microstructure of weldment under a 7.0 kA weld current and 25-cycle welding time.
Metals 09 00710 g014
Figure 15. Cross-sectional microstructure of weldment under an 8.5 kA weld current and 25-cycle welding time.
Metals 09 00710 g015
Figure 16. Cross-sectional microstructure of weldment under a 10.0 kA weld current and 25-cycle welding time.
Metals 09 00710 g016
Figure 17. OM images of the fusion zone of SUS316L/SUS425 RSW: (a) 100x; (b) 200x.
Metals 09 00710 g017
Figure 18. Pseudo-binary FeCrNi diagram at 70% Fe.
Metals 09 00710 g018
Figure 19. SEM images of the solidification mode of SUS316L/SUS425 RSW, given 25-cycle welding time, under (a) 7.0 kA; (b) 8.5 kA; (c) 10.0 kA weld currents.
Metals 09 00710 g019
Table 1. Chemical composition of base metals (wt %).
MaterialElement
CSiMnPSCrNiMoFe
SUS316L0.020.250.750.010.000317.0710.461.64Balance
SUS4250.010.830.090.010.00313.480.060.02Balance
Table 2. Mechanical properties of base metals.
MaterialHardnessYield StrengthTensile StrengthElongation
(HV)(N/mm2)(N/mm2)(%)
SUS316L218(max)205(min)520(min)35(min)
SUS425200(max)205(min)410(min)25(min)
Table 3. Physical properties of base metals.
MaterialSpecific HeatDensityElectrical ResistivityThermal ExpansionThermal Conductivity
(J/kg °C)(kg/m3)(μΩ·m)(°C−1)(W/m °C)
SUS316L5008000751.7 × 10−515
SUS4254607720611.6 × 10−524.2
Table 4. Constant welding parameters.
Electrode ForceSqueeze TimeHolding TimeWeld Atmosphere
(kN)(cycles/s)(cycles/s)
3.345/0.950/1.0ambient
Table 5. Macrostructure of five quality metrics.
Welding Parameters
Weld Current (kA)/
Welding Time (cycles)
Average Values of Weldment Quality Metrics (mm)
Depth of Fusion 1
(t1)
Depth of Fusion 2
(t2)
Indentation Depth 1
(h1)
Indentation Depth 2
(h2)
Nugget Diameter (di)
7.0/251.051.120.170.226.01
7.0/381.061.110.170.246.03
7.0/501.081.090.240.286.16
8.5/251.051.190.250.247.13
8.5/381.061.160.260.277.53
8.5/501.031.070.290.297.22
10.0/251.061.160.330.348.03
10.0/380.970.980.520.357.02
10.0/500.910.940.610.396.38
Table 6. Optimal welding condition.
Electrode ForceWeld CurrentWelding TimeSqueeze TimeHolding TimeWeld Atmosphere
(kN)(kA)(cycles/s)(cycles/s)(cycles/s)
3.310.025/0.545/0.950/1.0ambient
Table 7. EDS chemical composition of welded specimens (i.e., fusion zone) given a 25-cycle welding time (wt.%).
MaterialWeld Element
Current (kA)CrNiMoSiFeOther
SUS316L7.018.167.640.140.9672.680.42
8.518.657.660.320.6772.010.69
10.020.695.830.270.6171.990.61
SUS4257.016.436.961.371.3871.012.85
8.517.478.161.000.9171.481.00
10.019.276.851.270.9068.663.05
Table 8. Cr and Ni equivalents and ratios of area C (the FZ of SUS316L and SUS425).
Weld Current (kA)CreqNieqCreq/Nieq
SUS316LSUS425SUS316LSUS425SUS316LSUS425
7.019.7420.137.648.062.582.50
8.520.0619.967.868.532.552.34
10.021.8921.985.938.053.692.73

