Article

Effect of Carbide Precipitation on the Evolution of Residual Stress during Tempering

Institute for Advanced Materials and Technology, University of Science and Technology Beijing, 30 Xueyuan Road, Beijing 100083, China
*
Author to whom correspondence should be addressed.
Metals 2019, 9(6), 709; https://doi.org/10.3390/met9060709
Submission received: 6 June 2019 / Revised: 18 June 2019 / Accepted: 21 June 2019 / Published: 24 June 2019

Abstract

:
The evolution of microstructure and residual stress during the tempering of 700 L low-carbon micro-alloyed steel was studied using a crack compliance method for measuring residual stress. Additionally, a non-isothermal tempering dilatation test, Vickers micro-hardness test, and transmission electron microscopy were used. The evolution of residual stress during tempering consists of two stages. The first stage coincided with cementite precipitation. Under the initial residual stress, the transformation plasticity due to cementite precipitation leads to partial relaxation of the micro-stress evoked by the austenite-to-ferrite transformation during quenching. It also caused the material surface and the core to exhibit different residual stress evolution trends. After tempering at 300 °C for 30 min, the residual stress was reduced from 487 MPa to 200 MPa; however, the elastic strain energy remained unchanged. The second stage coincided with alloy carbide precipitation and Mn partitioning, but the precipitation of the alloy carbide only reduced the elastic strain energy by 8.7%. Thus, the change in activation energy was the main reason for the relaxation of residual stress at this stage. After tempering at 600 °C for 30 min, the residual stress was reduced to 174 MPa, the elastic strain energy was reduced by 72.72%, and the residual stress was controlled.

1. Introduction

As a mature structural material, low-carbon, micro-alloyed, high-strength steel is widely used in energy, transportation, construction, and other industries. In order to reduce the material cost and improve the welding performance, grain-boundary strengthening, precipitation strengthening, and phase transformation strengthening has become the main way to develop high-strength steel materials [1]. However, the resulting residual stress [2,3] frequently causes problems including a decrease in material fatigue performance, deformation during processing, and stress corrosion.
Research has focused on reducing the internal stress of quenching and obtaining high-strength steel products with stable structures and ideal properties [4,5]. Vieira [6] used a non-isothermal tempering dilatation test and Mössbauer spectrometer to study the tempering process of medium-carbon steel and determined the main reaction stage in the tempering process. From the perspective of mechanical properties, Ritter et al. [7] investigated the non-isothermal stress relaxation of carbon-manganese steel. They found that nearly all the relaxation occurred in the heating stage of the thermal cycle, and the stress relaxation was related to the changes in elastic modulus, yield strength, and creep deformation with temperature and time. Creep and dislocation have always been the main theories explaining residual stress relaxation [8], but many researchers believe that creep will only occur when the temperature is higher than 0.3 Tm (melting temperature) [7,9]. Therefore, there is no unified understanding of the relaxation mechanism of residual stress in the tempering process.
In 1965, Greenwood-Johnson [10] observed an irreversible plastic strain during the metallurgical transformation under a small external stress that is less than the yield stress of the weaker phase—this phenomenon is defined as phase transformation plasticity. Denis [11] et al. found that phase transformation plasticity had an important impact on the formation of residual stress during quenching. Inspired by this finding, Morra [12] studied the tempering process of SAE 52,100(American Society of Automotive Engineers Standard) under uniaxial loading. Irreversible plastic deformation similar to phase transformation plasticity also occurred when the nanoscale carbides in the material were dissolved or coarsened. This irreversible plastic deformation was defined as coarsening-induced plasticity.
Kaiser [13] studied the tempering behavior of AISI 4140 steel (American Iron and Steel Institute Standard). They applied a uniaxial load to simulate the residual stress in the material and found that a transformation plastic strain of 0.6% was generated at the cementite precipitation stage of 300 °C under a uniaxial load of 358 MPa. This further proved that there is a transformation plasticity phenomenon in carbide precipitation during tempering. Later, Bensely [14] used a comparative method to study the residual stress distribution of the carburized steel En353. The results showed that due to the increased precipitation of fine carbides during the cryogenic process, the specimen that was subjected to subsequent tempering underwent a reduction in compressive residual stress.
Tempering is a process of interweaving multiple types of reactions and, to the best of our knowledge, there has been no consensus on the regulation mechanism of residual stress in the tempering process of high-strength steel. The actual production process still stays in the empirical stage. Thus, in order to reduce the residual stress, it is necessary to prolong the tempering time and increase the tempering temperature [15]. This is not an effective treatment for residual stress, and high costs are inevitable. Therefore, understanding the regulation mechanism of residual stress during tempering is an important basis for solving the problem of residual stress in high-strength steel.
In this paper, 700 L high-strength structural steel was the focus of the study. A non-isothermal tempering dilatation analysis, scanning electron microscopy (SEM), transmission electron microscopy (TEM), Vickers micro-hardness measurements, and other methods were used to investigate the microstructural evolution during the tempering process. The residual stress distribution inside 700 L before and after tempering at different temperatures was measured via the crack compliance method. In addition, the transformation, especially carbide precipitation, during tempering was analyzed and the influence of tempering on the evolution of residual stress was discussed. This study provides the foundation for the control of residual stress of low-carbon micro-alloyed steel.

2. Materials and Methods

2.1. Materials

The experiments presented in this paper were carried out using 700 L low-carbon micro-alloyed steel, provided by the HBIS Group Technology Research Institute (Shijiazhuang, China), which had the chemical composition shown in Table 1.

2.2. Non-Isothermal Tempering Test

Non-isothermal tempering tests were performed on a TA DIL 805 L (TA Instruments Corp. New Castle, PA, USA) dilatometer with a resolution of 50 nm. A short cylindrical specimen (diameter of Φ4 mm and a length of 10 mm) was machined from the middle of the untreated hot-rolled steel sheet along the rolling direction. The specimen was heated from room temperature to 700 °C at 2 °C/min and then cooled to room temperature at 50 °C/min. A second thermal cycle was then performed at the same ramp rate. The process curve of the non-isothermal tempering test is shown in Figure 1.

2.3. Measurement of Residual Stress

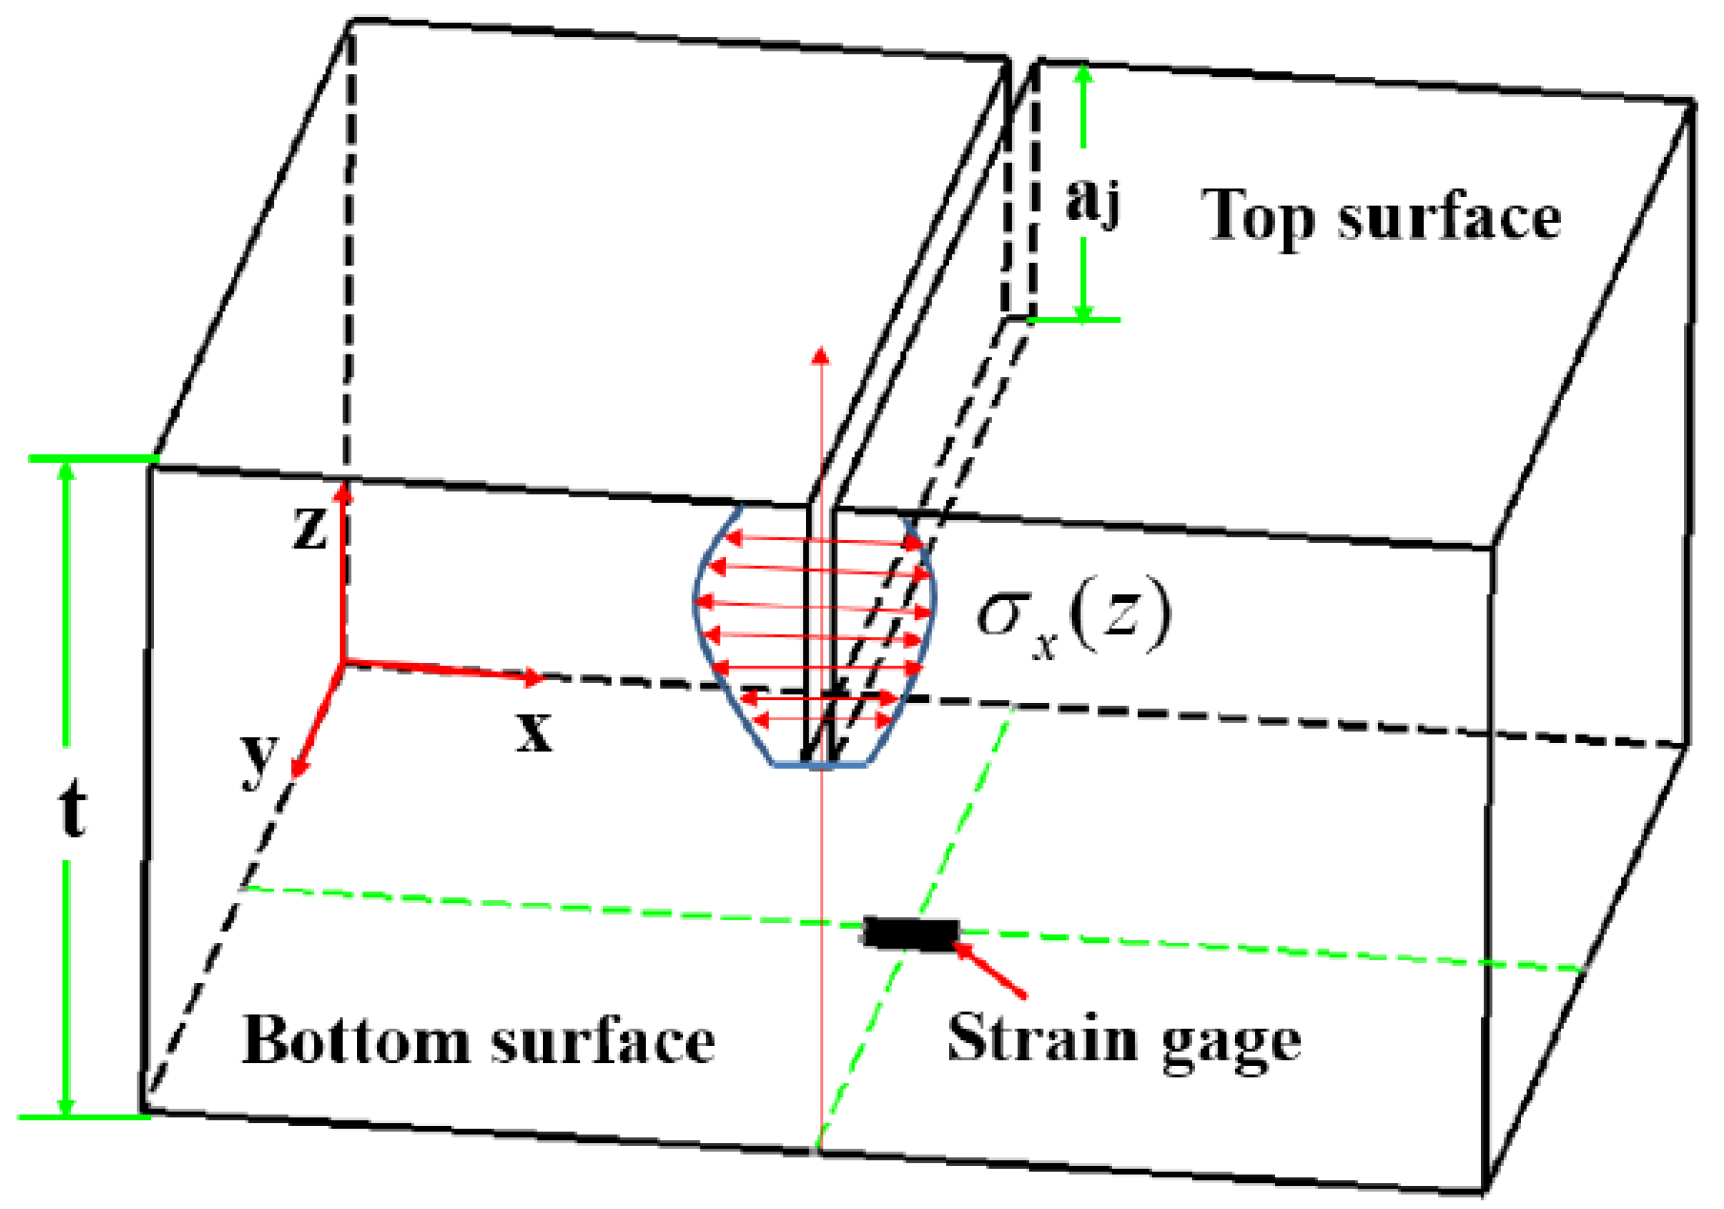
Eight specimens (80 × 80 × 16 mm3) were taken from the middle of the steel plate with a wire cutter. One of these specimens was used to measure the residual stress before tempering. The remaining seven pieces were placed in a box furnace, heated to 100–700 °C (temperature increment being 50 °C), taken out after 30 min, and then subjected to measurement of residual stress using the crack compliance method [16]. The crack compliance method is based on the principle of elastic fracture mechanics. It is a technique capable of measuring residual stress along the thickness direction of a material. Specifically, the method introduces a slit with progressively increasing depth to release the residual stress on the test plane, and the deformation induced by the release of residual stress is recorded as a function of the slit depth and used to determine the preexisting residual stress. The strain measurements are shown in Figure 2. The determination of residual stress from measured strain is an inverse mechanics problem, and residual stress is computed through the least-squares inversion of a linear system called the compliance matrix, which is determined from finite element analysis. The specific stress computation procedure employed is described in detail by Prime [16,17].
Typically, incremental slitting is performed using a wire electric discharge machine (EDM) (CNC Machine Tool Corp. Jiangzhou, China), with a molybdenum wire 0.18 mm in diameter. The width of the slit after cutting was 0.20 mm. The released strain is read from a commercial bridge-type strain indicator attached to a foil phenolic-acetal resistance strain gage (BE120-3AA), with the size of the sensitive grid being 3.8 × 2.0 mm. The slit was cut in 0.6 mm increments to a final depth of 15.6 mm.

2.4. TEM Analysis

A square specimen (10 × 10 × 0.3 mm3) was cut from a heat-treated specimen, and the thickness was ground to 80 μm or less on sandpaper with different grit numbers. Then, a small disk (diameter of Φ3 mm) was punched out on a special punching machine. Thin TEM foils were prepared by a twin-jet electrochemical polisher at 50 V in a 4 vol.% perchloric acid alcohol electrolyte at −30 °C, and then investigated with a JSM2100F (JSOL Corp. Kyoto, Japan) field emission electron microscope operated at 200 kV.

2.5. Vickers Micro-Hardness

The Vickers micro-hardness specimens were taken from the above heat-treated plate, mechanically ground, and subsequently polished using diamond suspensions of 6, 3, and 1 μm. The specimens were then analyzed using the Vickers indenter MICRO-586 (HuaTai Corp. Wuhan, China) by applying a load of 4.9 N with a dwell time of 10 s. Six points were measured per specimen; these were averaged as the final value.

3. Results

3.1. Evolution of 700L Microstructure during Tempering

3.1.1. Stages in the Tempering Process

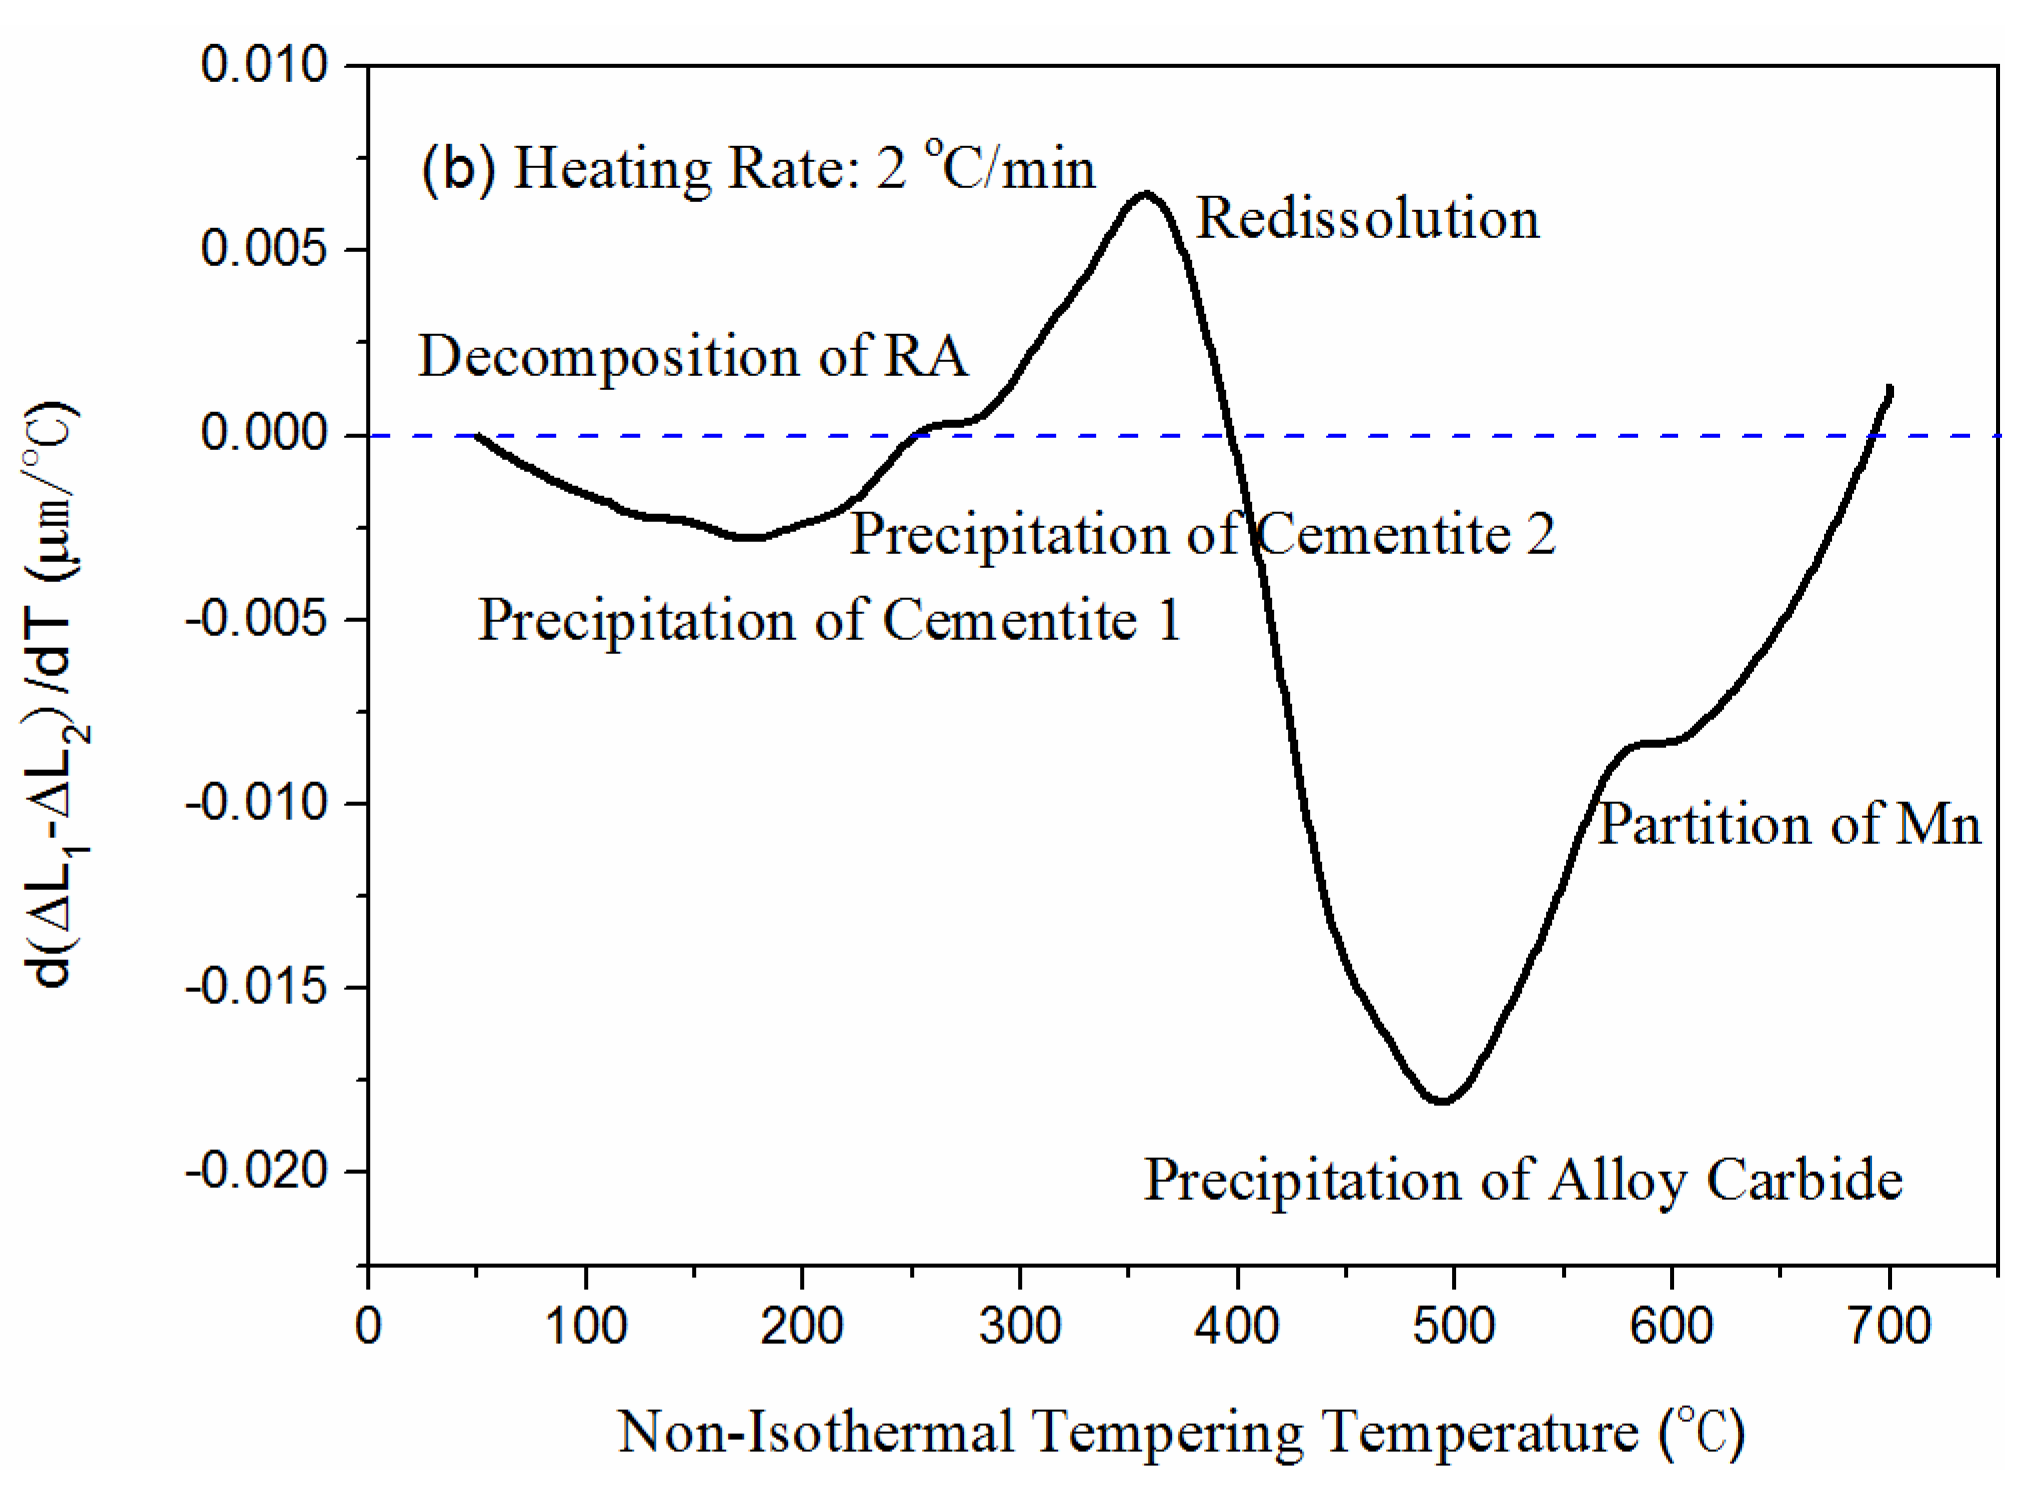
In the non-isothermal tempering process, the tempering reaction mainly occurs during the heating process of the first step of tempering [7]. Therefore, the impact on the changes in length caused by the temperature dependence of the thermal expansion coefficient can be easily deducted using the second non-isothermal tempering step as a baseline. This approach clearly reveals features associated with the tempering process. The effectiveness of this method has been confirmed elsewhere [18,19,20]. The changes in length of 700 L during the first and second steps of tempering were ΔL1 and ΔL2, respectively, and the difference between the length changes from the two steps were (ΔL1−ΔL2) as shown in Figure 3a. The first derivative of the difference between the length changes with respect to temperature (d(ΔL1−ΔL2)/dT) is shown in Figure 3b. Figure 4 shows the photomicrographs of the microstructure after tempering at different temperatures for 30 min.
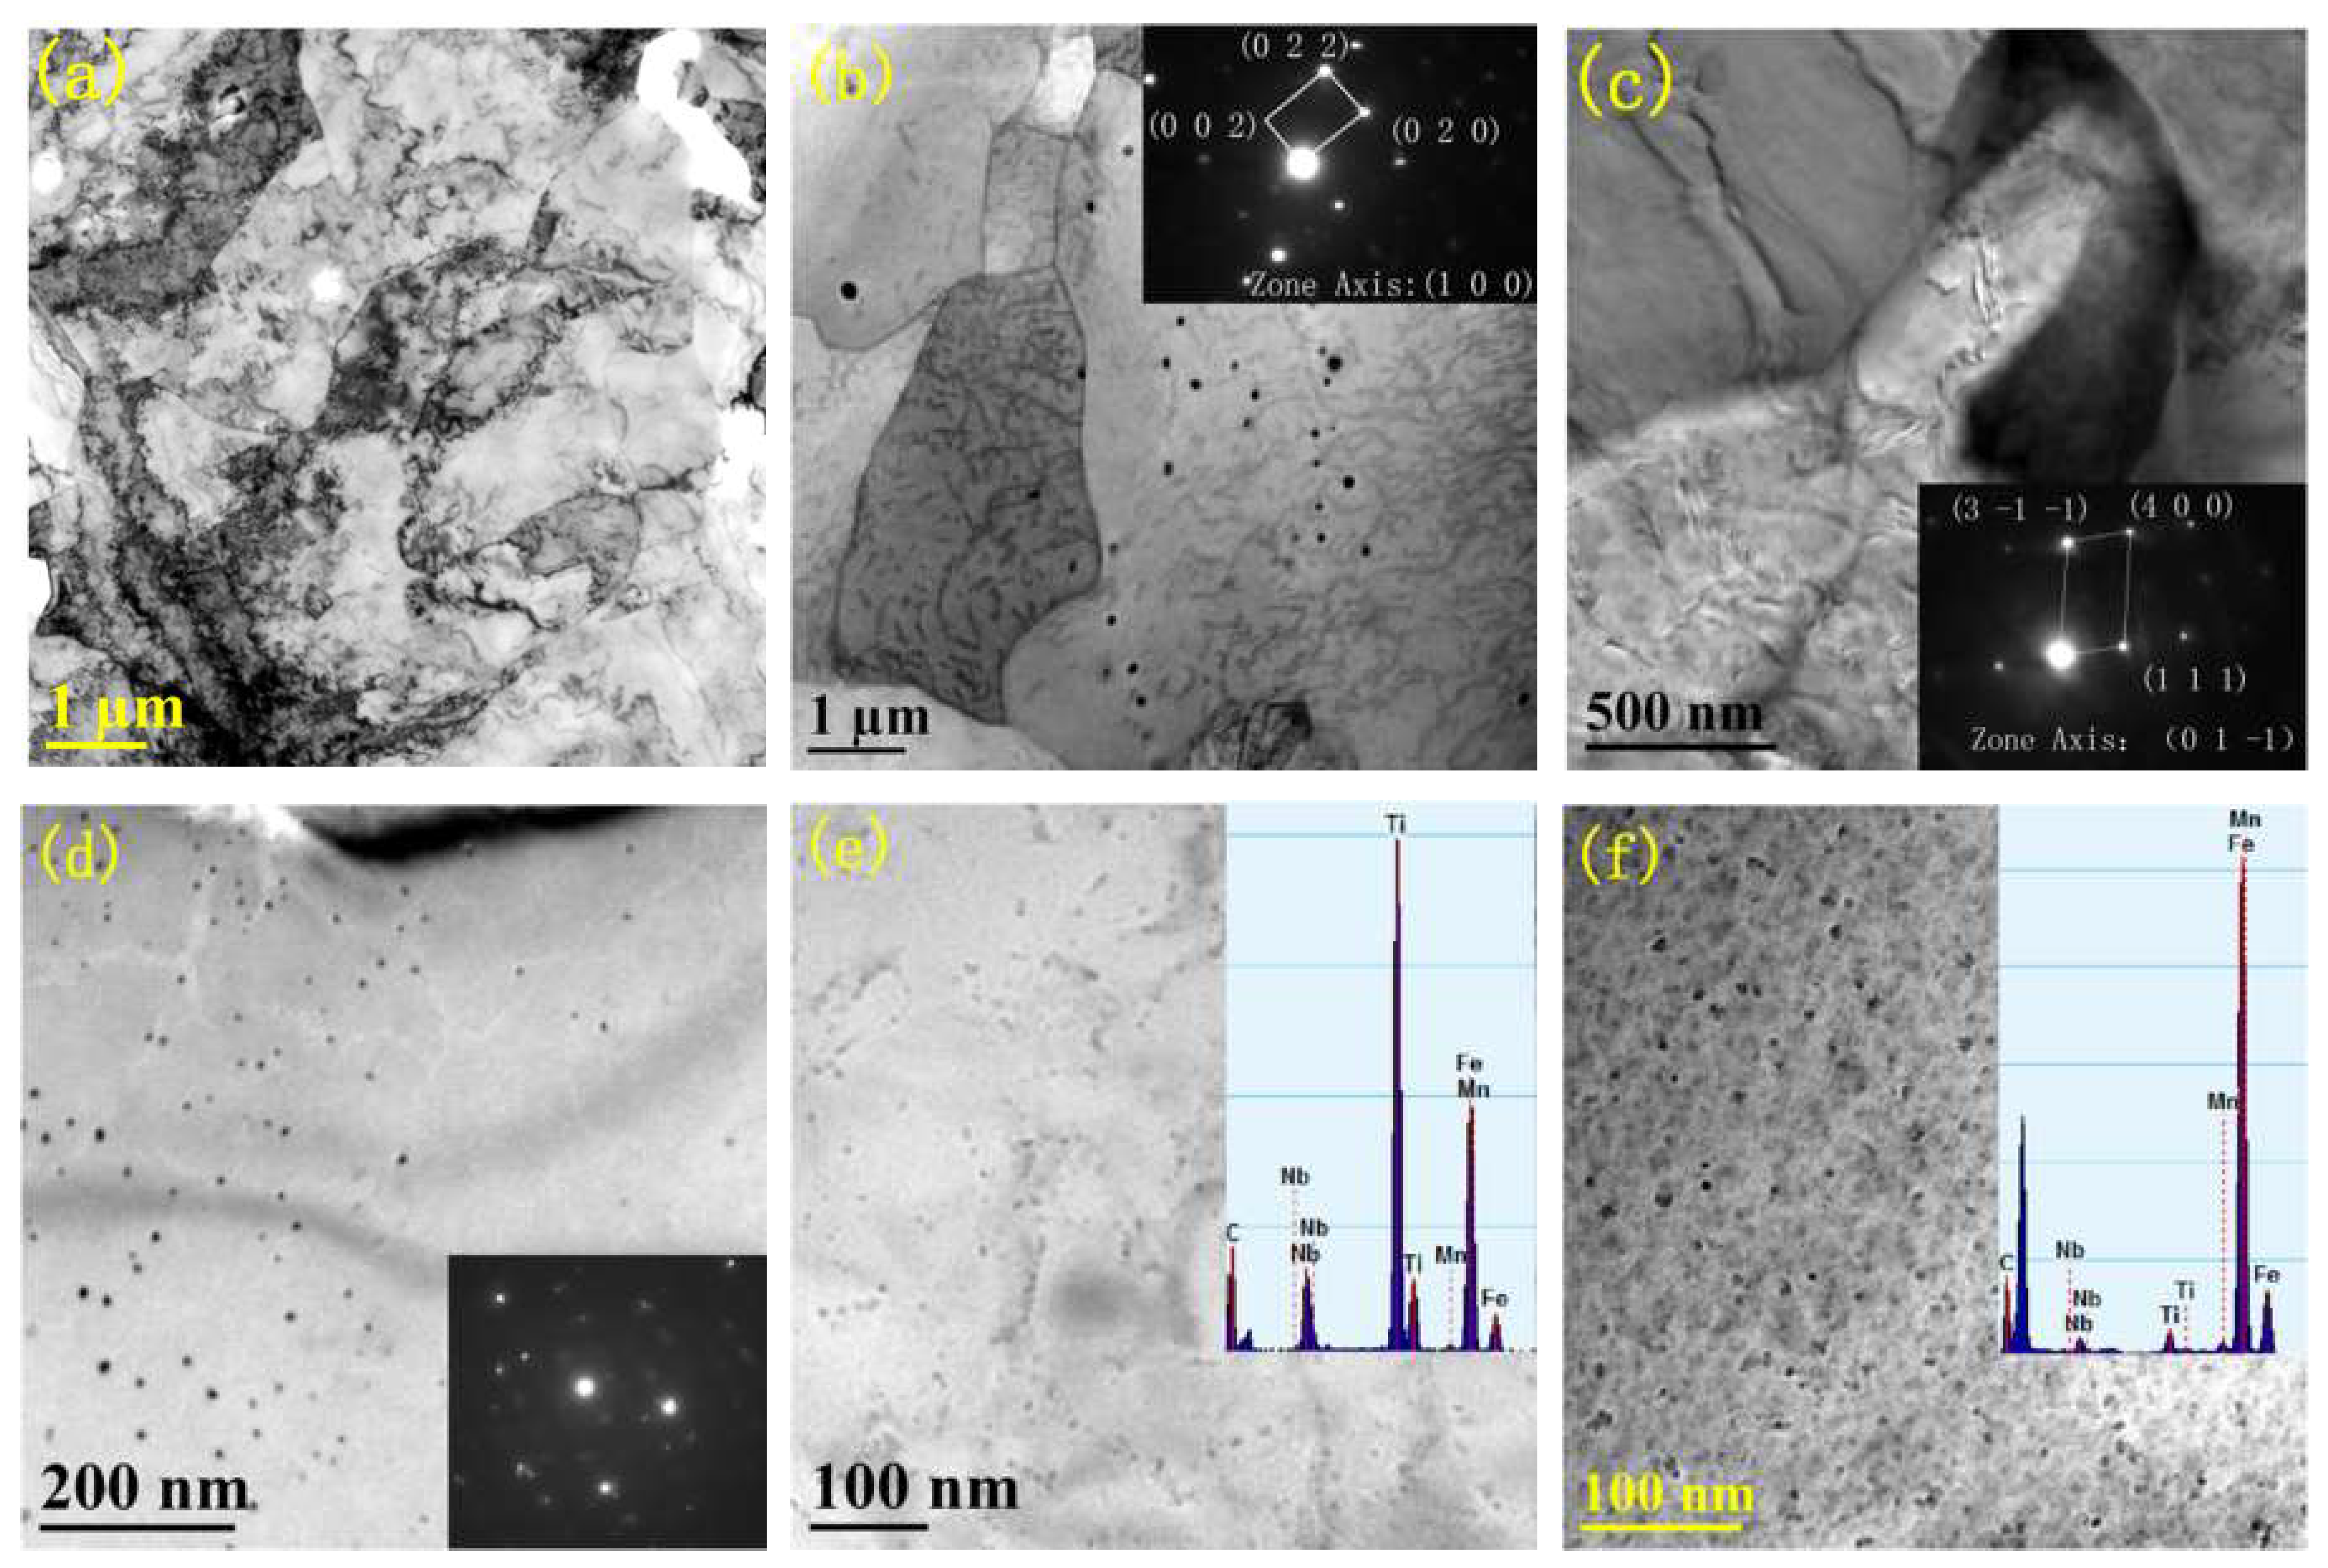
Six stages can be identified in Figure 3b, which will be discussed according to their temperature. The first stage is from 50 °C to 200 °C, and it is associated with carbon segregation and clustering, as well as cementite I precipitation; during this stage, carbon was precipitated from ferrite and carbide formation, leading to a slight shrinkage in the length of the specimen. The selected area diffraction pattern at 200 °C (Figure 4b) shows that unlike the tempering process of martensite [6,21], transition carbides did not precipitate from 700 L in this temperature range; however, the cementite did directly precipitate. This is mainly due to the low carbon content in 700 L. The second stage involved the decomposition of retained austenite from 200–300 °C. The hot-rolled plate contained only a small amount of retained austenite (RA), and thus the reaction at this stage was not significant, therefore the increase in length of the specimen was small as shown on the dilatation curve. The TEM image in Figure 4c shows that a small amount of retained austenite was decomposed during this stage.
The third stage involved the precipitation of cementite II from 250–350 °C. This stage was not obvious on the dilatation curve, but the TEM image in Figure 4d shows that a large amount of cementite precipitated from the ferrite at 300 °C. During the tempering process of 700 L, the decomposition reaction of retained austenite in the second stage and the precipitation reaction of cementite II in the third stage overlapped substantially. This is similar to the tempering reaction of the martensite structure [22]. In the fourth stage, from 350 °C to 425 °C, the cementite dissolution provided C for alloy carbide formation, which led to an increase in the specimen length due to the increase of carbon in ferrite expanding the lattice. Ustinovshchikov [23] and Yamasaki et al. [24] also observed the dissolution of cementite at this stage when studying the tempering of the Fe-C-Mo ternary alloy.
At the fifth stage, the alloy carbides precipitated at 450–575 °C. During this stage, the carbon separated from cementite and combined with alloying elements, such as Ti and Nb, to form alloy carbides. This significantly reduced the specimen size. The TEM image in Figure 4e shows that a large amount of alloy carbides precipitated from the matrix, and at the same time, the length of the specimen was shortened significantly. Analysis of the EDS spectrum showed that these particles appeared to be (TiNb)C. During the sixth stage, Mn was segregated from the matrix to cementite at 575–650 °C. It can be seen from Figure 4f that the Mn content in the carbides is significantly increased at this stage. Clarke et al. [25] also observed the existence of Mn partitioning during this temperature. The segregation of Mn from the ferrite matrix could reduce the distortion of the ferrite lattice [26], and thus the length of the specimen shrunk during this process.
The hardness curve of the tempering process verified the observations detailed above. Figure 5 shows the hardness curve after tempering for 30 min at different temperatures. There are three hardness peaks on the curve. These correspond to the three stages including cementite precipitation, alloy carbide precipitation, and Mn partitioning. Therefore, carbide precipitation was the main reaction in the tempering process of 700 L.

3.1.2. Evolution of Dislocation during Tempering

Figure 6 shows the TEM images of 700 L before tempering (Figure 6a) and after tempering at 200 °C (Figure 6b), 300 °C (Figure 6c), and 600 °C (Figure 6d) for 30 min. There were two different types of dislocations in 700 L. The first type included the dislocation tangles and dislocation cells, which were pinned by carbides as shown in Figure 6a. These types of dislocation cells remained in some of the ferrite grains even after tempering at 600 °C as shown in Figure 6d. Another type of dislocation was relatively straight (Figure 6b). These dislocations were gradually annihilated during tempering at 300 °C as shown in Figure 6c. Some researchers believe that the straight dislocations are evoked by the austenite-to-ferrite transformation in steel, due to the difference in volume between them. [27]. This implies that the straight dislocations are related to the type II residual stress.

3.2. Residual Stress Test

3.2.1. Characterization Parameters of Residual Stress

In addition to the surface stress and core stress of the material, two characterization parameters of residual stress were defined in order to accurately describe the evolution of residual stress during tempering—the absolute value of residual stress ( | σ R S | ) and the elastic strain energy of residual stress (ERS). The absolute value of residual stress ( | σ R S | ) is the difference between the maximum and minimum residual stress of a point on the material in the thickness direction, which can be used to evaluate the uniformity of residual stress in the thickness direction of the point; this is shown in Equation (1):
| σ R S | = | σ max σ min |
where | σ R S | is the absolute value of the residual stress in MPa, σ_max is the maximum value of residual stress in the thickness direction of the measuring point in MPa, and σ_min is the minimum value of residual stress in the thickness direction of the measuring point in MPa.
The elastic strain energy of residual stress (ERS) is the integral of the absolute value of the residual stress, which can be used to measure the mean level of the residual stress in the thickness direction, as shown in Equation (2):
E R S = 0 x | σ R S | d x
where ERS is the unit elastic strain energy of residual stress in MPa∙mm.

3.2.2. Measurement Result of Residual Stress

Figure 7 compares the residual stress distribution along the thickness of the 700 L plate before tempering and after tempering at 200 °C, 300 °C, and 600 °C for 30 min. After tempering at 200 °C, the residual stress does not change much; but at 600 °C, the residual stress is greatly reduced. The absolute value and elastic deformation energy of the residual stress at these temperatures are shown in Table 2 and Table 3, respectively.
Table 2 shows that after tempering at 200 °C, 300 °C, and 600 °C for 30 min, the absolute value of the residual stress in the thickness direction of the 700L plate was reduced from 487 MPa to 460 MPa, 200 MPa, and 174 MPa, respectively. These are 94.45%, 41.07%, and 35.73% of the initial value of the residual stress for the hot-rolled steel plate.
In Table 3, the elastic strain energy after tempering at 200 °C and 300 °C were similar or slightly increased compared with those before tempering. The specimens tempered at 600 °C have an elastic deformation energy that was only 27.28% of the value before tempering; thus, the residual stress level was significantly reduced.

3.3. Effect of Evolution of Microstructure on Residual Stress

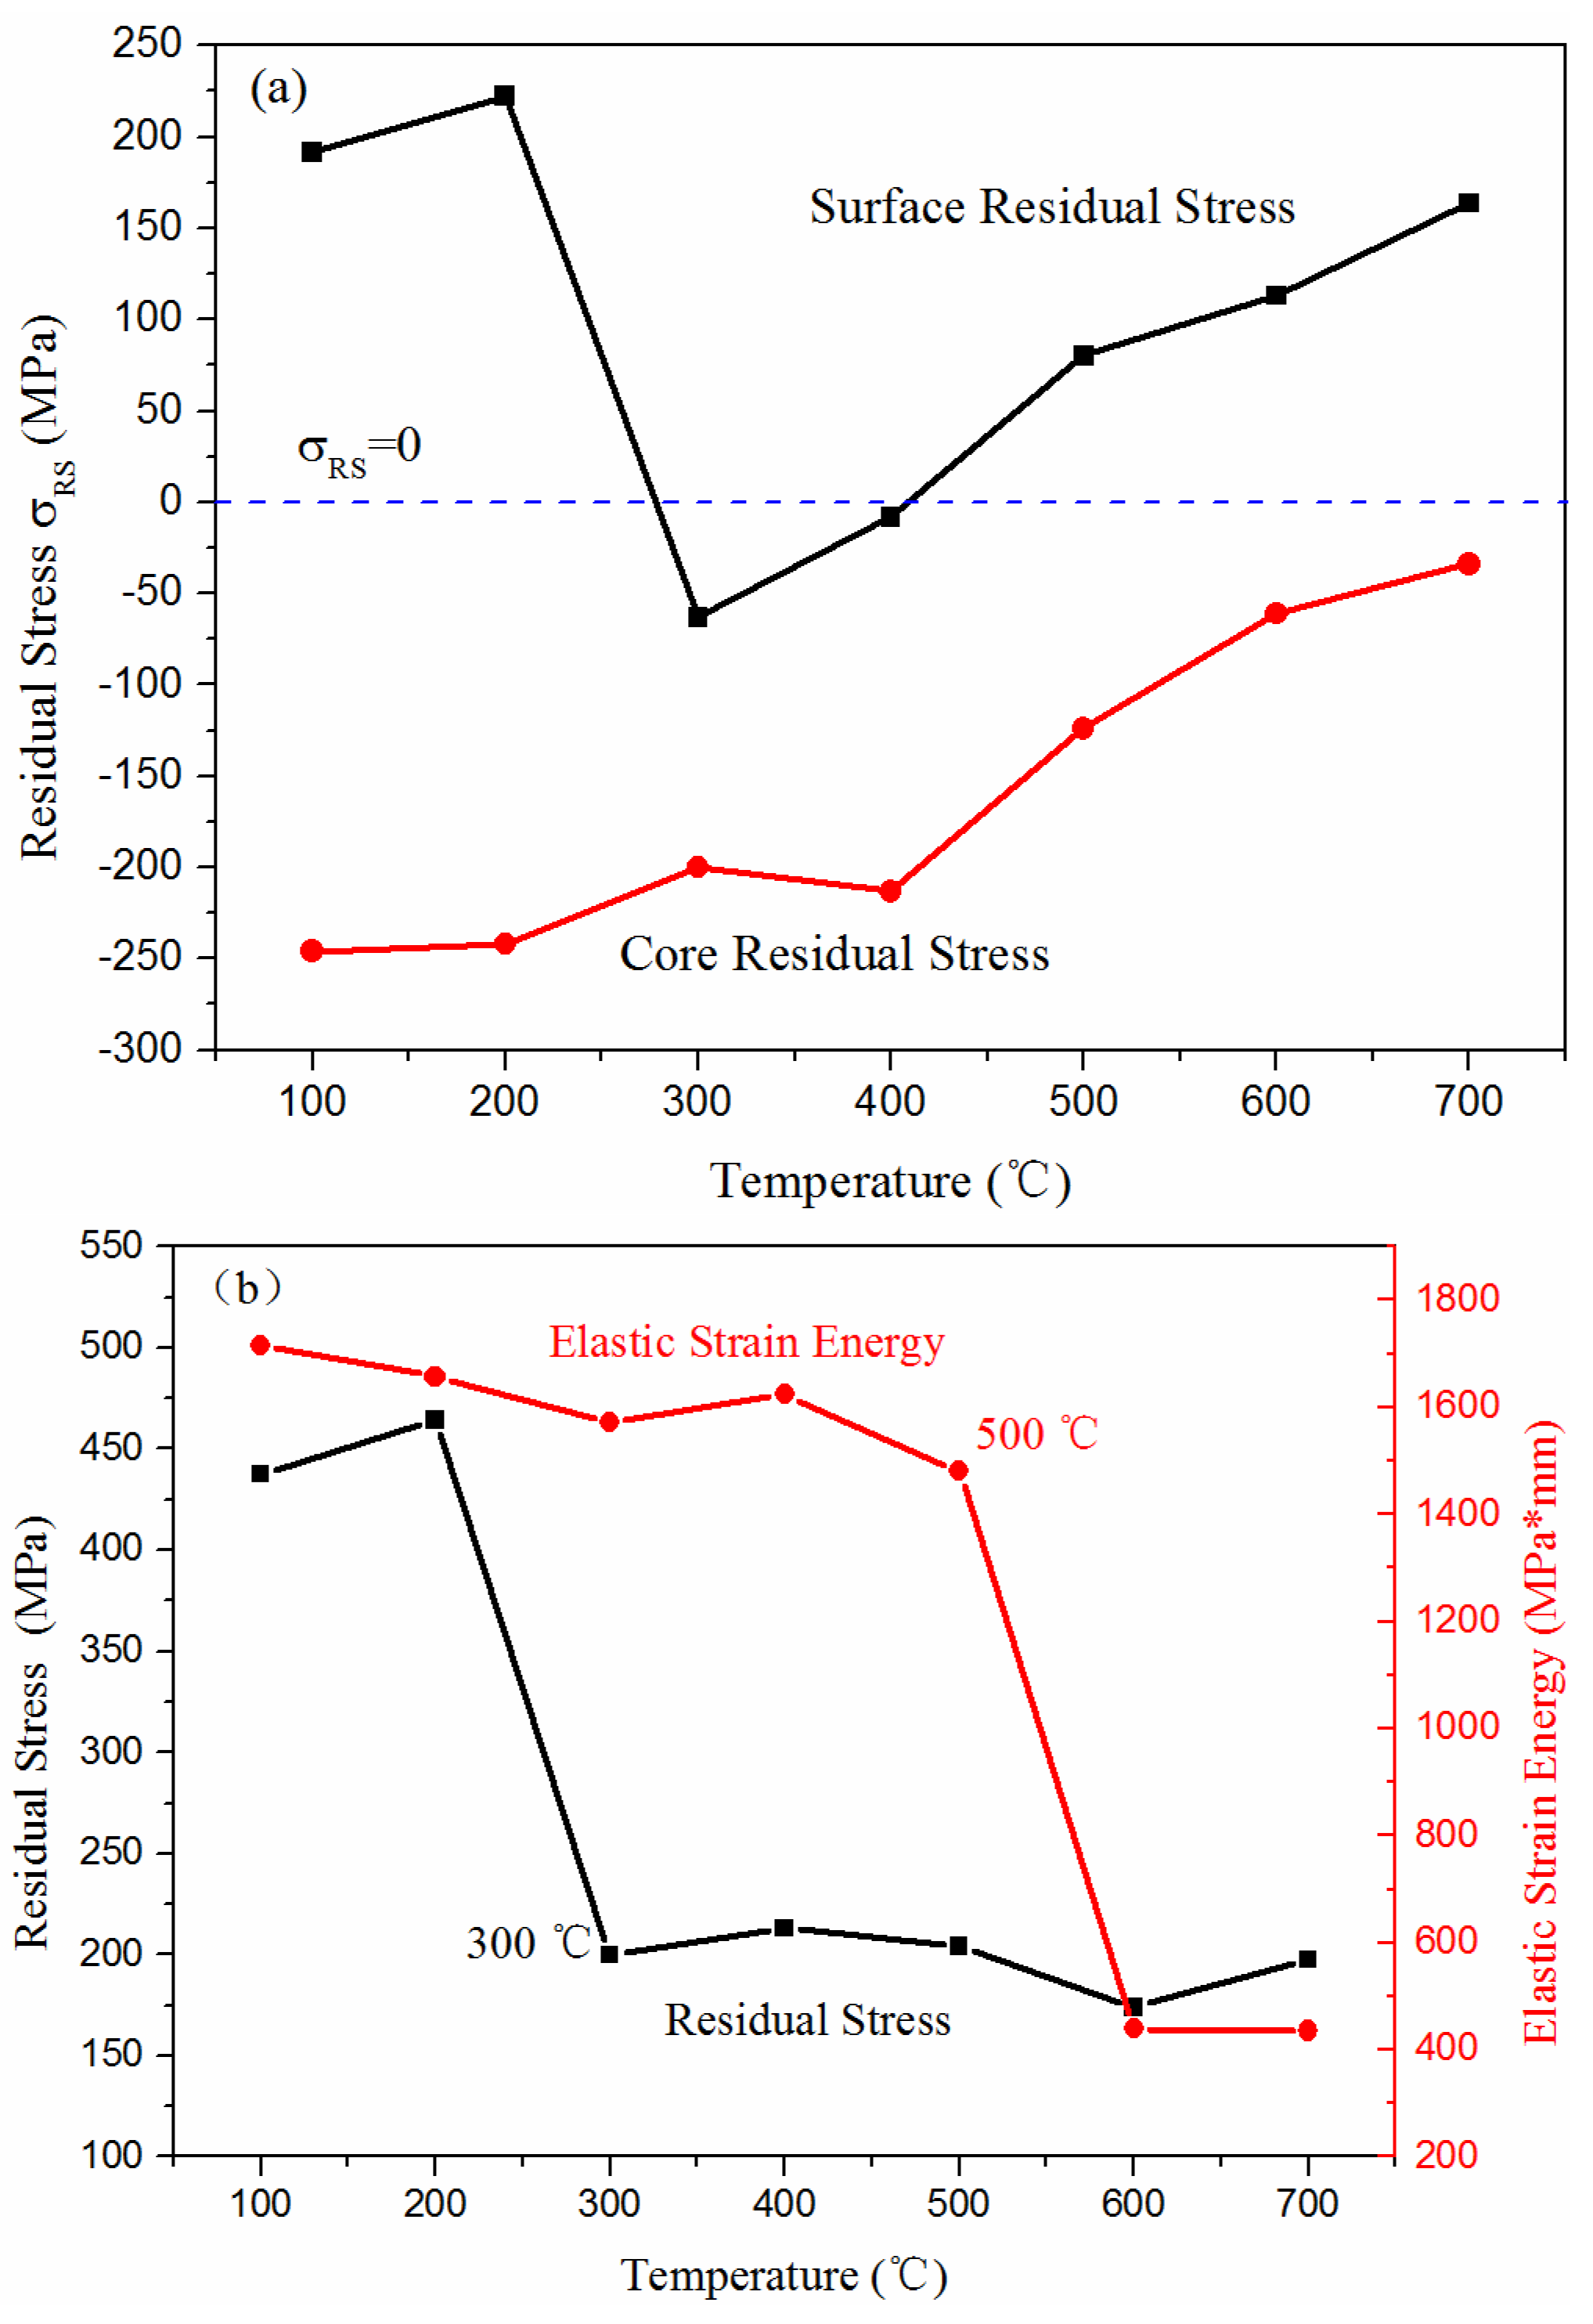
Figure 8a shows the variations of residual stress on the surface and in the core of the material after tempering for 30 min at different temperatures. Figure 8b shows changes in the absolute value and elastic strain energy of residual stress after tempering for 30 min at different temperatures.
Figure 8b shows that the residual stress of 700 L in the tempering process had two distinct adjustment stages. The first stage (200–350 °C) overlapped with the cementite precipitation stage. During this stage, the absolute value of the residual stress was reduced from 460 MPa to 200 MPa, while the elastic deformation energy remained substantially unchanged. As can be seen from the TEM image (Figure 6c), during this stage the straight dislocations evoked by the austenite-to-ferrite transformation in continuous cooling process were gradually annihilated. Villa [28] also reported that the micro-stress of EN 1.4418 martensitic stainless steel was partially relaxed during tempering at 475 °C. All the above evidence indicated that the residual micro-stress generated by the volume elastic mismatch in the quenching process was gradually reduced during this stage, and the uniformity of the residual stress distribution was improved.
The second stage (450–650 °C) overlapped with the stages including alloy carbide precipitation and Mn partitioning. During this stage, the absolute value of the residual stress did not change much (from 200 MPa to 174 MPa), whereas the elastic strain energy was reduced from 1572 to 439 MPa∙mm. In addition, during the period in which temperatures were below 200 °C, which overlapped with carbon segregation and clustering, there was no significant change in the absolute value of the residual stress or the elastic stain energy. These results also illustrated the classic theory that the improvement of lattice defects does not affect the macro residual stress [29].

4. Discussion

4.1. Transformation Plasticity during Tempering

Transformation plasticity is the irreversible plastic deformation [30] caused by the phase transformation process when the material is subjected to an applied load below the yield stress of the weaker phase. For diffusion transformation, Greenwood-Johnson [10] considered transformation plasticity to be caused by the volume differences between the parent and product phases. During the phase transformation, the microscopic stress generated by an isotropic specific volume change due to the compactness difference between the parent and product phases will produce a slight plastic strain in the parent phase with relatively weak strength. Under an applied external stress, the above micro-strain will accumulate on the applied stress direction, which generates transformation plasticity. Taleb [30] characterized this as:
ε tp = K ( V V ; σ 1 Y ) · f 2 ( ξ ) · f 3 ( σ )
where ε tp is the transformation plastic strain, V V is the relative volume difference between the parent and product phase, σ 1 Y is the weaker phase yield strength in MPa, ξ is the volume fraction of the product phase, and σ is the equivalent applied stress in MPa.
According to Equation (3), the volume difference (∆V) between the parent phase and the product phase, as well as the stress that accumulated strain in a certain direction, were two necessary conditions for the generation of transformation plasticity ( ε tp ). Since the volume of cementite and ferrite are 12.933 A ˙ 3 and 11.780 A ˙ 3 [13], respectively, when cementite or alloy carbides precipitate from the matrix during tempering, a volume difference occurs. Furthermore, the initial residual stress in the material makes it possible for the transformation plasticity strain to accumulate in the stress direction. Therefore, according to the Greenwood-Johnson mechanism [10], the precipitation of carbides during tempering should also produce transformation plasticity. This is consistent with studies by Morra [12] and Kaiser [13].
To distinguish from transformation plasticity in the traditional sense, we refer to the transformation plasticity generated by the precipitation of carbides during tempering as the precipitation plasticity ( ε p tp ). In addition, previous studies [3] have shown that the direction of the phase transformation plasticity is consistent with the direction of the applied stress. As a consequence, a tensile stress leads to a positive transformation plastic strain, while a compression stress leads to a negative transformation plastic strain. Similar conclusions have been obtained from experiments by other researchers [31]. Therefore, precipitation plasticity due to the precipitation of carbides during the tempering plays an important influence on the regulation of the initial residual stress.

4.2. Effect of Carbides Precipitation on Residual Stress

During these two tempering stages, in which the initial residual stress is improved, precipitation plasticity plays a different role. In the first stage (200–350 °C), the effect of precipitation plasticity on the residual stress was pronounced. Figure 8a shows that the initial residual stress in 700 L was reduced by 58.93% in the first stage. The yield strength and the elastic modulus of 700 L at 300 °C was 549 MPa and 180,500 MPa, respectively (Figure 9) [3]. Preliminary testing [3] showed that the coefficient of thermal expansion was 0.866×10⁻⁵ °C−1. Even if the temperature difference between the surface of the strip and the core was up to 300 °C, the temperature stress in the strip was only 467.64 MPa, which was lower than the yield strength of the material at this temperature. Therefore, at this stage, the initial residual stress cannot be improved by decreases in the elastic modulus or the yield strength [7]. Moreover, the tempering temperature at this time was lower than 0.3 Tm. Therefore, the creep is not enough to bring about a significant improvement in residual stress during this stage. Interestingly, it can be seen from Figure 8a, the trends of residual stress on the material’s surface and in the core were opposite during tempering at temperatures below 300 °C, showing clear directionality. It can be inferred from these observations that the precipitation plasticity dominates the evolution of residual stress at this stage.
The evolution of residual stress at this stage can be reasonably explained from the perspective of precipitation plasticity. The temperature stress could be neglected because the tempering heating rate was 2 °C/min. Based on the initial residual stress distribution in the material (Figure 7), the precipitation of cementite on the upper surface was subjected to the residual tensile stress. According to Equation (3), the precipitation plasticity ( ε p tp ) coincided with the direction of the tensile stress causing elongation of the material surface and a decrease in the surface tensile stress after cooling. The initial residual stress was reduced to −63 MPa at 300 °C.
The tensile stress of the upper surface was switched to compressive stress, resulting in a negative precipitation plasticity ( ε p tp ) when the precipitation plastic strain ( ε p tp ) of the upper surface reached a certain critical value. The surface of the material shrank, and the residual tensile stress was formed after cooling. Moreover, the tensile stress on the material’s surface continued to increase as the tempering temperature increased. It is easy to explain the residual stress change in the core. Unlike the surface, the core temperature of the material was lower than the surface during the heating process, and the reaction lagged behind that on the surface. Therefore, the core consistently underwent a precipitation reaction under compressive stress, and a negative precipitation plasticity ( ε p tp ) was generated to compress the core of the material. For this reason, the residual compressive stress in the core continued to decrease after cooling. The material surface and the core exhibited different evolution trends of residual stress, which also demonstrated that precipitation plasticity was the main reason for the reduction in residual stress during the first stage.

4.3. Regulation of Residual Stress by High-Temperature Creep

In the second stage (450–650 °C) of the improvement of initial residual stress, the effect of precipitation plasticity is not significant. Figure 3b and Figure 5 show that the peak temperature of alloy carbide precipitation was 500 °C. The elastic strain energy of residual stress at 500 °C was only 8.7% lower than that at 400 °C (Figure 8b). These data indicate that carbide precipitation alone was not able to generate sufficient strain to make the residual stress fully adjusted.
From the perspective of creep, the Mukherjee-Bird-Dorn Equation states the following [32]:
ε ˙ = A σ n exp ( Q R T )
where ε ˙ is the steady-state creep rate, A is the material constant, σ is initial residual stress or applied stress in MPa, n is a stress index, Q is the activation energy for creep in KJ/mol, R is the gas constant (R = 8.314 J/(mol∙K)), and T is the thermodynamic temperature in K.
When the initial residual stress was constant, the activation energy for creep could be approximated as:
Q R [ L n ε ˙ ( 1 T ) ]
Here, the speed of movement of the atoms and vacancies increased as the tempering temperature increased, and the steady-state creep rate ( ε ˙ ) increased. Compared to low temperature tempering, 700 L has a larger creep driving force at high temperatures. This analysis showed that the change in activation energy for creep was the main driving force for the adjustment of residual stress in the second stage. In addition, since the temperature of Mn partitioning is 600 °C, the influence of Mn partitioning on residual stress requires further study.

5. Conclusions

This paper reports on the transformation of microstructure and evolution of residual stress in low-carbon micro-alloyed steel (700 L) during the tempering process. Based on our analyses, the following conclusions were obtained:
(1)
The tempering process of low-carbon 700 L included the following six stages—carbon segregation and cementite I precipitation, retained austenite decomposition, cementite II precipitation, cementite dissolution, alloy carbide precipitation, and Mn partitioning. In addition, three hardness peaks appeared in the cementite II precipitation, alloy carbide precipitation, and Mn partitioning stages.
(2)
700 L has two distinct residual stress adjustment stages during tempering, which are related to the transformation of the microstructure. The first stage overlapped with cementite II precipitation, and the absolute value of residual stress was reduced from 487 MPa to 200 MPa; however, the elastic deformation energy remained unchanged. The second stage was for temperatures of 450–650 °C, and the absolute value of residual stress was reduced to 174 MPa. During this stage, the elastic deformation energy was reduced by 72.72%.
(3)
Precipitation plasticity was the main reason for the adjustment of residual stress during the first stage. The direction of the initial residual stress determined the direction of the precipitation plastic strain caused by the precipitation of carbides. This led to different trends in residual stress on the material’s surface and in the core during tempering. The adjustment of the residual stress at this stage reduced the micro-stress formed from the volume mismatch during the quenching process but had limited ability to adjust the macroscopic residual stress.
(4)
Although the second residual stress adjustment stage overlapped with the alloy carbide precipitation and Mn partitioning stages, the carbide precipitation only reduced the elastic strain energy by 8.7%. It is inferred that the activation energy for creep was the main driving force for the adjustment of the residual stress during the second stage. The initial residual stress provided an applied stress that generated creep, and the tempering temperature enhanced the driving force generated by the creep. Tempering at 600 °C could improve both the micro-stress and macro-stress in 700 L steel.

Author Contributions

W.D., Y.L., J.X., L.S. and T.L. conceived and designed the experiments; W.D. analyzed the data and wrote the paper; F.Y. and J.P. performed the experiments.

Acknowledgments

The authors gratefully acknowledge the financial support from the Major Projects of Technological Innovation of Hubei Province (No. 2018AAA005) and HBIS Group Technology Research Institute.

Conflicts of Interest

The authors declare no conflict of interest.

References

  1. Gong, P.; Palmiere, E.J.; Rainforth, W.M. Thermomechanical processing route to achieve ultrafine grains in low carbon micro-alloyed steels. Acta Mater. 2016, 119, 43–54. [Google Scholar] [CrossRef]
  2. Ariza, E.A.; Martorano, M.A.; De Lima, N.B.; Tschiptschin, A.P. Numerical Simulation with Thorough Experimental Validation to Predict the Build-up of Residual Stresses during Quenching of Carbon and Low-Alloy Steels. ISIJ Int. 2014, 54, 1396–1405. [Google Scholar] [CrossRef] [Green Version]
  3. Ding, W.; Liu, Y.; Xie, J.; Sun, L.; Liu, T. Influence of Stress on Kinetics and Transformation Plasticity of Ferrite Transformation Based on Hysteresis Effects. Metals 2019, 9, 73. [Google Scholar] [Green Version]
  4. Preciado, M.; Pellizzari, M. Influence of deep cryogenic treatment on the thermal decomposition of Fe-C martensite. J. Mater. Sci. 2014, 49, 8183–8191. [Google Scholar] [CrossRef]
  5. Lerchbacher, C.; Zinner, S.; Leitner, H. Direct or indirect: Influence of type of retained austenite decomposition during tempering on the toughness of a hot-work tool steel. Mater. Sci. Eng. A 2013, 564, 163–168. [Google Scholar] [CrossRef]
  6. Vieira, I.; Klemm-Toole, J.; Buchner, E.; Williamson, D.L.; Findley, K.O.; De Moor, E. A Dilatometric Study of Tempering Complemented by Mössbauer Spectroscopy and other Characterization Techniques. Sci. Rep. 2017, 7. [Google Scholar] [CrossRef] [PubMed]
  7. Ritter, J.C.; Mcpherson, R. Anisothermal Stress Relaxation in a Carbon-maganese Steel. J. Iron Steel Inst. 1970, 10, 935–941. [Google Scholar]
  8. Chilukuru, H.; Durst, K.; Wadekar, S.; Schwienheer, M.; Scholz, A.; Berger, C.; Mayer, K.H.; Blum, W. Coarsening of precipitates and degradation of creep resistance in tempered martensite steels. Mater. Sci. Eng. A 2009, 510–511, 81–87. [Google Scholar] [CrossRef]
  9. Humphries, S.R.; Yeung, W.Y.; Callaghan, M.D. The effect of stress relaxation loading cycles on the creep behavior of 2.25Cr–1Mo pressure vessel steel. Mater. Sci. Eng. A 2011, 528, 1216–1220. [Google Scholar] [CrossRef]
  10. Greenwood, G.W.; Johnson, R.H. The Deformation of Metals under Small Stresses during Phase Transformations. Proc. R. Soc. Lond. Ser. A 1965, 283, 403–422. [Google Scholar]
  11. Denis, S.; Gautier, E.; Simon, A.; Beck, G. Stress-Phase-Transformation Interactions-Basic Principles, Modeling, and Calculation of Internal Stresses. Mater. Sci. Technol. 1985, 1, 805–814. [Google Scholar] [CrossRef]
  12. Morra, P.V.; Radelaar, S.; Yandouzi, M.; Chen, J.; Bottger, A.J. Precipitate coarsening-induced plasticity: Low temperature creep behaviour of tempered SAE 52100. Int. J. Plast. 2009, 25, 2331–2348. [Google Scholar] [CrossRef]
  13. Kaiser, D.; de Graaff, B.; Jung, A.M.; Dietrich, S.; Schulze, V. A dilatometric study on the influence of compressive stresses on the tempering of martensitic AISI 4140 steel-Evidence of transformation induced plasticity during cementite precipitation. Mater. Sci. Eng. A 2017, 705, 114–121. [Google Scholar] [CrossRef]
  14. Bensely, A.; Venkatesh, S.; Mohan, L.D.; Nagarajan, G.; Rajadurai, A.; Junik, K. Effect of cryogenic treatment on distribution of residual stress in case carburized En 353 steel. Mater. Sci. Eng. A 2008, 479, 229–235. [Google Scholar] [CrossRef]
  15. Chen, J.F.; Jiang, J.T.; Zhen, L.; Shao, W.Z. Stress relaxation behavior of an Al–Zn–Mg–Cu alloy in simulated age-forming process. J. Mater. Process. Technol. 2014, 214, 775–783. [Google Scholar] [CrossRef]
  16. Prime, M.B. Residual stress measurement by successive extension of a slot: The crack compliance method. Appl. Mech. Rev. 1999, 2, 75–96. [Google Scholar] [CrossRef]
  17. Prime, M.B. Uncertainty Analysis, Model Error, and Order Selection for Series-Expanded, Rwsidual Stress Inverse Solutions. J. Eng. Mater. Technol. 2006, 128, 175–185. [Google Scholar] [CrossRef]
  18. Mittemeijer, E.J. Analysis of the kinetics of phase transformations. J. Mater. Sci. 1992, 27, 3977–3987. [Google Scholar] [CrossRef]
  19. Waterschoot, T.; Verbeken, K.; De Cooman, B.C. Tempering Kinetics of the Martensitic Phase in DP Steel. ISIJ Int. 2006, 46, 138–146. [Google Scholar] [CrossRef] [Green Version]
  20. Leiva, J.A.V.; Morales, E.V.; Villar-Cociña, E.; Donis, C.A.; Bott, I.S. Kinetic parameters during the tempering of low-alloy steel through the non-isothermal dilatometry. J. Mater. Sci. 2010, 45, 418–428. [Google Scholar] [CrossRef]
  21. Talebi, S.H.; Ghasemi-Nanesa, H.; Jahazi, M.; Melkonyan, H. In Situ Study of Phase Transformations during Non-Isothermal Tempering of Bainitic and Martensitic Microstructures. Metals 2017, 7, 346. [Google Scholar] [CrossRef]
  22. Morra, P.V.; Böttger, A.J.; Mittemeijer, E.J. Decomposition of Iron-based Martensite. A kinetic analysis by means of differential scanning calorimetry and dilatometry. J. Therm. Anal. Calorim. 2001, 64, 905–914. [Google Scholar] [CrossRef]
  23. Ustinovshchikov, Y.I. Secondary hardening mechanism of alloy steels. Met. Sci. 1984, 18, 337–344. [Google Scholar] [CrossRef]
  24. Yamasaki, S.; Bhadeshia, H.K. Modelling and characterisation of Mo2C precipitation and cementite dissolution during tempering of Fe–C–Mo martensitic steel. Mater. Sci. Technol. 2013, 19, 723–731. [Google Scholar] [CrossRef]
  25. Clarke, A.J.; Miller, M.K.; Field, R.D.; Coughlin, D.R.; Gibbs, P.J.; Clarke, K.D.; Alexander, D.J.; Powers, K.A.; Papin, P.A.; Krauss, G. Atomic and nanoscale chemical and structural changes in quenched and tempered 4340 steel. Acta Mater. 2014, 77, 17–27. [Google Scholar] [CrossRef]
  26. Ande, A.K.; Sluiter, M.H. First-Principles Calculations on Stabilization of Iron Carbides (Fe3C, Fe5C2, and η-Fe2C) in Steels by Common Alloying Elements. Metall. Mater. Trans. A 2012, 43, 4436–4444. [Google Scholar] [CrossRef]
  27. Yang, S.; Shang, C.; He, X.; Wang, X.; Yuan, Y. Stability of Ultra-fine Microstructures during Tempering. J. Univ. Sci. Technol. Beijing 2001, 8, 119–122. [Google Scholar]
  28. Villa, M.; Niessen, F.; Somers, M.A. In Situ Investigation of the Evolution of Lattice Strain and Stresses in Austenite and Martensite During Quenching and Tempering of Steel. Metall. Mater. Trans. A 2018, 49, 28–40. [Google Scholar] [CrossRef]
  29. Schajer, G.S. Practical Residual Stress Measurement Methods; John Wiley & Sons, Ltd.: Vancouver, BC, Canada, 2013; pp. 89–106. [Google Scholar]
  30. Taleb, L.; Cavallo, N.; Waeckel, F. Experimental analysis of transformation plasticity. Int. J. Plast. 2001, 17, 1–20. [Google Scholar] [CrossRef]
  31. Taleb, L.; Petit, S. New investigations on transformation induced plasticity and its interaction with classical plasticity. Int. J. Plast. 2006, 22, 110–130. [Google Scholar] [CrossRef]
  32. Mukherjee, A.K.; Bird, J.E.; Dorn, J.E. Experimental Correlations for High-Temperature Creep. Trans. ASM 1969, 62, 155–179. [Google Scholar]
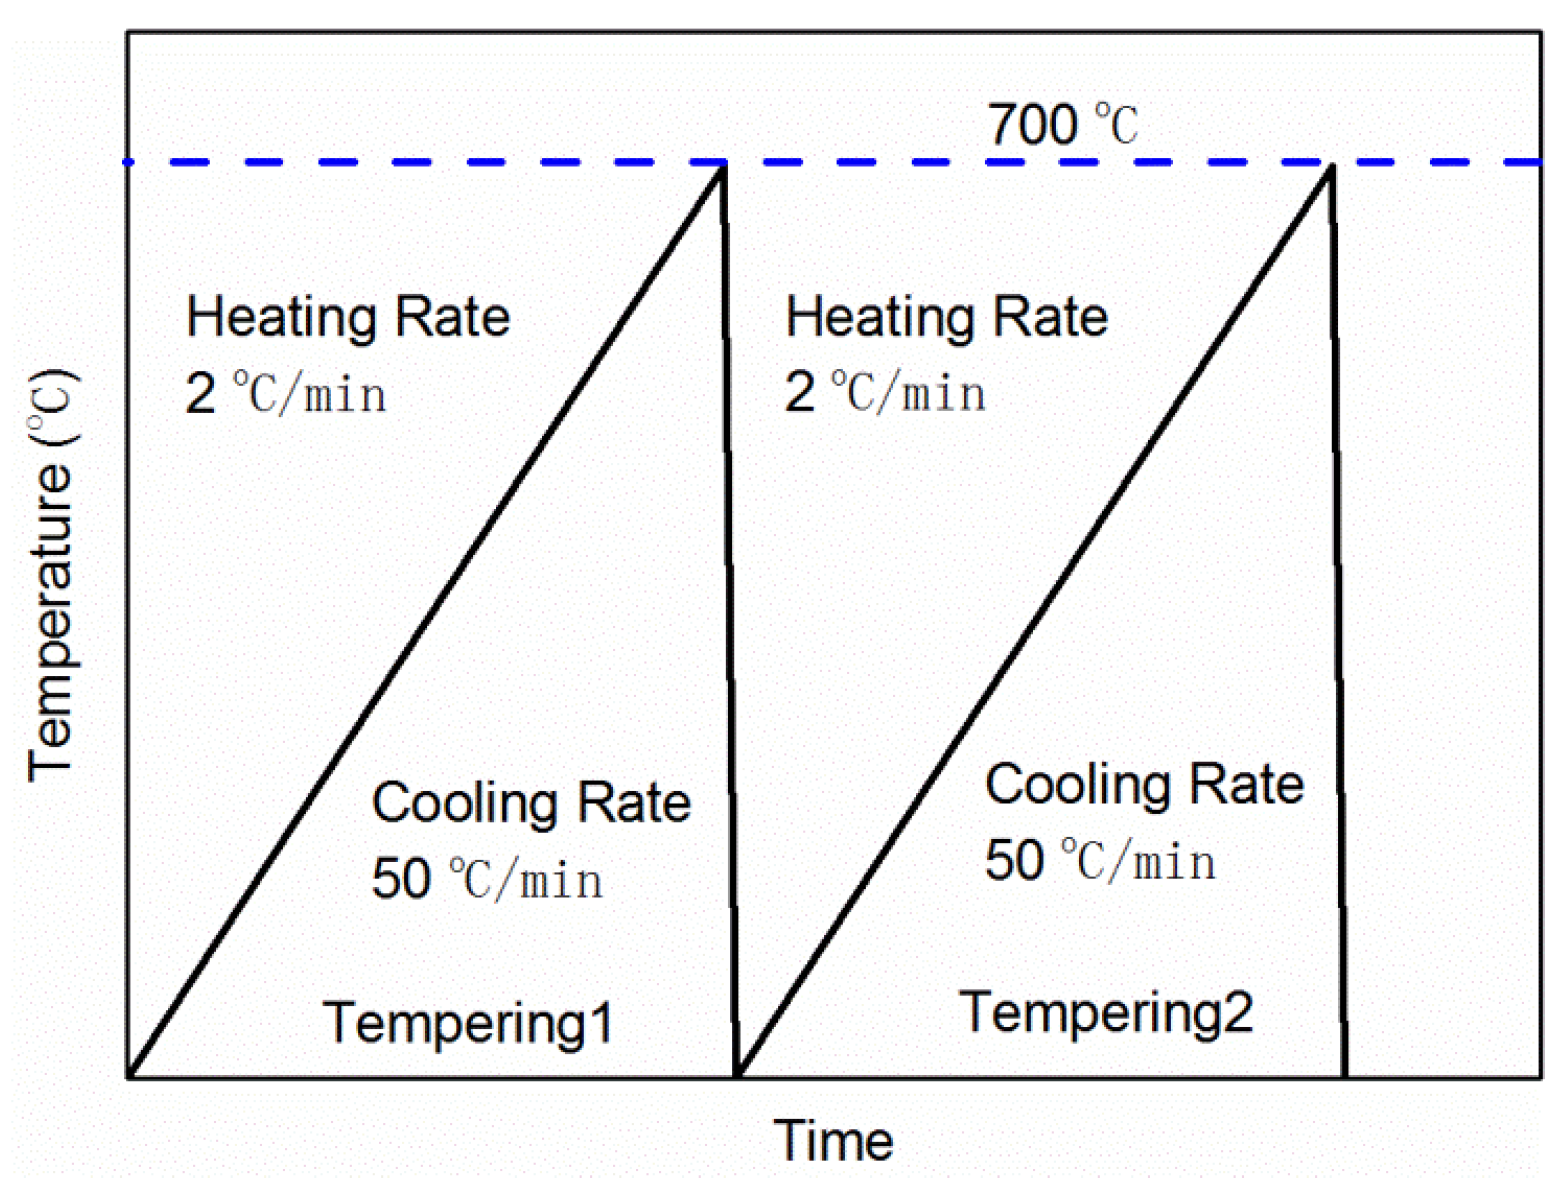
Figure 1. Schematic thermal profile of non-isothermal tempering test.
Metals 09 00709 g001
Figure 2. Measurement of strains by crack compliance method.
Metals 09 00709 g002
Figure 3. Changes in length during non-isothermal tempering of 700L. (a) The changes in specimen length during the two tempering processes and the corresponding differences; (b) The first derivative of the difference between the changes in the length for the first and second tempering steps.
Metals 09 00709 g003aMetals 09 00709 g003b
Figure 4. TEM images during tempering at different temperatures. (a) TEM image before tempering; (b)TEM image at 200 °C—precipitation of cementite I; (c) TEM image at 300 °C—decomposition of retained austenite; (d) TEM image at 300 °C—precipitation of cementite II; (e) TEM image at 550 °C—alloy carbide precipitation; (f) TEM image at 650 °C—Mn partitioning.
Metals 09 00709 g004
Figure 5. Hardness change of 700 L after tempering at different temperatures for 30 min.
Metals 09 00709 g005
Figure 6. TEM images in the tempering process. (a) TEM image before tempering; (b) TEM image after tempering at 200 °C for 30 min; (c) TEM images after tempering at 300 °C for 30 min. (d) TEM images after tempering at 600 °C for 30 min.
Metals 09 00709 g006
Figure 7. Comparisons of residual stress distribution before tempering of 700 L with that after tempering at 200 °C, 300 °C, and 600 °C for 30 min. (a) Tempering at 200 °C for 30 min; (b) Tempering at 300 °C for 30 min; (c) Tempering at 600 °C for 30 min.
Metals 09 00709 g007
Figure 8. Evolution of residual stress during tempering. (a) Evolution of residual stress on the surface and in the core; (b) Evolution of residual stress and elastic strain energy along the thickness direction.
Metals 09 00709 g008
Figure 9. The true stress-strain, elastic modulus, and yield strength curves of 700 L at different temperatures. (a) The true stress-strain curves; (b) The elastic modulus and yield strength curves.
Metals 09 00709 g009
Table 1. Chemical composition of 700 L steel (wt %).
CSiMnPSNbAlTiFe
0.0790.0721.4600.0110.0020.0510.0390.095Bal.
Table 2. Residual stress in 700L at different tempering temperatures.
Residual StressBefore TemperingAfter 200 °C TamperingAfter 300 °C TamperingAfter 600 °C Tampering
σ RSmax (MPa)2872180113
σ RSmin (MPa)−200−242−200−61
σ RSmax σ RSmin (MPa)487460200174
%100%94.45%41.07%35.73%
Table 3. Elastic strain energy of residual stress at different tempering temperatures.
Elastic Strain EnergyBefore TemperingAfter 200 °C TamperingAfter 300 °C TamperingAfter 600 °C Tampering
style="border-bottom:solid thin">Elastic strain energy (MPa∙mm) 160916571572439
%100%102.98%97.70%27.28%