Article

The Auto-Correlation of Ultrasonic Lamb Wave Phased Array Data for Damage Detection

1
School Institute for Advanced Communication and Data Science, School of Communication and Information Engineering, Shanghai University, Shanghai 200444, China
2
School of Urban Railway Transportation, Shanghai University of Engineering Science, Shanghai 201620, China
3
School of Mechatronic and Automation Engineering, Shanghai University, Shanghai 200444, China
4
School of Information Science and Technology, Shanghai Tech University, Shanghai 201210, China
*
Authors to whom correspondence should be addressed.
Metals 2019, 9(6), 666; https://doi.org/10.3390/met9060666
Submission received: 16 May 2019 / Revised: 6 June 2019 / Accepted: 6 June 2019 / Published: 8 June 2019
(This article belongs to the Special Issue Fatigue Design and Defects in Metals and Alloys)

Abstract

:
Ultrasonic phased array is widely used for damage detection recently because of its high sensitivity and rapid scanning without sensor movements. However, the measured signal is always influenced by the remnants of the initial excitation and the nonlinear signals from the instrumentation, which limits its application in thin-plate structures. To address this issue, an approach called auto-correlation subtraction is proposed to extract the scattering information of defects in this paper. In order to testify the feasibility of this method for damage detection, the experiments were carried out on three thin aluminum plates combined with the total focusing method (TFM) for imaging. By auto-correlating the full matrix data received by sensors and then subtracting the average auto-correlation of noise recorded by all receivers, the coherent scattered signal containing defect information is recovered. The experimental results indicate that the coherent travel time is in agreement with the theoretical value and the signal-to-noise ratio are improved. Additionally, compared with the cross-correlation technique, the time synchronization between different receivers is not necessary with the auto-correlation method. Results indicate that the presented method can improve the imaging resolution and has a great potential in the field of non-destructive testing.

1. Introduction

The requirements for structural safety are gradually increasing in the aviation, railway, architecture, and other industries recently. Therefore, in order to avoid unnecessary risks in practical applications, non-destructive testing plays an important role. Because of its strong detection ability, harmless to humans and a wide range of available frequency, ultrasonic non-destructive testing is widely used to detect the internal defects of materials in recent years. Traditional approaches for this technique directly depend on pitch-catch measurements of waves to realize detection. Compared to conventional single-element sensors, the phased array transducer is a good candidate for industrial non-destructive testing due to its excellent focusing performance with multiple elements. It can focus and sweep the acoustic beam electronically without sensor movements, which dramatically reduces the detection time and complexity. For instance, Leleux et al. [1] utilized the ultrasonic phased array to launch and detect Lamb waves in a composite plate. In order to realize the imaging of multi-layer structures, an ultrasonic phased array technique combined with extended phase shift migration in the frequency domain was proposed [2]. However, Peng et al. [3] pointed out that there was still much research work to do in this technique to improve the image resolution. That is because the data directly acquired by the phased array transducer are always affected by various background noises, which will reduce image quality.
Many approaches have been proposed to address this problem. Among them, the technique that utilizes the noise received by receivers has become one of the most important research topics over the last twenty years. This theory was firstly proved by Lobiks and Weaver [4] in 2001. Their results showed that the Green’s function between two microphones can be recovered through the cross-correlation of the ambient noise recorded from them. The reflected, scattered and direct signals were included in this response. Based on this fundamental work, retrieving Green’s function through cross-correlation theory has been widely studied in seismology [5], ocean acoustics [6,7], ultrasonic [8], and other fields. In 2011, the cross-correlation of the environmental seismic noise continuously recorded by 150 receivers was calculated to determine the source of the earthquake [9]. In 2015, Li et al. [10] obtained that the Green’s function response between two receivers from the cross-correlation of ocean ambient noise in free space. An experimental verification of this method in the kilohertz band has been demonstrated for the first time. In 2017, Yang et al. [11] demonstrated the passive detection feasibility of a fatigue cracking using ambient noise. Besides, Potter et al. [12] collected the diffusion field generated by the near-surface defects in the experiment. A full matrix was reconstructed through the cross-correlation of the later time of the diffuse full matrix, based on which the imaging resolution of the near-surface defects has been improved.
However, a practical problem when applying the cross-correlation method is the strict requirement for synchronization between the receivers. Once there are synchronization errors between receivers, an undesirable drift will occur on the results of cross-correlation in the time-domain, and subsequently causes artifacts in the vicinity of defects [13]. As a special case of the cross-correlation method, the auto-correlation operation does not depend on the synchronization between the receivers. Because of this advantage, some researchers gradually take more consideration on the auto-correlation method in signal detection. For instance, in speech signal processing, Farahani et al. [14] demonstrated that there was a certain correlation between noise and pure speech signals. Thus, a new method was proposed to extract speech signal features based on auto-correlation of the noisy signals. In ocean acoustics, Chi et al. [15] proved theoretically that the scatterers (that is defects) can be passively detected using the auto-correlation of surf noise recorded by the receivers over a period of time. Similarly, the auto-correlation method could also be promising for the ultrasonic non-destructive testing with phased array, but few works can be found.
The main objective of this paper is to experimentally investigate the reliability of the auto-correlation of ultrasonic Lamb wave fields for damage detection. The isotropic structures were used as experimental specimens [16]. The remainder of this paper is organized as follows. Section 2 simply deduces the feasibility of the auto-correlation function to recover the impulse response between the sensors and scatterers. In Section 3, the experimental apparatus and procedures are applied to evaluate the performance of the proposed methodology. Combining with total focusing method, Section 4 presents the comparison between the experimental data with and without the auto-correlation. In this section, we subsequently contrast the imaging results of auto-correlation and cross-correlation method when the wavefield is not fully diffuse. To this end, the conclusions are summarized.

2. Methodology for the Auto-Correlation Combining with TFM

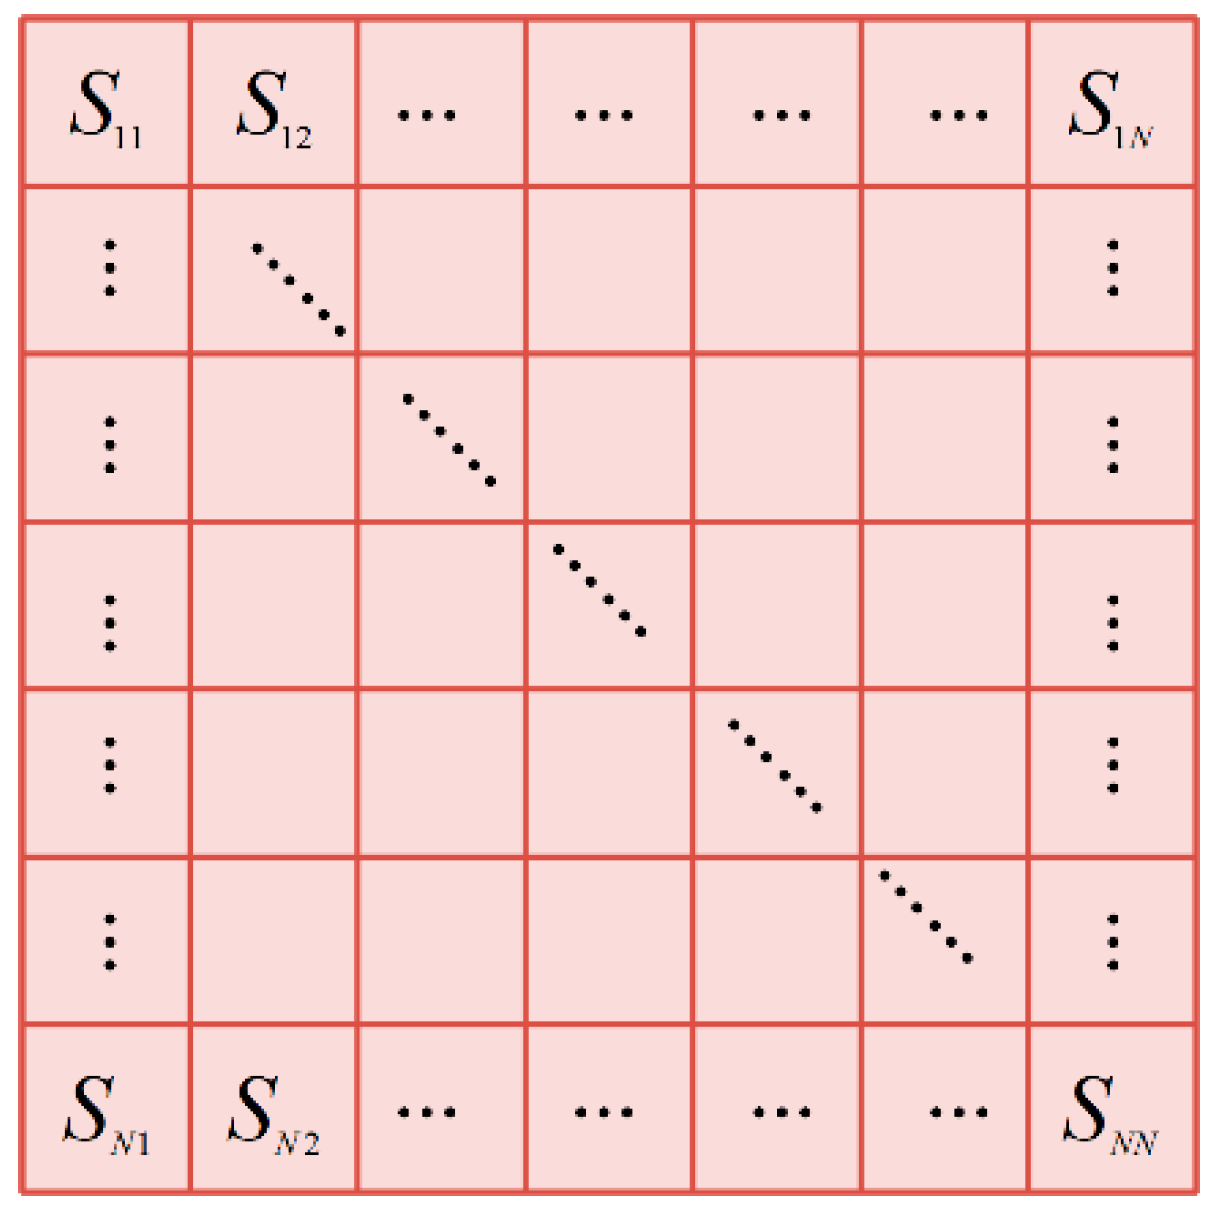
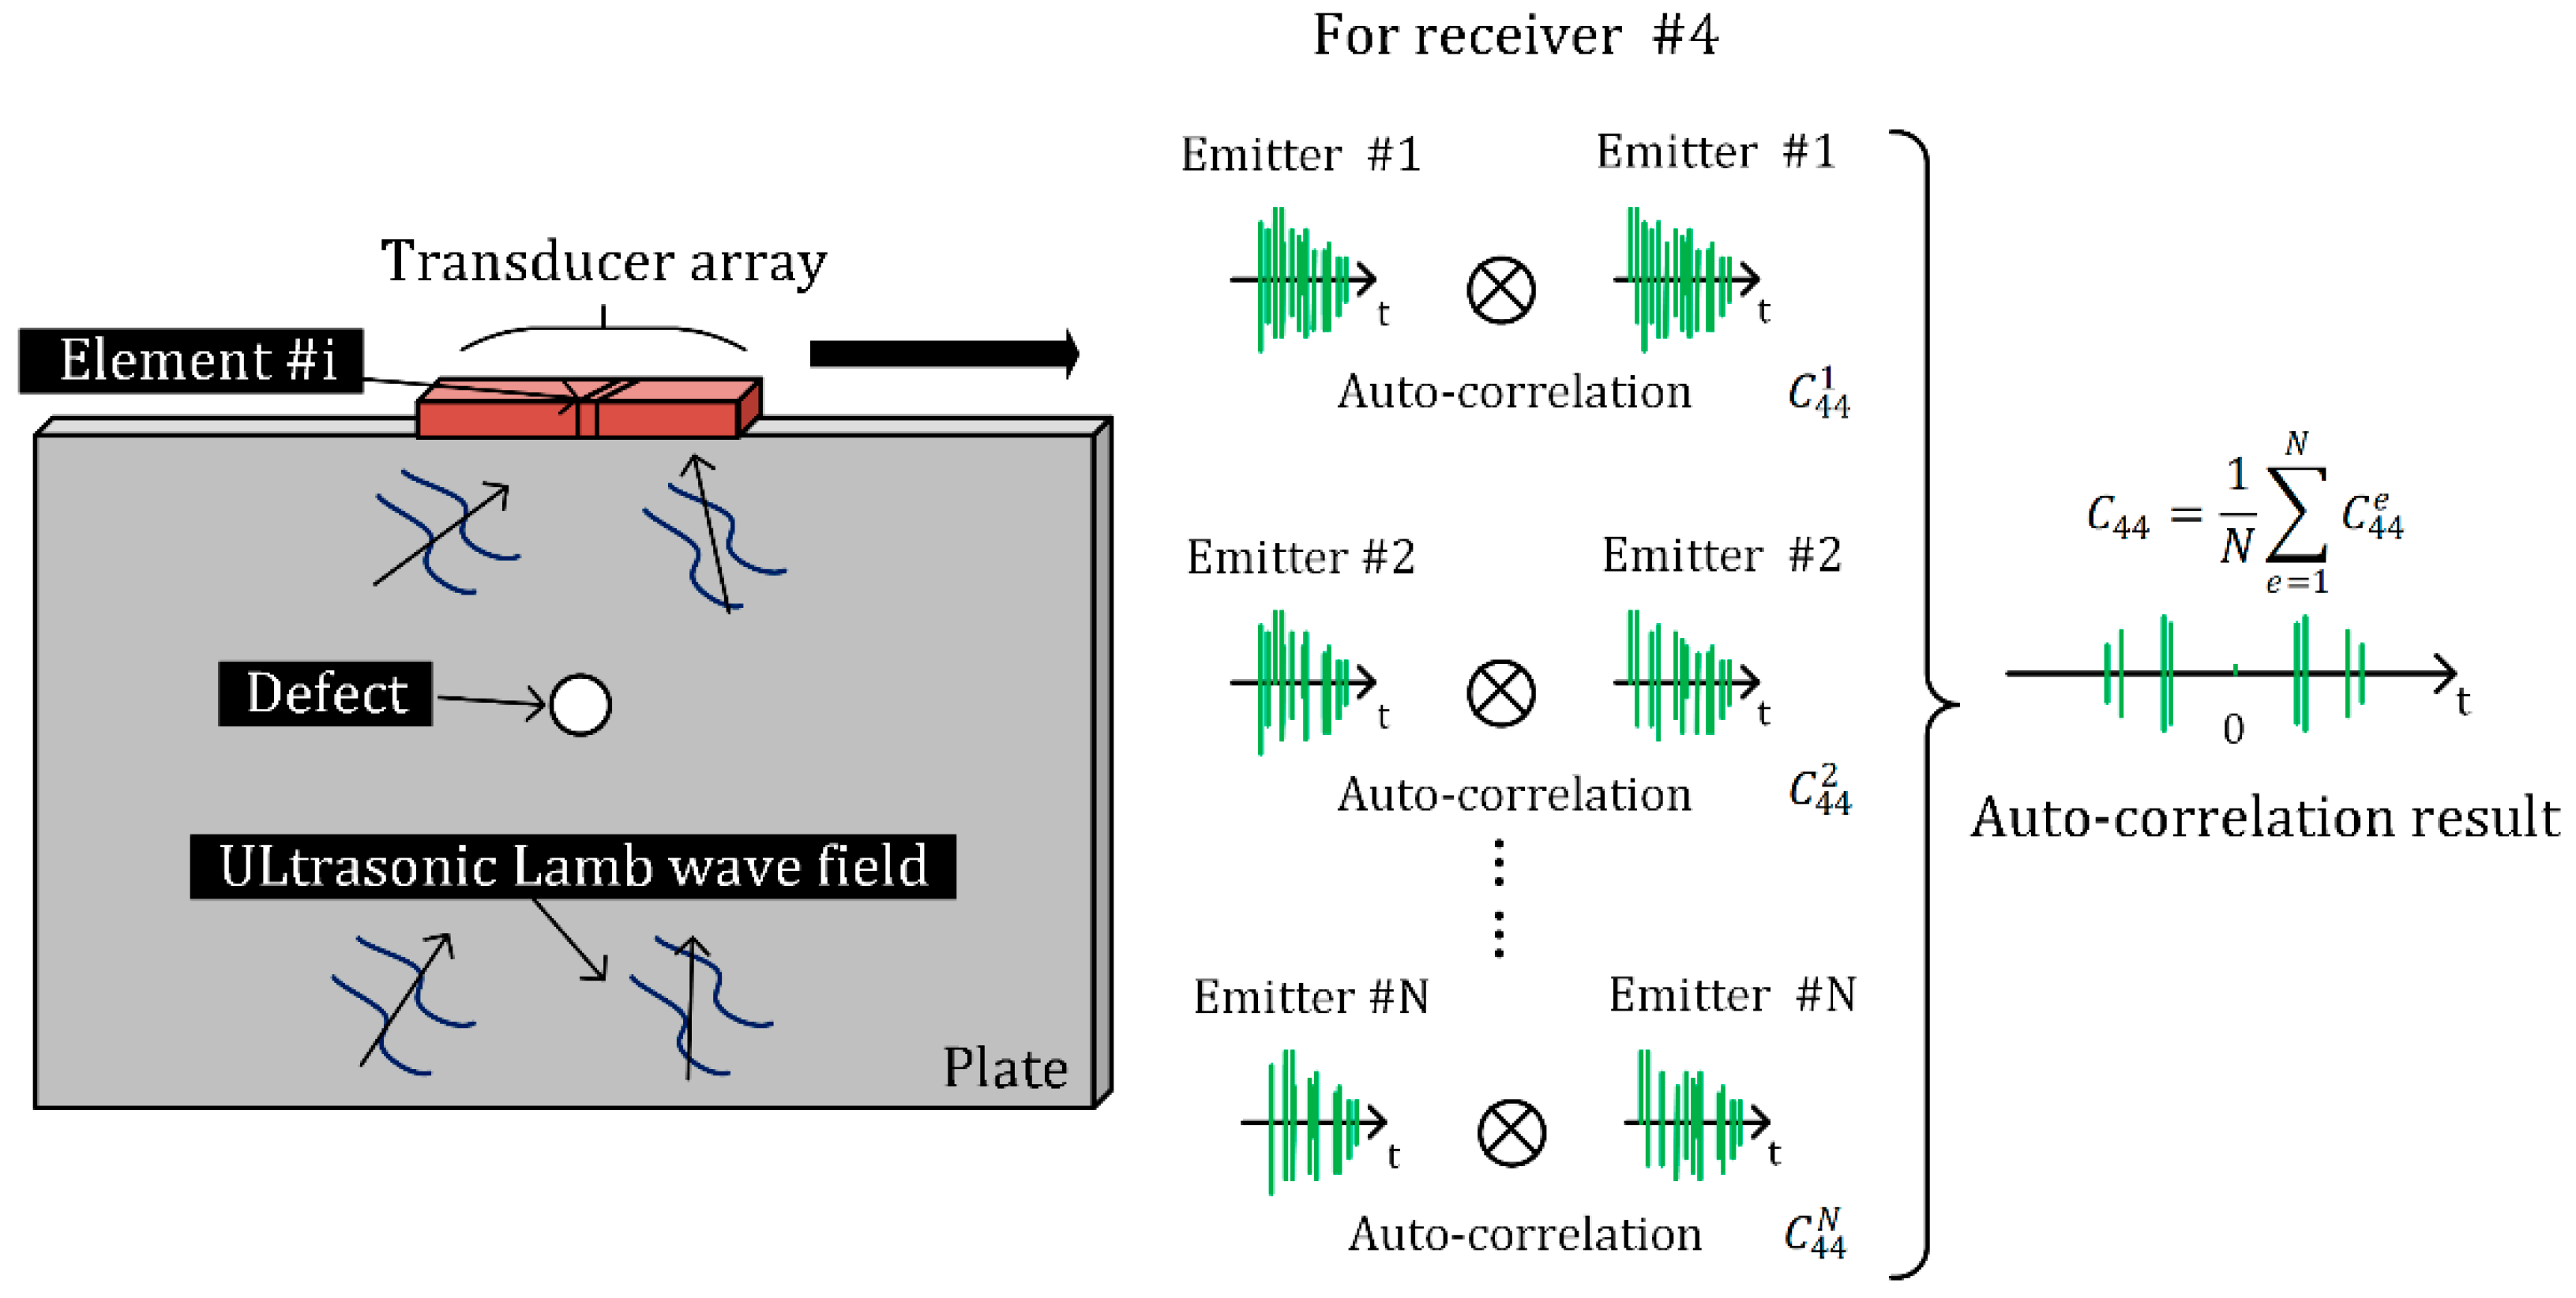
2.1. Auto-Correlation Method Based on Full Matrix Capture (FMC)

The concept of FMC and full matrix data model was first introduced by Holmes et al. [17] in 2005. When one of N elements in ultrasonic phased array is used to excite ultrasonic signals, all the elements receive the scattered signals simultaneously. The elements are fired in turn and all elements act as receivers again. This procedure is referred to FMC as illustrated graphically in Figure 1. The N × N full matrix data is then obtained as shown in Figure 2, in which S e , r ( t ) represents the signal received by sensor “r” when the sensor “e” as a transmitter. In addition to the scattered signals from the defects, these received signals contain the background noise. The noise always consists of the direct signals from transmitters to receivers, the remnants of the initial excitation and the nonlinear signals inside the phased array transducer, etc. The imaging will be blurred by the noise if the directly captured full matrix are used, which leads to inaccurate defect information.
As stated in previous studies, both cross-correlation and auto-correlation method can reconstruct impulse response and reduce the influence of noise. The cross-correlation is the processing of signals acquired by two different receivers, which obtains the auto-correlation result when these two receivers are the same. As a consequence, the auto-correlation C r r e ( t ) corresponding to an excitation signal and a receiver can be expressed as the following equation:
C r r e ( t ) = S e , r ( t ) S e , r ( t ) ,
where e = 1 , 2 , , N and r = 1 , 2 , , N , N is the number of elements in the phased array probe (the same below), t is the recorded time, and the symbol denotes a convolution operation.
After auto-correlating the data in full matrix for a given receiver, the auto-correlation of this receiver is obtained by averaging over the auto-correlation from all transmitting elements. Therefore, the auto-correlation result, which corresponds to multiple excitation signals and one receiver, is expressed by Equation (2) and the configuration of this process is depicted in Figure 3.
C r r ( t ) = 1 N e = 1 N C r r e ( t )
Inspired by the autocorrelation-based noise subtraction theory in speech signal, the auto-correlation of the background noise is subtracted from the auto-correlation of received signals. However, it is difficult to obtain the background noise in practical applications, so the average auto-correlation of the signals received by each receiver is taken as the background noise. Finally, the auto-correlation of signals received by each receiver is determined in Equation (3), which will be called the “auto-correlation subtraction” throughout this paper.
C r r ( t ) = C r r ( t ) 1 N 1 k = 1 , k r N C k k ( t )

2.2. TFM Combined with a Weighting Phase Factor

TFM is a post-processing technique in the time domain based on FMC, which originated from Synthetic Aperture Focusing Technique (SAFT). In TFM, the imaging area is discretized into a grid of points which correspond to image pixels. Note that in practice the determination of the grid needs to take the computational efficiency and imaging resolution into consideration. The amplitude is extracted from each signal and the sum of all amplitudes is assigned as the pixel intensity in conventional TFM [18]. By Equation (4), the value of a pixel ( x , z ) in the interrogated region of the plate can be calculated.
I 1 ( x , z ) = ( r = 1 N C r r ( T ( x , z ) ) ) 2 + ( r = 1 N Q r r ( T ( x , z ) ) ) 2 ,
Q r r ( t ) = H i l b e r t [ C r r ( t ) ] ,
T ( x , z ) = 2 ( x x r ) 2 + ( z z r ) 2 c ,  
where the word “Hilbert” denotes the Hilbert Transform, ( x r , z r ) is the coordinate of receiver, T ( x , z ) is the total time of flight, and c stands for the group velocity of Lamb wave propagating in workpiece.
Nevertheless, the phase information is always neglected in the conventional TFM, and leads to a heterogeneous distribution of the focal points. In order to improve the image resolution, the amplitude and phase information should be combined to achieve full focal imaging of the detection region. Following the approach of literature [19], the set of complete signals can be represented as modulus ( X r r ( t ) ) and phase components ( φ r r ( t ) ), as shown in Equation (7).
Y r r ( t ) = C r r ( t ) + j Q r r ( t ) = X r r ( t ) e j φ r r ( t )
Therefore, a phase weighting factor is defined by using Equation (8) in this paper.
P ( x , z ) = r = 1 N e j φ r r ( t )
Finally, the pixel intensity of each point is given by Equation (9).
I 2 ( x , z ) = | P ( x , z ) | I 1 ( x , z )

3. Experimental Setup and Pretreatment Results

An experimental system was set up to evaluate the performance of our proposed method including an ultrasonic phased array transducer (Multi2000, M2M Inc., Les Ulis, France), three thin aluminum plates and a host computer. The experimental data were measured on three 1-mm-thick aluminum plates with machined hole defects illustrated in Figure 4. In plate A, the defects were two through-thickness holes with diameters of 5 and 3 mm, and the distance between their centers was 6 mm. In plate B, the size of defects was the same as that of plate A, but the distance between their centers was 9 mm. The diameter of each defect in plate C was 1, 3, 5, and 7 mm respectively, and they also had a spacing of 9 mm. The defects in plate A and C were 40 mm to the edge of the plate. In contrast, the distance of the defects to the edge of plate B is 10 mm. A 16-element linear array transducer with central frequency 1 MHz (Shantou Ultrasonic Electronics Co. LTD, Guangdong, China) was applied to generate and receive signals in our works, in which the excitation voltage is 70 V. A five-cycle sinusoidal signal modulated with a Gaussian window was used as an excitation signal. The total aperture of this selected probe is 31.8 mm and its height is 15 mm. All the probe parameters are listed in Table 1.
Before the experiment, in order to achieve the biggest aperture and improve the signal strength, the probe was mount on the center of the upper edge of the workpiece. In this way, the in-plane displacement can be produced [20]. The sampling frequency used in the analysis was 50 MHz. At the same time, given that the frequency-thickness product is 1 MHz·mm, only the S 0 -mode Lamb waves was excited. It is widely studied in practical applications [21,22,23]. Hence, the wave velocity is about 5300 m/s and the wavelength is 5.3 mm in our experiment.
During the experiment, the mode of the phased array transducer was set to the full matrix mode. On the basis of the theory in Section 2.1, the Multi2000 software was used to record a 16 × 16 full matrix data and saved them into a text file for the later analysis in the host computer. Then the experimental data were analyzed on the MATLAB platform (MathWorks, Natick, MA, USA). The experimental results achieved are detailed as follows.

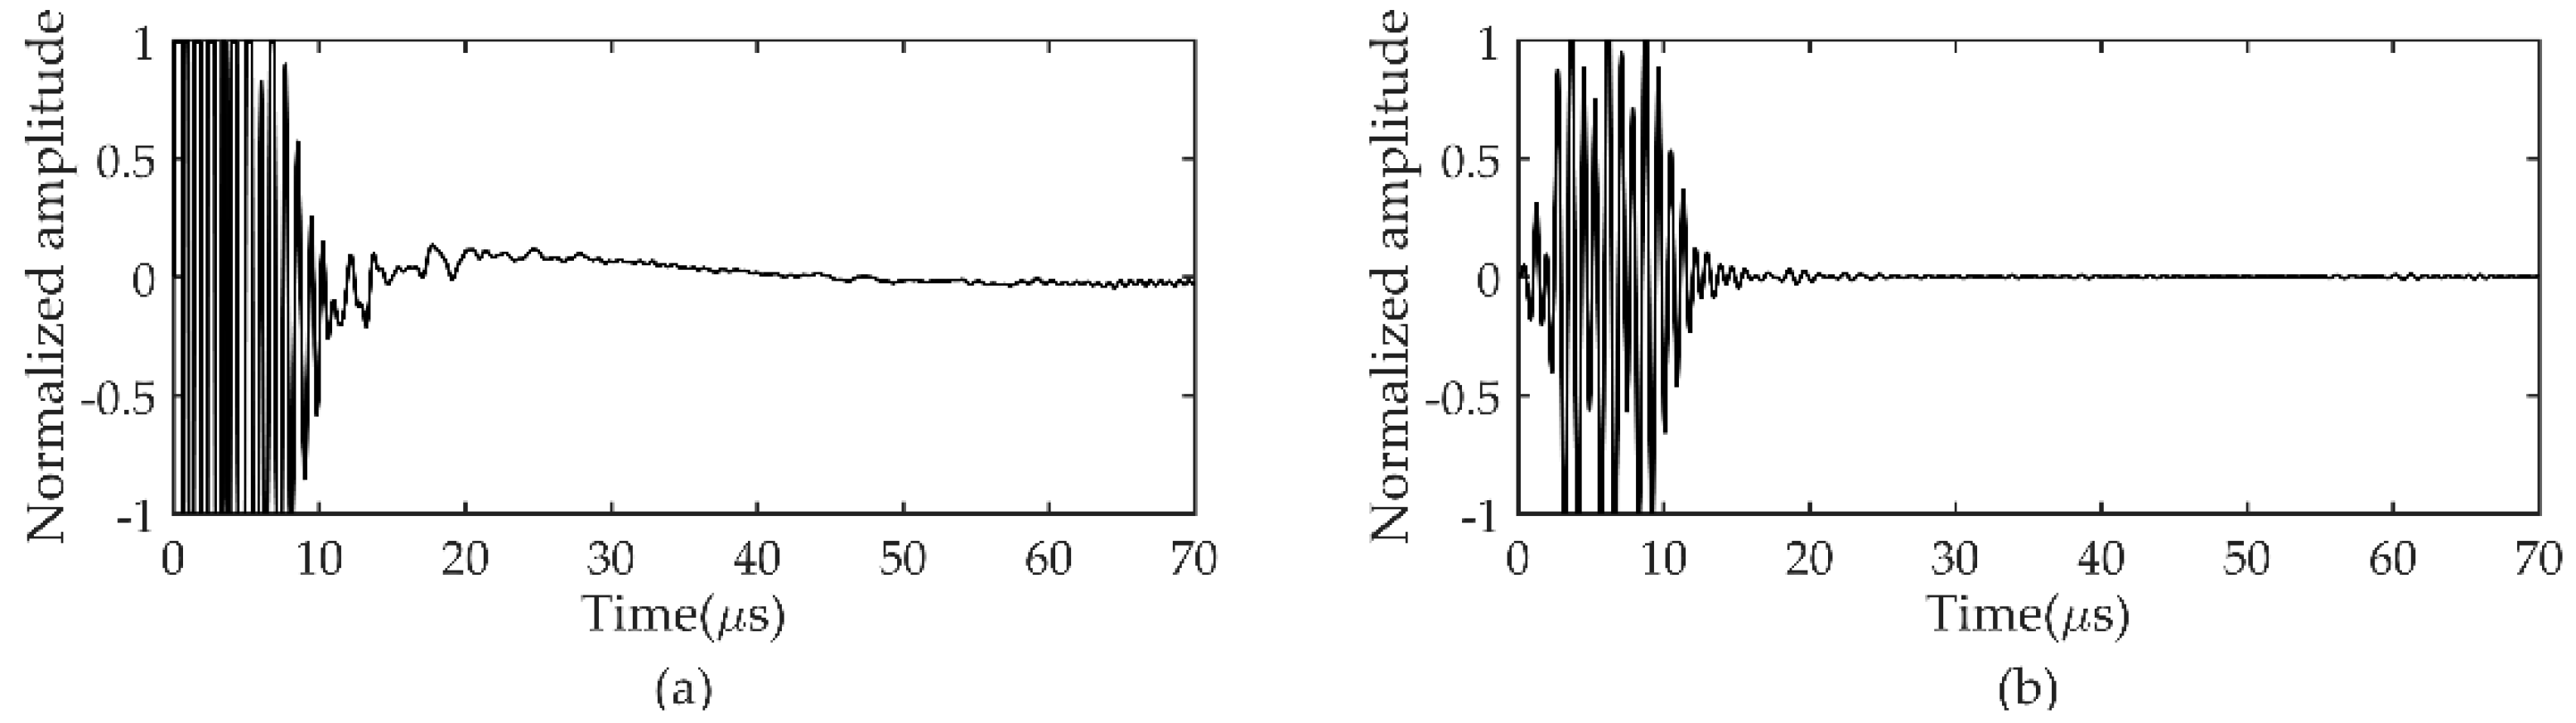
3.1. Filtering Processing

To simplify the analysis process, the time-domain analysis was only performed on plate A. Prior to auto-correlation, a bandpass filter was applied to the experimental full matrix data according to the central frequency of the probe. Figure 5 represents the directly recorded and the filtered signals while the emitter and receiver are both No. 8 element. Since the specific magnitude is not considered, the amplitude is normalized with respect to the maximum value to compensate the temporal fluctuations. Meanwhile, the selected time-windows are from 0 to 70 μs, which reasonably contains the information of initial wave, scattered wave and bottom wave in this experiment. In addition, the filtered time-frequency spectrum and the power spectral density estimated by the periodic method are shown in Figure 6a,b. It can be observed from these figures that the power changes around the frequency of 1 MHz is quite drastic, which shows that the main information mostly concentrated in the central frequency of the probe was preserved.

3.2. Auto-Correlation Processing

It can be observed from Figure 5b that the filtered time-domain signal is still influenced by the noise. The direct arrival signal and the background noise cannot be distinguished. Thus, auto-correlation processing was carried out to prove our methodology, whose results are displayed in Figure 7. In accordance with the calculations of the time of flight ( t = 2 d / c , t is the time of fight, d is the distance of the receivers and scatters), the correlation peak will appear in the interval of 15 to 18 μs. The waveforms are symmetrical with respect to the zero-time, which agrees well to the theory that the auto-correlation functions are even functions. Unfortunately, however, the auto-correlation results without auto-correlation subtraction processing (refer to Equation (2)) in Figure 7a shows that the correlation peak with a large value at zero-time (the red dashed box), which seriously obscures the information of scattering position (the blue dashed line). Moreover, the amplitude at 60 μs is also greater than the value of the interval between 15 and 18 μs. After the application of the auto-correlation subtraction method (refer to Equation (3)), it is worthy noticed that the correlation peak of scattering position is strengthened and the peak of zero-time is removed in Figure 7b.
Furthermore, the results of auto-correlation without and with removing the background noise are displayed in a way similar to B scan in Figure 7c,d. Here, the horizontal axis is the element index of the phased array, and the vertical axis represents to the time index of auto-correlation function. It is more intuitively observed that the result of auto-correlation subtraction includes obvious scattering information between 15 and 18 μs as shown in Figure 7d. The result in Figure 7c is different, in which the information from 15 to 18 μs are obscured. At the same time, in order to evaluate the useful signal and noise quantitatively before and after subtraction processing, we introduced the calculation of signal-to-noise ratio (SNR) according to Equation (10). For the sake of brevity, the recorded signals of the fourth receiver are selected as our example. Considering the signals of 0 to 15 μs as noise and the useful signal between 15 and 18 μs as useful signal, the SNR is −53.1 and −8.7 dB, respectively, corresponding to the signal-to-noise ratio before and after the application of subtraction method. Obviously, the signal-to-noise ratio is improved by 44 dB with the proposed strategy, which demonstrates the validity of auto-correlation subtraction in the time-domain.
S N R = 20 log 10 E ( U s e f u l   s i g n a l ) E ( n o i s e ) ,
where E ( · ) is the representation of energy and the results are in decibels (dB).

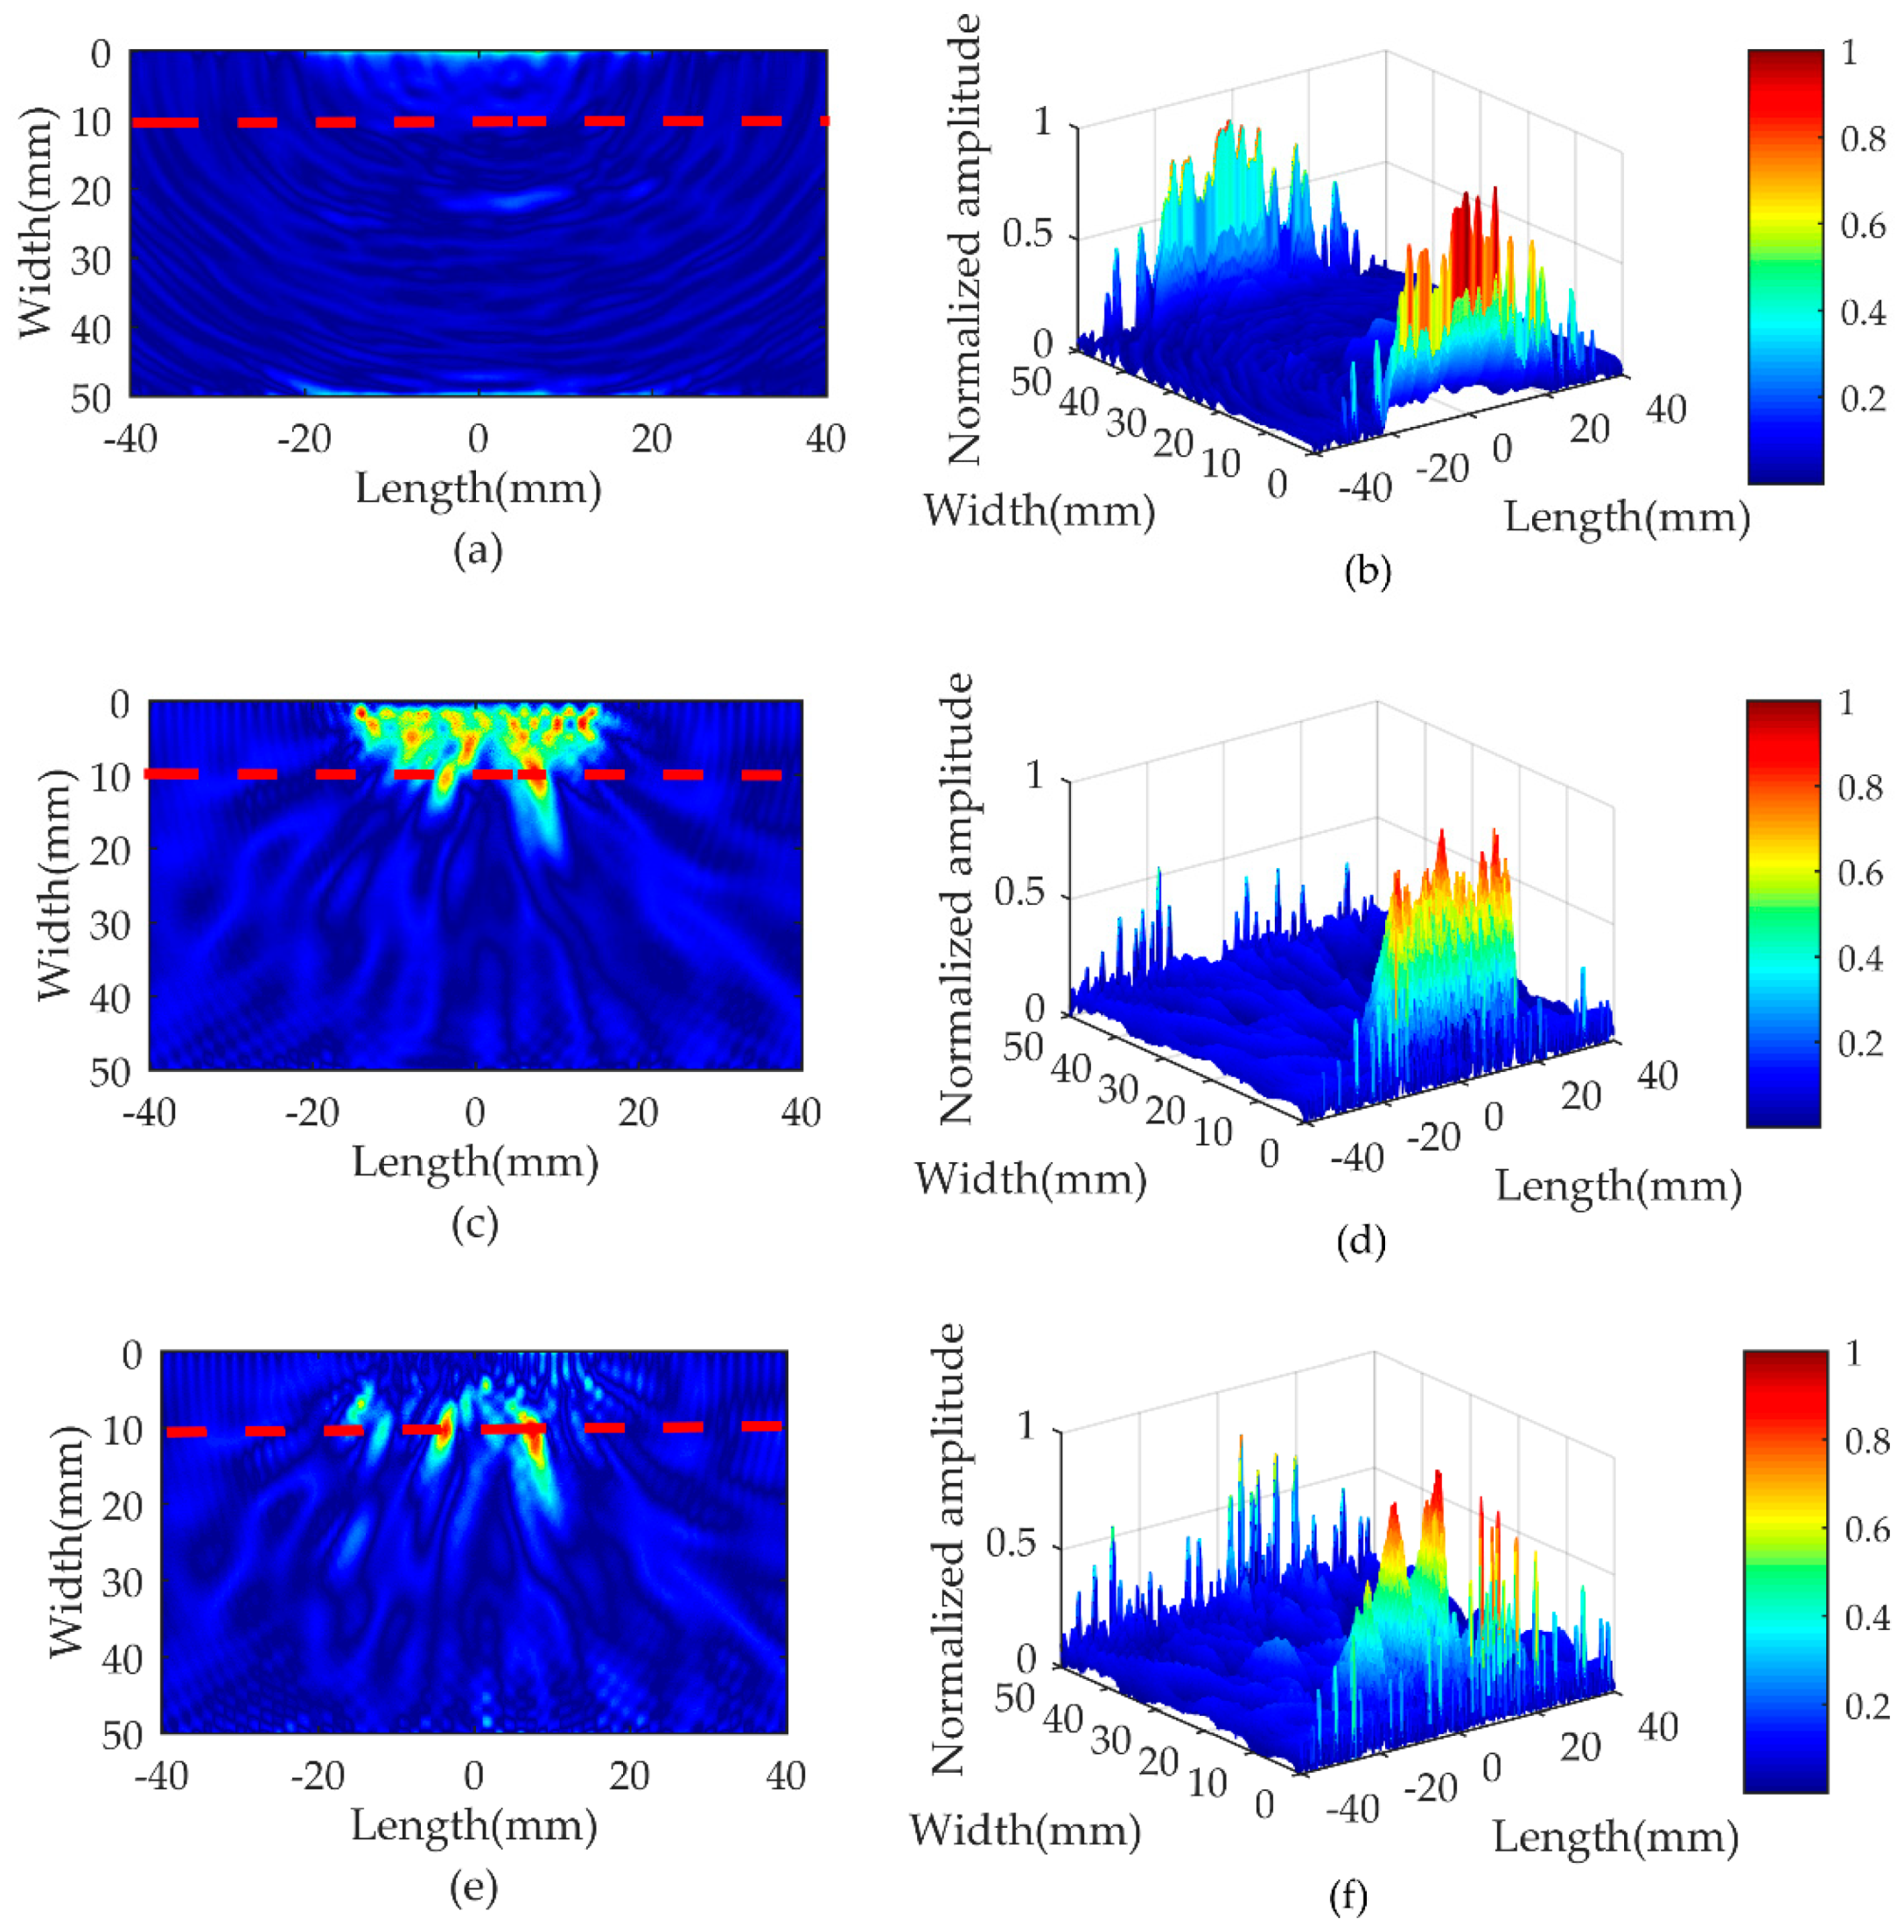
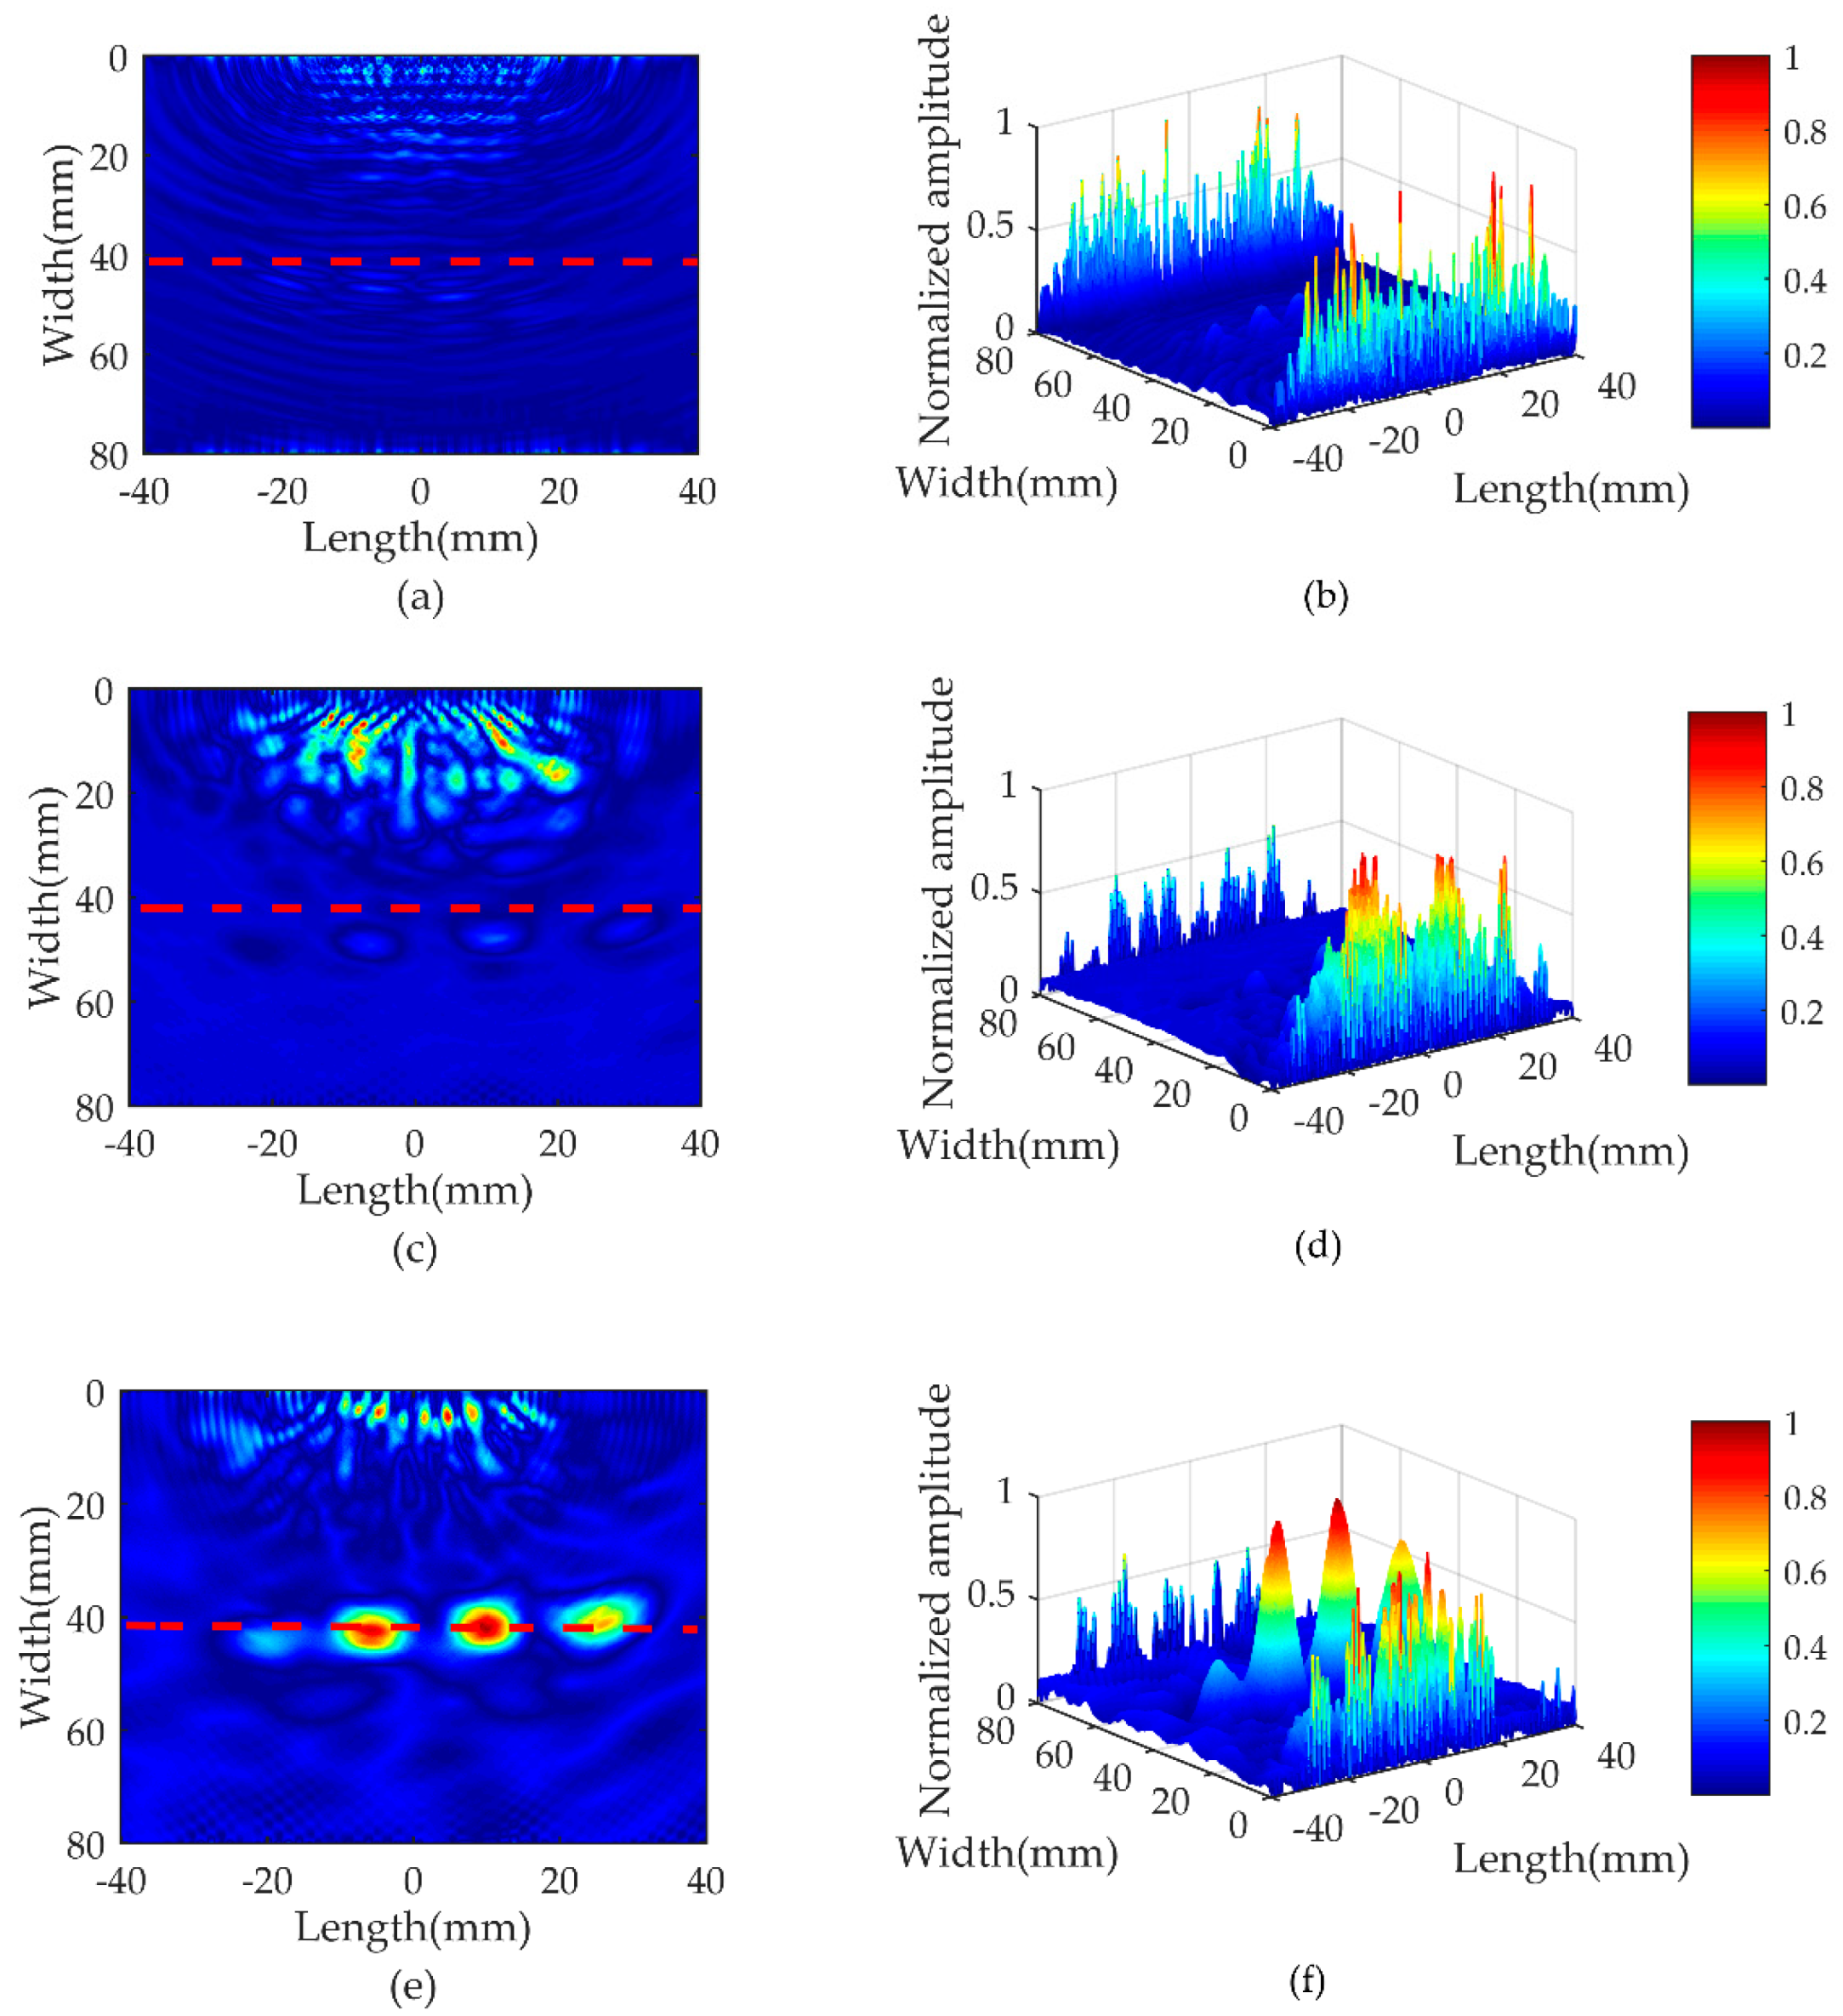
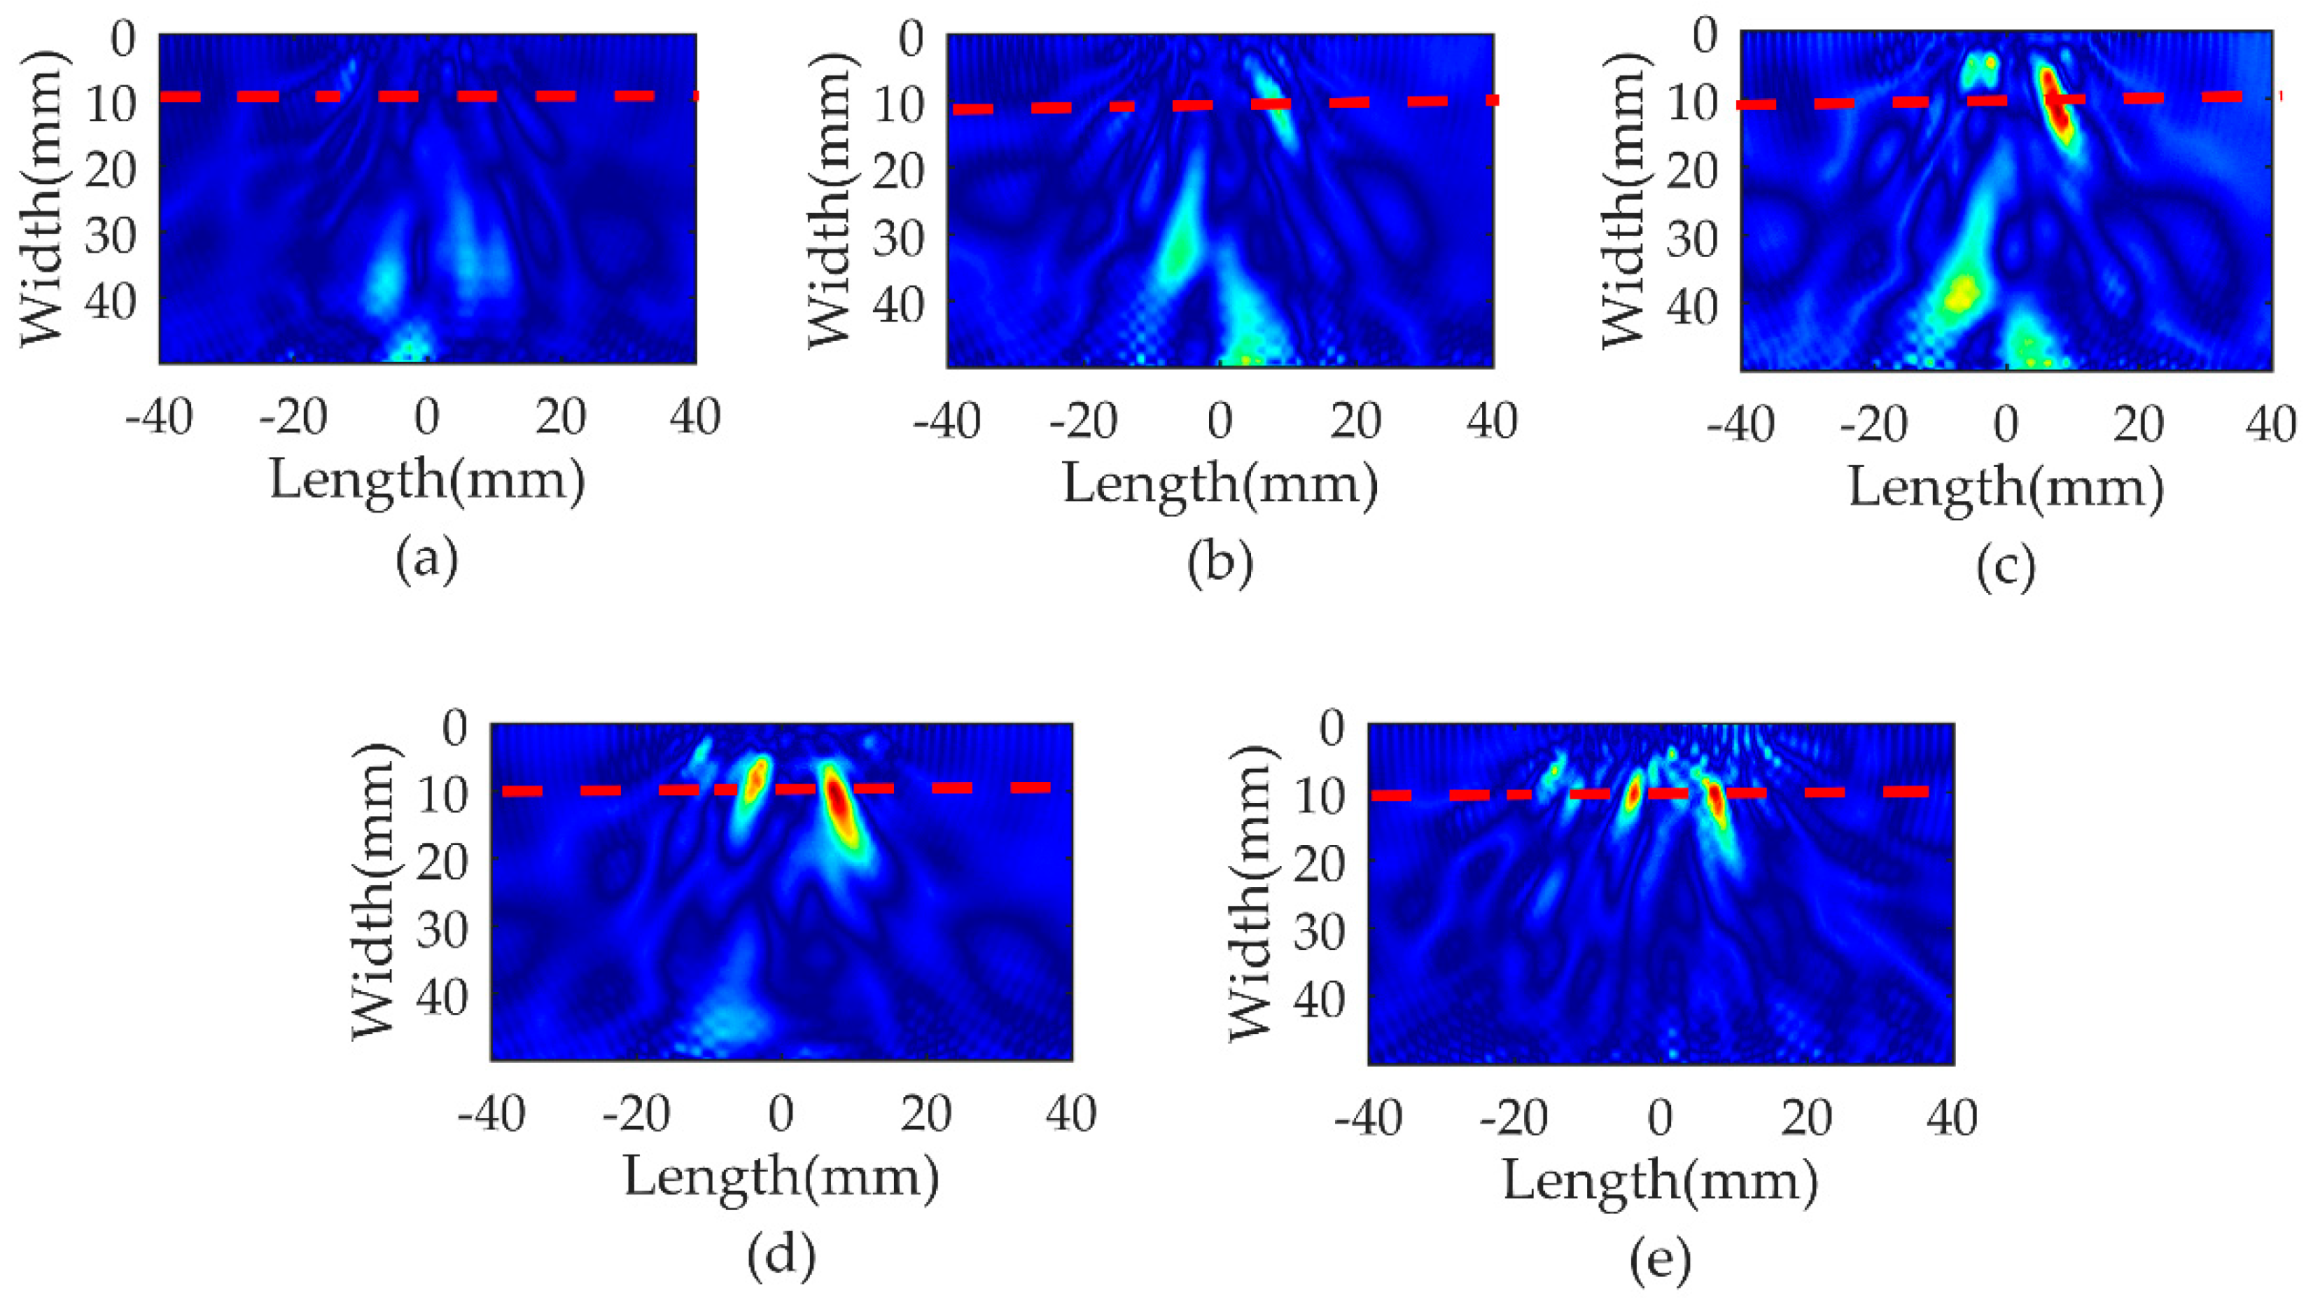
4. Imaging Results and Analysis

In order to estimate the ability of defect detection visually, an algorithm of the total focusing method based on the auto-correlation method was applied in this section. The results of full focal imaging are displayed in Figure 8, Figure 9 and Figure 10. Where the coordinate origin is aligned to the center of the phased array probe. The full focal imaging results of the filtered was shown in the Figure 8a,b, Figure 9a,b, Figure 10a,b. Unfortunately, the defect cannot be located. As revealed in the time domain analysis, that is because the signal directly captured by the phased array probe is always affected by the background noise. When the distance between the defects and the transducer decreases to 10 mm, the defects are completely submerged in the initial noise. Consequently, it is necessary to further process this A-scan signals. Then, the full focal imaging of the auto-correlation without subtraction processing was shown in Figure 8c,d, Figure 9c,d, Figure 10c,d. Although the imaging results are relatively improved, the detectability and resolution of defects are still poor. Meanwhile, the imaging quality gradually decreases as the diameter of the defects and the distance between the transducer and defects decrease. These results were also consistent with the previous theoretical analysis. In order to the imaging quality, the full focal imaging of the auto-correlation subtraction is implemented, as shown in Figure 8e,f, Figure 9e,f, Figure 10e,f. Since the distance between the defects and transducer is smaller in plate B compared to other plates, the imaging is more susceptible to the influence of the background noise. As a result, the shape of defects is not around in the plate B. However, it can be seen in Figure 8e,f, Figure 9e,f, Figure 10e,f that the influence of initial noise and the signal from the bottom of the plate are all suppressed and the location of defects are accurate in both two- and three-dimensional images. To the best of our knowledge, ultrasonic lamb wave can detect defects whose diameter is larger than half of the wavelength. But according to Figure 10e,f, the proposed method still works when the diameter of the defect is 1 mm (= 1/5 wavelength). Therefore, defects with the diameter smaller than half of the wavelength can be detected as well in practical experiment of isotropic materials. These experimental results manifest that the feasibility of the auto-correlation subtraction method combining with TFM can locate the defects.
Additionally, we compare the imaging results of auto-correlation (based on Equation (3) in this paper) and cross-correlation (based on Equation (2) in [12]) method at the end of this section. Here, the aluminum plate A and B will be analyzed for reducing redundancy of analysis, which respectively corresponds to Figure 11 and Figure 12. The subfigures a–d reveal the imaging results including the cross-correlation of synchronization error of 10, 4, 2 μs, and no synchronization error between the different receivers. The images of the auto-correlation subtraction are shown in Figure 11e and Figure 12e. Following the findings from Figure 11d and Figure 12d, the full focal imaging of cross-correlation can determine the location of these two defects when there is no synchronization error. These results are similar to the full focal imaging of the auto-correlation. However, once there are the greater synchronization errors between the receivers, the focusing results of cross-correlation gradually becomes worse, and the defect information cannot be located. From the theoretical perspective of auto-correlation method, the result is not restricted by the synchronization of the receivers which fully verifies the superiority of auto-correlation subtraction method.

5. Conclusions

In this paper, we present a method of non-destructive testing using the auto-correlation of full matrix data. In the experiment, an M2M ultrasonic phased array was used to capture the full matrix data, but the directly recorded signal is always influenced by the background noise. Therefore, the auto-correlation subtraction method was applied to solve this problem in the time domain. The results show that this proposed method can remove the effect of the noise and greatly increase the SNR, which provides data support for the subsequent imaging combined with TFM. The full focal imaging results demonstrate that defects of different sizes and locations can be located correctly located. In particular, the smallest defects with the diameter of about 1/5 wavelength can also be detected in the plate C. In addition, the experimental results also reveal that the cross-correlation method relies on the synchronization between a pair of receivers in comparison with the imaging results of the auto-correlation subtraction method. With the synchronization errors between the receivers increasing, the imaging quality based on cross-correlation method degrades.
To display the advantage of applying the auto-correlation subtraction method to inspect large plates, the results in this article have been confined to the through holes of isotropic media. The presented method is essentially based on information processing. Thus, this theory can also be appropriate for other situations, such as hidden defects, multiple smaller defects with irregular distribution and composite material, etc. Most importantly, the experimental results show that a fully diffuse wavefield may not be necessary to locate the defects based on the auto-correlation processing, which will be one of our future works. To some extent, this study also provides a good idea for the implementation of non-destructive testing.

Author Contributions

Conceptualization, H.Z. (Haiyan Zhang); Data curation, G.F. and H.Z. (Hui Zhang); Methodology, H.Z. (Haiyan Zhang); Project administration, H.Z. (Haiyan Zhang); Software, J.Z.; Validation, W.Z.; Writing—original draft, J.Z.; Writing—review & editing, Q.Z. and R.Z.

Funding

The work in this paper is supported by the National Natural Science Foundation of China (Grant Nos. 11874255, 11674214), and the Key Technology R&D Project of Shanghai Committee of Science and Technology (Grant No. 16030501400).

Conflicts of Interest

The authors declare no conflict of interest.

References

  1. LeLeux, A.; Micheau, P.; Castaings, M. Long Range Detection of Defects in Composite Plates Using Lamb Waves Generated and Detected by Ultrasonic Phased Array Probes. J. Nondestruct. Evaluation 2013, 32, 200–214. [Google Scholar] [CrossRef]
  2. Wu, H.; Chen, J.; Yang, K.; Hu, X. Ultrasonic array imaging of multilayer structures using full matrix capture and extended phase shift migration. Meas. Sci. Technol. 2016, 27, 045401. [Google Scholar] [CrossRef]
  3. Peng, J.; Peng, H.; Zhang, Y.; Gao, X.; Peng, C.; Wang, Z. Study on the railway wheel ultrasonic inspection method using the full matrix capture. In Proceedings of the 2013 Far East Forum on Nondestructive Evaluation/Testing: New Technology & Application (FENDT), Jinan, China, 17–20 June 2013. [Google Scholar]
  4. Weaver, R.L.; Lobkis, O.I. On the emergence of the Green’s function in the correlations of a diffuse field. J. Acoust. Soc. Am. 2001, 109, 2410. [Google Scholar] [CrossRef]
  5. Liu, X.; Ben-Zion, Y. Estimating correlations of neighbouring frequencies in ambient seismic noise. Geophys. J. Int. 2016, 206, 1065–1075. [Google Scholar] [CrossRef] [Green Version]
  6. Brown, M.G.; Godin, O.A.; Williams, N.J.; Nikolay, A.Z.; Liudmila, Z.; Geoffrey, J.B. Acoustic Green’s function extraction from ambient noise in a coastal ocean environment. Geophys. Res. Lett. 2014, 41, 5555–5562. [Google Scholar] [CrossRef]
  7. Sabra, K.G.; Roux, P.; Kuperman, W.A. Arrival-time structure of the time-averaged ambient noise cross-correlation function in an oceanic waveguide. J. Acoust. Soc. Am. 2005, 117, 164. [Google Scholar] [CrossRef] [PubMed]
  8. Chehami, L.; Moulin, E.; De Rosny, J.; Prada, C.; Matar, O.B.; Benmeddour, F.; Assaad, J. Detection and localization of a defect in a reverberant plate using acoustic field correlation. J. Appl. Phys. 2014, 115, 104901. [Google Scholar] [CrossRef]
  9. Bérénice, F.; Campillo, M.; Roux, P. Reconstructing the Green’s function through iteration of correlations. C. R. Geosci. 2011, 343, 623–632. [Google Scholar]
  10. Li, G.; Li, J.; Gao, D.; Wang, N. Passive imaging of scatterers based on cross-correlations of ambient noise. Acta Acustica 2016, 41, 49–58. (In Chinese) [Google Scholar]
  11. Yang, Y.; Xiao, L.; Qu, W.; Lu, Y. Passive detection and localization of fatigue cracking in aluminum plates using Green’s function reconstruction from ambient noise. Ultrasonics 2017, 81, 187–195. [Google Scholar] [CrossRef]
  12. Potter, J.; Wilcox, P.; Croxford, A. Diffuse field full matrix capture for near surface ultrasonic imaging. Ultrasonics 2018, 82, 44–48. [Google Scholar] [CrossRef] [PubMed] [Green Version]
  13. Chi, J.; Gao, D.; Wang, N.; Li, X.; Li, J. Extraction of scattering echo time by surf noise background subtracted autocorrelation. J. Acoust. Soc. Am. 2017, 142, EL1–EL6. [Google Scholar] [Green Version]
  14. Farahani, G.; Ahadi, S.M.; Homayounpoor, M.M.; Kashi, A. Consideration of correlation between noise and clean speech signals in autocorrelation-based robust speech recognition. In Proceedings of the IEEE International Symposium on Signal Processing & Its Applications, Sharjah, United Arab Emirates, 12–15 February 2008. [Google Scholar]
  15. Chi, J.; Li, X.; Gao, D.; Wang, H.; Wang, N. Passive detection of scatter using autocorrelation of surf noise. Acta Phys. Sin. 2017, 66, 158–165. (In Chinese) [Google Scholar]
  16. Mutsuki, M.; Naoki, M.; Shiro, B. Transmission of Lamb waves across a partially closed crack: Numerical analysis and experiment. Ultrasonics 2019, 92, 57–67. [Google Scholar]
  17. Holmes, C.; Drinkwater, B.W.; Wilcox, P.D. Post-processing of the full matrix of ultrasonic transmit–receive array data for non-destructive evaluation. NDT E Int. 2005, 38, 701–711. [Google Scholar] [CrossRef]
  18. Muller, A.; Robertson-Welsh, B.; Gaydecki, P.; Gresil, M.; Soutis, C. Structural Health Monitoring Using Lamb Wave Reflections and Total Focusing Method for Image Reconstruction. Appl. Compos. Mater. 2017, 24, 553–573. [Google Scholar] [CrossRef]
  19. Oscar, M.G.; Oscar, R.L.; Carlos, J.M.; Alberto, I.; Luis, G.U. A new beamforming process based on the phase dispersion analysis. AIP Conf. Proc. 2012, 1433, 185–188. [Google Scholar]
  20. Zhang, H.; Liu, Y.; Fan, G.; Zhang, H.; Zhu, W.; Zhu, Q. Sparse-TFM Imaging of Lamb Waves for the Near-Distance Defects in Plate-Like Structures. Metals 2019, 9, 503. [Google Scholar] [CrossRef]
  21. Yu, L.; Giurgiutiu, V. Piezoelectric Wafer Active Sensors in Lamb Wave-Based Structural Health Monitoring. JOM 2012, 64, 814–822. [Google Scholar] [CrossRef]
  22. Rodriguez, S.; Deschamps, M.; Castaings, M.; Ducasse, E. Guided wave topological imaging of isotropic plates. Ultrasonics 2014, 54, 1880–1890. [Google Scholar] [CrossRef]
  23. Mu, W.; Qu, W.; Liu, G.; Zou, Z.; Liu, P. Acoustic emission beamforming localisation approach based on particle swarm optimisation. Insight—Non-Destructive Test. Cond. Monit. 2018, 60, 1–6. [Google Scholar] [CrossRef]
Figure 1. The schematic diagram of Full Matrix Capture (FMC).
Metals 09 00666 g001
Figure 2. Full matrix data.
Metals 09 00666 g002
Figure 3. Graphical illustration of the auto-correlation method.
Metals 09 00666 g003
Figure 4. The schematic view of the detailed information of defects and phased array transducers in (a) plate A, (b) plate B, and (c) plate C.
Metals 09 00666 g004aMetals 09 00666 g004b
Figure 5. The typical response signals generated by the piezoelectric actuator 8 and receiver 8 with respect to plate A. (a) The directly recorded signal and (b) the filtered signal.
Metals 09 00666 g005
Figure 6. The filtered time-frequency spectrum and its periodogram power spectral density estimate is shown when the emitter and receiver are both No. 8 receiver in (a,b) respectively. These experimental results were also analyzed on plate A.
Metals 09 00666 g006
Figure 7. Comparison of auto-correlation before and after subtraction processing on plate A. (a,b) show the normalized results of all receivers; (c,d) show the results in a way similar to B scan; (e,f) show the results recorded by No. 4 receiver.
Metals 09 00666 g007
Figure 8. Full focal imaging in plate A based on (a,b) the filtered data, the auto-correlation result (c,d) before and (e,f) after subtraction processing in two and three dimensions.
Metals 09 00666 g008
Figure 9. Full focal imaging in plate B based on (a,b) the filtered data, the auto-correlation result (c,d) before and (e,f) after subtraction processing in two and three dimensions.
Metals 09 00666 g009
Figure 10. Full focal imaging in plate C based on (a,b) the filtered data, the auto-correlation result (c,d) before and (e,f) after subtraction processing in two and three dimensions.
Metals 09 00666 g010
Figure 11. The full focal imaging in plate A based on cross-correlation with synchronization error of 10, 4, 2 μs, and no synchronization error, respectively, in (ad); (e) The full focal imaging based on auto-correlation subtraction method.
Metals 09 00666 g011
Figure 12. The full focal imaging in plate B based on cross-correlation with synchronization error of 10, 4, 2 μs, and no synchronization error, respectively, in (ad); (e) The full focal imaging based on auto-correlation subtraction method.
Metals 09 00666 g012
Table 1. Parameter setting of phased array probe.
ParameterValue
Number of elements16
Element spacing2.0 mm
Element width1.8 mm
Central frequency1.0 MHz
Sampling frequency50 MHz
Excitation voltage70 V
Wave velocity (c)5300 m/s

