Article

Tooth Root Bending Fatigue Strength of High-Density Sintered Small-Module Spur Gears: The Effect of Porosity and Microstructure

1
Department of Industrial Engineering, University of Trento, via Sommarive 9, 38122 Trento, Italy
2
GKN Sinter Metals, via Delle Fabbriche 5, 39031 Brunico (BZ), Italy
*
Author to whom correspondence should be addressed.
Metals 2019, 9(5), 599; https://doi.org/10.3390/met9050599
Submission received: 26 April 2019 / Revised: 16 May 2019 / Accepted: 22 May 2019 / Published: 24 May 2019
(This article belongs to the Special Issue Fatigue Design and Defects in Metals and Alloys)

Abstract

:
The present paper is aimed at investigating the effect of porosity and microstructure on tooth root bending fatigue of small-module spur gears produced by powder metallurgy (P/M). Specifically, three steel variants differing in powder composition and alloying route were subjected either to case-hardening or sinter-hardening. The obtained results were interpreted in light of microstructural and fractographic inspections. On the basis of the Murakami a r e a method, it was found that fatigue strength is mainly dictated by the largest near-surface defect and by the hardness of the softest microstructural constituent. Owing to the very complicated shape of the critical pore, it was found that its maximum Feret diameter is the geometrical parameter that best captures the detrimental effect on fatigue.

Graphical Abstract

1. Introduction

The automotive industry is being steadily pushed to pursue economic and environmental efficiency. Powder metallurgy (P/M) offers a powerful means to achieve this target, as (near) net-shape mechanical components can be fabricated on a large scale, with high geometrical accuracy and minimum waste of raw material compared to conventional chip-generating machining processes. Flodin [1] reviewed the increasing employment of P/M parts in automotive transmissions, mainly in the form of synchronizer sleeves, shift fingers, carriers of epicyclical automatic transmissions, and oil pump gears. Attempts are now made to replace conventionally machined gears with P/M gears, at least in the least-loaded gear stages of car transmissions. However, bringing the mechanical performance of P/M gears to the level of their wrought counterparts is a tremendous technological challenge because this particular manufacturing route inevitably affects the resulting microstructure and mechanical properties. The main microstructural characteristic that differentiates P/M from wrought parts is residual porosity. Despite constant improvements in the compaction and sintering of metallic powders, P/M parts still display a relative density lower than 1. This clearly impacts on the stiffness, tensile, fatigue and wear properties of such components [2,3,4]. In the context of P/M gears, (i) the lower stiffness is detrimental to the mesh precision and mesh power loss factor [5], (ii) inferior fatigue properties negatively affect tooth root bending fatigue strength [6] and pitting resistance [7], and (iii) sintered tooth flanks have higher wear rates [8]. To combat these adverse effects, many treatments have been devised so far, such as shot peening [9], surface rolling [10], sinter-forging [11], and the double press double sinter process [12]. These treatments lead to tooth flank and root densification, which significantly improves the gear load capacity [13,14]. However, both bulk and surface densification treatments have a cost that is not always sustainable if compared to the profit margin of these automotive components. In this framework, the leanest and most cost-efficient process is powder compaction followed by sinter-hardening. Thereby, two processes are done in one single step, thus reducing the manufacturing time and cost. In addition, since martensite is directly formed during the cooling stage of the sintering process, no quenching is required, thus, problems related to oil retention and distortions associated with severe cooling rates are avoided [15]. To facilitate the formation of a martensitic or lower bainitic microstructure at cooling rates (1–10 °C s
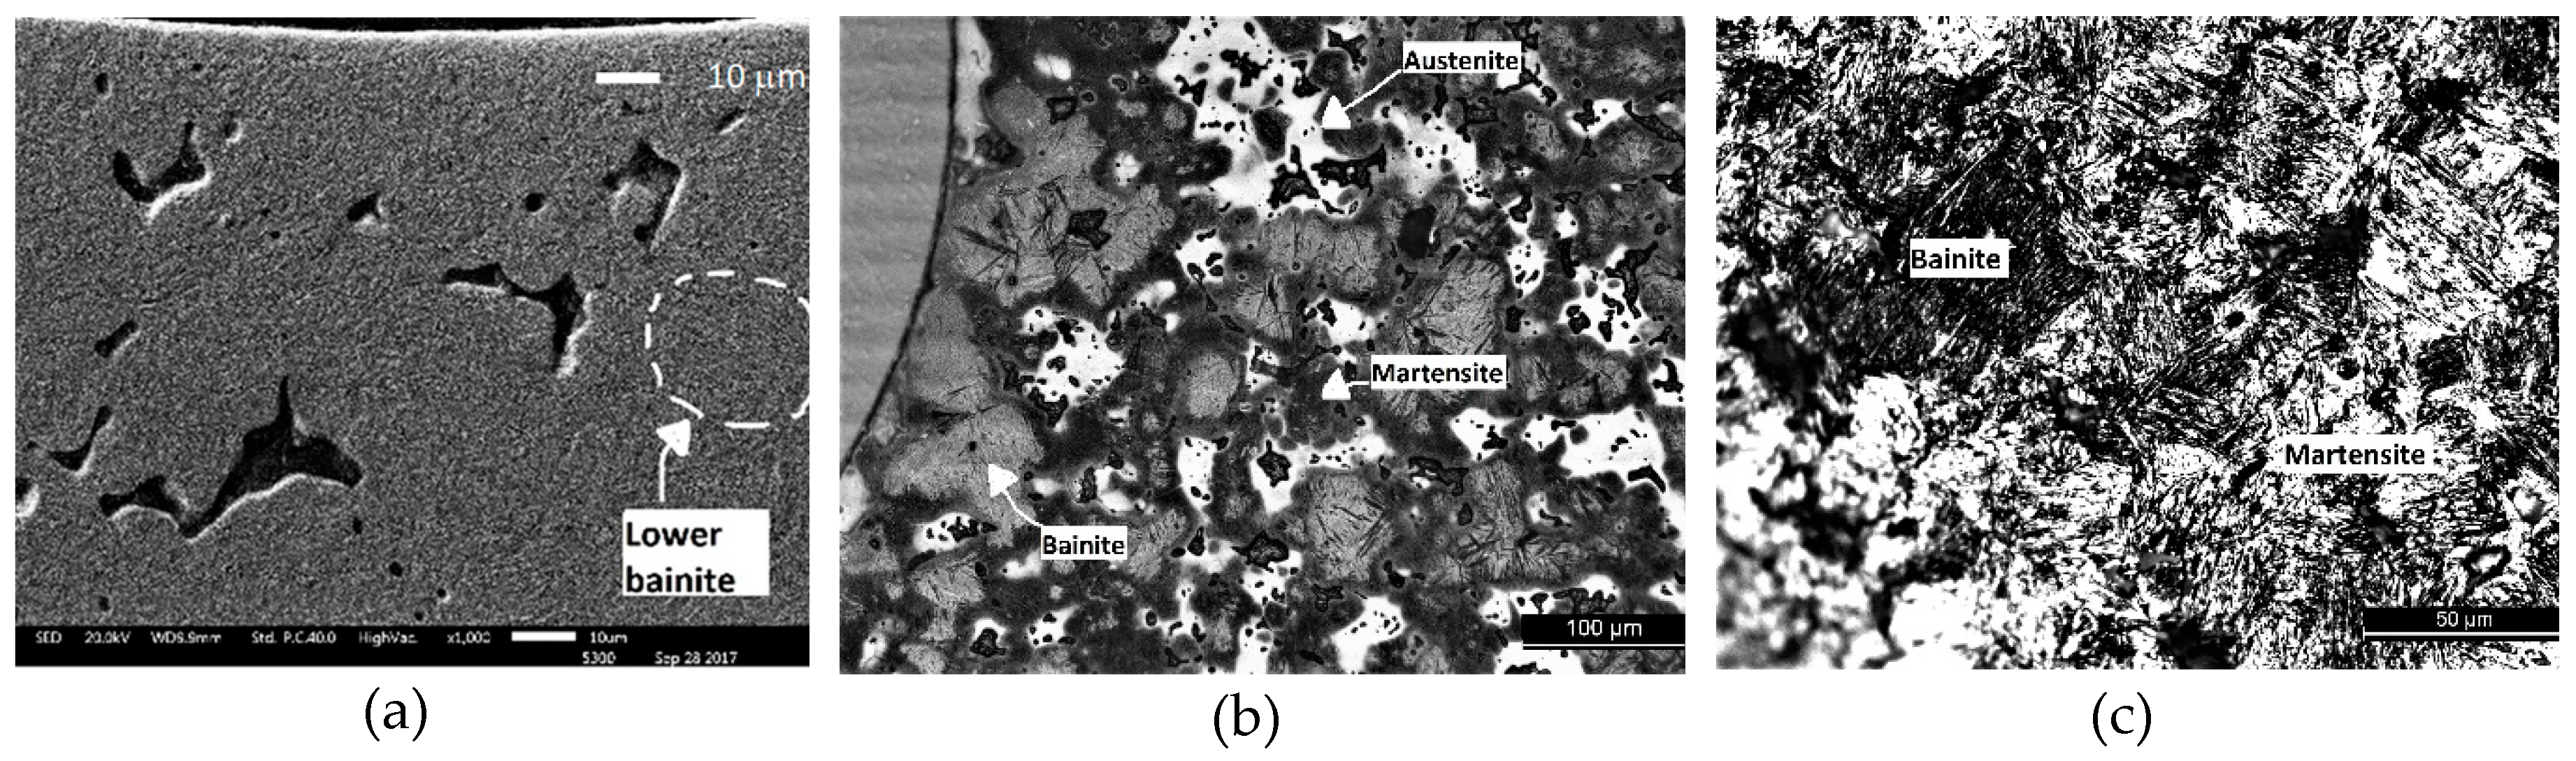
−1) typical of the sinter-hardening process, special pre-mixed, diffusion-bonded or pre-alloyed powder blends have been devised to achieve adequate hardenability through the control of carbon content and the addition of alloying elements, such as Mo, Ni, and Cu. However, during sintering these elements are not distributed uniformly along the sinter-necks, resulting in a heterogenous microstructure. For instance, the slow diffusion rate between iron and nickel leads to the formation of nickel rich areas (NRAs), which are a combination of soft austenite and hard martensite [16], in general surrounding critical pores [17].
From the above discussion, it is clear that the tooth root bending fatigue strength of P/M gears, the focus of the present article, is the result of a complex interplay between porosity and microstructural constituents. Devising suitable fatigue calculation tools that are able to capture these phenomena is therefore of paramount importance for the fatigue prognosis of such P/M parts. In this regard, Danninger and Weiss [18] carried out fundamental investigations on the influence of porosity on the mechanical properties. They found that up to relative density levels of 94%, the porosity is mostly or completely open and interconnected, forming a spongy structure with a continuous pore network. However, at higher density levels, the structure is composed of isolated and more or less rounded pores in a continuous matrix. This means that in the former case, the sintering contacts are isolated and the area of the real metallic contacts, the ‘load bearing cross-section’ Ac is markedly smaller than the volume fraction of the metallic phase. In [18], the authors were able to rationalize the fatigue endurance of high-strength steels just by scaling the fatigue strength of the fully dense reference material by Ac. In such spongy materials, fatigue damage usually occurs very early and is located at the necks between powder particles, which are the weakest point of the microstructure. In this way, the fatigue is diffused rather than localized as it is in conventional materials and proceeds until eventual failure by coalescence of widespread defects [19,20].
In this context, it is clear that the key parameter for improving fatigue performance is the increment in relative density. Accordingly, when the porosity drops to levels below 6%, fatigue damage is delayed and localized in the correspondence of isolated pores with low shape factor or clusters of near-superficial pores [21]. Under these circumstances, fatigue calculation models originally developed for bulk metallic materials, can be applied to P/M steels. In this regard, the pores are treated in some papers [18,22,23] as pre-existing cracks and a linear-elastic fracture mechanics approach is applied for identifying the propagation conditions of crack-like defects. Furthermore, the Murakami model [24], initially proposed for determining the fatigue limit of steels containing inclusions, has been successfully applied to predict the fatigue strength of P/M steels [22,23] and additively manufactured metals [25]. In its most general formulation, this approach permits the estimation of the fatigue limit of the material with the following equation, which also includes the effect of the load ratio R:
σ W = F l o c H V + 120 ( a r e a ) 1 / 6 ( 1 R 2 ) α
where the microstructure-dependent mechanical properties of the material are quantified by the Vickers hardness (HV), and the detrimental effect of the fatigue damage triggering defect is expressed by its area projected on the plane experiencing the highest normal stress. The location factor Floc is related to the defect location with respect to the outer surface, being equal to 1.41 and 1.56 for surface and internal defects, respectively. The exponent α is also a function of the material microhardness, being expressed as α = 0.226 + HV × 10−4.
Since the Murakami model was devised for materials whose fatigue strength is dictated by isolated defects, Bergmark [22] proposed an adaption of its formulation when applied to P/M materials affected by widespread defectiveness by introducing a corrective factor. This is a function of the loss in elastic modulus with respect to the fully dense material, which is in turn, a measure of the material porosity. In this way, it is possible to link the Murakami model, which is suitable for continuous materials, to the Ac model devised in [18] for sponge materials with interconnected porosity. Nevertheless, it is still unclear how to define the critical pore and the material hardness to be considered in the application of such a model to P/M materials.
To shed further light on this research topic, the present paper investigates the tooth root bending fatigue strength of small module high-density spur gears produced by P/M using different pre-alloyed powders and subjected to diverse heat treatments. The main goal of this paper is to understand whether sinter-hardening is able to impart fatigue properties comparable to those achieved by conventional case-hardening post-sintering treatments. Moreover, the paper investigates the synergic effect of pore structure and heterogeneous microstructure (typical of sinter-hardened materials) on the fatigue strength. Therefore, the fatigue behaviour was examined by starting with an in-depth fractographic analysis aimed at exploring the influence of porosity and microstructure on the nucleation and propagation of cracks. Special care was taken to adapt the formulation of the Murakami model so as to capture the particular characteristics of the sintered materials.

2. Materials and Methods

The experiment was carried out on small-module spur gears that are used in automotive applications. Their main constructive characteristics are summarized in Table 1 and their geometry is schematically sketched in Figure 1.
The gears were fabricated through the conventional P/M route using three types of pre-alloyed or diffusion bonded powders, whose nominal compositions are listed in Table 2.
During the blending phase, carbon was added in the form of graphite in an amount of 0.25 wt% for A85Mo05 and 0.15 wt% for DHP as well as DDH. The gears were manufactured by GKN Sinter Metals. The powders were compacted by single pressing to achieve a green density exceeding 7.2 g/cm3. The green compacts were sintered at 1120 °C for 30 min in a controlled atmosphere of endogas, and then subjected to different thermochemical treatments. Conventional case-hardening was applied to the A85Mo05 variant. This consists of austenizing at 860 °C followed by oil quenching. Sinter-hardening was instead applied to DDH and DHP variants. Thereby, the gears were cooled through forced convection of endogas from 1120 °C to 300 °C. The endogas atmosphere in sinter-hardening was set with a 0.8% carbon potential to enrich the carbon content of the surface layer, thus making possible the martensitic transformation upon cooling. The hardening effect is comparable to that of the more conventional case hardening. Final stress-relieving was carried out at 180 °C for 1 h.
Total and open porosity were measured through the Archimedes’ method according to standard ASTM B311. For a deeper analysis of the permeability of the pore network during carburization the He pycnometry is preferable [27], however, this paper is more focused on the role of the pore network in dictating the fatigue crack propagation. For this reason, these measurements were complemented by image analysis of micrographs taken by optical microscopy, in order to investigate the morphology and spatial distribution of the pores located at the tooth root, inside the tooth and in the gear body.
Tooth root bending fatigue tests were conducted in a laboratory environment with a resonant Rumul Mikroton testing machine equipped with a 20 kN load cell. This was operated in load control with a load ratio R = 0.1 at a frequency of about 150 Hz. Fatigue tests were interrupted after 1 Hz frequency drop or survival of 3 × 10⁶ cycles. The test configuration is shown in Figure 2, that is, two anvils apply a pulsating load to two teeth encompassing 3 unloaded teeth.
The anvils were designed so that when their stem is in contact with two teeth, the load is applied along a direction inclined of about 2° (with respect to the normal) to the contact point. In this way, a low friction coefficient (on the order of 0.05) is sufficient to prevent loss of contact during loading. This test configuration fails to apply the fatigue load along the line tangent to the base circle and passing to the tooth tip as prescribed by ISO6336. For this reason, rather than the formula available in this standard and used for instance in [28], the stress state in the critical location of the tooth root was evaluated through a finite element (FE) analysis able to reproduce the actual testing configuration. The FE model employs quadratic 20-node brick elements. To increase the computational efficiency, the local stress field in the most critically stressed teeth was evaluated from a sub-model, shown in Figure 3, whose boundary conditions were imposed by the interpolated displacements of the general model. The adopted mesh was refined with the ISO 6336 loading configuration as a reference. The final refinement proved capable of estimating the FE tooth root bending stress of the ISO 6336 loading configuration with a better than 2% accuracy.
The fatigue strength at 3 × 10⁶ cycles was determined using a staircase procedure based on at least 15 tests with 0.05 kN load increments. The choice of 3 × 10⁶ cycles is compliant with the ISO6336 standard, which prescribes an endurance factor equal to one in the design formula for this fatigue life. The rationale for exploring the fatigue behaviour of P/M gears up to such a fatigue lifetime will be discussed below. The finite life fatigue regime was explored through 15–20 tests performed at different stress levels. The results were interpolated through least square fitting the Basquin law reported in Equation (2):
σ a · N f 1 m = C
where σa is the stress amplitude and Nf the number of cycles to failure. The uncertainty range was assumed to be constant for different fatigue lives and approximated by its centroid value. The ratio between the stress amplitude corresponding to 90% and 10% probability of failure was taken as a measure of the results scatter:
T σ , 10 : 90 = σ a , 90 σ a , 10
Optical inspections of the crack path and electron scanning microscopy (SEM) observations of the fracture surfaces complemented the material characterization. The former was conducted after sectioning the tooth along a plane orthogonal to the gear axis. The SEM observations were carried out to analyze the critical defect in terms of size, shape and location.
Microhardness HV0.5 profiles were measured at the gear tooth root sampling points along the direction of the maximum bending stress (viz. perpendicular to the tangent line inclined by 30° with respect to the radial direction). Each microhardness value was obtained by averaging the results of five indentation tests.

3. Results

3.1. Microstructure and Porosity

Table 3 and Table 4 lists the mean porosity values calculated according to ASTM B311 and the results of the image analysis measurements, respectively. The porosity has a non-homogeneous distribution in the gear volume, especially in the A85Mo05 variant, which exhibits the lowest total porosity among the three variants. However, in the vicinity of the tooth root, viz. the most stressed region during the fatigue tests, the three variants exhibit a similar porosity value of around 7%.
The microstructures of the three variants are illustrated in Figure 4. It can be noted that A85Mo05 (Figure 4a) is characterized by irregularly shaped pores, the microstructure is prevalently martensitic in the surface layer with a limited presence of bainite and retained austenite, whereas in the core, it consists of a mixture of lower bainite and martensite.
The DHP variant exhibits a more homogeneous pore distribution. The heterogeneous microstructure (Figure 4b) is composed of austenite (white areas), lower bainite (light grey areas) and martensite (dark grey areas). It appears that this microstructure is the result of the inhomogeneous distribution of the alloy elements in the diffusion bonded powders, and of the incomplete diffusion of Ni and Cu into the base powders (1.5% Mo Pre-alloyed iron) during sintering. The Ni-rich austenite is predominantly located around the pores [16]. The martensite is richer in Cu, whereas the base powder, which is poor in Ni and Cu, is mostly bainitic.
Similar to A85Mo05, the pores are irregularly distributed in the DDH variant. The microstructure (Figure 4c) is mainly martensitic in the surface layer with some traces of lower bainite, whereas the core microstructure consists mostly of upper bainite. Even in this case, the diffusion bonded Cu does not completely diffuse into the base pre-alloyed powders and the final microstructure is characterized by the inhomogeneous distribution of Cu, indeed Cu-rich areas are still present after sintering and assume a martensitic microstructure upon cooling.
Figure 5 illustrates the in-depth microhardness profiles measured in the three material variants. It can be noted that all the materials exhibit a surface layer with hardness higher than that of the core.
The A85Mo05 alloy received a case-hardening treatment, which is able to increase the microhardness of the outer layers significantly above that of the two material variants produced by sinter-hardening. Despite the low initial carbon content, these variants were able to harden thanks to the carbon pickup from the endogas atmosphere. In fact, at high temperature, carbon can rapidly diffuse into the pore network and then into the microstructure, thus favoring the martensitic transformation even though the resulting hardness increment is lower than that of the case-hardened A85Mo05 alloy. Interestingly, the depth of the hardened layer is about 0.5 mm in all three conditions. The two sinter-hardened conditions displayed a significantly larger dispersion of the microhardness value as a result of the more heterogeneous microstructure, wherein soft phases are interspersed in the martensitic or lower bainitic matrix.

3.2. Fatigue Curves and Fractographic Analyses

Figure 6a–c illustrates the fatigue data collected for A85Mo05, DHP, and DDH, respectively. The data were interpolated using Equation (2). The best-fit coefficients are listed in Table 5.
The fatigue strength data are comparable with those published in [11,12,28] for similar microstructures. Even though the porosity found here may differ from that measured in the abovementioned papers, it can be noted that the fatigue strength is not very sensitive to relative porosity, as long as it is higher than 90%. Conversely, below this limiting value, the decrease in fatigue resistance is very remarkable. Interestingly, the fatigue curves of all the explored material variants clearly show evidence of a knee, that is, a marked change in the slope of the SN curve at fatigue lives much shorter than 106 cycles—a fatigue behaviour typically exhibited by high-strength steels [29,30]. This outcome suggests that the choice of 3 × 10⁶ cycles as the survival lifetime of run-out specimens is adequate for characterizing the high-cycle fatigue behaviour of the investigated materials. Clearly, this evidence is not sufficient to assume infinite fatigue life at stress levels below such fatigue strength, therefore we strongly advise against extrapolating such fatigue data at very high fatigue lives, as also discussed in [31], whose exploration would require additional and time-consuming experiments.
The highest fatigue limit exhibited by the case-hardened A85Mo05 variant is consistent with the lowest porosity and highest microhardness found in Section 3.1. Unexpectedly, the fatigue strength of the DHP variant is higher than that displayed by DDH, even though the former shows similar microhardness and slightly higher relative porosity at the tooth root.
To shed light on these issues, fractographic analyses were carried out on fatigued teeth. The representative images are shown in Figure 7, Figure 8, Figure 9 and Figure 10 for the three material variants. The crack path typically displayed by A85Mo05 (Figure 7a) is characterized by little evidence of deflections induced by porosity, resulting in a fairly straight trajectory. Figure 7b shows a surface pore that probably triggered the crack initiation. In the same region, evidence of intergranular fracture can be attributed to grain boundary embrittlement due to cementite precipitation promoted by case hardening and the resulting carbon enrichment.
The trajectory typically followed by the critical fatigue crack in DHP (Figure 8a) and DHH (Figure 9a) conditions seems to be more influenced by the presence of pores. Accordingly, the crack path tends to interconnect such pores resulting in a very serrated geometric configuration. A concomitant effect of the microstructure heterogeneity cannot be excluded as will be discussed below. SEM inspections of the fracture surfaces of both material variants (Figure 8b and Figure 9b) attested to cracks nucleated preferentially in the vicinity of surface pores with very articulated morphology. In addition, such inspections revealed that fatigue damage is not localized in a single critical crack but proceeds in a much more diffused fashion through multiple crack initiation followed by crack coalescence.
This scenario is further confirmed by SEM examinations of small cracks nucleated at pores in the immediate neighborhood of the tooth surface (Figure 10a,b for DDH and DHP, respectively). While the first stage of fatigue damage consists of multiple crack initiation and coalescence to form the main crack, the cracks not involved in this process, such as those shown in Figure 10 stop growing and become non-propagating. This observation agrees with those reported elsewhere in the technical literature [5,8,12,13].

4. Discussion

From the above discussion, it is clear that the fatigue damage mechanism is triggered by the most critical pore. For this reason, the Murakami fatigue model expressed by Equation (1) seems to offer an appealing interpretation tool for the fatigue results collected so far. However, this fatigue model was devised by Murakami [24] to predict the fatigue strength of steels and cast irons, whose fatigue behaviour is dictated by isolated defects with an approximately rounded shape, for instance in the form of hard inclusions [29] or shrinkage microporosity [32]. Conversely, in the present case, the critical defect is, in most cases, represented by a cluster of near-surface pores, whose spatial arrangement is 3D rather than 2D, and whose jagged shape likely results in a stress intensity factor much more severe than that predicted by the a r e a formula. For this reason, we propose in the present paper, to estimate the critical defect size to be incorporated into Equation (1) by: (i) using SEM fractographic images, which are much more effective to describe the 3D geometry of the pore cluster with respect to the conventional metallographic section, and (ii) estimating the defect area considering the convex contour that circumscribes the real defect area. In a first simplified attempt to estimate such a geometrical parameter, the critical defect size is assumed to be the area of the circle having a diameter equal to the maximum Feret diameter of the pore cluster, as schematically illustrated in Figure 11. Accordingly, the circular shape satisfies the condition of a convex boundary and the Feret diameter is a geometrical parameter that can be easily calculated by common image analysis software.
Beside the size of the critical defect, the other key parameter controlling the fatigue strength as expressed by Equation (1) is the microhardness. As shown in Figure 4 and discussed in Section 3, the microstructure of the material variants is highly non-homogeneous. Therefore, we expect large fluctuations in the local values of microhardness, resulting in large dispersion bands in the microhardness profiles plotted in Figure 5. For this reason, we followed two approaches in incorporating the microhardness value into Equation (1): either (i) considering the average value measured in the surface layer where crack initiation occurs, or (ii) considering the hardness of the softest microstructural constituent found in the vicinity of the critical defect. The results of these two approaches are summarized in Table 6 and Table 7, respectively.
Comparing Table 6 and Table 7, it can be noted that a significant improvement in the estimation of the fatigue strength is achieved by incorporating the local hardness into Equation (1). This result emphasizes, even considering the approximations introduced for the evaluation of the critical defect size, the crucial role played by the microstructure in the vicinity of the critical pores. From another point of view, it can be noted that the critical crack spends most of the fatigue life nucleating and propagating through the microstructural phases enveloping the pores.
To conclude, it is worth advancing a plausible explanation of the different errors obtained for the three variants. The overestimation in the fatigue strength of the A85Mo05 variant can be attributed to the fact that the grain boundary embrittlement occurring in the case-hardened layer is not considered by the Murakami fatigue model. On the contrary, such a model tends to underestimate the fatigue strength of the sinter-hardened DHP material, characterized by soft retained austenite enveloping the critical pores. Its negative effect on the fatigue strength may be at least partially attenuated by stress-induced transformation into harder martensite. In addition, the resulting local volumetric increment produces crack closure that is able to slow down or even arrest the fatigue crack propagation. Further investigations are required to support these hypotheses.

5. Conclusions

The present paper investigated the tooth root bending fatigue strength of high-density P/M gears produced from high strength pre-alloyed powders. The key conclusions that can be drawn from this study are as follows:
  • The fatigue curves of all explored material variants show evidence of a knee at fatigue lives well shorter than 106 cycles. This outcome suggests that the choice of 3 × 10⁶ cycles as the survival lifetime of run-out specimens is adequate for characterizing the high-cycle fatigue behaviour of the investigated materials. Nevertheless, the fatigue strength at 3 × 10⁶ cycles does not represent the fatigue limit of the material, but highlights the significant change in the slope of the S-N curve. Additional tests at longer fatigue lives are required to confirm the existence of a material fatigue limit.
  • The main fatigue crack seems to be the result of the coalescence of multiple cracks nucleated in the vicinity of the most stressed and largest pores.
  • The fatigue strength is the result of a complex interplay between porosity and microstructure; the former factor essentially depends on the size and shape of the critical pore leading to crack initiation, the latter is related to the microhardness of the softest microstructural constituent surrounding the critical defect.
  • SEM fractographic inspections are more suitable for identifying the critical defect than conventional metallographic sections. In fact, the size of the defect detected in this way is a more faithful representation of the concept of a defect surface projected on the critical plane, as required by the Murakami model. In addition, fatigue strength data are better rationalized by this fatigue model if the defect size is computed from the maximum Feret diameter, which identifies the circumference inscribing the serrated perimeter of the pore.

Author Contributions

V.F. contributed to the experimental investigation, writing and supervision, A.M. supervised the research and contributed to the discussion, W.P. followed all the production steps, M.M. carried out the Finite Element analysis, M.B. contributed to fatigue testing, formal analysis and writing.

Funding

This research received no external funding.

Acknowledgments

Pietro Valcozzena is kindly acknowledged for his helpful technical support.

Conflicts of Interest

The authors declare no conflict of interest.

References

  1. Flodin, A. Powder Metal Gear Technology: A Review of the State of the Art. Power Trans. Eng. 2016, 38–43. Available online: https://www.powertransmission.com/issues/0316/art.pdf (accessed on 23 May 2019).
  2. D’Armas, H.; Llanes, L.; Penafel, J.; Bas, J.; Anglada, M. Tempering effects on the tensile response and fatigue life behavior of a sinter-hardened steel. Mater. Sci. Eng. A 2000, 277, 291–296. [Google Scholar] [CrossRef]
  3. Chagnon, F. Effect of sintering temperature on static and dynamic properties of sinter hardened PM steels. Int. J. Powder Metall. 2010, 46, 31–42. [Google Scholar]
  4. Straffelini, G.; Molinari, A. Dry sliding wear of ferrous PM materials. Powder Metall. 2001, 44, 248–252. [Google Scholar] [CrossRef]
  5. Lindholm, P.; Sosa, M.; Olofsson, U. The effect of elasticity in powder metal gears on tooth loading and mean coefficient of friction. Proc. Inst. Mech. Eng. Part C J. Mech. Eng. Sci. 2018, 232, 2023–2031. [Google Scholar] [CrossRef]
  6. Yamanaka, M.; Matsushima, Y.; Miwa, S.; Narita, Y.; Inoue, K.; Kawasaki, Y. Comparison of bending fatigue strength among spur gears manufactured by various methods. J. Adv. Mech. Des. Syst. Manuf. 2010, 4, 480–491. [Google Scholar] [CrossRef]
  7. Dizdar, S. Pitting resistance of sintered small-module gears. Proc. Inst. Mech. Eng. Part J: J. Eng. Tribol. 2013, 227, 1225–1240. [Google Scholar] [CrossRef]
  8. Dhanasekaran, S.; Gnanamoorthy, R. Gear tooth wear in sintered spur gears under dry running conditions. Wear 2008, 265, 81–87. [Google Scholar] [CrossRef]
  9. Dizdar, S. High performance sintered steel gears for use in transmissions and machinery—A critical review. In Proceedings of the International Conference on Gears 2010, Munich, Germany, 4–6 October 2010. [Google Scholar]
  10. Sonsino, C.M.; Schlieper, G.; Tengzelius, J. Influence of as-sintered material strength on the improvement of fatigue behaviour by surface rolling. In Proceedings of the International Conference on Powder Metallurgy 1990, London, UK, 2–6 July 1990. [Google Scholar]
  11. Forden, L.; Bengtsson, S.; Bergstrom, M. Comparison of high performance PM gears manufactured by conventional and warm compaction and surface densification. Powder Metall. 2005, 48, 10–12. [Google Scholar] [CrossRef]
  12. Dizdar, S.; Johansson, P. PM materials for gear applications. In Proceedings of the EURO PM2007, Toulouse, France, 15–17 October 2007. [Google Scholar]
  13. Bengtsson, S.; Fordén, L.; Dizdar, S.; Johansson, P. Surface densified P/M transmission gear. In Proceedings of the International Conference on Power Transmission Components, Advances in High Performance Powder Metallurgy Applications, Ypsilanti, MI, USA, 16–17 October 2001. [Google Scholar]
  14. Jones, P.K.; Buckley-Golder, K.; Sarafinchan, D. Developing P/M gear tooth and bearing surfaces for high stress applications. Adv. Powder Metall. Part. Mater. 1997, 1, 33–43. [Google Scholar]
  15. James, W.B. What is sinter-hardening? In Proceedings of the International Conference on Powder Metallurgy & Particulate Materials, Las Vegas, NV, USA, 31 May–4 June 1998. [Google Scholar]
  16. Bernier, F.; Plamondon, P.; Bailon, J.-P.; L’Esperance, G. Microstructural characterization of nickel rich areas and their influence on endurance limit of sintered steel. Powder Metall. 2011, 54, 559–565. [Google Scholar] [CrossRef]
  17. Deng, X.; Piotrowski, G.; Chawla, N.; Narasimhan, K.S. Fatigue crack growth behavior of hybrid and prealloyed sintered steels Part II. Fatigue behavior. Mater. Sci. Eng. A 2008, 491, 28–38. [Google Scholar] [CrossRef]
  18. Danninger, H.; Weiss, B. High cycle fatigue of powder metallurgy materials. In Proceedings of the VIII Congreso Nacional de Propiedades Mecanicas de Solidos, Gandia, Spain, 25–28 June 2002; pp. 195–204. [Google Scholar]
  19. Straffelini, G.; Benedetti, M.; Fontanari, V. Damage evolution in sinter-hardening powder-metallurgy steels during tensile and fatigue loading. Mater. Des. 2014, 61, 101–108. [Google Scholar] [CrossRef]
  20. Kabatova, M.; Dudrova, E.; Wronski, A.S. Microcrack nucleation, growth, coalescence and propagation in the fatigue failure of a powder metallurgy steel. Fatigue Fract. Eng. Mater. Struct. 2009, 32, 214–222. [Google Scholar] [CrossRef]
  21. Khorsand, H.; Habibi, S.M.; Janghorban, J.; Yoozbashizade, H.; Reihani, S.M.S. Fatigue of sintered steels (Fe-1.5Mo-3Mn-0.7C). Mater. Struct. 2004, 37, 335–341. [Google Scholar]
  22. Bergmark, A. Influence of maximum pore size on the fatigue performance of PM steel. Powder Metall. Progress 2005, 5, 131–137. [Google Scholar]
  23. Andersson, M. The role of porosity in fatigue of PM materials. Powder Metall. Progress 2011, 11, 21–31. [Google Scholar]
  24. Murakami, Y. Metal Fatigue: Effects of Small Defects and Nonmetallic Inclusions; Elsevier: Oxford, UK, 2002. [Google Scholar]
  25. Benedetti, M.; Fontanari, V.; Bandini, M.; Zanini, F.; Carmignato, S. Low- and high-cycle fatigue resistance of Ti-6Al-4V ELI additively manufactured via selective laser melting: Mean stress and defect sensitivity. Int. J. Fatigue 2018, 107, 96–109. [Google Scholar] [CrossRef]
  26. Benedetti, M.; Fontanari, V.; Molinari, A.; Valcozzena, P.; Pahl, W. The role of pores and microstructural heterogeneity on the tooth root fatigue strength of sintered spur gears. In MATEC Web of Conferences; EDP Sciences: Les Ulis, France, 2018. [Google Scholar]
  27. Dlapka, M.; Danninger, H.; Gierl, C.; Lindqvist, B. Defining the pores in PM components. Metal Powder Rep. 2010, 65, 30–33. [Google Scholar] [CrossRef]
  28. Benedetti, M.; Menapace, C. Tooth root bending fatigue strength of small-module sinter-hardened spur gears. Powder Metall. 2017, 60, 149–156. [Google Scholar] [CrossRef]
  29. Benedetti, M.; Fontanari, V.; Barozzi, M.; Gabellone, D.; Tedesco, M.M.; Plano, S. Low and high-cycle fatigue properties of an ultrahigh-strength TRIP bainitic steel. Fatigue Fract. Eng. Mater. Struct. 2017, 40, 1459–1471. [Google Scholar] [CrossRef]
  30. Santus, C.; Taylor, D.; Benedetti, M. Experimental determination and sensitivity analysis of the fatigue critical distance obtained with rounded V-notched specimens. Int. J. Fatigue 2018, 113, 113–125. [Google Scholar] [CrossRef]
  31. Danninger, H.; Sohar, C.; Xu, C.; Weiss, B.; Betswar-Kotas, A.; Khatibi, G. Fatigue behaviour of different types of PM steels in the gigacycle range. In Proceedings of the 2014 International Conference on Powder Metallurgy & Particulate Materials, Advances in Powder Metallurgy and Particulate Materials, Orlando, FL, USA, 18–22 May 2014; pp. 10113–10129. [Google Scholar]
  32. Benedetti, M.; Fontanari, V.; Lusuardi, D. Effect of graphite morphology on the fatigue and fracture resistance of ferritic ductile cast iron. Eng. Fract. Mech. 2019, 206, 427–441. [Google Scholar] [CrossRef]
Figure 1. Geometry of the powder metallurgy (P/M) small-module spur gears. Image taken from [26].
Metals 09 00599 g001
Figure 2. Tooth bending fatigue testing configuration. Detail of the anvils and the gear under testing. Image taken from [26].
Metals 09 00599 g002
Figure 3. Sub-model of the finite element (FE) analyses carried out to estimate the tooth root bending stress. The applied loads are represented by the red arrows. Image taken from [26].
Metals 09 00599 g003
Figure 4. Microstructure of the investigated material variants. (a) case-hardened A85Mo05, (b) sinter-hardened DHP, (c) sinter-hardened DDH.
Metals 09 00599 g004
Figure 5. Microhardness profiles measured at the gear tooth root. Each point represents the average of five measurements.
Metals 09 00599 g005
Figure 6. Results of the fatigue tests. (a) Case-hardened A85Mo05, (b) sinter-hardened DHP, (c) sinter-hardened DDH. The run-out samples are indicated by arrows.
Metals 09 00599 g006
Figure 7. Fractographic inspections of A85Mo05: (a) crack path (LOM), (b) crack initiation site (SEM).
Metals 09 00599 g007
Figure 8. Fractographic inspections of DHP: (a) crack path (SEM), (b) crack initiation site (SEM).
Metals 09 00599 g008
Figure 9. Fractographic inspections of DDH: (a) crack path (SEM), (b) crack initiation site (SEM).
Metals 09 00599 g009
Figure 10. Non-propagating cracks found by SEM inspection in the DDH variant. (a) Cluster of pores interconnected by the crack, (b) single pore.
Metals 09 00599 g010
Figure 11. Sketch illustrating the procedure for evaluating the characteristic dimensions of the pore, defined by the maximum Feret diameter. Image taken from [26].
Metals 09 00599 g011
Table 1. Main geometrical data for the investigated small-module spur gears.
ParameterValue
Normal module (mm)0.71
Number of teeth20
Pressure angle (°)20
Pitch diameter (mm)14.2
Outside diameter (mm)15.8
Root diameter (mm)12.4
Gear thickness (mm)5.37
Table 2. Nominal compositions of the powders. Table taken from [26].
Powder LabelComposition (wt%)Powder TypeCarbon Content (wt%)
A85Mo050.85 Mo, Fe bal.pre-alloyed0.25
DHP1.5 Mo, 2.0 Cu, 4.0 Ni, Fe baldiffusion bonded0.15
DDH1.5 Mo, 2.0 Cu, Fe baldiffusion bonded0.15
Table 3. Mean density, total porosity and open porosity following ASTM B311. Table taken from [26].
QuantityA85Mo05DHPDDH
Density (g cm−3)7.557.357.41
Total porosity (%)4.097.566.36
Open porosity (%)0.601.390.96
Table 4. Mean porosity values in different regions of the gear measured using image analysis on metallographic sections. Table taken from [26].
Porosity %A85Mo05DHPDDH
Tooth body7.138.857.63
Tooth root 6.297.996.20
Gear body3.047.154.17
Table 5. Best-fit coefficients of the fatigue curves (Equation (2)).
- σ a , 3 · 10 6 @ 50% (MPa) T σ , 10 : 90 C (MPa)m
A85Mo053211.4231635.90
DHP3071.2628585.71
DDH2621.5938465.00
Table 6. Fatigue strength estimated with the Murakami model considering the average microhardness. Table taken from [26].
VariantHV (Mean) a r e a   ( m ) σW (MPa)σa (MPa)Err (%)
A85Mo05873111524321+63
DHP744152437307+42
DDH758136452262+73
σW: high-cycle fatigue strength predicted by Equation (1); σa: experimental fatigue limit @ 3 × 10⁶ cycles.
Table 7. Fatigue strength estimated with the Murakami model considering the microhardness of the softest microstructural constituent. Table taken from [26].
VariantHV (Local) a r e a   ( m ) σW (MPa)σa (MPa)Err (%)
A85Mo05515111345321+7
DHP325152233307−24
DDH378136264262+1
σW: high-cycle fatigue strength predicted by Equation (1); σa: experimental fatigue limit @ 3 × 10⁶ cycles.

