Article

Effects of Nb Content on the Mechanical Alloying Behavior and Sintered Microstructure of Mo-Nb-Si-B Alloys

State Key Laboratory of Solidification Processing, Northwestern Polytechnical University, Xi’an 710072, China
*
Author to whom correspondence should be addressed.
Metals 2019, 9(6), 653; https://doi.org/10.3390/met9060653
Submission received: 7 May 2019 / Revised: 28 May 2019 / Accepted: 1 June 2019 / Published: 4 June 2019

Abstract

:
Different from conventional Mo-Si-B-based alloys consisting of Moss, Mo3Si, and Mo5SiB2, Mo3Si-free Mo-Si-B-based alloys (Moss+Mo5Si3+Mo5SiB2 or Moss+Mo5SiB2) show great potentials for more excellent oxidation resistance and elevated temperature strength. In the present work, alloying element Nb was added to Mo-12Si-10B (at.%)-based alloy to suppress the formation of the Mo3Si phase. Mo-12Si-10B-xNb (x = 10, 20, 22, 24, 26, 28, 30, and 40) bulk alloys were fabricated using mechanical alloying followed by cold pressing and then sintering at 1773 K for 2 h. Effects of Nb content on the mechanical alloying behavior and then sintered microstructure were studied. The addition of Nb with an amount less than 30 at.% accelerated the mechanical alloying process, but 40 at.% Nb addition decreased the process due to excessive cold welding and high powder volume. For the sintered bulk alloy prepared from the mechanically alloyed powders milled for 30 h, a critical Nb content between 24 and 26 at.% was found to suppress Mo3Si production and γNb5Si3 phase formed in the alloys with the addition of Nb content more than 26 at.%. Prolongation of a prior milling process could facilitate the suppression of Mo3Si and delay the formation of niobium silicides.

1. Introduction

Mo-Si-B alloys, as promising ultrahigh temperature structural materials, have drawn much attention in the past few decades. A typical Mo-Si-B alloy is comprised of a Mo solid solution (Moss), and Mo3Si (A15) and Mo5SiB2 (T2) phases [1,2]. As the most Mo-rich molybdenum silicide, the Mo3Si phase shows poor oxidation resistance due to its low Si content and marginal B solubility [3,4,5,6]. Besides, the much higher dislocation density in Mo3Si than those in Mo5Si3 (T1) and Mo5SiB2 in elevated temperature compressive creep tests [7,8] indicates that the ultrahigh-temperature strength of Mo3Si is not satisfactory. As a result, suppression of Mo3Si product in a Moss-toughening Mo-Si-B-based alloy may result in better oxidation resistance and elevated temperature strength. As shown in References [9,10], sufficient dissolution of Nb, W, and Ta in Mo3Si can lead to its destabilization. As a lighter element compared with Mo, alloying with Nb can lower the density of a Mo-Si-B alloy, which shows greater attraction than W and Ta alloying. Unfortunately, formation of porous and non-volatile Nb2O5 during oxidation delays the formation of a protective borosilicate, which is therefore detrimental to the oxidation resistance of a Mo-Si-B alloy. As a result, determination of the critical Nb content for suppressing Mo3Si in a Mo-Nb-Si-B alloy rather than excessive addition of Nb shows great importance. However, as far as the authors know, the previous works mainly focus on the stability of Mo3Si in a Mo-Nb-Si system theoretically [11] or experimentally [9]. Takata et al. [12] studied the microstructural development of several Mo-Nb-Si-B alloys with the composition of Mo-32.6Nb-xSi-yB (at.%, hereafter all compositions are given in at.% unless otherwise stated) fabricated using an arc cast and directional solidification. A Moss+T1+T2 microstructure was achieved successfully. However, determined by their solidification paths, a large size T2 primary phase is inevitable in these alloys prepared via a smelting process [13,14]. The formation of this large size T2 primary phase is certainly detrimental to the fracture toughness of the alloys. Mechanical alloying (MA) followed by a sintering process facilitates the fabrication of Mo-Si-B based alloy with a continuous Moss matrix [15,16,17]. Byun et al. [18] fabricated Mo-16.9Nb-3Si-1B (wt.%) alloys using a powder metallurgical method. In their research, the Nb-containing alloy showed lower hardness (425 vs. 590 Hv) and higher fracture toughness (14.5 vs. 12.6 MPa·m1/2) than those of a Nb-free alloy. It is worth noting that this Nb content is not enough to destabilize Mo3Si and the alloy still consists of Moss, Mo3Si, and Mo5SiB2. In order to suppress the Mo3Si phase, plenty of added Nb is necessary, which will certainly affect the MA behavior of Mo-Nb-Si-B powder mixtures. Different from the solidification process, the constituent elements in the sintering process show a lower diffusion ability. As a result, the distribution of elemental Nb in different phases in the sintered alloys may be different from that in the solidified alloys, which will affect the alloy phase constituents and the critical content of Nb addition for suppressing the Mo3Si phase. Besides, the prior MA degree of powder mixtures can also affect the microstructure of the sintered alloy. Therefore, the present article will focus on the effects of Nb content on the MA behavior and sintered microstructure of quaternary Mo-Nb-Si-B alloys to lay the foundation for fabricating Mo3Si-free alloys using powder metallurgy.

2. Materials and Methods

Powder mixtures of elements Mo and Nb (Zhuzhou Cemented Carbide Group Co. Ltd., Zhuzhou, China), and Si and amorphous B (Sinopharm Chemical Reagent Co. Ltd., Shanghai, China), with a purity of 99% or better were weighed according to Mo-12Si-10B-xNb (abbreviated as xNb, x = 10, 20, 22, 24, 26, 28, 30, and 40). The mesh sizes of Mo, Nb, Si, and B powder particles were −300/+600 (23–48 μm), −300/+600 (23–48 μm), −200/+400 (38–75 μm) and −800/+1000 (13–18 μm), respectively. MA processes were conducted in a planetary ball milling machine (QM-1SP4-CL, Nanjing Nanda Instrument Plant, Nanjing, China) under an Ar atmosphere using hardened stainless steel vials and balls. For all cases, the milling speed and ball to powder ratio were fixed at 400 rpm and 15:1, respectively. Milling time was set to be 10, 30, 50, and 80 h respectively. Milled powders with a mass about 2 g were cold pressed into thin disks (12 mm in diameter) at a pressure of about 500 MPa and a dwell time of about 60 s using a cold press machine (YLJ-24T-SJ, Hefei Kejing Materials Technology Co. Ltd., Hefei, China). Sintering of these thin disks was carried out in an argon atmosphere furnace (HVHS-II, Shenyang Jinyan New Material preparation Technology Co.Ltd., Shenyang, China) at 1773 K for 2 h. Details of processing conditions and abbreviated names of products are given in Table 1.
X-ray diffraction analysis (XRD, Panalytical X’Pert PRO, Malvern Panalytical, Almelo, The Netherlands) was used to characterize the phase constituents with a Cu target (λKα1 = 0.154 nm). For accurate XRD analyses, the sintered samples were ground to powders after grinding their surface. The Williamson–Hall formula was used to calculate the coherently scattering domain size (domain size) and microstrain. Cohen methods were used to calculate the lattice parameter. Microstructural and compositional analyses were performed by using a scanning electron microscope (SEM, Tescan Mira3, Tescan Company, Brno, Czech Republic) equipped with an energy-dispersive X-ray spectrum analyzer (EDS, Inca X-sight, Oxford Instruments, Oxford, England). To observe their cross-sectional microstructures, milled powder particles and sintered samples were mounted in epoxy, mechanically ground, and then polished. Image-Pro Plus software 6.0 (IPP, Media Cybernetics Inc., Rockville, MD, USA) was applied for the statistical analyses.

3. Results and Discussion

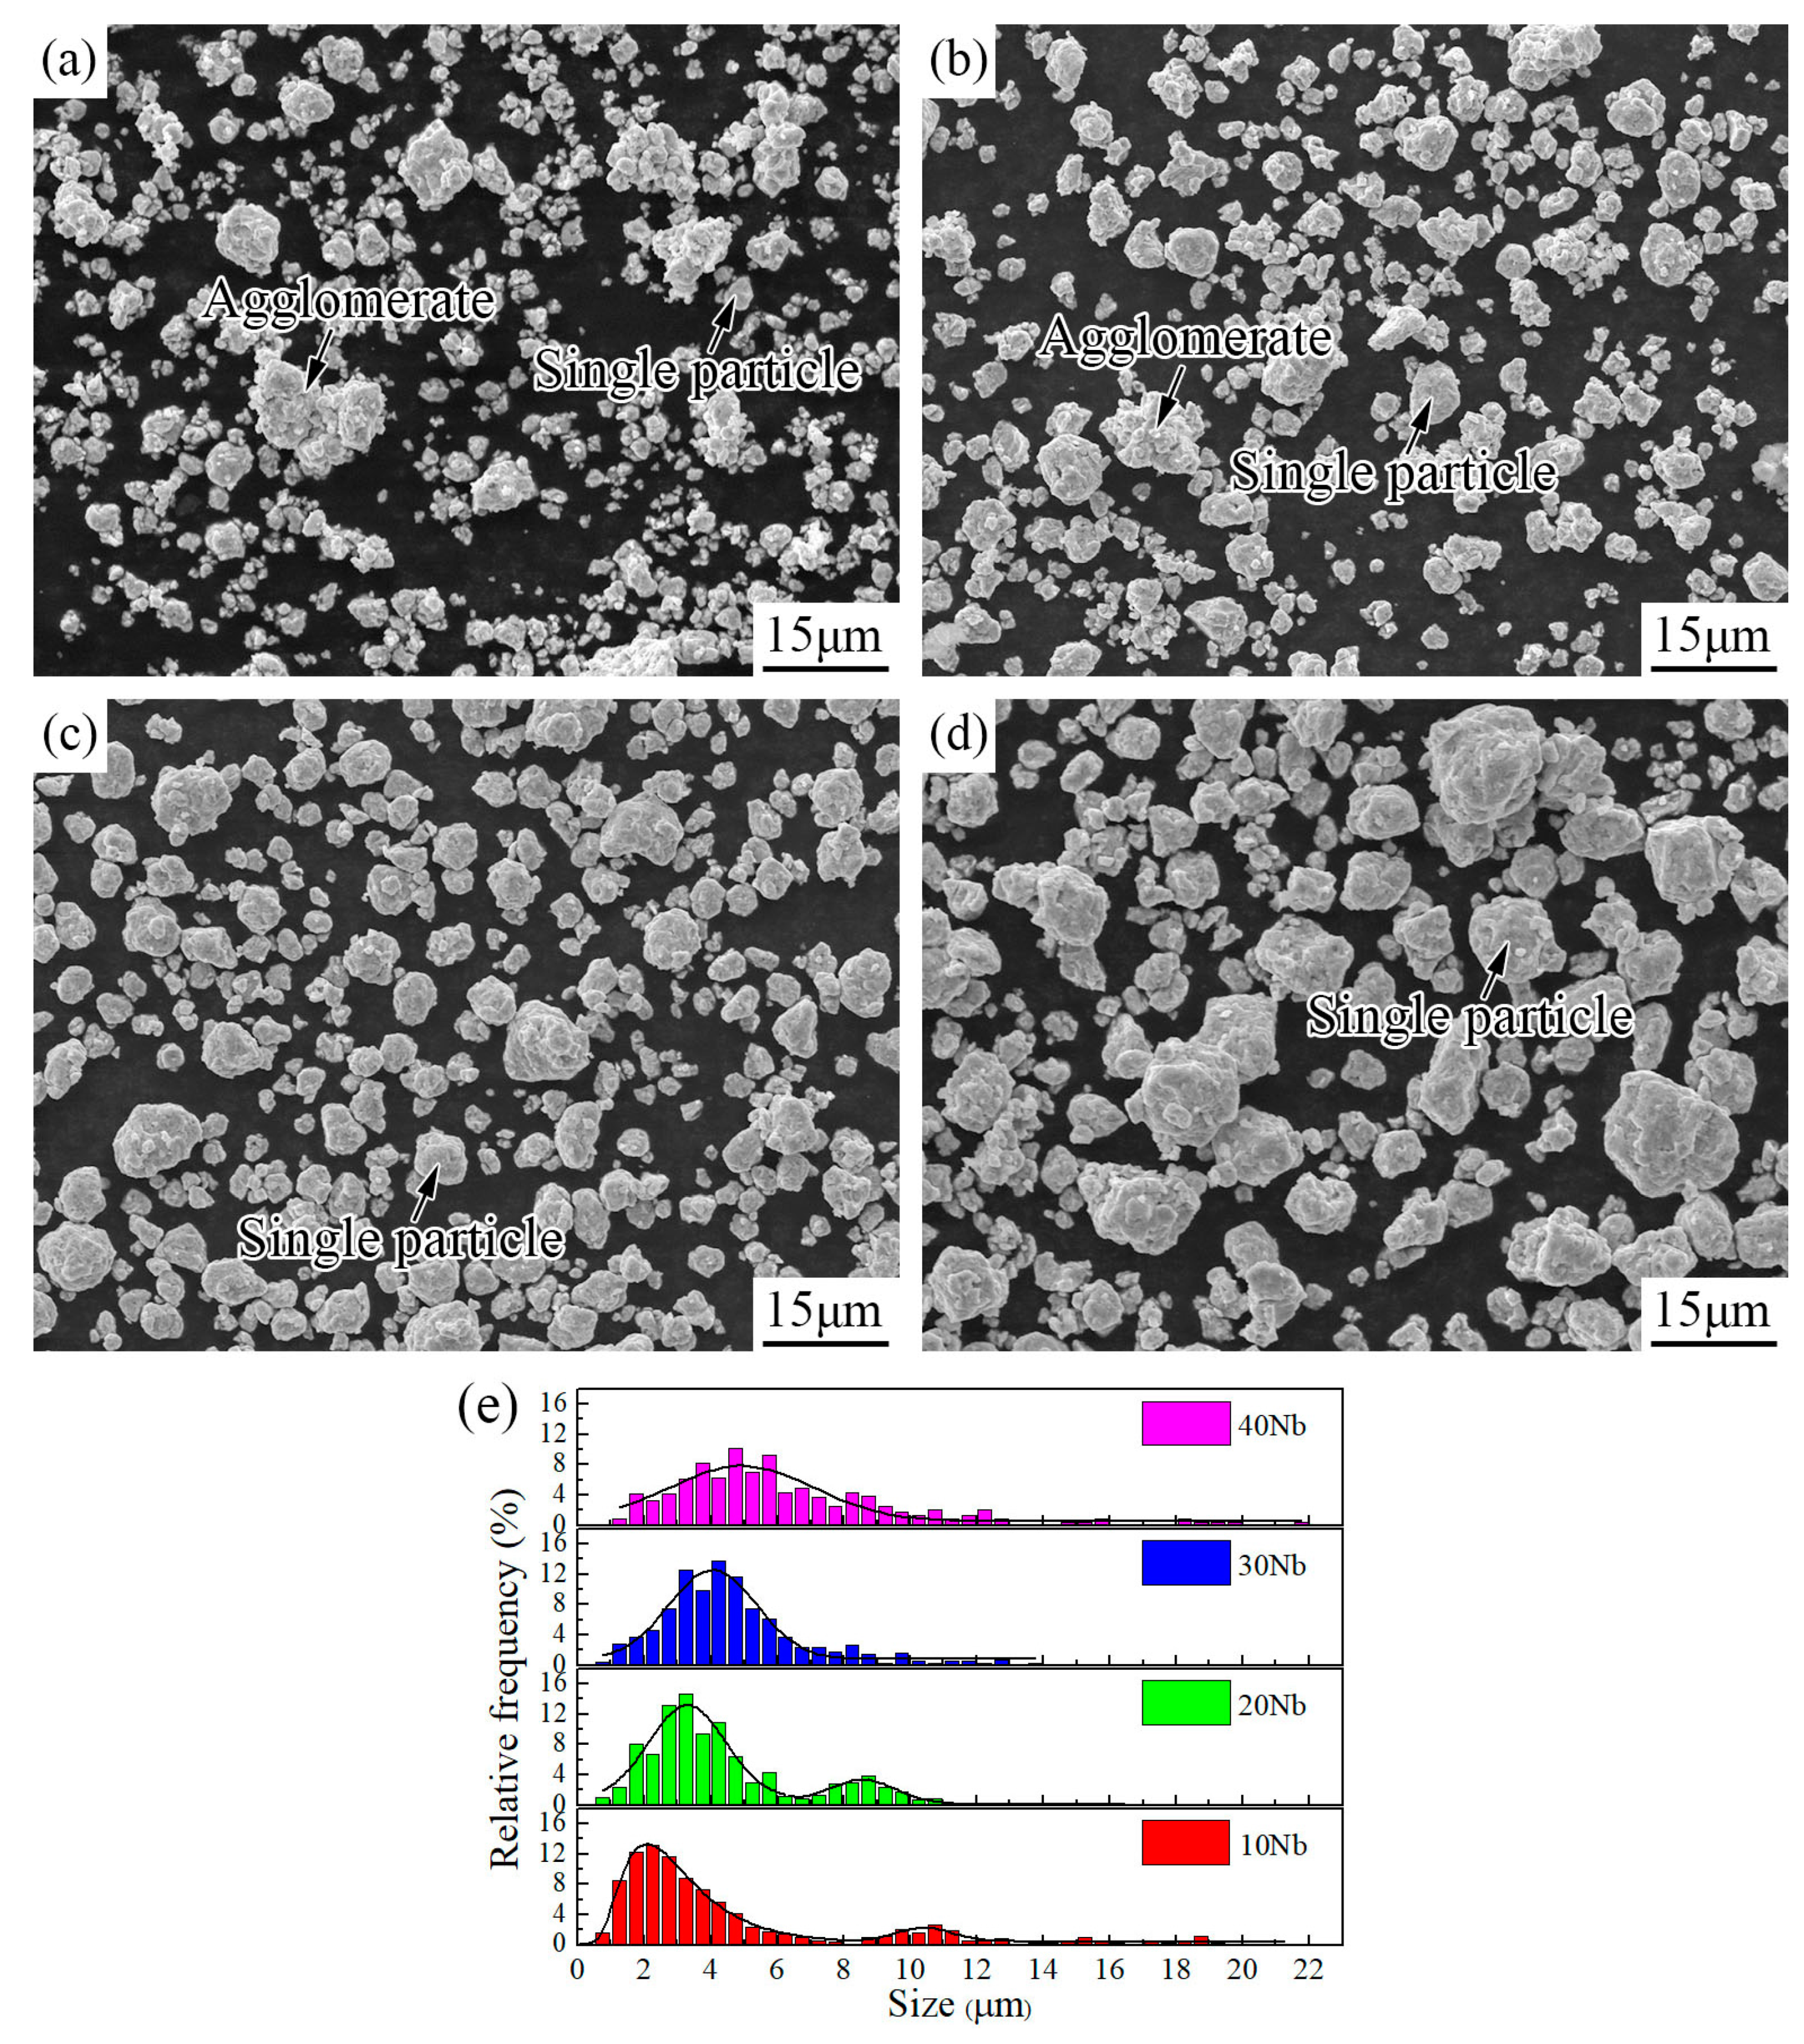
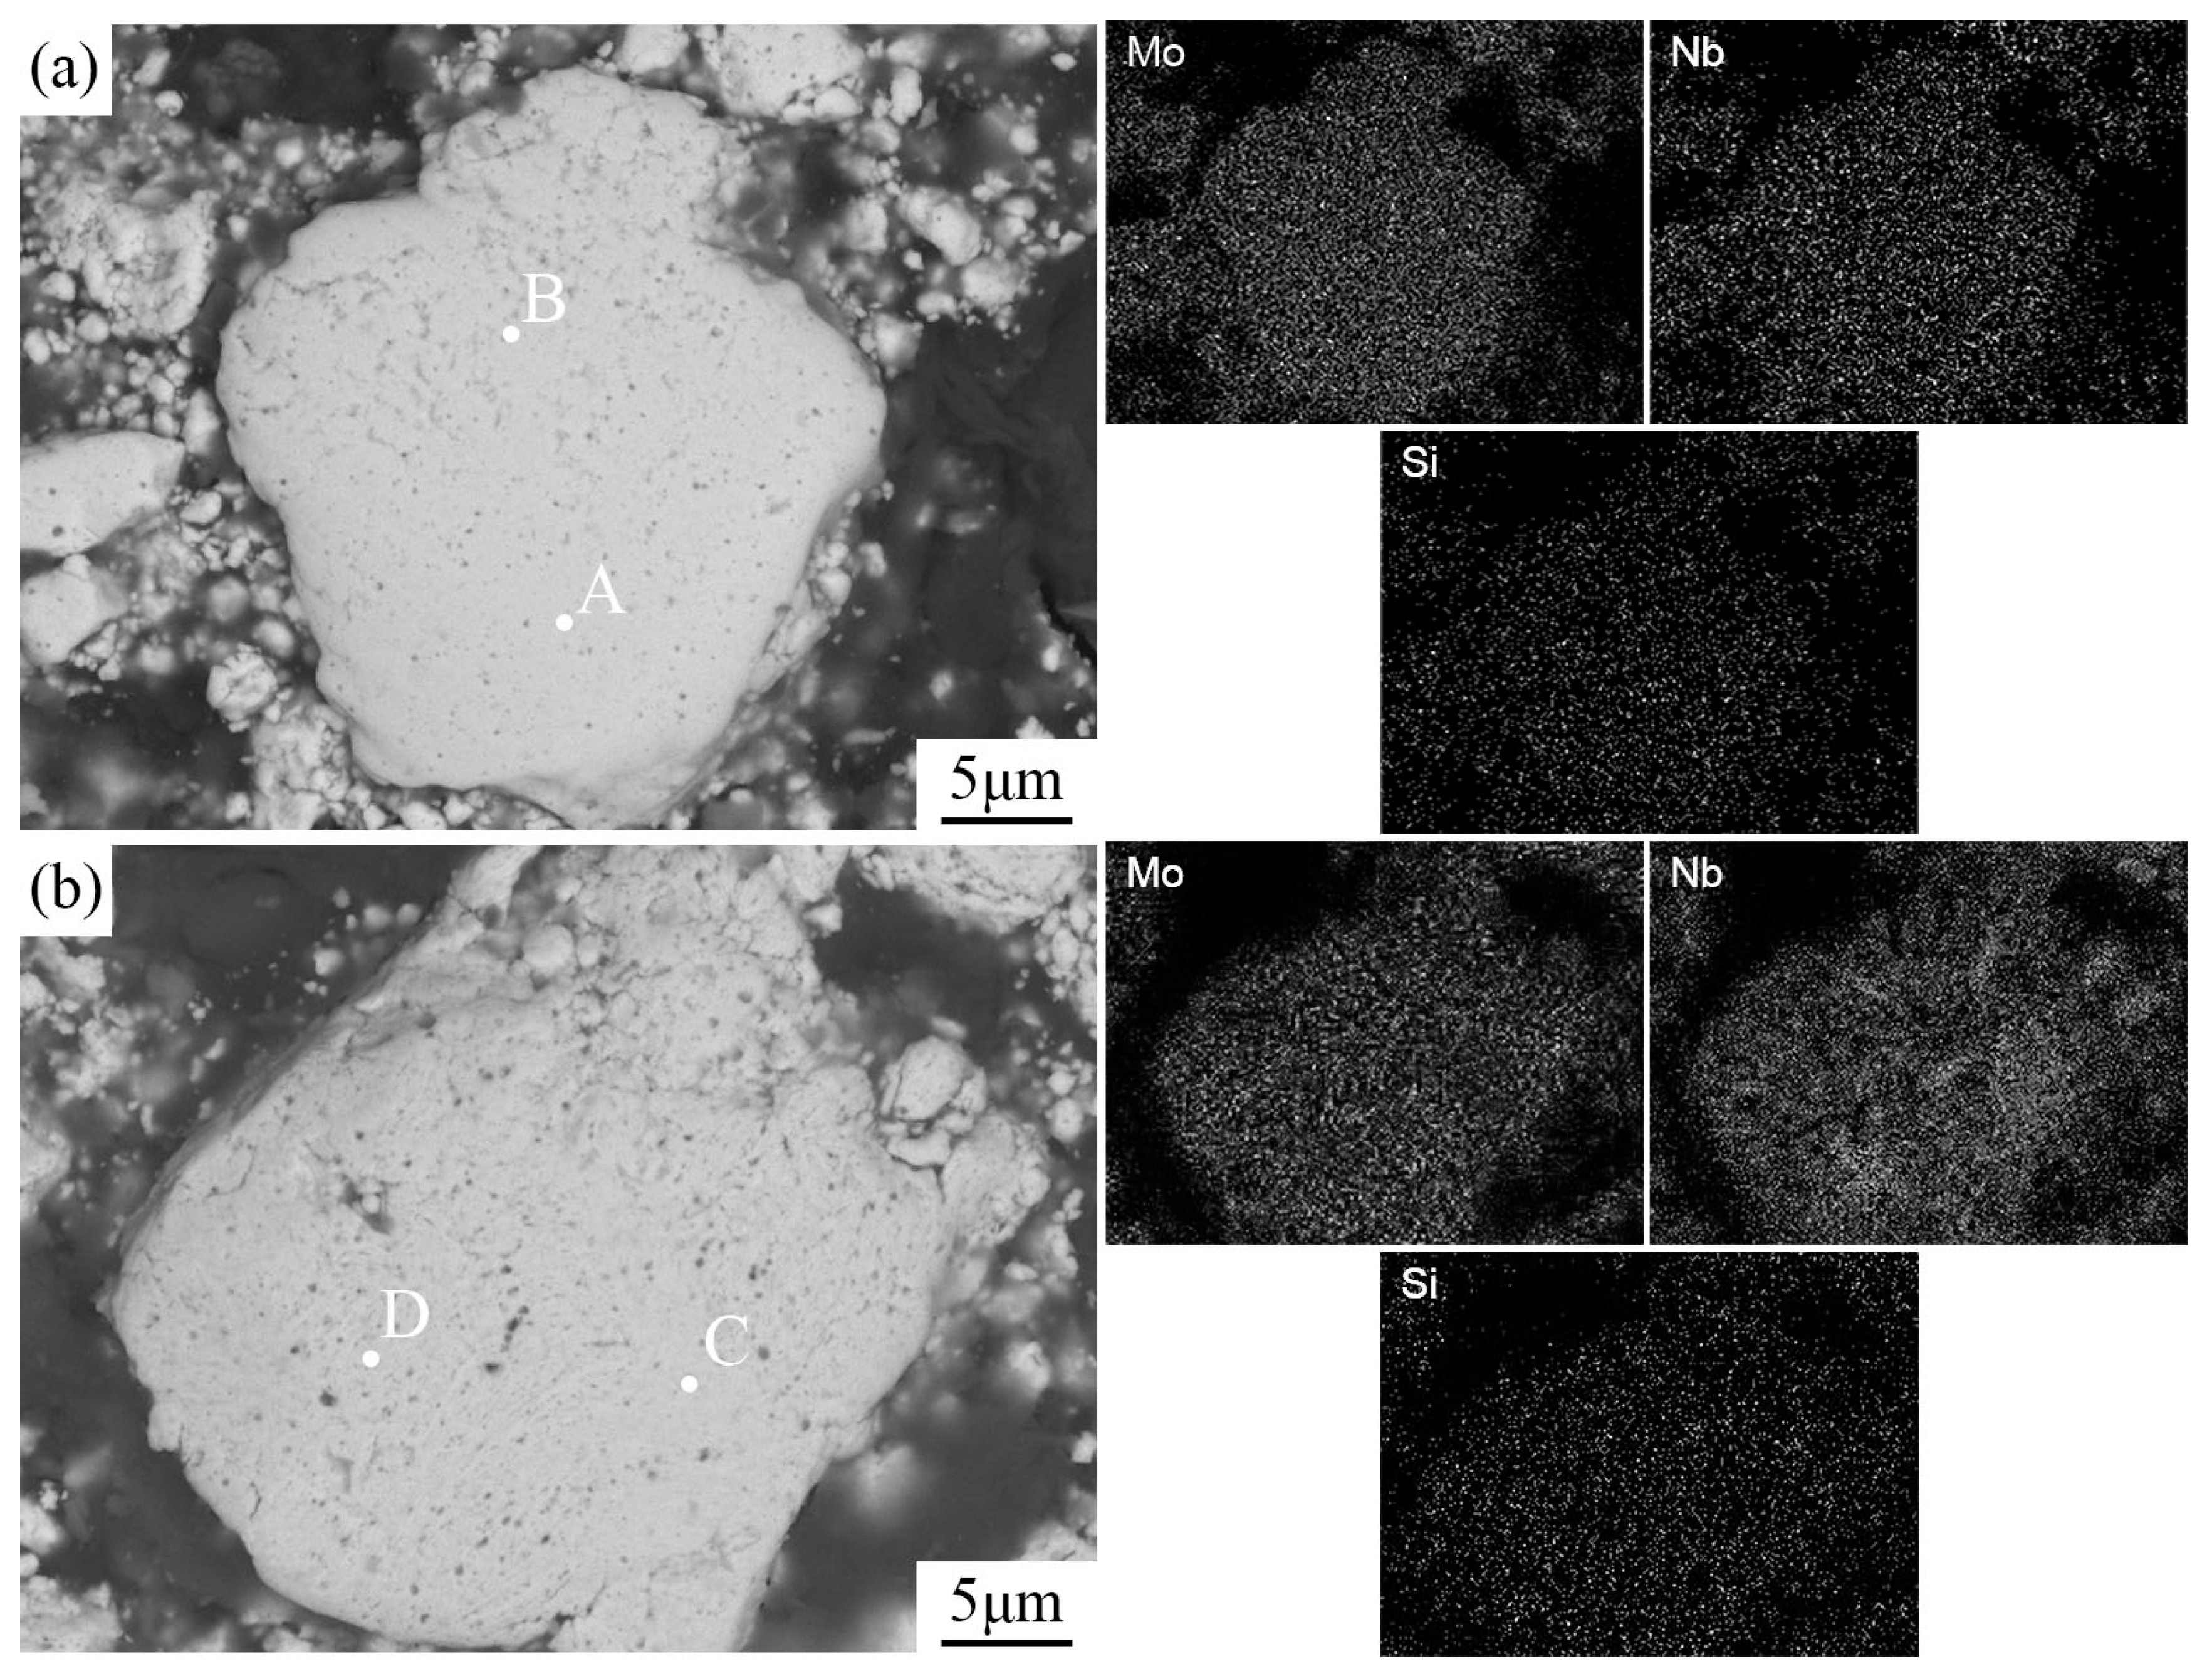
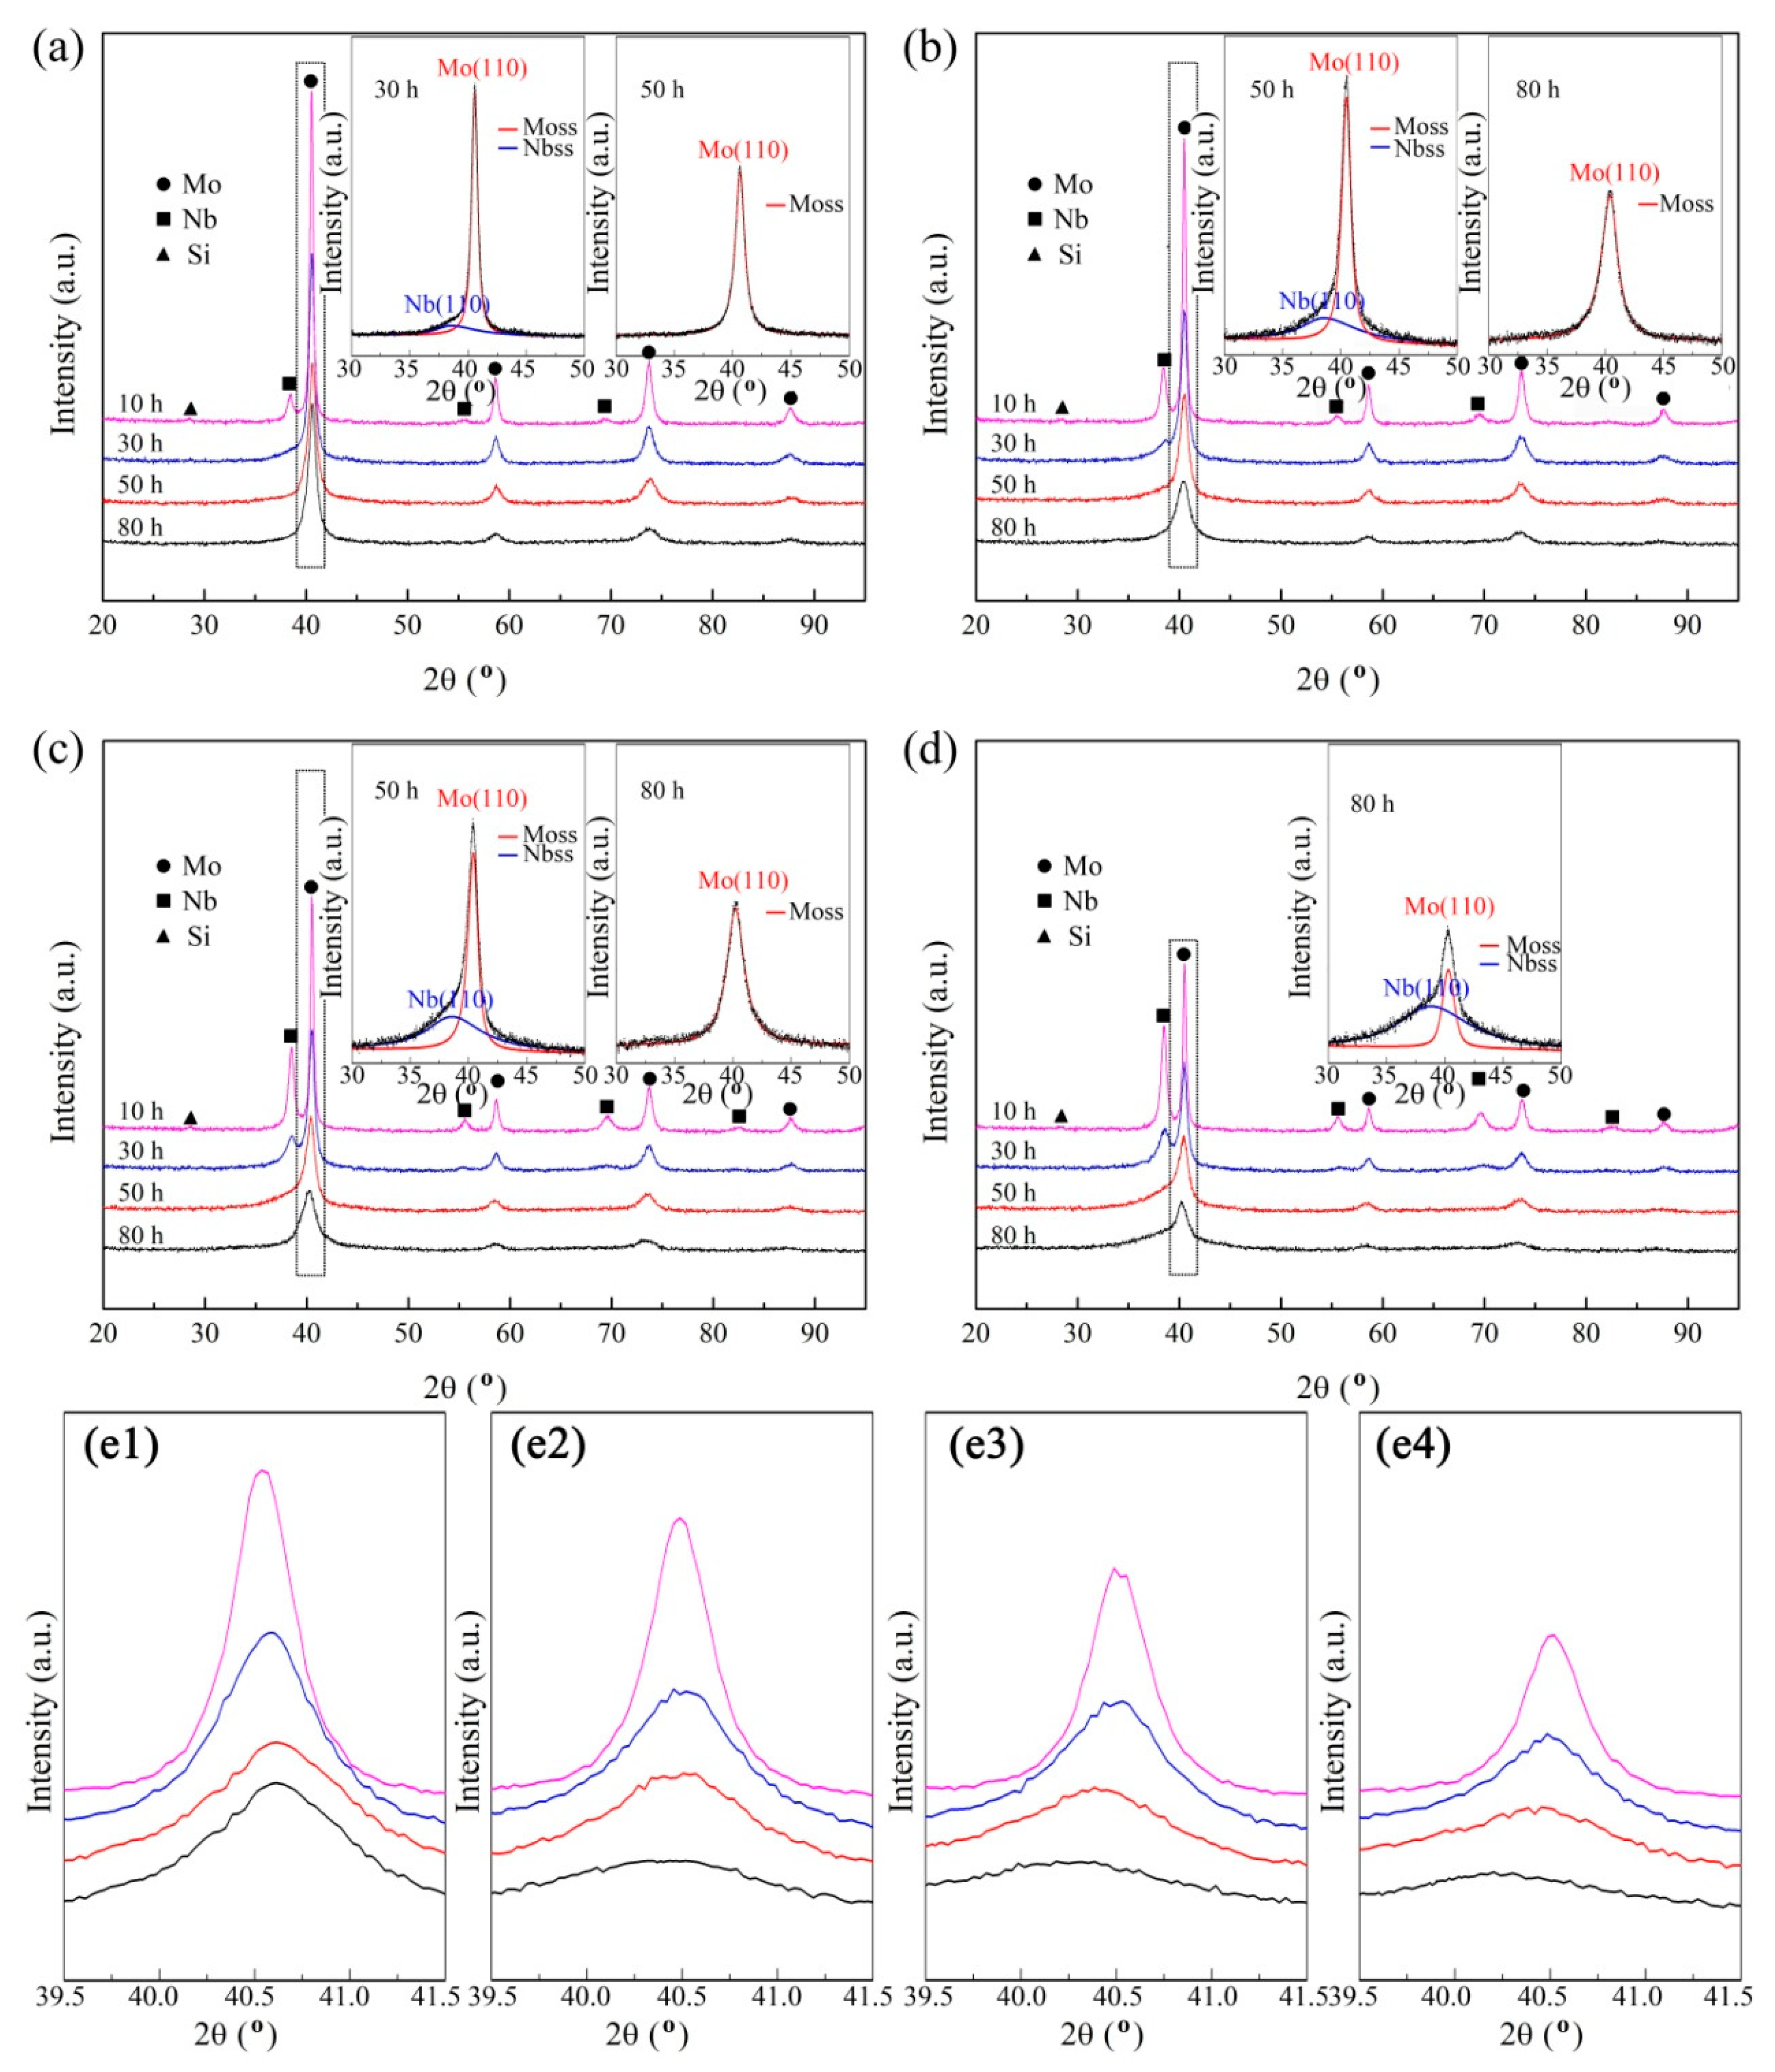
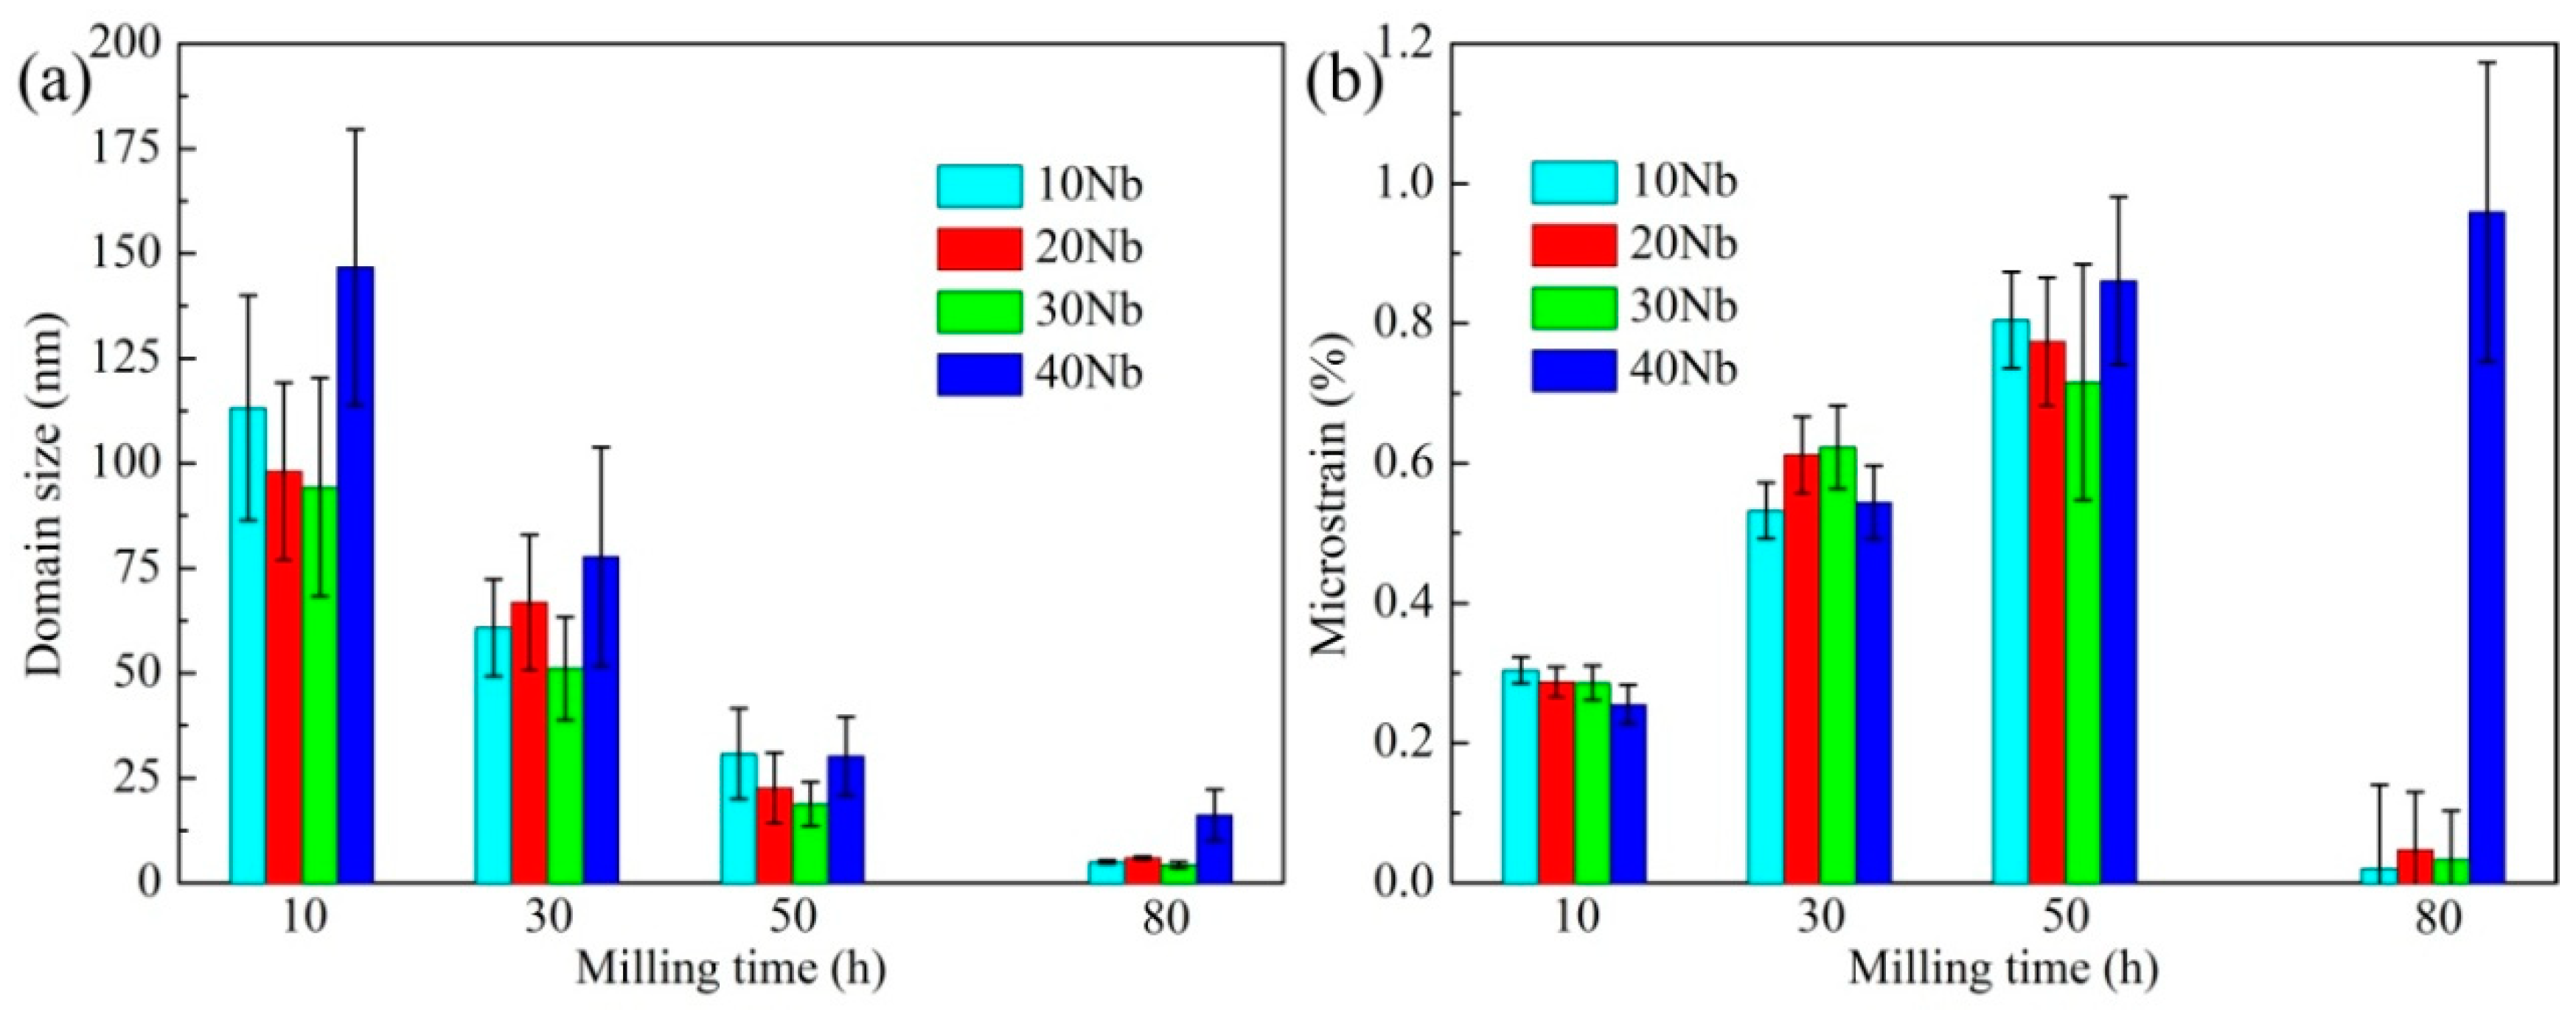
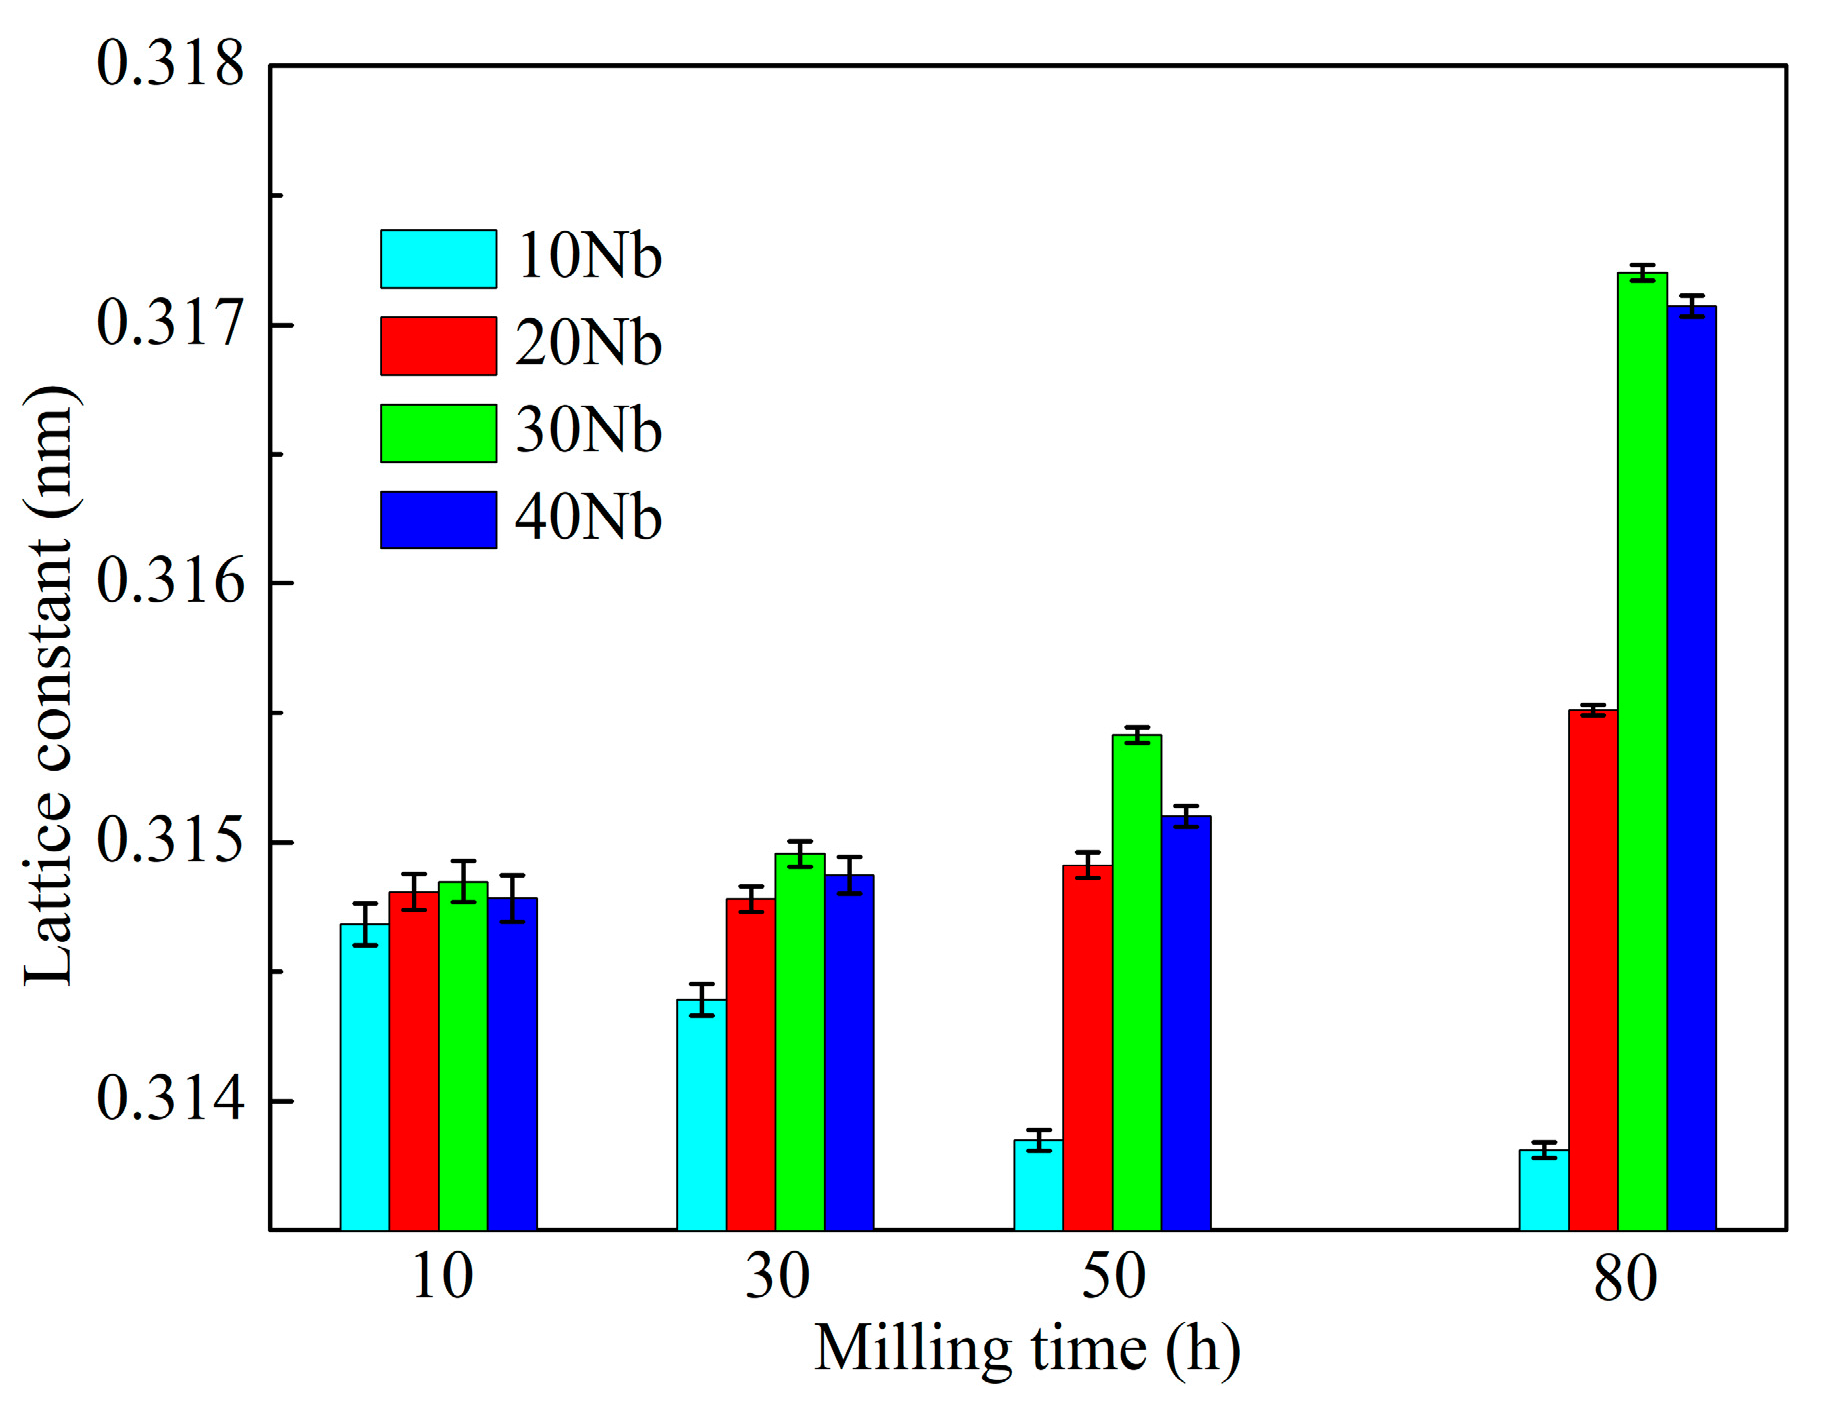
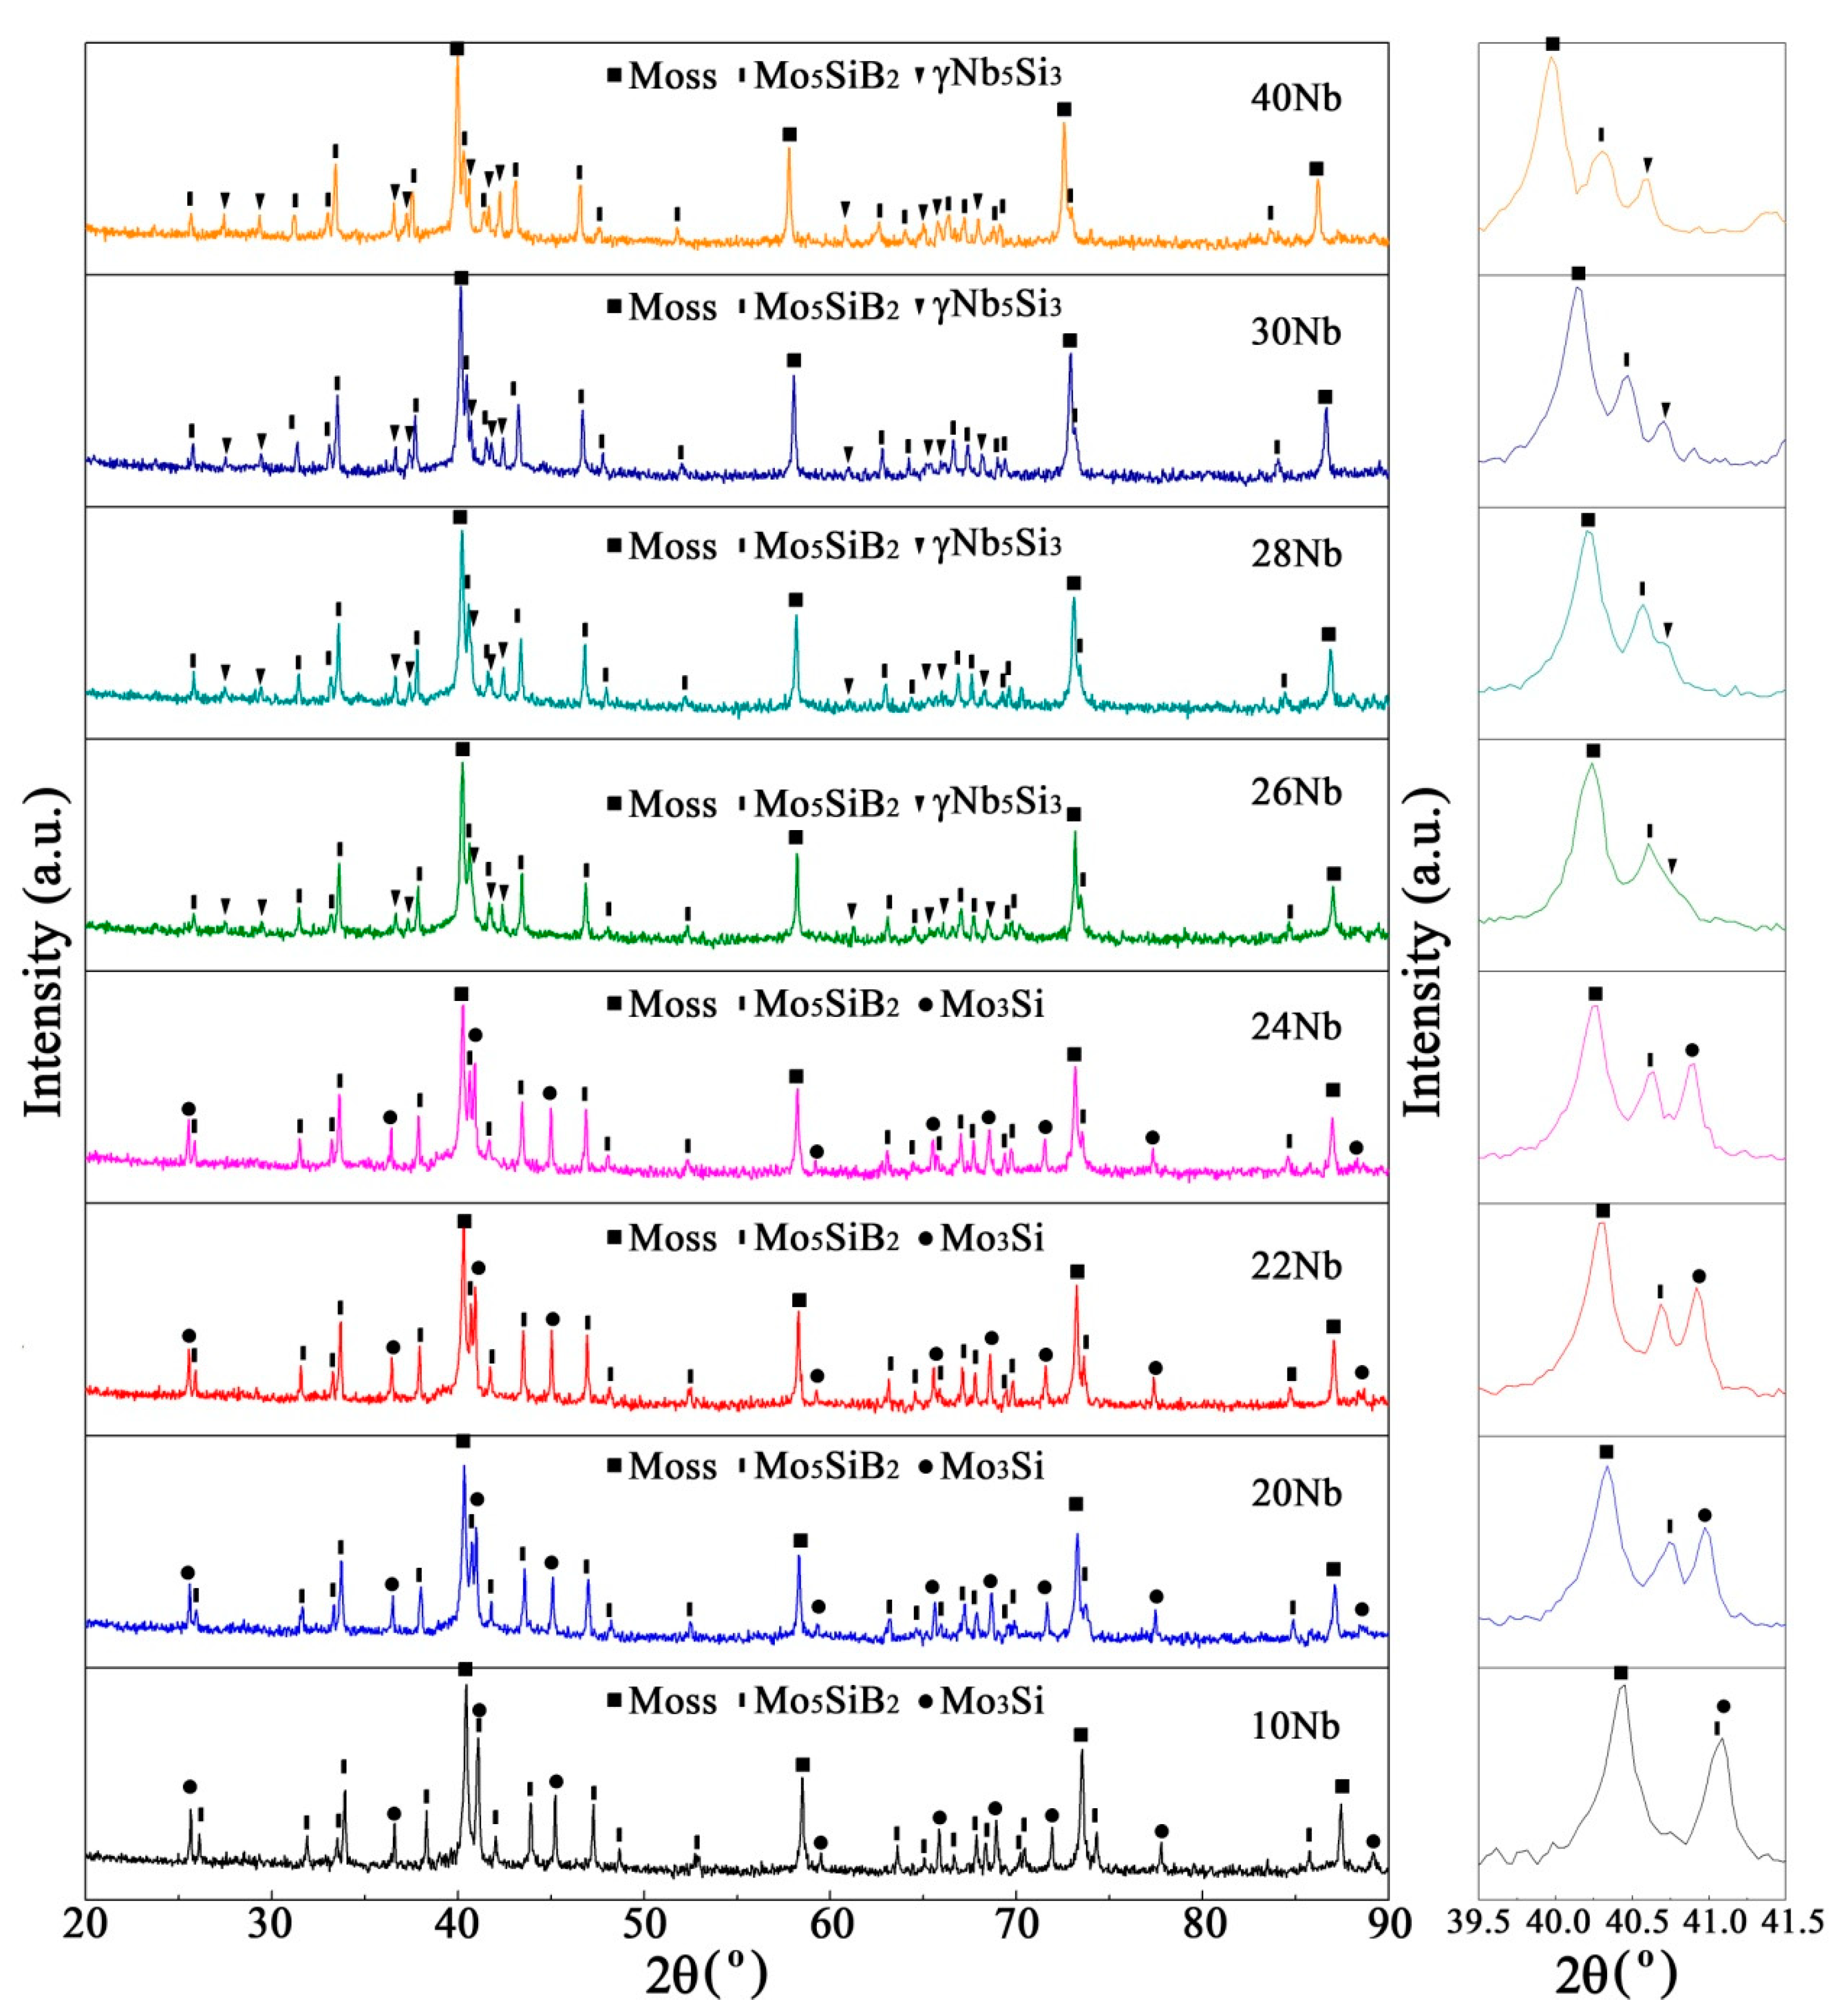
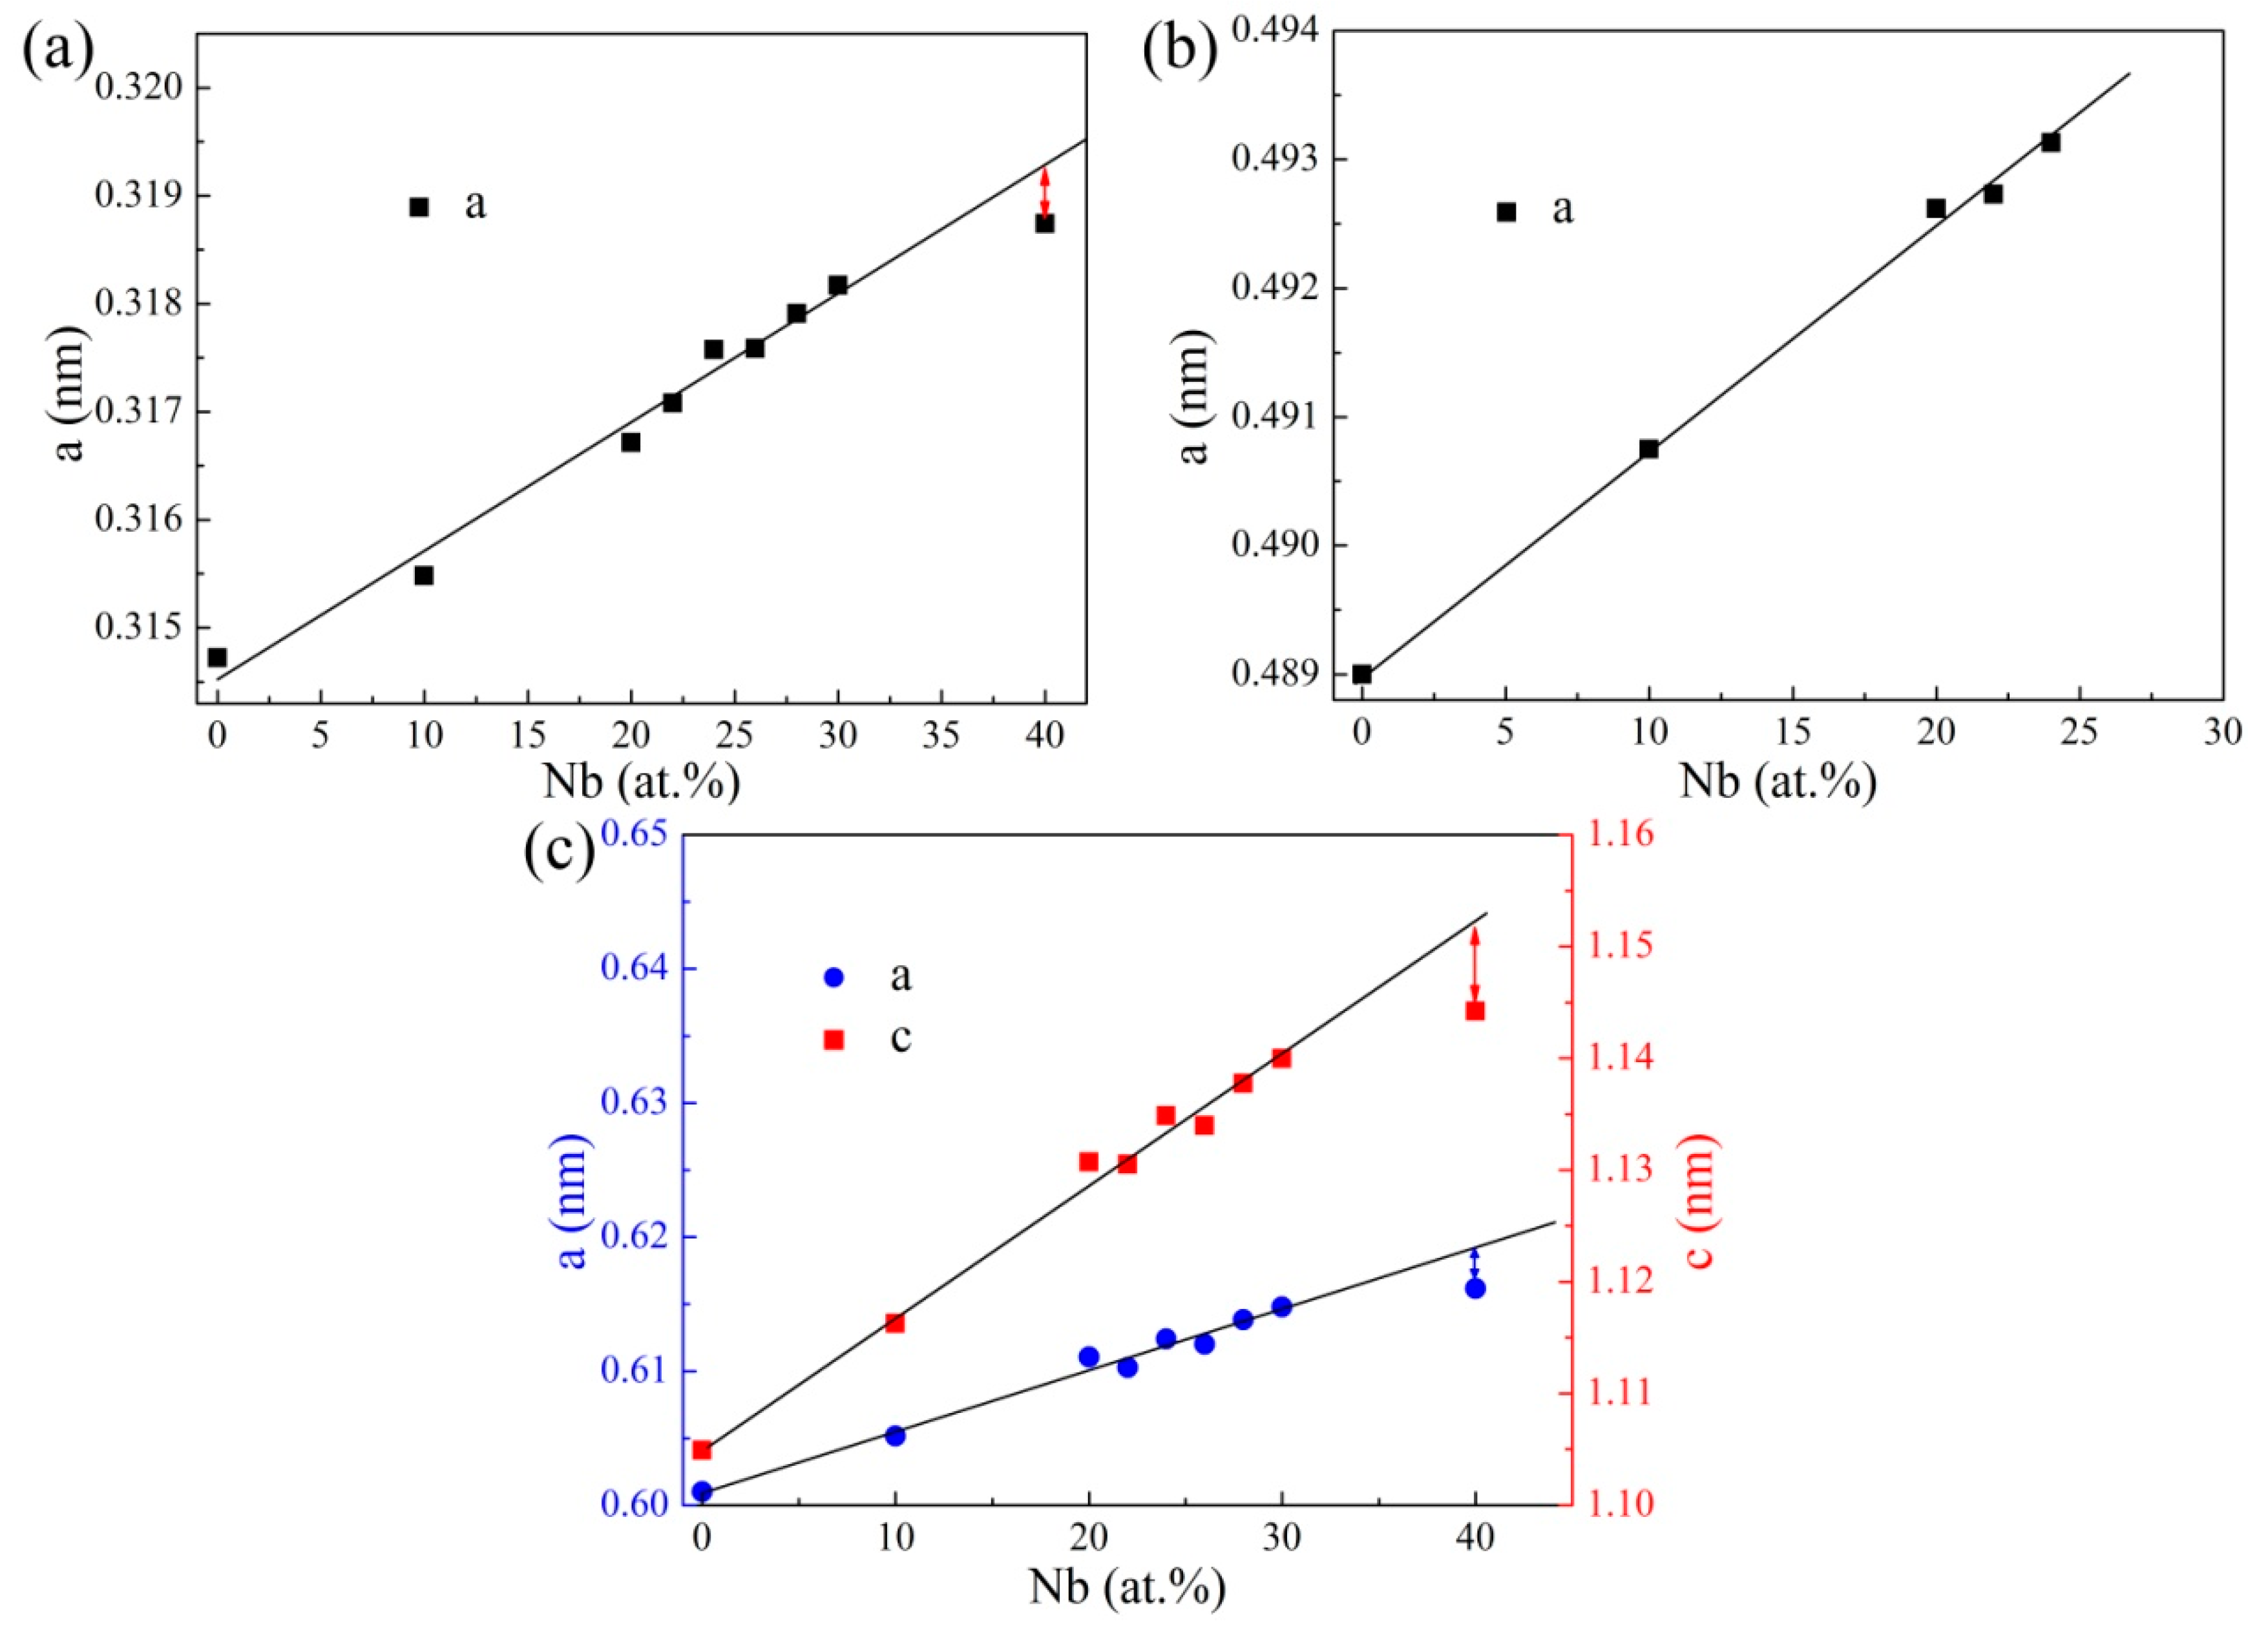
3.1. Mechanical Alloying Behavior

Figure 1 shows the secondary-electron (SE) morphological images of powders with different Nb contents after 50 h of milling and the corresponding particle size distribution counted by IPP. Due to the variation of Nb content, the particle morphology showed significant differences after the same 50 h of milling. For sample MA-10Nb/50h, both single particles and larger agglomerates could be found. Its particle size showed a bimodal size distribution with two peaks at 2.1 and 10.5 μm. Obviously, the former represents the size of most single particles and the latter represents the agglomerative ones. Sample MA-20Nb/50h also showed a bimodal size distribution; however, with a right-shifted peak position for single particles (3.3 μm) and a left-shifted one for agglomerates (8.5 μm) compared with the size distribution peaks of sample MA-10Nb/50h. For sample MA-30Nb/50h, the powders were mainly composed of near-spheroidal single particles. Different from the former two, its particle size showed a unimodal distribution with one peak at 4.1 μm. Similar to sample MA-30Nb/50h, sample MA-40Nb/50h also showed a unimodal distribution. However, it showed a wider distribution and larger peak position (4.9 μm) than those of sample MA-30Nb/50h. For the evolution of particle morphology and size during milling, the addition of Nb showed two opposite effects. On the one hand, the dissolution of Nb into the Mo lattice increased the fragmentation tendency of Mo particles and decreased the particle size [19,20]. On the other hand, the substitution of Mo by more ductile Nb increased the cold-welding degree, and therefore the particles coarsened. The key mechanism depended on the content of Nb addition. In sample MA-10Nb/50h, the low Nb content made the fracture of particles dominant and resulted in small single particles. In some cases, these particles spontaneously gathered together to form larger agglomerates to reduce the system energy. With an increase in the content of Nb, the cold-welding degree of particles increased, leading to the coarsening of single particles and a gradually lower formation of agglomerates.
Figure 2 shows the cross-sectional back-scattered-electron (BSE) images and EDS mapping results of samples MA-10Nb/50h and MA-20Nb/50h. In the sample MA-10Nb/50h, a uniform plum-pudding microstructure like our previous observation [20] could be seen. Meanwhile, in the sample MA-20Nb/50h, a looming lamellar structure can still be found. Due to their adjacent atomic numbers, a marginal contrast could be observed between Nb and Mo in BSE mode. Therefore, EDS mapping analysis was conducted to reveal the element distribution. As shown in Figure 2a, EDS mapping analysis of sample MA-10Nb/50h showed the uniform distribution of Mo, Nb, and Si. Further EDS analyses show that the compositions of points A and B were Mo-10.7Nb-12.7Si and Mo-11.1Nb-12.9Si, respectively, which approached the normalized nominal composition (76Mo-11Nb-13Si) after the removal of elemental B due to its marginal dissolution in Mo lattice [20], which means there was a complete dissolution of Nb and Si. As shown in Figure 2b, EDS mapping analysis of sample MA-20Nb/50h showed the uniform distribution of Si but non-uniform distribution of Nb. Further EDS analyses showed that the compositions of points C and D were Mo-28.1Nb-12.5Si and Mo-16.8Nb-13.1Si, respectively, confirming the non-uniform distribution of Nb but complete dissolution of Si under this milling condition.
Figure 3 shows the XRD spectra of powder mixtures with various Nb contents after different milling times with deconvolution calculation results in the 2θ range from 30° to 50° inset and the enlarged views of Mo(110) peaks. For all cases, with the increase in milling time, the diffraction peak was broadened and its intensity decreased. Enlarged views of Mo(110) peaks showed the peak position shift along with an increase in milling time caused by the dissolution of Si and Nb. Deconvolution calculation for the asymmetrical XRD profile of sample MA-10Nb/30h in the 2θ range from 30° to 50° revealed the persistence of the Nb(110) peak. Meanwhile, with the milling time increased to 50 h, a well symmetrical profile just for Mo(110) peak in this 2θ range indicated the complete dissolution of Nb element. Similar deconvolution calculations showed that 80 h milling was necessary for the complete dissolution of Nb element for 20Nb and 30Nb powders, but was still not enough to dissolve all Nb atoms for 40Nb powders.
Figure 4 shows the evolutions of domain size and microstrain of Moss in four kinds of powder (10Nb, 20Nb, 30Nb, and 40Nb) with the prolongation of milling time. It is worth noting that grains in materials fabricated using severe plastic deformation (SPD) techniques, such as MA, show complex microstructure including subgrains, cell blocks, dislocations cells, and so on. X-ray diffraction is sensitive to the sub-structure of grain and concentrates on the coherently scattering domain [21,22,23]. As a result, it is more reasonable to adopt domain size rather than grain size to describe the XRD calculation results. For all cases, the domain size of Moss decreased with an increase in milling time. However, for microstrain evolution, except for its continuous increase for 40Nb powders, the Moss microstrain for the other three powders showed a continuous increase till 50 h milling, followed by a sharp reduction. This sharp reduction can be attributed to the enhanced resistance for generating new dislocations in the Moss lattice due to its extremely fine domain size [20]. Generally, with an increase in Nb content from 10 to 30 at.%, the Moss domain size decreased after the same milling time. The enhanced dissolution of Nb in Mo lattice, driven by its increasing addition content, increased the defect density of the Moss lattice and accelerated the grain refining [19]. Meanwhile, in 40Nb powders, the excessive addition of ductile Nb increased the cold-welding degree of powders significantly and then postponed the progress of grain refining.
Figure 5 shows the evolutions of the Moss lattice constant for 10 Nb, 20 Nb, 30 Nb, and 40 Nb powders with an increase in milling time. As shown in our previous work [20], elemental B shows marginal solid solubility in a Mo lattice. As a result, the changes of the Moss lattice constant should be attributed to the dissolution of Si and Nb atoms. Both elements form a substitutional solid solution with Mo. The dissolution of Nb atoms increased the Moss lattice constant due to its larger atomic radius compared to Mo, while the effect of Si dissolution was just the opposite. For 10Nb powders, the Moss lattice constant showed a continuous decrease until 50 h of milling, indicating the dominance of the contraction effect of Si dissolution during this milling period. Afterwards, a marginal change of Moss lattice constant for subsequent milling to 80 h was observed, which can be ascribed to the already complete dissolution of Si and Nb after the 50 h of milling confirmed by the EDS analyses, as mentioned above. Different from 10Nb powders, the Moss lattice constant for 20Nb powders showed a slow but monotonous increase until 50 h of milling, followed by an obvious increase with further milling to 80 h. This slow increase in Moss lattice constant during the first 50 h of milling means the slight dominance of expansion effect of Nb dissolution after compensating the contraction effect of Si dissolution. This was caused by the enhanced Nb dissolution driven by its higher addition content in 20Nb powders than that in 10Nb powders. For 20Nb powders, as supported by the EDS analyses, 50 h of milling was enough to dissolve all Si atoms. As a result, further milling to 80 h just made the residual Nb atoms dissolve, resulting in the significant increase of the Moss lattice constant. In 30 Nb powders, the Moss lattice constant showed a larger value than that of 20 Nb powders after the same milling time as a result of further enhanced Nb dissolution upon increasing the Nb content from 20 to 30 at.%. Meanwhile, a decline of the Moss lattice constant after the same milling time, namely a weakened Nb dissolution, was observed for increasing Nb addition content from 30 to 40 at.%.
Based on the analyses above, it can be concluded that increasing the content of Nb from 10 to 30 at.% accelerated MA processes, such as grain refining and atom dissolution, while further increasing Nb content to 40 at.% decreased the MA processes. MA is an alternating process of deformation, cold welding, and fracture of the powders. Balance among these three sub-processes is the requirement for a rapid MA process [24]. Meanwhile the addition of Nb showed different effects on these three sub-processes. First, substitution of Mo via lighter Nb with the same mesh size increased the total volume of powder mixtures at a given total mass. With the collision frequency of milling media and the volume of trapped powders per collision unchanged, an increase in the total volume of powder mixtures delayed the deformation sub-process. Second, as a more ductile constituent than Mo, the addition of Nb increased the cold-welding degree of powder mixtures. Cold welding is necessary for the combination of the fresh fracture surface for composition homogenization. Meanwhile, excessive cold welding restrained the fracture of powder particles and the formation of a new fresh fracture surface. This suppressed the subsequent cold welding of these new fresh surfaces for further composition homogenization. On the contrary, dissolution of Nb during milling hardened the powder particles and increased their fragmentation tendency [19]. It was obvious that which effect took the lead depended on the content of Nb. Apparently, for powders with a Nb addition less than 30 at.%, the MA process was accelerated with an increase in Nb addition content due to the increased fragmentation tendency and moderate cold-welding degree of the milled powder particles. However, in 40Nb powders, excessive cold welding and high powders volume postponed the MA process.

3.2. Sintered Microstructure

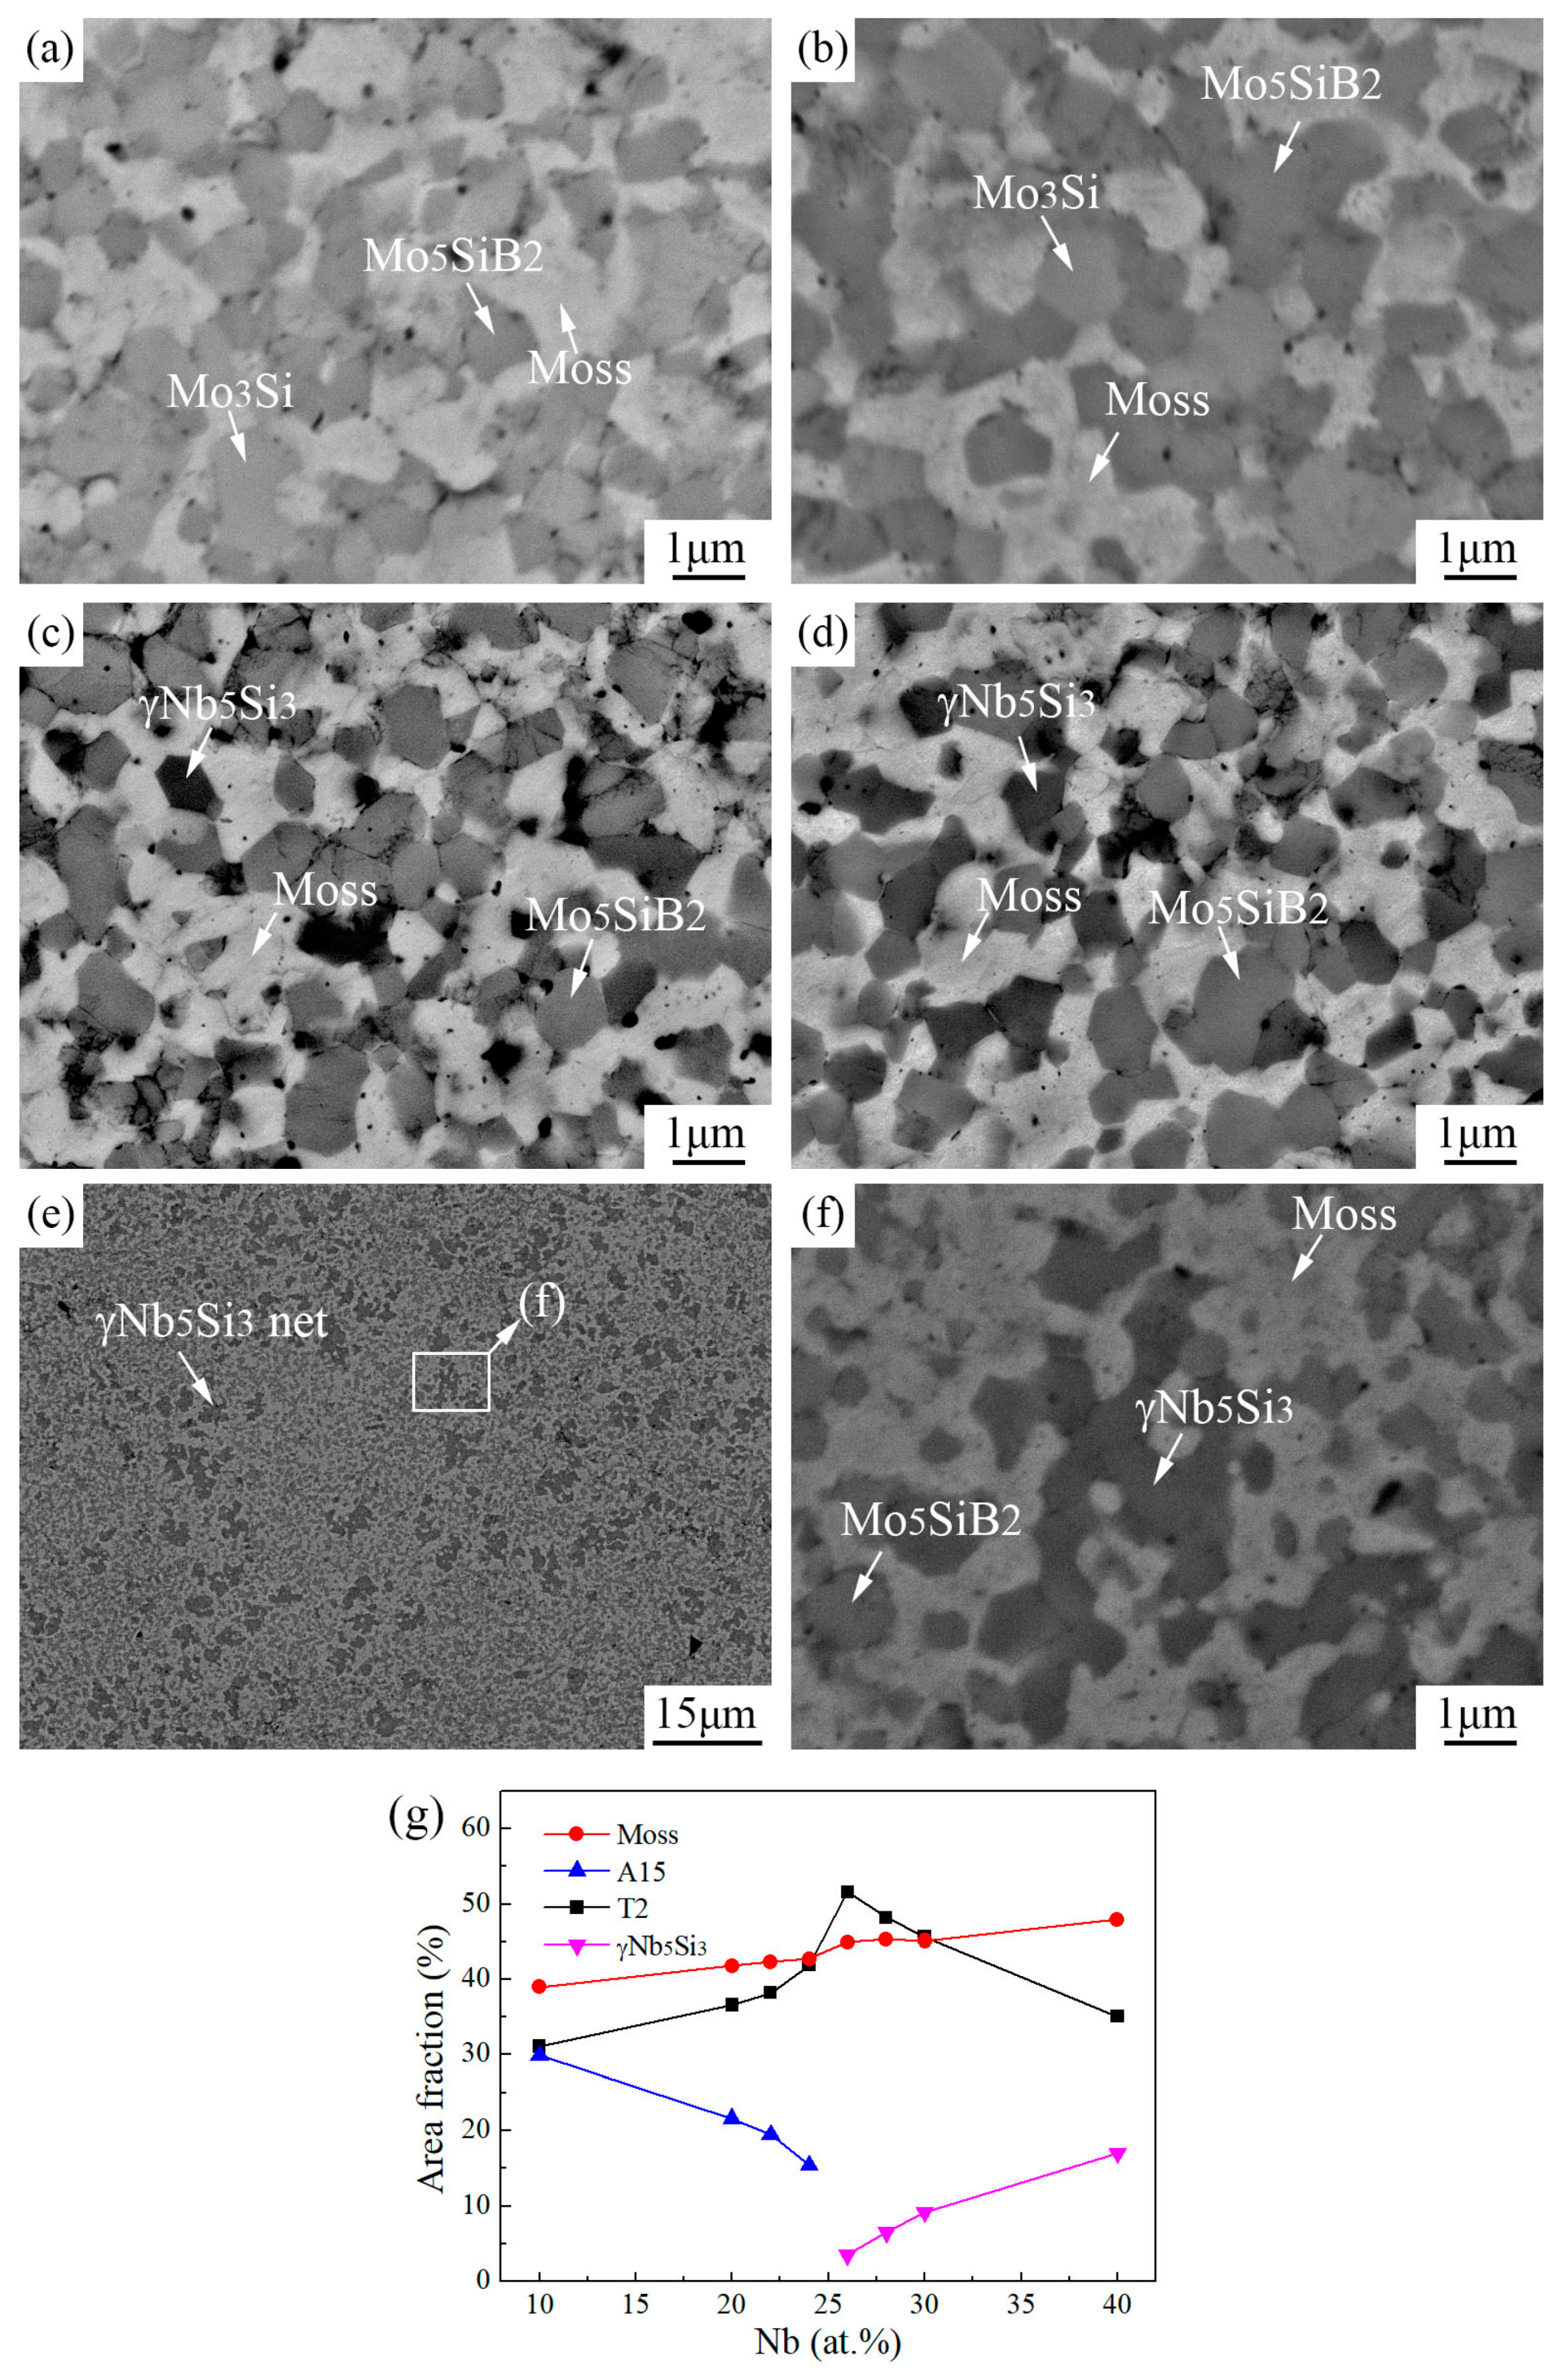
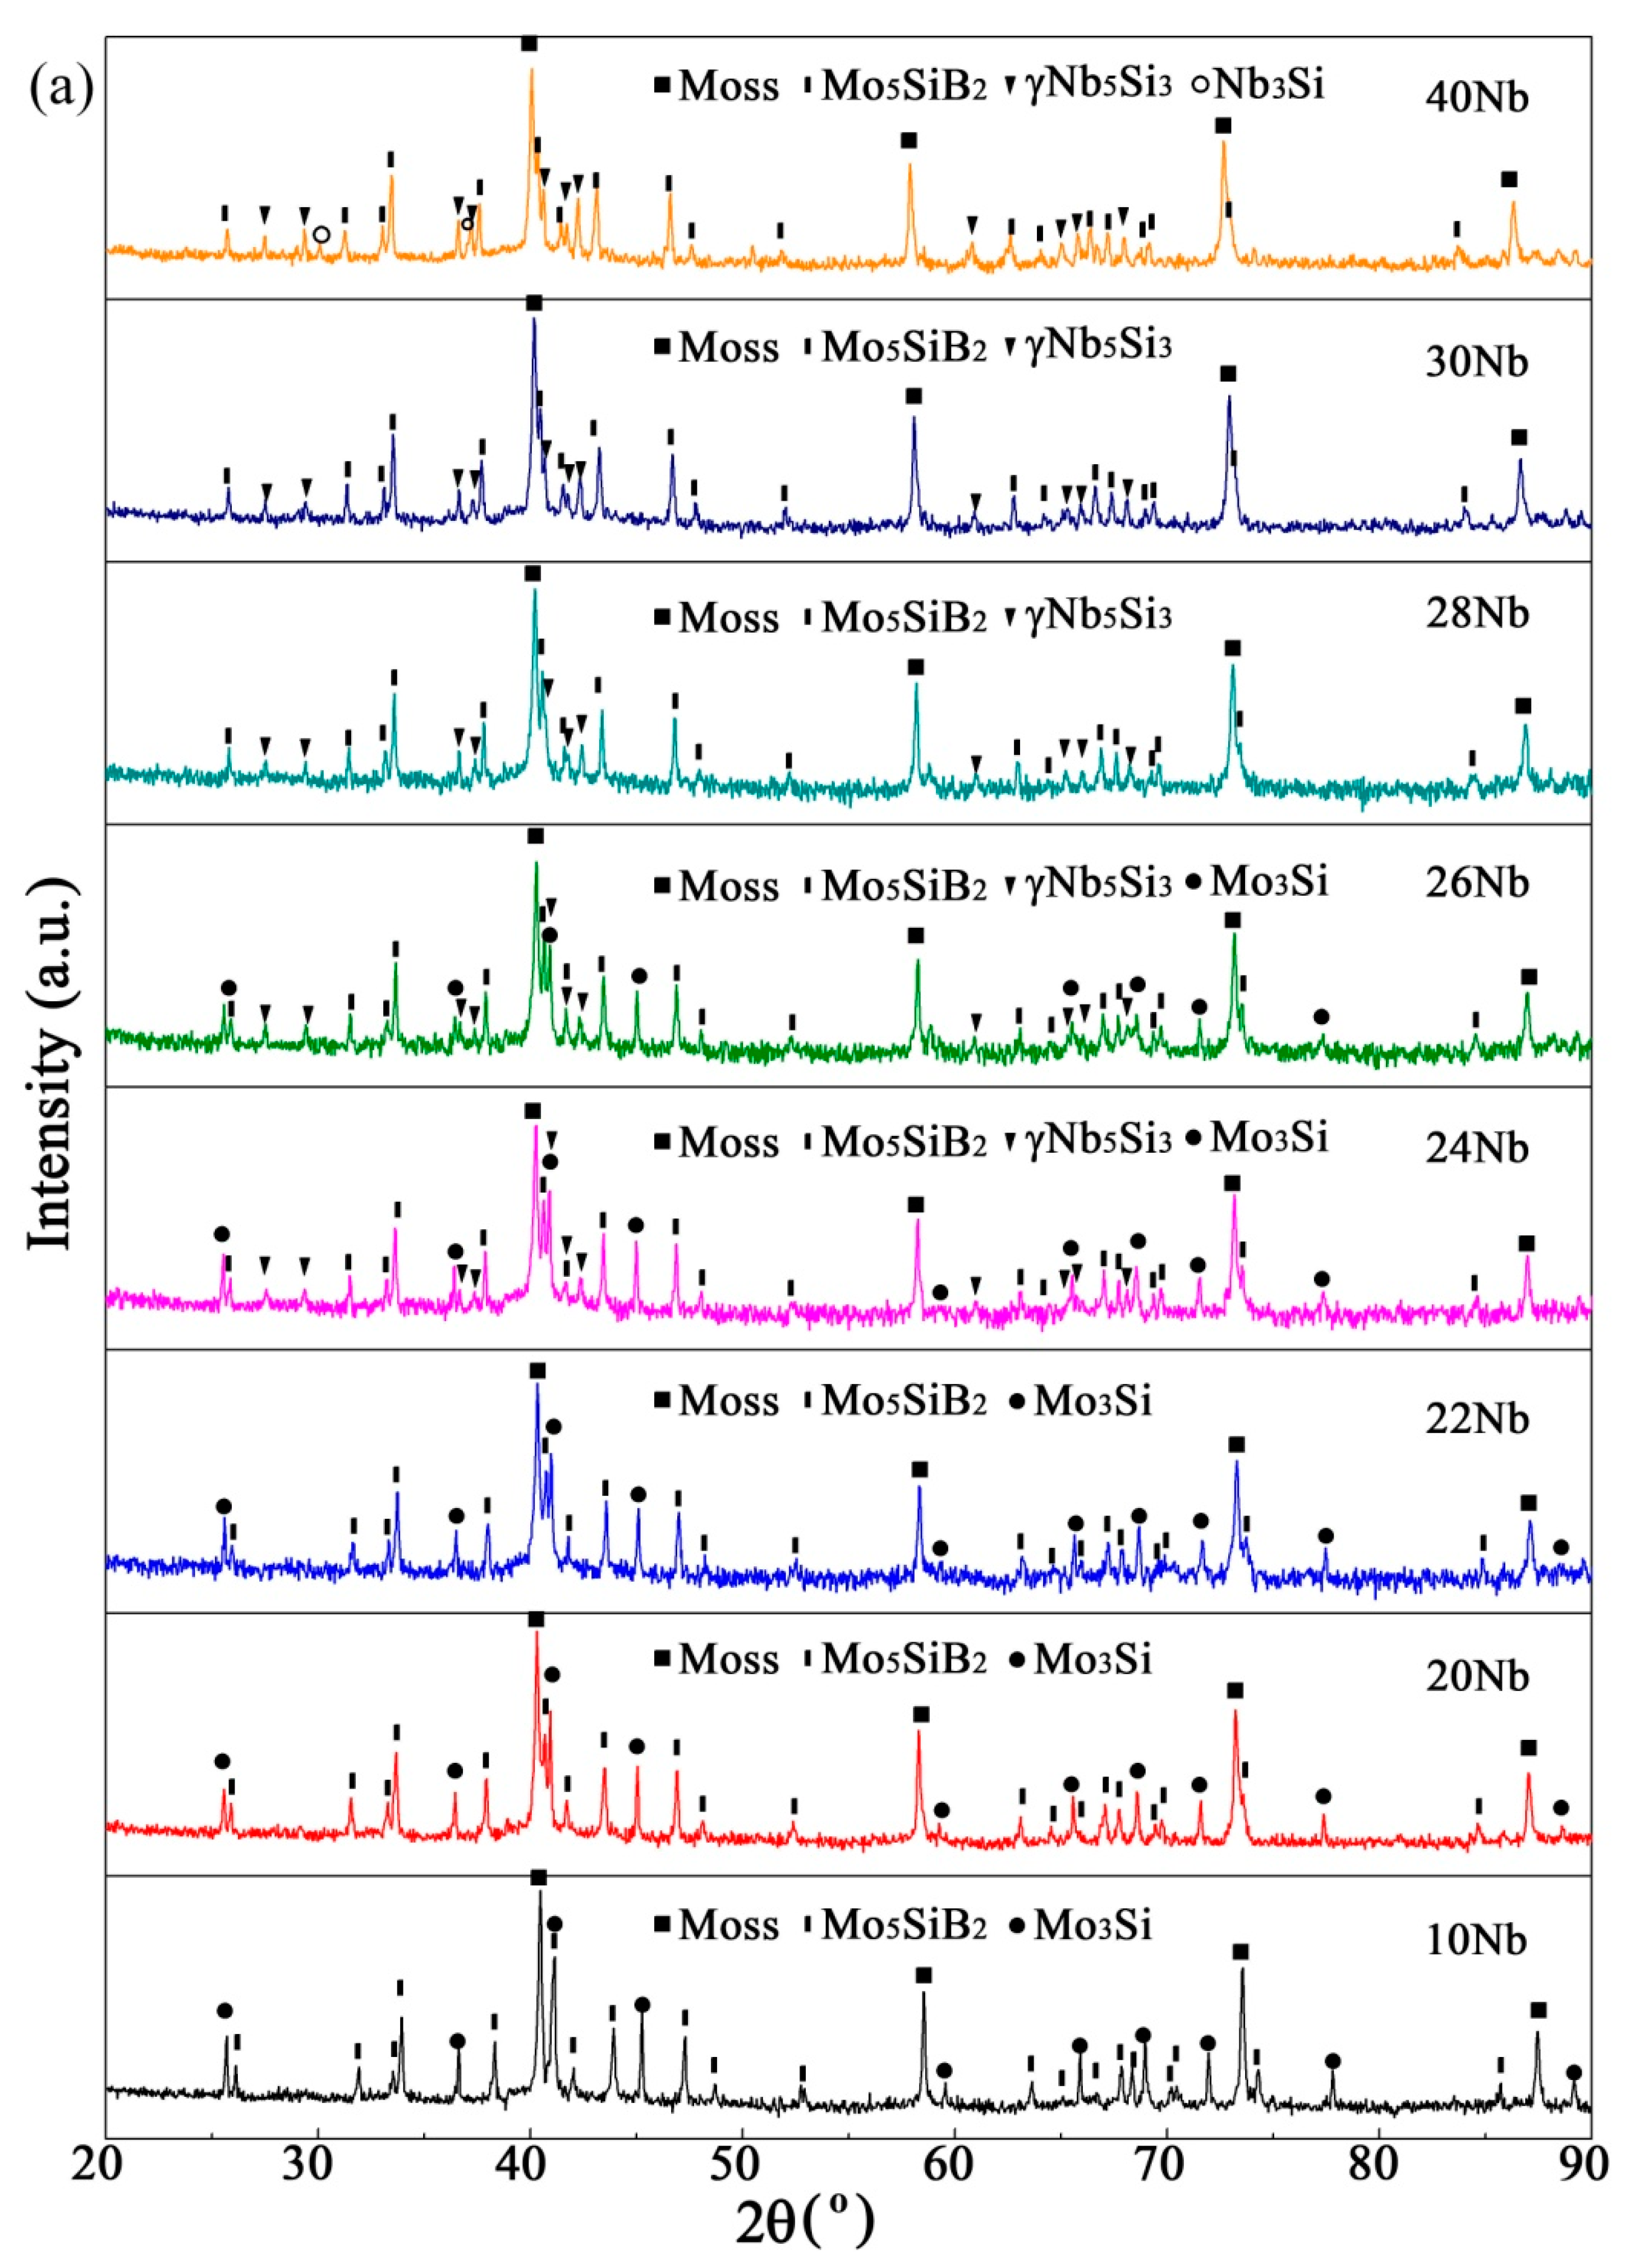
3.2.1. Effect of Nb Content

Figure 6 shows the XRD spectra of the sintered samples with the compositions of Mo-12Si-10B-xNb (x = 10, 20, 22, 24, 26, 28, 30, and 40) fabricated by milling the powder mixtures for 30 h, cold pressing, and then sintering at 1773 K for 2 h. It can be seen that two sets of phase constituents were observed for these sintered samples with different Nb contents, namely Moss+Mo3Si+Mo5SiB2 for samples S-10Nb/30h, S-20Nb/30h, S-22Nb/30h, and S-24Nb/30h; and Moss+γNb5Si3 (D88 structure) +Mo5SiB2 for samples S-26Nb/30h, S-28Nb/30h, S-30Nb/30h, and S-40Nb/30h. A critical Nb content for suppressing the formation of Mo3Si phase was found between 24 and 26 at.%. Based on the Mo-Nb-Si-B quaternary phase diagram [12], the Nb5Si3 phase should be excluded for the present compositions. The formation of this unexpected Nb5Si3 should be attributed to the residue of the Nb-rich region after 30 h of milling, as supported by the above mentioned XRD and SEM analyses, and the low diffusion rates of the constituent elements during the solid-state sintering process. Elemental B stabilized the D88 structure of Nb5Si3 in accordance with the studies of Zhang et al. [25].
As shown in Figure 6, especially in the enlarged views, obvious peak position shifted to lower angles, indicating increased lattice constants, were observed in Moss, Mo3Si, and Mo5SiB2 diffraction patterns with an increase in Nb content. Figure 7 shows the increases in lattice constants of Moss, Mo3Si, and Mo5SiB2 with increase in Nb content. Regardless of the sample S-40Nb/30h, the lattice constants of these three phases significantly increased linearly with an increase in Nb content. Meanwhile, deviations from the linear fitting results to lower values were observed for Moss and Mo5SiB2 in sample S-40Nb/30h. Extensive formation of γNb5Si3, and thus a suppressed dissolution of Nb in Moss and Mo5SiB2, was responsible for these deviations.
Figure 8 shows the BSE images of the microstructure of the sintered samples with different Nb contents. Table 2 shows the corresponding EDS-analyzed compositions of the different phases indicated by arrows in Figure 8. BSE observation combined with EDS analyses verified the presence of bright Moss, grey Mo3Si, and dark grey Mo5SiB2 for the samples S-10Nb/30h and S-24Nb/30h, and the disappearance of Mo3Si and formation of dark γNb5Si3 for the samples S-26Nb/30h, S-30Nb/30h, and S-40Nb/30h. It should be noted that due to the extremely small phase size, the EDS analysis could not determine the composition of each phase exclusively. As a result, EDS results were just used to distinguish the phase species. Besides, although EDS could not measure B content exactly, the distinguishing between Mo3Si and Mo5SiB2 could be achieved by their obvious difference in Si content. Figure 8g shows the changes of area fraction of constituent phases as a function of Nb content. The content of Mo3Si decreased monotonously with an increase in Nb content from 10 to 24 at.%, followed by a complete disappearance for 26 at.% and higher Nb content. With an increase in Nb content from 10 to 40 at.%, the amount of Moss increased continuously, while the content of Mo5SiB2 increased first and then decreased. The γNb5Si3 phase began to appear in the sample S-26Nb/30h and its content increased monotonously with an increase in Nb content. To maintain the structural stability of the T2 phase, the geometric rule claims that the substitution of Mo with Nb with a larger atom radius in Mo5SiB2 would favor an accompanying replacement of B with Si for a relatively constant atomic size ratio between metal and metalloid [26]. As a result, the additional substitution of B with Si encouraged by the replacement of Mo with Nb in Mo5SiB2 consumed the Si that otherwise would form Mo3Si, leading to the reduction in Mo3Si content. On the contrary, the released B guaranteed the increased formation of Mo5SiB2. Due to the higher Mo content in Mo3Si than that in Mo5SiB2, the partial substitution of Mo3Si with Mo5SiB2 facilitated the formation of Moss. The monotonous increase in γNb5Si3 content can be attributed to more and more Nb residues forming with an increase in Nb content. As shown in Figure 8e, a typical γNb5Si3 net was observed for the sample S-40Nb/30h due to its high Nb residue after the MA process. The growing formation of this Si-rich and B-containing γNb5Si3 consumed Si and B, and then promoted the reduction in Mo5SiB2 content but an increase in Moss content.

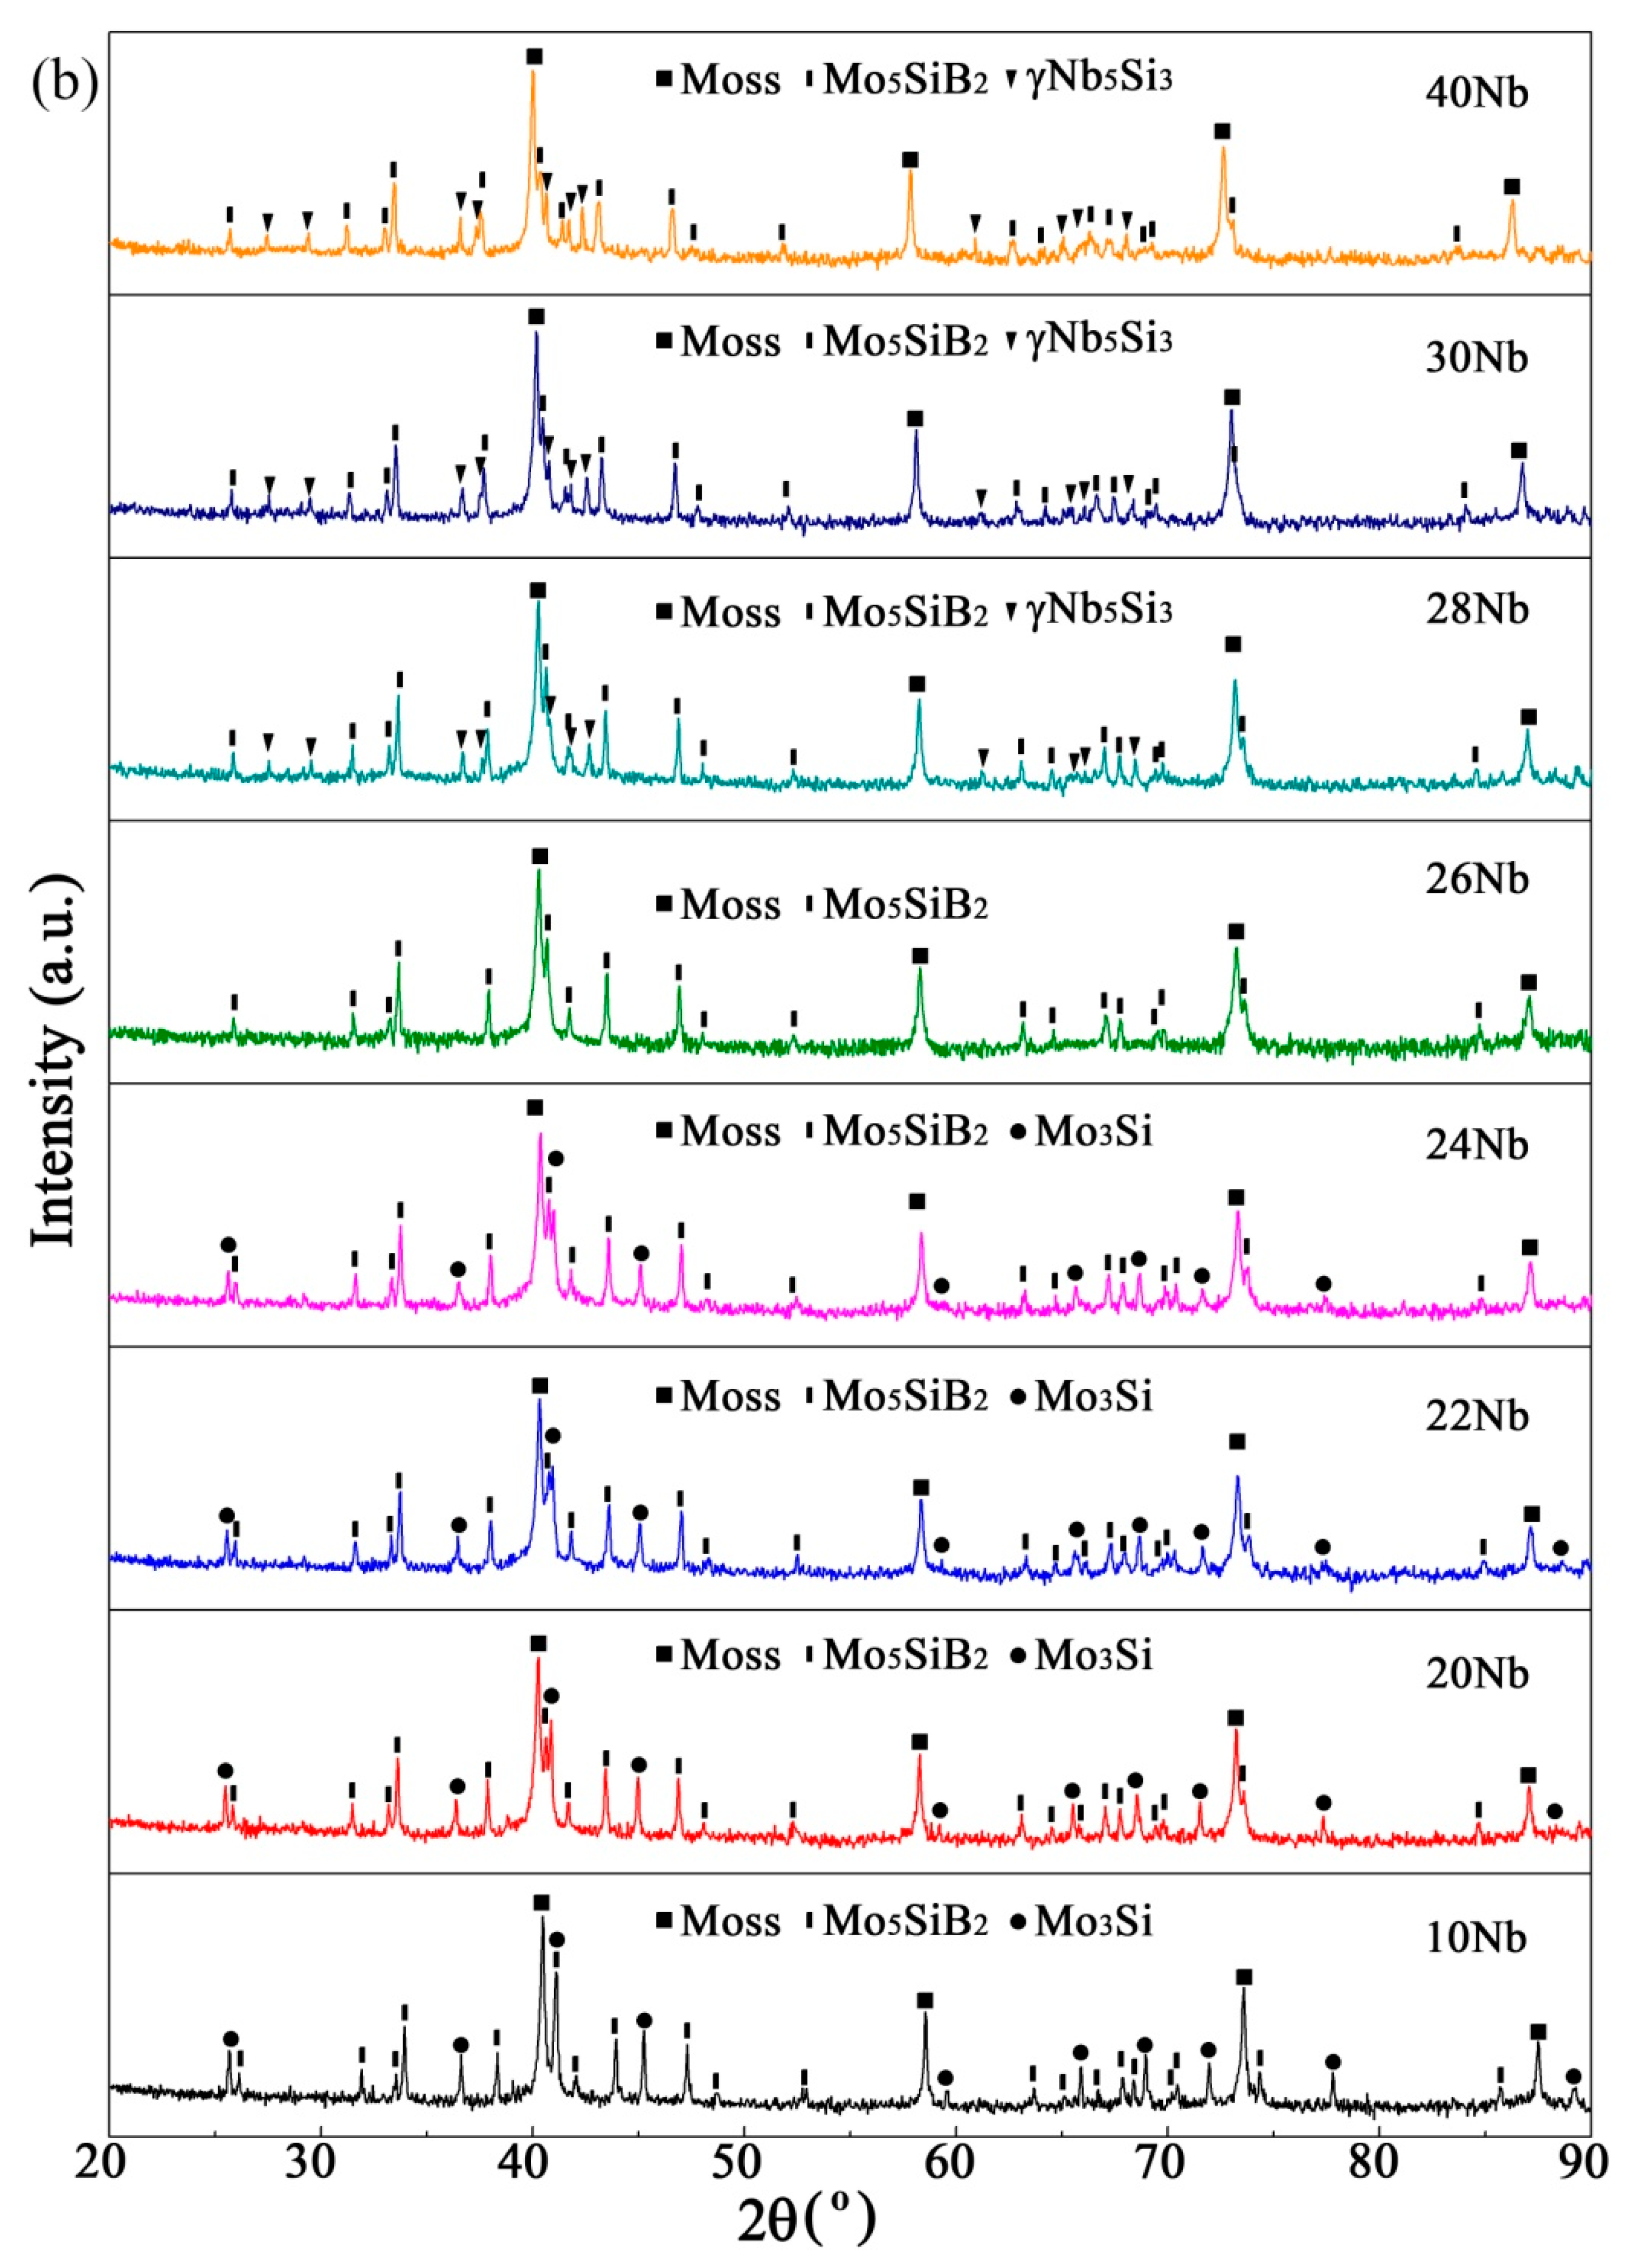
3.2.2. Effect of Prior MA Process

Figure 9 shows the XRD spectra of sintered samples with the compositions of Mo-12Si-10B-xNb (x = 10, 20, 22, 24, 26, 28, 30, and 40) fabricated by milling the powder mixtures for (a) 10 or (b) 50 h, cold pressing, and then sintering at 1773 K for 2 h. Taking samples of S-xNb/30h as reference, it can be seen that the prior MA process exerted some effects on the phase constituents of the subsequent sintered samples. For samples of S-xNb/10h, 24at.% Nb was already enough for the formation of γNb5Si3, but 28at.% Nb was necessary for the complete suppression of Mo3Si, and Nb-rich Nb3Si could be observed for sample S-40Nb/10h. Consistent with samples S-xNb/30h, a critical Nb content for suppressing the formation of Mo3Si was also found between 24 and 26 at.% for samples S-xNb/50h. The difference was that γNb5Si3 could be avoided for the sample S-26Nb/50h. In summary, prolongation of the prior milling process facilitated the suppression of Mo3Si and delayed the formation of Nb-rich niobium silicides, such as Nb5Si3 and Nb3Si, in the sintered alloys with an increase in Nb content. For 10-h milled powders, obvious Nb diffraction peaks, as shown in Figure 3, caused a serious enrichment in some regions of the powder particles. The low solid diffusion ability of Nb during the following sintering process facilitated the preferential formation of niobium silicides in these Nb-rich regions. As a result, the dissolution of Nb in generated Mo3Si decreased, leading to the deferred suppression of Mo3Si with an increase in Nb content. For 50-h milled powders, an increase in milling time promoted the composition uniformity of milled powders, which facilitated the suppression of Mo3Si and hindered the formation of niobium silicides in the sintered alloys.

4. Conclusions

1. Increasing the Nb content from 10 to 30 at.% accelerated the MA processes, such as grain refining and atom dissolution, due to the enhanced fragmentation tendency of the milled powder particles resulting from the enhanced dissolution of Nb driven by its increased addition content. However, further increasing the Nb content to 40 at.% decreased this process due to excessive cold welding and high powders volume.
2. For Mo-12Si-10B-xNb alloys prepared by milling the powders for 30 h and then sintered at 1773 K for 2 h, a critical Nb content for suppressing the formation of Mo3Si was found between 24 and 26 at.%. For alloys with a Nb content higher than 26 at.%, γNb5Si3 formed due to the Nb residue after 30 h of milling and the low solid diffusion ability of Nb during the sintering process.
3. A prior MA process exerted some effects on the phase constituents of subsequent sintered alloys. Prolongation of a prior milling process facilitated the suppression of Mo3Si and delayed the formation of niobium silicides by promoting the composition uniformity of the milled powders.

Author Contributions

X.G. conceived and designed the experiments, and supervised the data analysis; T.Y. carried out the experiments and analysis of the experimental data. T.Y. wrote this manuscript. X.G. revised this manuscript.

Funding

This work was financially supported by the National Natural Science Foundation of China (Nos. 51431003 and U1435201) and the Research Fund of the State Key Laboratory of Solidification Processing (NWPU), China (Grant No. 143-TZ-2016).

Conflicts of Interest

The authors declare no conflict of interest.

References

  1. Dimiduk, D.M.; Perepezko, J.H. Mo-Si-B alloys: Developing a revolutionary turbine-engine material. MRS Bull. 2003, 28, 639–645. [Google Scholar] [CrossRef]
  2. Lemberg, J.A.; Ritchie, R.O. Mo-Si-B alloys for ultrahigh-temperature structural applications. Adv. Mater. 2012, 24, 3445–3480. [Google Scholar] [CrossRef] [PubMed]
  3. Ochiai, S. Improvement of the oxidation-proof property and the scale structure of Mo3Si intermetallic alloy through the addition of chromium and aluminum elements. Intermetallics 2006, 14, 1351–1357. [Google Scholar] [CrossRef]
  4. Rioult, F.A.; Imhoff, S.D.; Sakidja, R.; Perepezko, J.H. Transient oxidation of Mo-Si-B alloys: Effect of the microstructure size scale. Acta Mater. 2009, 57, 4600–4613. [Google Scholar] [CrossRef]
  5. Rosales, I.; Martinez, H.; Bahena, D.; Ruiz, J.A.; Guardian, R.; Colin, J. Oxidation performance of Mo3Si with Al additions. Corros. Sci. 2009, 51, 534–538. [Google Scholar] [CrossRef]
  6. Yang, Y.; Bei, H.; Chen, S.; George, E.P.; Tiley, J.Y.; Chang, A. Effects of Ti, Zr, and Hf on the phase stability of Moss+Mo3Si+Mo5SiB2 alloys at 1600 °C. Acta Mater. 2010, 58, 541–548. [Google Scholar] [CrossRef]
  7. Akinc, M.; Meyer, M.K.; Kramer, M.J.; Thom, A.J.; Huebsch, J.J.; Cook, B. Boron-doped molybdenum silicides for structural applications. Mater. Sci. Eng. A 1999, 261, 16–23. [Google Scholar] [CrossRef]
  8. Nieh, T.G.; Wang, J.G.; Liu, C.T. Deformation of a multiphase Mo-9.4Si-13.8B alloy at elevated temperatures. Intermetallics 2001, 9, 73–79. [Google Scholar] [CrossRef]
  9. Ray, P.K.; Ye, Y.Y.; Akinc, M.; Kramer, M.J. Effect of Nb and W substitutions on the stability of the A15 Mo3Si phase. J. Alloy. Compd. 2012, 537, 65–70. [Google Scholar] [CrossRef]
  10. Sakidja, R.; Perepezko, J.H.; Kim, S.; Sekido, N. Phase stability and structural defects in high-temperature Mo-Si-B alloys. Acta Mater. 2008, 56, 5223–5244. [Google Scholar] [CrossRef]
  11. Geng, T.; Li, C.; Zhao, X.; Xu, H.; Du, Z.; Guo, C. Thermodynamic assessment of the Nb-Si-Mo system. J. Alloy. Compd. 2010, 34, 363–376. [Google Scholar] [CrossRef]
  12. Takata, N.; Sekido, N.; Takeyama, M.; Perepezko, J.H.; Follett-Figueroa, M.; Zhang, C. Solidification of Bcc/T1/T2 three-phase microstructure in Mo-Nb-Si-B alloys. Intermetallics 2016, 72, 1–8. [Google Scholar] [CrossRef]
  13. Nunes, C.A.; Sakidja, R.; Dong, Z.; Perepezko, J.H. Liquidus projection for the Mo-rich portion of the Mo-Si-B ternary system. Intermetallics 2000, 8, 327–337. [Google Scholar] [CrossRef]
  14. Katrych, S.; Grytsiv, A.; Bondar, A.; Rogl, P.; Velikanova, T.; Bohn, M. Structural materials: metal-silicon-boron: On the melting behavior of Mo-Si-B alloys. J. Alloy. Compd. 2002, 347, 94–100. [Google Scholar] [CrossRef]
  15. Krüger, M.; Franz, S.; Saage, H.; Heilmaier, M.; Schneibel, J.H.; Jéhanno, P.; Böning, M.; Kestler, H. Mechanically alloyed Mo-Si-B alloys with a continuous α-Mo matrix and improved mechanical properties. Intermetallics 2008, 16, 933–941. [Google Scholar] [CrossRef]
  16. Hassomeris, O.; Schumacher, G.; Krüger, M.; Heilmaier, M.; Banhart, J. Phase continuity in high temperature Mo-Si-B alloys: A FIB-tomography study. Intermetallics 2011, 19, 470–475. [Google Scholar] [CrossRef]
  17. Li, B.; Zhang, G.J.; Jiang, F.; Ren, S.; Liu, G.; Sun, J. Preparation of fine-grained Mo-12Si-8.5B alloys with improved mechanical properties via a mechanical alloying process. J. Alloy. Compd. 2014, 609, 80–85. [Google Scholar] [CrossRef]
  18. Byun, J.M.; Bang, S.-R.; Kim, S.H.; Choi, W.J.; Kim, Y.D. Mechanical properties of Mo-Nb-Si-B quaternary alloy fabricated by powder metallurgical method. Int. J. Refract. Met. Hard Mater. 2017, 65, 14–18. [Google Scholar] [CrossRef]
  19. Lei, R.S.; Wang, M.P.; Li, Z.; Wei, H.G.; Yang, W.C.; Jia, Y.L.; Gong, S. Structure evolution and solid solubility extension of copper-niobium powders during mechanical alloying. Mater. Sci. Eng. A 2011, 528, 4475–4481. [Google Scholar] [CrossRef]
  20. Yang, T.; Guo, X.P.; Luo, Y.C. Microstructural evolution of mechanically alloyed Mo-Si-B-Zr-Y powders. Int. J. Refract. Met. Hard Mater. 2016, 56, 35–43. [Google Scholar] [CrossRef]
  21. Zhong, Y.; Ping, D.; Song, X.; Yin, F. Determination of grain size by XRD profile analysis and TEM counting in nano-structured Cu. J. Alloy. Compd. 2009, 476, 113–117. [Google Scholar] [CrossRef]
  22. Ungár, T.; Tichy, G.; Gubicza, J.; Hellmig, R.J. Correlation between subgrains and coherently scattering domains. Powder Diffr. 2005, 20, 366–375. [Google Scholar] [CrossRef] [Green Version]
  23. Aguilar, C.; Ordoñez, S.; Guzman, D.; Rojas, P.A. Mechanical alloying of Cu–xCr (x = 3, 5 and 8 wt.%) alloys. J. Alloy. Compd. 2010, 504, 102–109. [Google Scholar] [CrossRef]
  24. Suryanarayana, C. Mechanical alloying and milling. Prog. Mater. Sci. 2001, 46, 1–184. [Google Scholar] [CrossRef]
  25. Zhang, S.; Guo, X.P. Effects of B addition on the microstructure and properties of Nb silicide based ultrahigh temperature alloys. Intermetallics 2015, 57, 83–92. [Google Scholar] [CrossRef]
  26. Sakidja, R.; Kim, S.; Park, J.; Perepezko, J.H. Transition metal alloying and phase stability in the Mo-Si-B system. Symposium on Defect Properties and Related Phenomena in Intermetallic Alloys. In Proceedings of the 2002 MRS Fall Meeting, Boston, MA, USA, 3–5 December 2002. [Google Scholar]
Figure 1. Electron morphological images of 50 h milling powders with (a) 10, (b) 20, (c) 30, and (d) 40 at.% Nb contents, and (e) the corresponding particle size distribution.
Metals 09 00653 g001
Figure 2. Cross-sectional BSE images of samples (a) MA-10Nb/50h and (b) MA-20Nb/50h, and their corresponding EDS mapping results.
Metals 09 00653 g002
Figure 3. XRD spectra of powders with (a) 10, (b) 20, (c) 30, and (d) 40 at.% Nb contents after different milling time. Insets: deconvolution calculation results in 2θ range from 30 to 50 degree. (e1), (e2), (e3) and (e4) are the enlarged views for (a), (b), (c), and (d), respectively, in the 2θ range from 39.5° to 41.5° containing Mo(110) peaks.
Metals 09 00653 g003
Figure 4. Evolutions of (a) domain size and (b) microstrain of Moss as a function of milling time for 10Nb, 20Nb, 30Nb, and 40Nb powders. The vertical lines are error bars.
Metals 09 00653 g004
Figure 5. Evolutions of Moss lattice constant as a function of milling time for 10 Nb, 20 Nb, 30 Nb, and 40 Nb powders. The vertical lines are error bars.
Metals 09 00653 g005
Figure 6. XRD spectra (logarithmic Y-axes) of samples S-xNb/30h (x = 10, 20, 22, 24, 26, 28, 30, and 40). Inset: enlarged view in the 2θ range from 39.5° to 41.5° containing Mo(110), Mo5SiB2(213), and Mo3Si(210) or γNb5Si3(211) peaks.
Metals 09 00653 g006
Figure 7. Lattice constants of (a) Moss, (b) Mo3Si, and (c) Mo5SiB2 vs. Nb contents.
Metals 09 00653 g007
Figure 8. BSE images of the microstructure of the samples (a) S-10Nb/30h, (b) S-24Nb/30h, (c) S-26Nb/30h, (d) S-30Nb/30h, and (e,f) S-40Nb/30h, and (g) changes of area fraction of constituent phases vs. Nb content.
Metals 09 00653 g008
Figure 9. XRD spectra (logarithmic Y-axes) of samples (a) S-xNb/10h and (b) S-xNb/50h (x = 10, 20, 22, 24, 26, 28, 30, and 40).
Metals 09 00653 g009aMetals 09 00653 g009b
Table 1. Conditions and corresponding abbreviations.
Abbreviation of ProductsProcess Typexy
MA-xNb/yhMechanical alloyingNb content (at.%)Milling time (h)
S-xNb/yhSintering at 1773 K for 2h of milled powders
Table 2. EDS-analyzed compositions of the different phases in samples S-24Nb/30h and S-26Nb/30h indicated by arrows in Figure 8.
SamplePhaseComposition (at.%)
MoNbSi
S-24Nb/30hMoss78.320.21.5
Mo3Si62.517.420.1
Mo5SiB2 55.132.512.4
S-26Nb/30hMoss75.522.91.6
γNb5Si330.739.230.1
Mo5SiB2 49.838.511.7
The normalized results after removing B due to the inability of EDS analysis for measuring B content.

