Article

A Novel Damage Model to Predict Ductile Fracture Behavior for Anisotropic Sheet Metal

1
College of Mechanical and Transportation Engineering, China University of Petroleum-Beijing, Beijing 102249, China
2
Tubular Goods Research Institute of CNPC, Xi’an 710077, China
3
State Key Laboratory of Solidification Processing, School of Materials Science and Engineering, Northwestern Polytechnical University, Xi’an 710072, China
*
Author to whom correspondence should be addressed.
Metals 2019, 9(5), 595; https://doi.org/10.3390/met9050595
Submission received: 5 May 2019 / Revised: 17 May 2019 / Accepted: 21 May 2019 / Published: 23 May 2019

Abstract

:
The purpose of the present work is to investigate the fracture behavior of anisotropic sheet metal under various stress states. Notched tension and flat-grooved tension tests at 0°, 45°, and 90° directions with respect to rolling direction were carried out by a hybrid experimental–numerical approach, and then a novel damage model was proposed by coupling Hill48’s criterion. Based on this, finite element method (FEM) analysis models were established. The force–displacement responses of experiments and simulations are in good agreement, which verify the FEM models. The predictability of the damage model established for the fracture behavior of anisotropic materials was studied by comparing the fracture displacements between experiments and simulations. It is found that the predictability of novel damage model is basically consistent with predictive results. The difference of damage locations and local strain evolutions at a 45° direction is greater than the other directions. In addition, stress triaxiality does not play a predominant role in the fracture process for notched tension specimens, while it does play a predominant role for flat-grooved tension specimens.

Graphical Abstract

1. Introduction

The rolling process is a primary manufacturing operation for plates, and it inevitably forms the anisotropic properties. Therefore, anisotropic ductile fracture behavior is an important challenge in the forming of aluminum alloy plates.
The micro-mechanisms of ductile fracture are the nucleation, growth, and coalescence of voids. Ductile fracture has different mechanisms under different stress triaxiality conditions. Void growth mechanism predominates at high stress triaxiality, and shear fracture dominates at low stress triaxiality. Hence, many researchers have taken various stress states into account for anisotropic ductile fracture behavior. Fourmeau et al. [1] studied the anisotropic fracture behavior of an AA7075-T7651 aluminum plate under various stress states, using experimental and numerical methods. However, the difference in the present work is that the novel damage model is emphasized in the analysis of ductile fracture behavior for an anisotropic AA7050-T7451 plate. Luo et al. [2] proposed a simple phenomenological fracture model to study the influence of stress states on the anisotropic ductile fracture of a 6260-T6 anisotropic aluminum alloy, using a hybrid experimental–numerical approach. Therefore, it is found that the hybrid experimental–numerical approach is a primary method to study the ductile fracture behavior for an anisotropic aluminum alloy.
Efforts have been made in the development of anisotropic fracture behavior. The effect of non-spherical voids [3,4] was investigated by an extended Gurson model, which considered the effect of anisotropy on plasticity [5]. Chen and Dong [6] modified the Gurson–Tvergaard–Needleman (GTN) model by coupling Hill48’s quadratic anisotropic yield criterion, which was applied to analyze deformation and damage in an aluminum alloy sheet. Steglich et al. [4] used a micromechanics-based damage model to investigate the anisotropic fracture behavior of the 2024-T351 aluminum alloy and illustrate the effect of the void aspect ratio and void distribution. Beese et al. [7] used a new fracture model proposed by Wierzbicki and Xue [8], and then modified this idea in the framework of a modified Mohr–Coulomb fracture model. The Mohr-Coulomb fracture model was developed by Bai and Wierzbicki [9] which incorporate the effect of plasticity anisotropy on the fracture modeling of aluminum alloy 6061-T6 sheets, so, the Mohr-Coulomb fracture model becomes modified Mohr-Coulomb fracture model. Jansen et al. [10] applied an anisotropic stress-based criterion to identify the forming limit diagram (FLD) of a textured zinc sheet by means of tensile and bulge tests. Stoughton and Yoon [11] modified the Mohr–Coulomb fracture model for anisotropic sheet materials under triaxial stress conditions. Recently, Park et al. [12,13] modified the Lou–Huh ductile fracture criterion [14], using Hill48’s anisotropic yield function to model the fracture-based forming limit criteria for anisotropic materials. Cao et al. [15] studied the ductile fracture behavior of an anisotropic AA 7050-T7451 aluminum alloy by coupling the Hill’s criterion into a modified elliptical fracture criterion. In order to investigate the damage evolution of anisotropic AA 7050-T7451 aluminum alloy on high stress triaxiality, this paper proposed a damage model by coupling Hill’s criterion based on the Rice–Tracey (R-T) model.
Anisotropic ductile fracture behavior has been investigated by many researchers, while the effect of stress states and plasticity anisotropy on ductile fracture had not been clearly investigated. In the present work, a novel damage model is proposed by coupling Hill48’s criterion, and then the finite element method (FEM) analysis models are established. The influence of the stress state and plasticity anisotropy on the ductile fracture behavior of 7050-T7451 aluminum alloy plate was focused by using a hybrid experimental–numerical approach. The force–displacement responses and predictive ability of the damage model established for anisotropic materials were also investigated to calibrate damage models. The damage and strain evolutions were analyzed to investigate the effect of different stress states and plasticity anisotropy on the fracture process.

2. Materials and Methods

2.1. Materials and Experiment

An anisotropic 7050-T7451 aluminum alloy plate was processed into tensile specimens with different shapes, which are notched specimens (thickness of 2 mm) and flat-grooved specimens (thickness of 2.5 mm), as shown in Figure 1. The notched specimens with three different notch radii (R = 1.5 mm, 4.5 mm, and 25 mm) and the flat-grooved specimens with three different groove radii (R = 4 mm, 8 mm, and 12 mm) were all processed into three rotation angles—0°, 45°, and 90°—with respect to the rolling direction, respectively. The notched and flat-grooved tension tests were conducted on an Instron 3382 testing machine (Instron (Shanghai), Shanghai, China), at a constant cross head velocity of 1 mm/min. The digital image correlation (DIC) technique was used to record the strain field evolution of the specimen in the deformation processes. A thin layer of white paint was applied on the surface of the specimens, and matted black speckles were sprayed evenly on the white layer. The displacements of all tests were obtained from the DIC technique, which was carried out by DIC equipment (Xi’an Jiaotong University, Xi’an, China). Three repeated specimens have been carried out for every experiment.

2.2. Characterization of the Stress State

Hill48’s criterion was used to characterize plasticity anisotropy in the sheet metal forming process. The Hill48’s criterion can be expressed as:
σ ¯ H 2 = F ( σ y y σ z z ) 2 + G ( σ z z σ x x ) 2 + H ( σ x x σ y y ) 2 + 2 L τ y z 2 + 2 M τ z x 2 + 2 N τ x y 2
where F, G, H, L, M, and N are the anisotropic parameters of Hill48’s criterion; σ x x , σ y y , and σ z z are the normal stresses in the rolling (RD), transverse (TD), and thickness (ND) directions, respectively; and τ y z , τ x z , and τ x y are shear stresses in the TD–ND, RD–ND, and RD–TD planes, respectively. Stress triaxiality is generally defined as the ratio of mean stress σ m to von Mises equivalent stress σ ¯ V , which is isotropic. However, the stress triaxiality [13] is newly defined by coupling Hill48’s criterion for anisotropic materials (replace σ ¯ V with σ ¯ H )
R H = σ m σ ¯ H = 1 3 σ 1 + σ 2 + σ 3 ( σ 1 σ 3 ) 2 T ,
L e = 2 σ 2 σ 1 σ 3 σ 1 σ 3 ,
T = F ( 1 + L e 2 cos 2 ω + sin 2 ω ) 2 + G ( cos 2 ω + 1 + L e 2 sin 2 ω ) 2   + ( H cos 2 2 ω + N 2 sin 2 2 ω ) ( 1 L e 2 ) 2 ,
where σ 1 , σ 2 , and σ 3 are the principal stresses; L e is the Lode parameter; ω is the rotation angle between the anisotropic coordinate system and the principal stress coordinate system; and T is the Huh parameter, related to anisotropic parameters and rotation angle ω . In addition, the thickness direction (ND) coincides with the principal stress direction in the sheet metal forming.
If the effect of anisotropy is considered, then stress triaxiality is a function of the Lode parameter and rotation angle ω under plane stress conditions ( σ 1 , σ 2 ,   or   σ 3 = 0 ), as shown in Figure 2, the space of ( R H , L e , ω ) is the relation between stress triaxiality, Lode parameter, and rotation angle. The plane strain tension, as well as the pure shear and plane strain compression tests, have the characteristics of both plane stress and plane strain. It should be noted that stress triaxiality in the Figure 2 is in the uniform forming deformation, except for large localized deformation, since stress triaxiality can largely change. The rotation angle ω indicates the relationship between plasticity anisotropy and stress state. In the tensile tests, the maximum tensile stress direction is the principal stress direction, so ω is the angle between maximum tensile stress direction and rolling direction (RD). The stress state is complex in the root of notch, while the rotation angle ω does not change (as shown in Figure 3). This is because the change is only on the magnitude of the maximum and middle principal stresses, but the directions do not change with the change of the notch radius.

2.3. Characterization of the Damage Variable

The damage variable can be characterized by an apparent elastic modulus based on the continuum damage mechanic [16,17]; its form can be described as
D = 1 E D E 0 ,
where E D is the apparent elastic modulus and E 0 is initial elastic modulus. Based on the reference [18], the ductile damage of uniaxial tensile specimen can be developed as
D = 1 e P ε p + P 0 ,
where P and P 0 are constants related to the materials. In order to determine the parameters P and P 0 , the relationship between the apparent and initial elastic modulus can be obtained by combining Equations (5) and (6):
E D = E 0 e P ε p + P 0 .
The Rice–Tracey (R-T) model [19] considers the effect of the growth and shape changes of spherical voids. Inspired by the R-T model, the damage model is developed by coupling the Hill48’s criterion as
D = f ( R H ( ω ) , L e ) ( 1 e P ε ¯ p + P 0 ) ,
f ( R H , L e ) = ( 0.279 0.004 L e ) e 1.5 R H ( 0.279 + 0.004 L e ) e 1.5 R H .
In Equation (9), L e is defined as a plastic strain rate tensor, which is equal to the quantity using a stress deviator based on von Mises plasticity. In this study, as 0.004 L e is very small influence factor, the difference of L e calculated by the plastic strain rate tensor and stress deviator induced by Hill Plasticity is ignored. The damage variable can be normalized by dividing the critical damage variable D C , which is related to material orientation, and the normalized damage variable is expressed as
D N = D ( ω ) D C ( θ ) ,
where D ( ω ) is the accumulated damage variable related to stress states, and the critical damage variable D C is function of the angle θ , which is between the direction of maximum principal stress for the cutting specimen and rolling direction, as shown in Figure 4a. The difference between the definitions of θ and ω can be seen in Figure 4. In addition, the difference is determined by substituting the fracture strain of uniaxial tensile specimens at θ into Equation (8). Only when the angles θ and ω are equal each other can Equation (10) can be established.
The accumulation of damage of anisotropic materials in the loading path by the incremental form can be adopted as
Δ D i = f i ( R H , L e ) P e P ε i + P 0 Δ ε i , i = 1 , 2 , , k ,
where k is the number of load steps. The accumulation of damage D i of anisotropic materials in the forming process can be expressed as
D i = D i 1 + Δ D i .
where D i and D i 1 are the damage variable at incremental step of i and i−1, Δ D i is defined in the Equation (11).

2.4. Determination of Anisotropy and Damage Parameters

The normal anisotropic coefficient r is an important material parameter to evaluate forming ability in sheet metal, and it is defined as
r = ε b ε t ,
where ε b is the transverse strain and ε t is the thickness strain. The r value reflects the difference of deformation ability between in-plane and thickness directions. It is regarded as isotropy when r is 1. On the contrary, r 1 is regarded as anisotropy. From the microscopic view, this is related to preferred orientation of grains.
The important in-plane directions are 0°, 45°, and 90° with respect to the rolling direction, in terms of plasticity anisotropy. The normal anisotropic coefficient r is determined by averaging the r values (anisotropy index) at 0°, 45°, and 90° with respect to the rolling direction: r 0 , r 45 , and r 90 , respectively. Therefore, the coefficient is expressed as
r = r 0 + 2 r 45 + r 90 4 .
The anisotropic difference Δ r of the in-plane direction is expressed as
Δ r = r 0 2 r 45 + r 90 2 ,
The anisotropic parameters F, G, H, and N in the plane stress condition were determined from the values of r at the 0°, 45°, and 90° directions [20]:
F = r 0 r 90 ( 1 + r 0 ) ,
G = 1 1 + r 0 ,
H = r 0 1 + r 0 ,
N = ( r 0 + r 90 ) ( 1 + 2 r 45 ) 2 r 90 ( 1 + r 0 ) ,
The r values were determined by the ratio of the transverse strain to longitudinal strain k θ , which is expressed as
r θ = k θ 1 + k θ .
Here, k θ can be measured by the DIC technique; r 0 , r 45 , r 90 , r , Δ r , F, G, H, and N are determined and are listed in Table 1 by uniaxial tension tests with the DIC technique. The normal anisotropic coefficient r is determined as 0.9355, which reflects that the direction of thickness is easier to deform. In addition, Δ r is determined as −0.6874, which reflects that the lug formed on the tube-shaped parts in sheet drawing process easily occurs at the ± 45° directions with respect to the rolling direction.
The local fracture strains of the uniaxial tensile specimens at the 0°, 45°, and 90° directions were determined by the DIC technique. The damage parameters P and P 0 were determined by loading and unloading tension tests at the 0°, 45°, and 90° directions, as Figure 5a–c shows. The relationship between ln(1-D) and plastic strain at the 0°, 45°, and 90° directions are shown in Figure 5d; then the data points are fitted by linear equation, and so the parameters P and P 0 are determined. Stress triaxiality and the Lode parameter are not 1/3 and −1 at fracture under the uniaxial tension state because of necking on the tension process. Therefore, the stress triaxiality and Lode parameters at the fracture point were determined using the hybrid experimental–numerical method, considering the effect of necking. Therefore, the critical damage variable can be determined by Equations (8) and (9). Table 2 lists all the damage parameters. Critical damage variable D C cannot completely reflect the ductility of material. D C is lowest at the 45°direction—however, the ductility is not lowest in the three directions, because the magnitude of P and P 0 are also influencing factors, and the equivalent plastic fracture strain is a rational indicator to evaluate ductility. The relationship between critical damage variable D C and different θ is fitted by the three data at the 0°, 45°, and 90° directions with respect to rolling direction, as shown in Figure 6. The relationship is expressed as
D C = 0.15205 θ 2 0.25401 θ + 0.2584 .

2.5. Numerical Simulation

The three-dimensional (3D) finite element models of notched and flat-grooved tension specimens were built using the ABAQUS 6.14 /Explicit FEM package (SIMULIA, Wakeison, France ) and user subroutine VUMAT, by embedding Hill48’s criterion. To accurately simulate the elastic–plastic behavior at large localized deformation, the optimized stress-strain curves after necking are needed for FEM modeling. As Luo et al. [2] discuss, the widely-used Swift constitutive equation overestimates the force–displacement curve (pink pentagon in Figure 7a) because of its unsaturated characteristic. The Voce constitutive equation underestimates the curve (blue triangle in the Figure 7a) because of its saturated characteristic. In order to obtain a better prediction of the force–displacement response, a combined Swift–Voce (S-V) equation was used to describe the hardening curve, including the uniform and post-necking part (red circle in the Figure 7a). The S-V law was continually optimized in the simulation of a notched specimen (R = 4.5mm), and provides an accurate prediction of the force–displacement curve, as shown in Figure 7b. Therefore, the hardening model in this study is expressed as
σ = { E ε e ,   f o r   σ < σ s q ( K ( ε p + ε 0 ) n ) + ( 1 q ) ( σ 0 A exp ( β ε p ) ) ,   f o r   σ σ s ,
where E is the elastic modulus, ε e is the elastic strain, σ s is the yield stress, K is the strength coefficient, ε p is the plastic strain, ε 0 is the offset strain, n is the strain hardening index, σ 0 is the saturated stress, A and β are material parameters for the Voce equation, and q is the weight factor. The parameters are listed in Table 3.
Although plasticity anisotropy exists, a quarter of the specimen was applied in the 3D finite element models, to save computing resources for the symmetric load and geometry of the notched and flat-grooved tension specimens. The specimens were meshed with eight-node hexahedra elements with reduced integration (C3D8R), and the meshes near the notches and grooves were refined, as shown in Figure 8. The meshes were refined until the maximum equivalent stress converged. In Figure 8, PLT is an abbreviation of the plane strain tension, according to the strain state of the flat-grooved tension specimens.

3. Results

3.1. Calibration of Finite Element Models

Figure 9, Figure 10 and Figure 11 demonstrate the comparisons of force–displacement responses between experiment and simulation at 0°, 45°, and 90° directions for notched tensile specimens (R = 1.5 mm, 4.5 mm, and 25 mm correspond to Figure 9, Figure 10 and Figure 11, respectively), which present good agreement. Therefore, the FEM models of the notched tension tests are validated. In addition, the evolution of local equivalent plastic strain obtained from the FEM is shown in the figures. The displacement of the 45° direction is larger than the other two directions, while the local equivalent plastic strain is lowest. With the increase of the notch radius, the equivalent plastic strains of three directions do not have large differences.
Figure 12, Figure 13 and Figure 14 demonstrate the comparisons of force–displacement responses between experiments and simulations at the 0°, 45°, and 90° directions for flat-grooved specimens (R = 4 mm, 8 mm, and 12 mm correspond to Figure 12, Figure 13 and Figure 14, respectively). In addition, the evolution of the equivalent plastic strain is shown in these figures. The comparisons show good agreement, which validates the FEM models for plane strain tension tests. As can be observed from Figure 12, Figure 13 and Figure 14, these force–displacement responses almost have no necking regions, and the fracture strain is low because of high stress triaxiality for plane strain tension, as shown in Figure 1.
Figure 15 shows the relative predicted fracture displacement between experiments and simulations, using the anisotropic damage model for notched tension and flat-grooved specimens at the 0°, 45°, and 90° directions. The dotted line in Figure 15 represents a level of prediction accuracy of 100%. The results show that simulation of five cases (specimens R25 (45°, 90°), PLT-R4 (45°), PLT-R8 (45°), and PLT-R12 (45°)) is in good agreement with the experiments, while the predictive results of other cases show an absolute error of 11.44%~32.26%, as listed in Table 4. From Table 4, the predictive error of notched tension and flat-grooved specimens with 45° is lower than that of the two other directions (0° and 90°). The reason for the larger absolute error for these 13 specimens is probably that the localized necking easily induces a large absolute error.

3.2. Analysis of Failure Locations

Figure 16 and Figure 17 show the damage contour maps of notched and flat-grooved tension specimens at the 0°, 45°, and 90° directions. It can be obviously seen that the damage localization at the 45° direction is less than that at the 0° and 90° directions for the R1.5 specimen, which illustrates that diffuse necking dominates at the 45° direction and localized necking dominates at the 0° and 90° directions. However, the difference continually decreases with the decrease of stress concentration, as the R4.5 and R25 specimens show in Figure 16. In addition, the locations of the damage concentration transfer from side to center with the decrease of stress concentration. This indicates that the effect of localized necking increases under a low-stress concentration condition. In Figure 17, with the decrease of stress concentration at the groove, the damage concentration region reduces to center. Therefore, the larger the groove radius, the more localized is the deformation at center. The damage distributions at the 45° direction are not at center with the increase of the groove radius, which is different from that at the 0° and 90° directions. The damage along the thickness direction at the 0° direction has different distributions from other directions.
Figure 18 and Figure 19 show the stress triaxiality and damage distributions along the half cross-section for notched and flat-grooved tension specimens at fracture. In Figure 18, with the decrease of stress concentration, the maximum stress triaxiality region transfers from side to center, and the distribution at the 45° direction has a large difference compared to the others. The distributions of stress triaxiality and damage are not entirely consistent, which indicates that stress triaxiality plays a very important role in the fracture process, but not a dominant role. In Figure 19, the stress triaxiality and damage have similar tendencies, which present a high tendency at center and a low tendency at the side. That is because that plane stress condition is at the side and the plane strain condition is at the center. However, the effect of plasticity anisotropy is responsible for some differences of the stress triaxiality and damage in the center. This indicates that stress triaxiality plays a predominant role in the fracture process for flat-grooved tension specimens.

3.3. Evolutions of Equivalent Plastic Strain and Damage

Figure 20 shows the relationship between equivalent plastic strain and stress triaxiality at the 0°, 45°, and 90° directions for notched and flat-grooved tension specimens. In Figure 20a, the local fracture strain of notched specimens at 0° is the largest, and is the lowest at 45°. The small and large variation tendency of stress triaxiality reflects that the damage-concentrated area is in the root of notch and in the center of the specimen. In other words, localized necking leads to a larger variation of stress triaxiality. In Figure 20b, the stress triaxiality at the 45° direction is larger than the other two directions, and it increases with the decrease of the groove radius. In addition, the strain increases with the decrease of groove radius, which indicates that the higher the strain is, the less the stress triaxiality under plane strain tension condition is. The reason is that the void grows rapidly in high stress triaxiality. The strain evolution for flat-grooved specimens is similar, because necking is hard under high stress triaxiality conditions. Therefore, local necking has a small effect on the fracture process. The stress triaxiality has faster growth rate at first, and has a steady growth trend at the end.
Figure 21 shows the damage evolution at the 0°, 45°, and 90° directions for notched and flat-grooved tension specimens. The strain of flat-grooved specimens is lower than that of notched specimens when equivalent plastic strain reaches critical damage. In addition, the larger the notch and groove radii are, the more strain it is to reach critical damage is. The relationship between damage and equivalent plastic strain is close to linear.

4. Discussion

The plasticity anisotropy has a different effect on the necking region. There are two kinds of necking, diffuse necking and localized necking, in the process of instability, as shown in Figure 22. Diffuse and localized necking types competitively affect the large deformation process. If diffuse necking is dominant, then the local large deformation slowly diffuses, derived by shear deformation. Since the ductility along the 0° direction is best, the local deformation easily occurs along this direction. Therefore, the 45° direction is prone to form shear deformation, and then the diffuse necking dominates after the onset of necking. As a result, the displacement of 45° direction is large, and its localized strain is lowest because of its predominantly diffuse necking, as shown in Figure 9b, Figure 10b, and Figure 11b. In addition, the 0° and 90° directions do not promote the formation of shear deformation. Therefore, localized necking plays a major role in the necking region, and then the local strain is high.
Figure 23 shows scanning electron microscope (SEM) images of the fracture surfaces for notched tension (R4.5) and flat-grooved tension (PLT-R8) specimens at the 0°, 45° and 90° directions. An obvious difference between Figure 23a–c and Figure 23d–f is that the number of dimples for the former is larger than the latter. The reason is that the stress triaxiality of notched tension specimens is less than that of flat-grooved tension specimens. A common microstructural characteristic of the 7xxx series of aluminum alloy is the existence of precipitate-free zones (PFZ), which are generally located near the grain boundaries [1]. As a result, the fracture surfaces seem to be intergranular ductile fractures with voids, as some smooth surfaces and voids are shown in Figure 23. There are fewer voids and the smooth surfaces of Figure 23b are larger than on the other facture surfaces of the notched specimens. This proves that diffuse necking dominates in the necking region at the 45° direction. It has no large difference for different directions at flat-grooved tension fracture surfaces, as shown in Figure 23d–f. Several shear surfaces in combination with some voids exist, which reflect the low ductility of plane strain tension.

5. Conclusions

The ductile fracture behavior of an anisotropic 7050-T7451 aluminum alloy plate was investigated by a hybrid experimental–numerical approach. A damage model was proposed to predict the fracture behavior for anisotropic materials at the 0°, 45°, and 90° directions. The conclusions drawn are as follows:
(1)
Stress concentration and necking together affect the location of fracture onset for notched specimens. With the increase of stress triaxiality, the fracture location transfers from the center to the root of the notch. In addition, diffuse necking dominates at the 45° direction and localized necking dominates at the 0° and 90° directions.
(2)
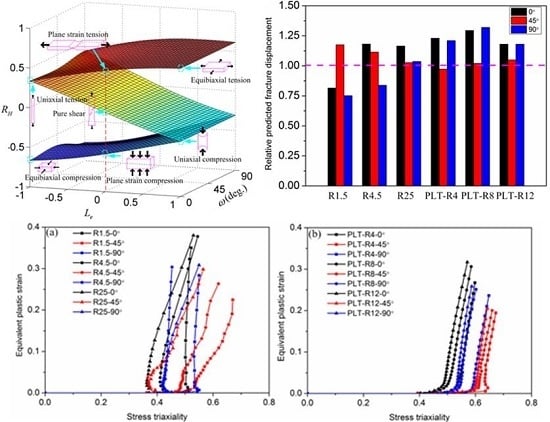
The predictability of the novel damage model presents good result for five cases (specimens R25 (45°, 90°), PLT-R4 (45°), PLT-R8 (45°), and PLT-R12 (45°)), while the predictive results of other cases show an absolute error of 11.44%~32.26%. The predictive error of notched tension and flat-grooved specimens with 45° is lower than that of two other directions (0° and 90°). The fracture strain of the notched tension specimen is larger than the flat-grooved specimen, and the fracture strain increases with the decrease of the notch and groove radii. In addition, the fracture strain at the 0° direction is highest.
(3)
Stress triaxiality plays a very important role in the fracture process, but not a dominant role for notched tension specimens; however, it plays a major role for flat-grooved tension specimens. The effect of plasticity anisotropy is responsible for some differences of stress triaxiality and damage in the center.
(4)
Diffuse and localized necking types competitively affect the fracture processes at the 0°, 45°, and 90° directions. Diffuse necking dominates at the 45° direction, while localized necking dominates at the 0° and 90° directions. The effect of the two necking types decreases with the decrease of stress concentration.

Author Contributions

H.Z. (Hua Zhang) and H.Z. (Hong Zhang) conceived and designed the experiments, derived the theoretical framework, and conducted the writing (original draft preparation). F.L. revised the original draft and provided constructive suggestions. J.C. performed the experiments and simulations.

Funding

This research was funded by Natural Science Foundation of China [Grant No. 51275414], as well as the Research Fund of the State Key Laboratory of Solidification Processing (NWPU) of China [Grant No.130-QP-2015].

Acknowledgments

The authors are very grateful for the suggestions of Fuguo Li.

Conflicts of Interest

The authors declare no conflict of interest.

References

  1. Fourmeau, M.; Børvik, T.; Benallal, A.; Hopperstad, O.S. Anisotropic failure modes of high-strength aluminium alloy under various stress states. Int. J. Plast. 2013, 48, 34–53. [Google Scholar] [CrossRef] [Green Version]
  2. Luo, M.; Dunand, M.; Mohr, D. Experiments and modeling of anisotropic aluminum extrusions under multi-axial loading—Part II: Ductile fracture. Int. J. Plast. 2012, 32–33, 36–58. [Google Scholar] [CrossRef]
  3. Bron, F.; Besson, J. Simulation of the ductile tearing for two grades of 2024 aluminum alloy thin sheets. Eng. Fract. Mech. 2006, 73, 1531–1552. [Google Scholar] [CrossRef]
  4. Steglich, D.; Brocks, W.; Heerens, J.; Pardoen, T. Anisotropic ductile fracture of Al 2024 alloys. Eng. Fract. Mech. 2008, 75, 3692–3706. [Google Scholar] [CrossRef] [Green Version]
  5. Benzerga, A.A.; Besson, J.; Pineau, A. Anisotropic ductile fracture: Part II: Theory. Acta Mater. 2004, 52, 4639–4650. [Google Scholar] [CrossRef]
  6. Chen, Z.; Dong, X. The GTN damage model based on Hill’48 anisotropic yield criterion and its application in sheet metal forming. Comput. Mat. Sci. 2009, 44, 1013–1021. [Google Scholar] [CrossRef]
  7. Beese, A.M.; Luo, M.; Li, Y.; Bai, Y.; Wierzbicki, T. Partially coupled anisotropic fracture model for aluminum sheets. Eng. Fract. Mech. 2010, 77, 1128–1152. [Google Scholar] [CrossRef]
  8. Wierzbicki, T.; Xue, L. On the Effect of the Third Invariant of the Stress Deviator on Ductile Fracture; Technical Report No. 136; Impact and Crashworthiness Laboratory: Cambridge, MA, USA, 2005. [Google Scholar]
  9. Bai, Y.; Wierzbicki, T. Application of extended Mohr-Coulomb criterion to ductile fracture. Int. J. Fract. 2010, 161, 1. [Google Scholar] [CrossRef]
  10. Jansen, Y.; Logé, R.E.; Milesi, M.; Massoni, E. An anisotropic stress based criterion to predict the formability and the fracture mechanism of textured zinc sheets. J. Mater. Process. Technol. 2013, 213, 851–855. [Google Scholar] [CrossRef]
  11. Stoughton, T.B.; Yoon, J.W. Modified Mohr-Coulomb fracture model for anisotropic sheet materials under limited triaxial stress conditions. AIP Conf. Proc. 2013, 1567, 562–566. [Google Scholar]
  12. Park, N.; Huh, H.; Yoon, J.W.; Stoughton, T.B.; Rolfe, B.; Beynon, J.H.; Hodgson, P. Anisotropy effect on the stress-based fracture forming limit diagram using a modified Lou-Huh ductile fracture criterion. AIP Conf. Proc. 2013, 1567, 370–373. [Google Scholar]
  13. Park, N.; Huh, H.; Lim, S.J.; Lou, Y.; Kang, Y.S.; Seo, M.H. Facture-based forming limit criteria for anisotropic materials in sheet metal forming. Int. J. Plast. 2017, 96, 1–35. [Google Scholar] [CrossRef]
  14. Lou, Y.; Huh, H. Extension of a shear-controlled ductile fracture model considering the stress triaxiality and the Lode parameter. Int. J. Solids Struct. 2013, 50, 447–455. [Google Scholar] [CrossRef]
  15. Cao, J.; Li, F.; Ma, X.; Sun, Z. Study of fracture behavior for anisotropic 7050-T7451 high-strength aluminum alloy plate. Int. J. Mech. Sci. 2017, 128–129, 445–458. [Google Scholar] [CrossRef]
  16. Lemaitre, J.; Dufailly, J. Damage measurements. Eng. Fract. Mech. 1987, 28, 643–661. [Google Scholar] [CrossRef]
  17. Tasan, C.C.; Hoefnagels, J.P.M.; Geers, M.G.D. Identification of the continuum damage parameter: An experimental challenge in modeling damage evolution. Acta Mater. 2012, 60, 3581–3589. [Google Scholar] [CrossRef] [Green Version]
  18. Cao, J.; Li, F.; Li, P.; Ma, X.; Li, J. Analysis of ductile–brittle competitive fracture criteria for tension process of 7050 aluminum alloy based on elastic strain energy density. Mater. Sci. Eng. A 2015, 637, 201–214. [Google Scholar] [CrossRef]
  19. Rice, J.R.; Tracey, D.M. On the ductile enlargement of voids in triaxial stress fields. J. Mech. Phys. Solids 1969, 17, 201–217. [Google Scholar] [CrossRef]
  20. Panich, S.; Uthaisangsuk, V.; Suranuntchai, S.; Jirathearanat, S. Investigation of anisotropic plastic deformation of advanced high strength steel. Mater. Sci. Eng. A 2014, 592, 207–220. [Google Scholar] [CrossRef]
Figure 1. Shapes of specimens for (a) notched tension and (b) flat-grooved tension (all units are in mm; black dots indicate the start and end points of the digital image correlation (DIC) extensometer).
Metals 09 00595 g001
Figure 2. Seven stress states in the space of ( R H , L e , ω ) with plane stress conditions.
Metals 09 00595 g002
Figure 3. The relationship between anisotropy and principal stress coordinate systems under uniaxial tension with a notch state.
Metals 09 00595 g003
Figure 4. The difference between the definitions of (a) θ and (b) ω .
Metals 09 00595 g004
Figure 5. The stress strain curves of loading and unloading at (a) 0°, (b) 45°, and (c) 90° directions, as well as (d) the linear fitting relation between ln(1-D) and plastic strain ε p .
Metals 09 00595 g005
Figure 6. The relation between the critical damage variable and θ .
Metals 09 00595 g006
Figure 7. (a) Optimizing strain hardening extrapolations over larger strains; (b) predictions of force–displacement responses using different strain hardening laws.
Metals 09 00595 g007
Figure 8. Mesh design of notched tension specimens (a) R1.5, (b) R4.5, and (c) R 25, as well as flat-grooved tension specimens (d) PLT-R4, (e) PLT-R8, and (f) PLT-R12.
Metals 09 00595 g008
Figure 9. Comparisons of force–displacement responses between experiments and simulations, as well as the strain evolutions at the failure material point for notched tension R = 1.5 mm, at the (a) 0°, (b) 45°, and (c) 90° directions (PEEQ represents equivalent plastic strain).
Metals 09 00595 g009
Figure 10. Comparisons of force–displacement responses between experiments and simulations, as well as the strain evolutions at the failure material point for notched tension R = 4.5 mm, at the (a) 0°, (b) 45°, and (c) 90° directions (PEEQ represents equivalent plastic strain).
Metals 09 00595 g010
Figure 11. Comparisons of force–displacement responses between experiments and simulations, as well as the strain evolutions at the failure material point for notched tension R = 25 mm, at the (a) 0°, (b) 45°, and (c) 90° directions (PEEQ represents equivalent plastic strain).
Metals 09 00595 g011
Figure 12. Comparisons of force–displacement responses between experiments and simulations, as well as the strain evolutions at the failure material point for flat-grooved tension R = 4 mm at the (a) 0°, (b) 45°, and (c) 90° directions (PEEQ represents equivalent plastic strain).
Metals 09 00595 g012
Figure 13. Comparisons of force–displacement responses between experiments and simulations, as well as the strain evolutions at the failure material point for flat-grooved tension R = 8 mm at the (a) 0°, (b) 45°, and (c) 90° directions (PEEQ represents equivalent plastic strain).
Metals 09 00595 g013
Figure 14. Comparisons of force–displacement responses between experiments and simulations, as well as the strain evolutions at the failure material point for flat-grooved tension R = 12 mm at the (a) 0°, (b) 45°, and (c) 90° directions (PEEQ represents equivalent plastic strain).
Metals 09 00595 g014
Figure 15. The relative difference of predicting fracture displacement between experiments and simulations using an anisotropic damage model.
Metals 09 00595 g015
Figure 16. Damage distributions at the fracture for notched tension specimens at the 0°, 45°, and 90° directions.
Metals 09 00595 g016
Figure 17. Damage distributions at the fracture for flat-grooved tension specimens at 0°, 45°, and 90° directions.
Metals 09 00595 g017
Figure 18. Comparisons between stress triaxiality and damage distribution at fracture along the half cross-section for notched specimens (a) R1.5, (b) R4.5, and (c) R25.
Metals 09 00595 g018
Figure 19. Comparisons between stress triaxiality and damage distribution at fracture along the half cross-section for flat-grooved tension specimens (a) PLT-R4, (b) PLT-R8, and (c) PLT-R12.
Metals 09 00595 g019
Figure 20. Strain evolutions at fracture onset point for (a) notched tension specimens and (b) flat-grooved tension specimens.
Metals 09 00595 g020
Figure 21. Damage evolution at the (a) 0°, (b) 45°, and (c) 90° directions for notched and flat-grooved tension specimens.
Metals 09 00595 g021
Figure 22. Schematic diagrams of diffuse and localized necking.
Metals 09 00595 g022
Figure 23. Scanning electron microscope (SEM) images of fracture surfaces for (ac) notched tension specimens and (df) flat-grooved tension specimens.
Metals 09 00595 g023
Table 1. The anisotropic parameters of an AA7050-T7451 plate at the 0°, 45°, and 90° directions.
r 0 r 45 r 90 r Δ r FGHN
0.41431.27920.76940.9355−0.68740.38070.70710.29291.9354
Table 2. The anisotropic damage parameters used in the finite element method (FEM).
Materials OrientationPP0 ε ¯ p f R H L e D C
1.79−0.05050.31540.5856−0.61110.2584
45°1.39−0.07880.32640.4084−0.66050.1527
90°2.07−0.07230.27760.5208−0.98230.2344
Table 3. Parameters of constitutive models in the FEM for an AA7050-T7451 plate.
Kn ε 0 σ 0 A β
8270.163160.0023360015318.96
Table 4. The absolute error of predicting fracture displacement between experiments and simulations using an anisotropic damage model.
Materials OrientationR1.5 (%) R4.5 (%)R25 (%)PLT-R4 (%)PLT-R8 (%)PLT-R12 (%)
18.4518.1816.4823.429.518.18
45°17.5211.442.72.7072.325.32
90°24.8216.23.6321.1132.2618.22

