Article

Study on Microstructure and Properties of Tailored Hot-Stamped U-shaped Parts Based on Temperature Field Control

1
Rolling Forging Research Institute, Jilin University, Changchun 130025, China
2
College of Material Science and Engineering, Jilin University, Changchun 130025, China
*
Authors to whom correspondence should be addressed.
Metals 2019, 9(5), 593; https://doi.org/10.3390/met9050593
Submission received: 19 March 2019 / Revised: 19 May 2019 / Accepted: 20 May 2019 / Published: 23 May 2019

Abstract

:
In order to meet the needs of the automotive industry, it is necessary to produce “tailored” parts. The U-shaped die equipped with a high-speed airflow device was designed to conduct the hot stamping experiments. The microstructure, micro-hardness, tensile properties, and fracture behavior of the parts were analyzed. The experimental results showed that the quenched phase of the hardened section was mainly martensite, and the micro-hardness and tensile strength could reach 445 HV and 1454 MPa, respectively. The fracture mechanism was brittle fracture. For the toughness section, as the tool temperature increased from 300 to 600 °C, both micro-hardness and tensile strength decreased. Meanwhile, the area fractions of bainite and ferrite increased, and the area fraction of martensite reduced. The fracture behavior was plastic fracture.

1. Introduction

Hot stamping parts of high-strength steel can realize the lightweight of automobiles [1]. However, hot stamping parts of high-strength steel with fully martensitic microstructure (high tensile strengths of approximately 1500 MPa and Vickers hardness values in excess of 425 HV) cannot absorb energy in the event of a car collision due to the low toughness [2]. Therefore, it is necessary to produce parts with tailored mechanical properties to meet the needs of the automotive industry. Common methods of producing tailored parts can be classified into four categories. First, laser welding technology is used to produce tailored parts. Múnera et al. [3] developed components using tailor welded blanks composed of both hot forming steel and steel which is not so easily hardened. Second, partial austenitizing is a feasible process. Mori et al. [4] carried out hot stamping experiments using bypass resistance heating and have obtained parts with a strength distribution. Third, tailored parts can also be obtained by the post-tempering of fully hardened parts. Wang et al. [5] performed experiments with different annealing processes and obtained tailored parts. Fourth, locally reducing the cooling rate of blanks provides an effective way to produce tailored parts. The cooling rate of sheet metal can be reduced locally by changing the temperature of the die. The operation is simple and the parts have good formability and high forming accuracy.
The analysis of transformation products is based on the continuous cooling transformation (CCT) diagram of B1500HS high strength steel shown in Figure 1a [6]. According to the CCT diagram, the quenching rate less than the critical cooling rate (for example, as shown by curve 3 in Figure 1a) will result in the formation of softer phases, such as ferrite and bainite. When the quenching rate is higher than the critical cooling rate (for example, as shown by curve 1 in Figure 1a), a fully martensitic condition is formed. Therefore, by controlling the cooling rate of the blank, it is possible to form regions of very high strength and regions of low strength but high ductility, resulting in a component with tailored mechanical properties. George et al. [7] produced a lab-scale hot-formed B-pillar by controlling die temperature and studied the microstructure and properties of the anti-invasion area and the energy absorption area. They achieved a hardness and ultimate tensile strength (UTS) of the energy absorption area that was reduced by 52% and 49%, respectively, compared with the anti-invasion area. Zhang et al. [8] performed similar studies with die temperatures up to 500 °C and achieved hardness levels of 230 HV in the slow cooling zone and 470 HV in the quenching zone. Zhou et al. [9] reported a UTS of approximately 916 MPa in the tailored region compared with a UTS of approximately 1411 MPa in the fully hardened region. Omer et al. [10] designed fully martensitic rails and three gradient performance rails, and studied the performance of four kinds of rail configurations. In industrial production, the temperature field of the die changes because of continuous stamping, resulting in changes in the microstructure and properties of the blank. Moreover, water was used as cooling medium in the previous study, which increased the die manufacturing cost and shortened the die life.
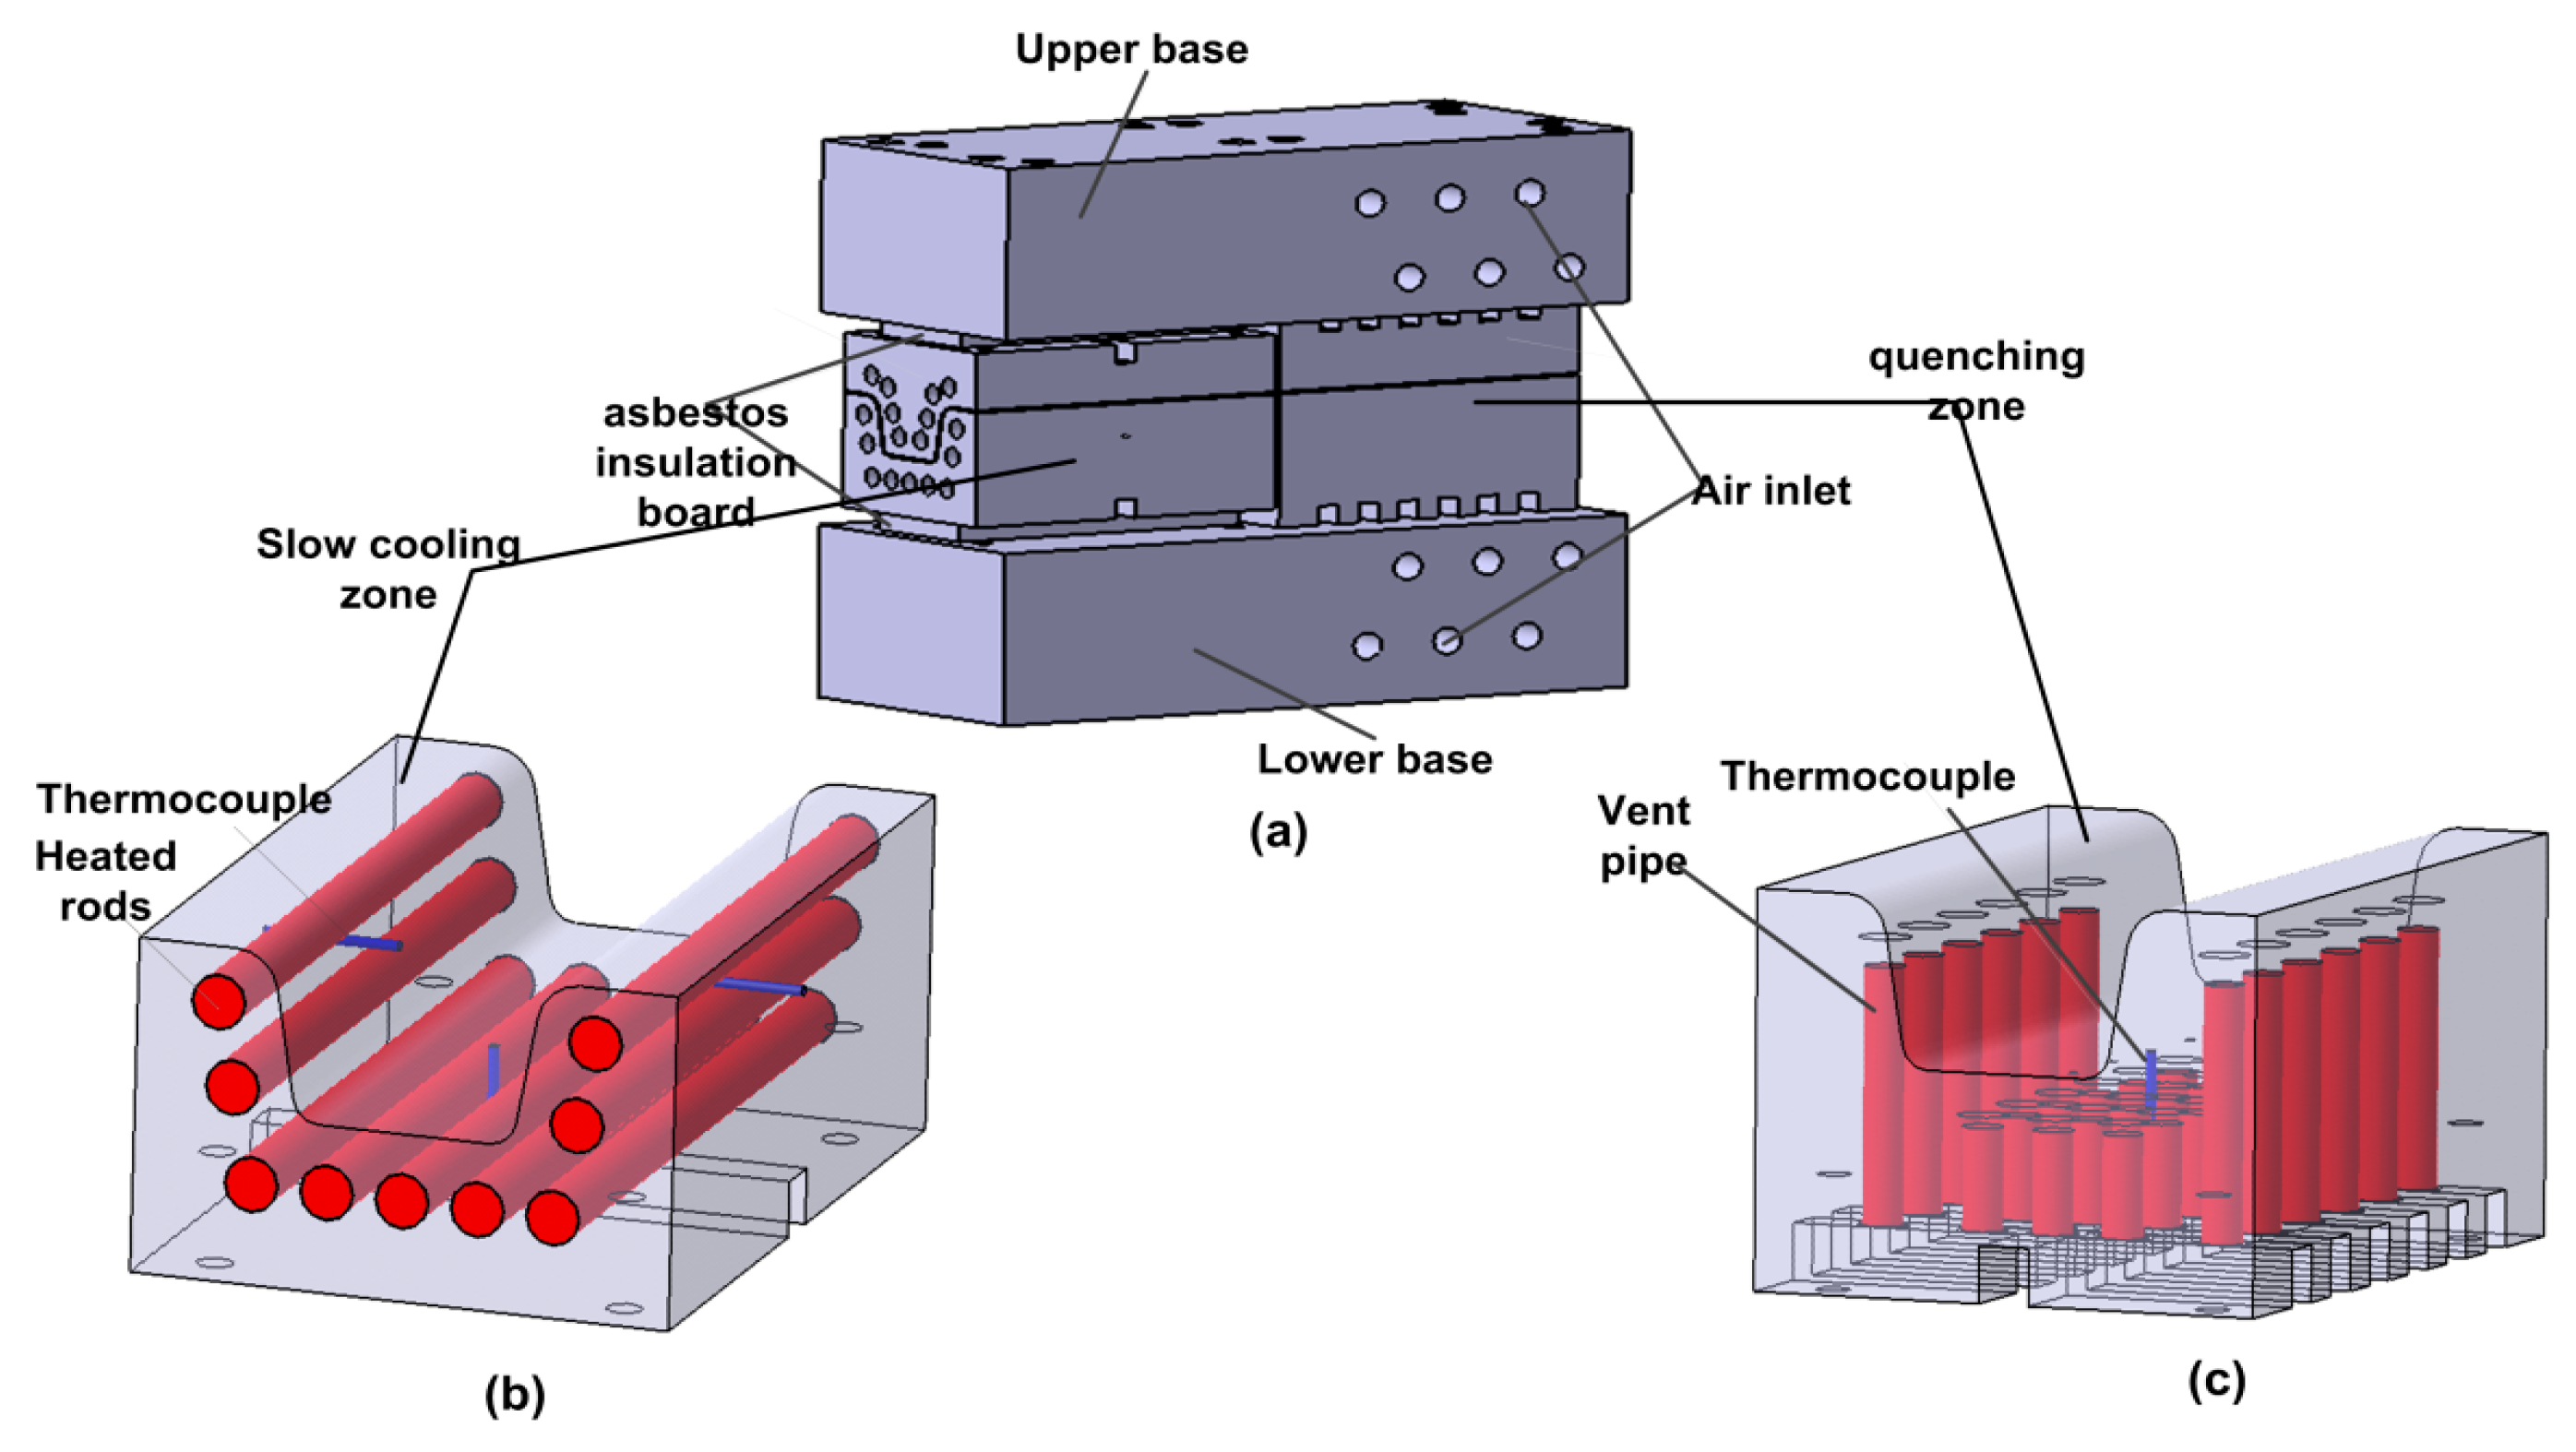
In this paper, air was used as the cooling medium to control the die temperature in the quenching zone. The hot stamping process was simulated by ABAQUS and FLUENT to provide optimum process parameters for the experiments. Hot stamping experiments were carried out using a segmented tool with a slow cooling zone and a quenching zone. The U-shaped part with tailored performance realized in this experiment is shown in Figure 1b. The die used in this experiment is shown in Figure 2. The hardened section of the part was realized by the quenching zone shown in Figure 2b. The high-speed gas, which was at room temperature, carried away the heat through the longitudinal vent pipe to maintain the die at a lower temperature in the continuous stamping process, thus realizing hardened state due to rapid cooling. The toughness section of the component was realized by the slow cooling zone shown in Figure 2c. Heating rods were installed near the surface of the die, whose temperature was adjusted by controlling the current density, thus realizing a kind of state of softening of low strength and high toughness due to slow cooling.

2. Materials and Methods

2.1. Materials and Die

The material used for this experiment was B1500HS high-strength steel with a thickness of 1 mm, and the chemical composition (in wt. %) of the blank was as follows: C, 0.23; S, 1.35; Mn, 0.25; P, 0.015; Cr, 0.19; Mo, 0.04; and B, 0.003. The microstructure of the original materials was ferritic-pearlitic.
A segmented U-shaped die for hot stamping experiments is shown in Figure 2, which was divided into a quenching zone and a slow cooling zone. To insulate the two halves of the tool, a gap of 2 mm was implemented between quenching zone and slow cooling zone. The material of the die was H13 steel. The slow cooling zone was heated by heating rods and the die temperature was fed back by a thermocouple. The air supplied by an air compressor acted as cooling medium in the quenching zone. A 10 mm thick layer of structural asbestos insulation board was used between the tooling and press to minimize heat loss from the tool to the press.

2.2. Experimental Method

The forming and pressure-quenching process of the blank on the slow cooling zone was simulated by ABAQUS, and the influence of the holding time on the temperature distribution was analyzed. Hot stamping experiments were carried out at die temperatures of 300, 400, 450, 500, 550, and 600 °C, and at a holding time of 5, 8, 10, and 12 s. The blank temperature, as it entered the tool, was approximately 850 °C due to the blank cooling during transfer. Under the same working conditions, at the end of each hot stamping, the temperature field of the die remained unchanged and the next hot stamping was performed. In addition, hot stamping experiments were carried out 10 times under the same working condition.
Figure 3 shows the predicted temperature distribution of the blank with different holding times in the case of the slow cooling zone at 600 °C. As can be seen from Figure 3a, the temperature distribution of the part ranged from 618 to 647 °C. We are also told from Figure 3b that the difference between the maximum and the minimum temperature was 14.4 °C. From Figure 3c,d, we can see that the difference between the maximum and the minimum temperature was 13.5 °C. It can be concluded that the temperature distribution of the part was uniform when the holding time ranged from 8 to 12 s. Because the temperature field of the part was uniform, the transformation of the microstructure was uniform. The parts thus have better performance and quality.
Figure 4 shows the relationship between the predicted maximum temperature of the as-quenched blank and the holding time at various die temperatures. The trends of the curves at various tool temperatures were consistent. The temperature of the parts as it was removed from the tool decreased with the increase of the holding time, and tended to be stable from 8 s. The temperature of as-quenched parts was higher than the initial tool temperature. Thus, when it was removed from the die and cooled in the air, the mixed structure was formed due to the lower cooling rate. However, a longer holding time could affect the production efficiency. In conclusion, the holding time of the experiments was determined to be 10 s.
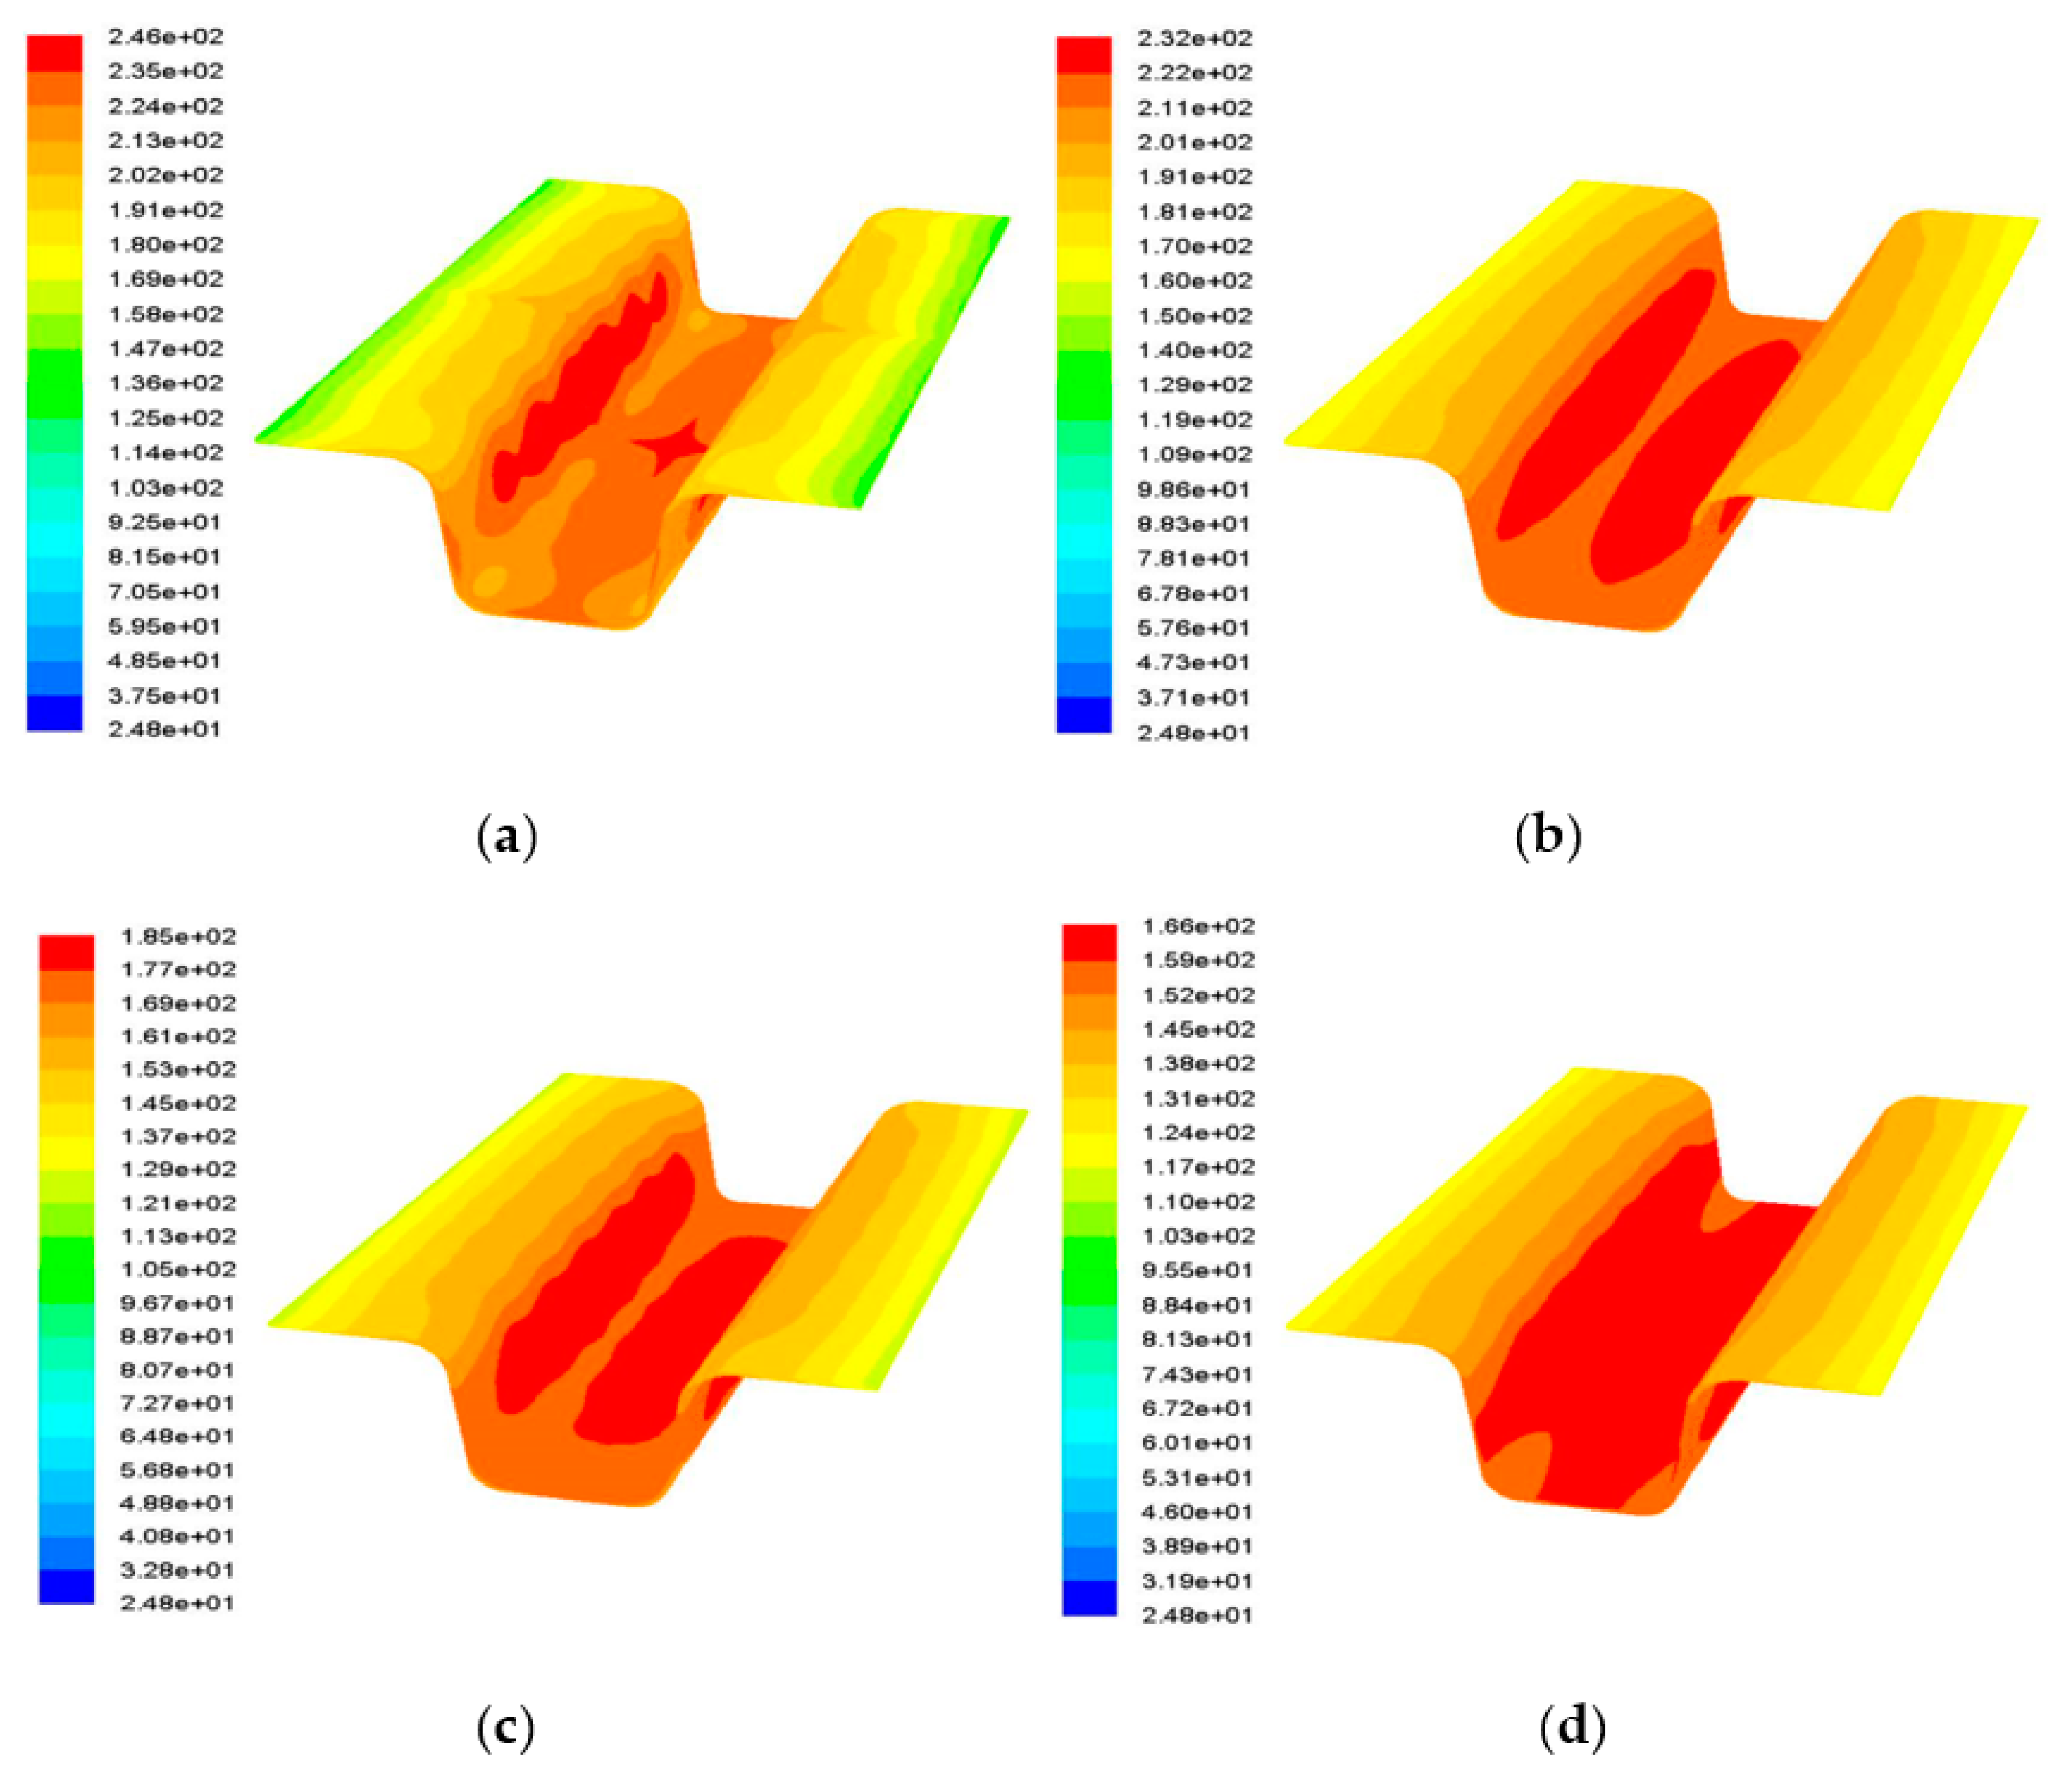
The pressure-quenching process of the blank on the quenching zone was simulated by FLUENT, and the influence of the airflow speed on the temperature field was analyzed. The initial blank temperature was set to 800 °C because of heat loss during transfer and forming. Hot stamping experiments were carried out at air flow velocities of 1, 3, 7, and 10 m/s and at a holding time of 10 s.
The predicted temperature distribution of the blank with different gas velocities is shown in Figure 5. When the air flow velocities were 1 and 3 m/s, the quality of the part was poor as a result of nonuniform temperature distribution. At gas velocities of 7 and 10 m/s, the blank had a uniform temperature distribution and its maximum temperatures reached 185 and 166 °C, respectively. Accordingly, the parts had good properties, and fully martensitic structure was obtained based on the CCT diagram of this material (Figure 1a).
The relationships between the predicted maximum temperature of the as-quenched blanks and the number of hot stampings with various air velocities are shown in Figure 6. The temperature of the as-quenched sheet metal began being consistent after the 8th hot stamping with the air flow speed of 7 m/s. When the gas rate was 10 m/s, the temperature of the as-quenched blank was stable after the 6th hot stamping. The larger the air velocity was, the earlier the temperature of the blank tended to be stable. However, if the air velocity was much too fast, the cost of equipment would increase. In summary, the optimum airflow rate was chosen to be 7 m/s.
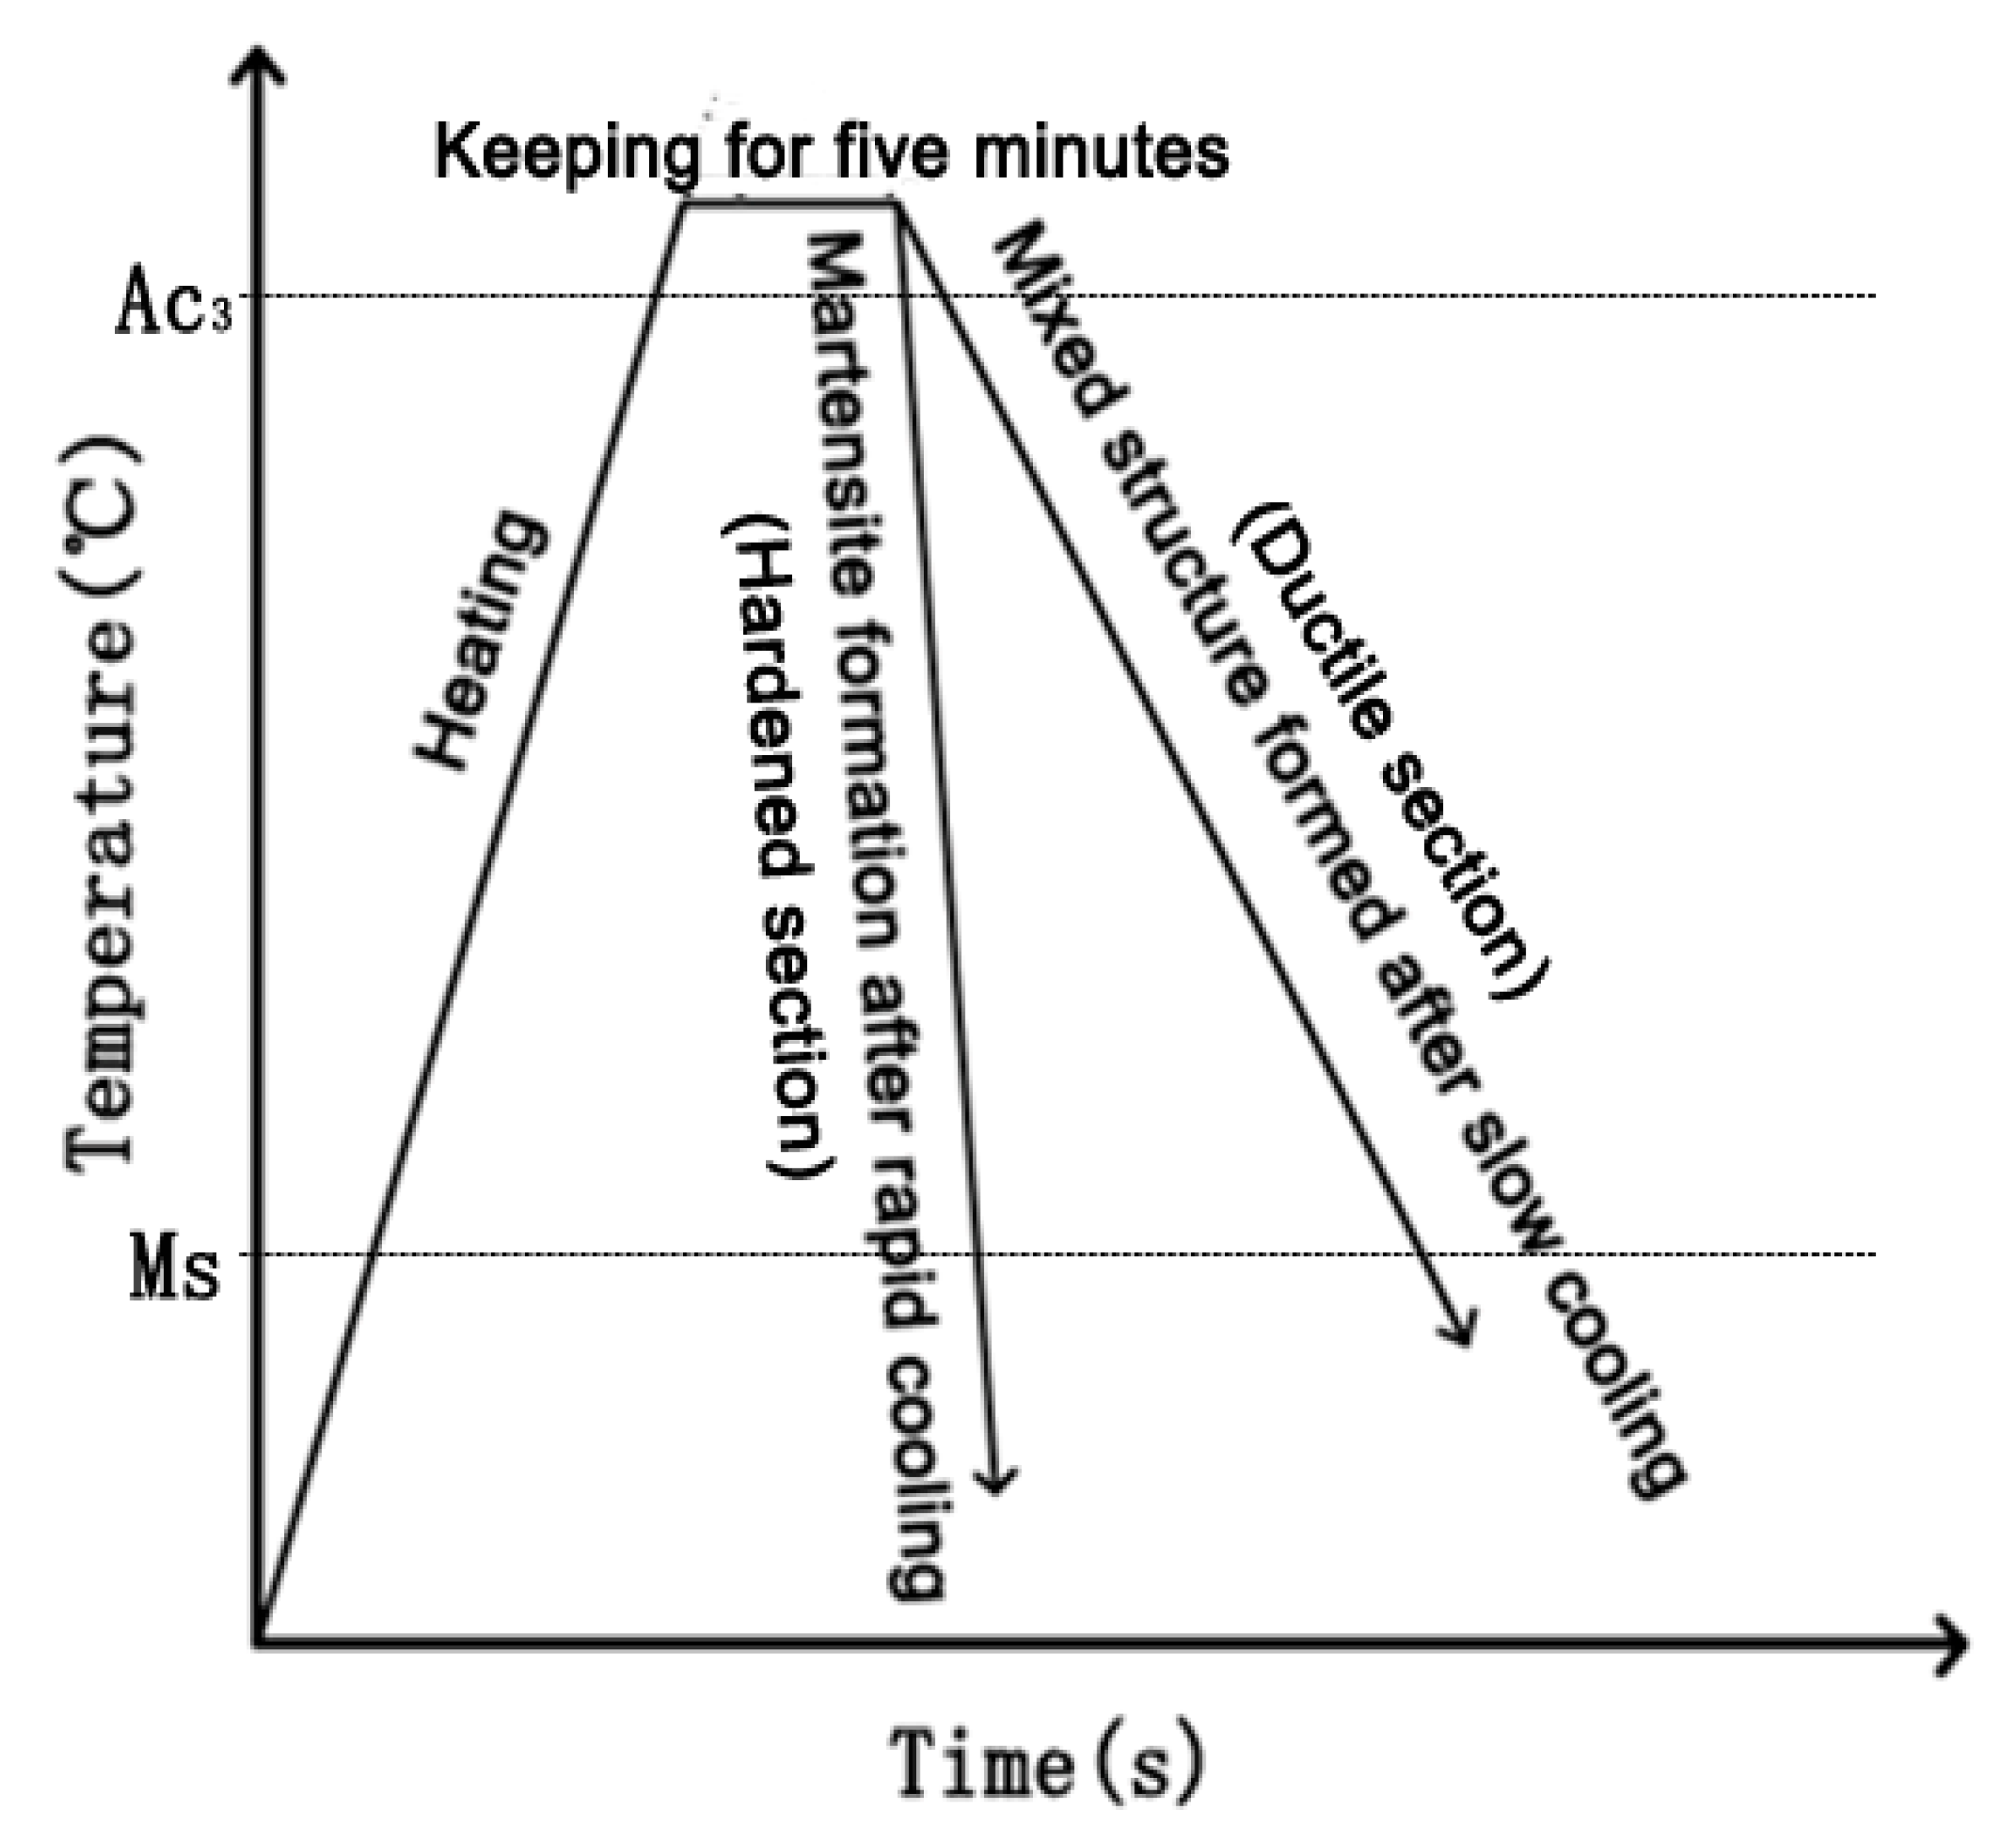
The process parameters of the hot stampings obtained from the simulation were a holding time of 10 s and a gas flow rate of 7 m/s. For all of the experiments, the quenching zone was maintained at a low temperature by using compressed air with the air flow rate of 7 m/s. The slow cooling zone was heated to 300 °C. The schematic illustration of heat treatment of the blank is shown in Figure 7. Blanks were heated to 920 °C and kept for five minutes in a furnace, and then the blanks were quickly transferred to the tool to conduct the forming and subsequently quenching with a holding time of 10 s and then removed from the tool and cooled to room temperature. Ten heated blanks were completed in accordance with the steps above without changing the die temperature. Then, the slow cooling zone was heated to 400, 450, 500, 550, or 600 °C. The hot stamping experiments were completed under different die temperatures following the above steps.

2.3. Microstructure and Mechanical Properties Testing

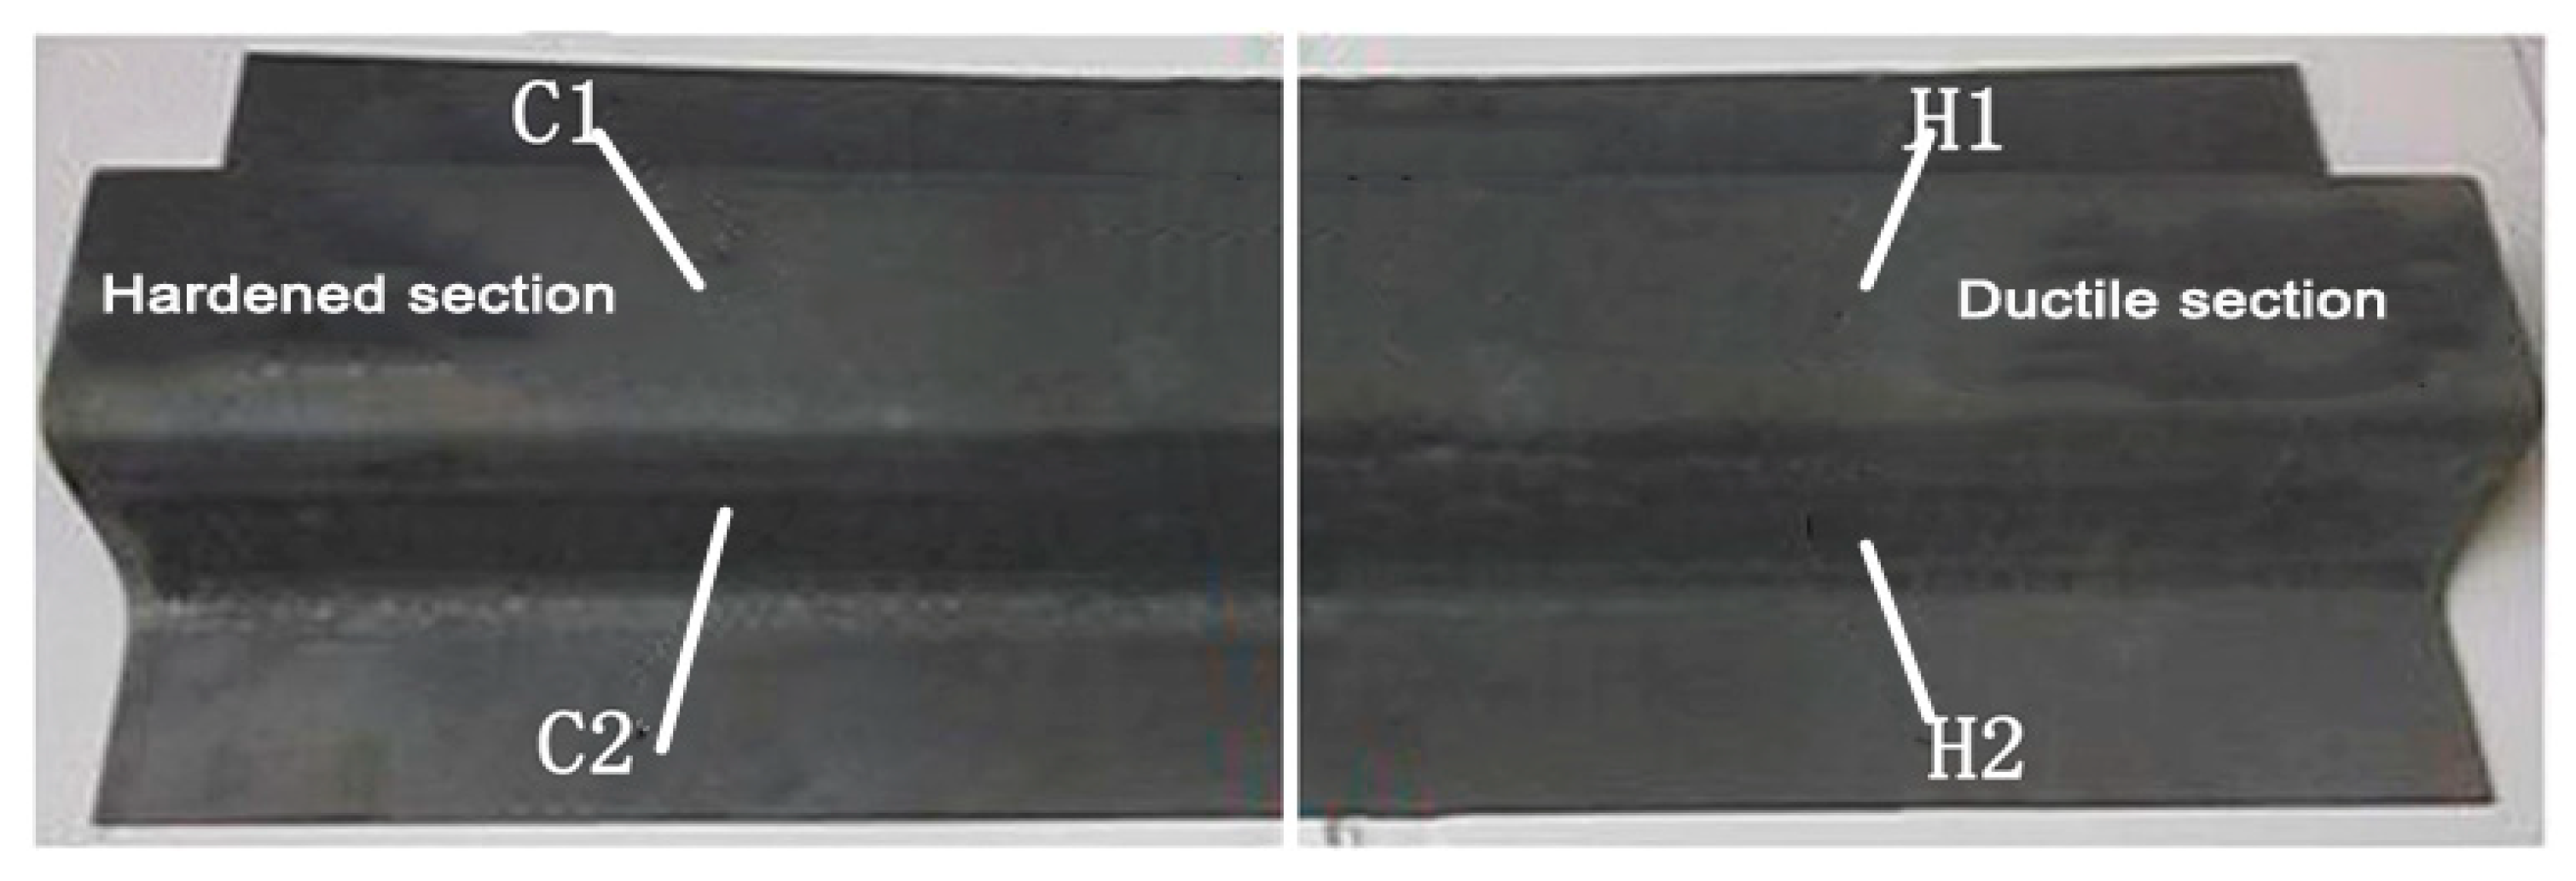
The two regions of the U-shaped part and the sampling position are shown in Figure 8. These locations are denoted as C1, C2, H1, and H2, respectively.
The size of the specimens for the microstructure observation and hardness tests was 10 m × 10 m × 1 m.
The ground and polished samples were treated with etching reagent for microstructure observation. A TESCAN VEGA3 scanning electron microscope (SEM, TESCAN, Brno, Czech Republic) was used to make metallographic observations of the quenched phases. SEM images revealed the characteristic structures of the various phases, however, these images were not useful for the quantification of area fractions when multiple phases were present. A two-stage color tint etching procedure was used to reveal the various phases in different colors [1]. The etched specimens were observed using a ZEISS Axo Scope A1 (Carl Zeiss AG, Gottingen, Germany) metallographic microscope, and it was found that martensite was yellow-brown, bainite was black, and ferrite was white. The ImagePro Plus 6.0 analysis software was used to manually color the phases red (bainite), green (martensite), and blue (ferrite) and subsequently quantify the area fractions present within the 500 um × 326 um area located at the midplane of the specimens.
After the hot forming experiments were completed at various die temperatures, samples were cut from the parts, ground, and polished for micro-hardness testing. The Vickers hardness was measured by a HVS-1000ZDT micro-hardness tester (Institute of Optical Precision, Chinese Academy of Sciences, Shanghai, China). The experiments were carried out at load of 1.96 N with a holding time of 10 s. Each data point represented an average measurement of five measurements from each region.
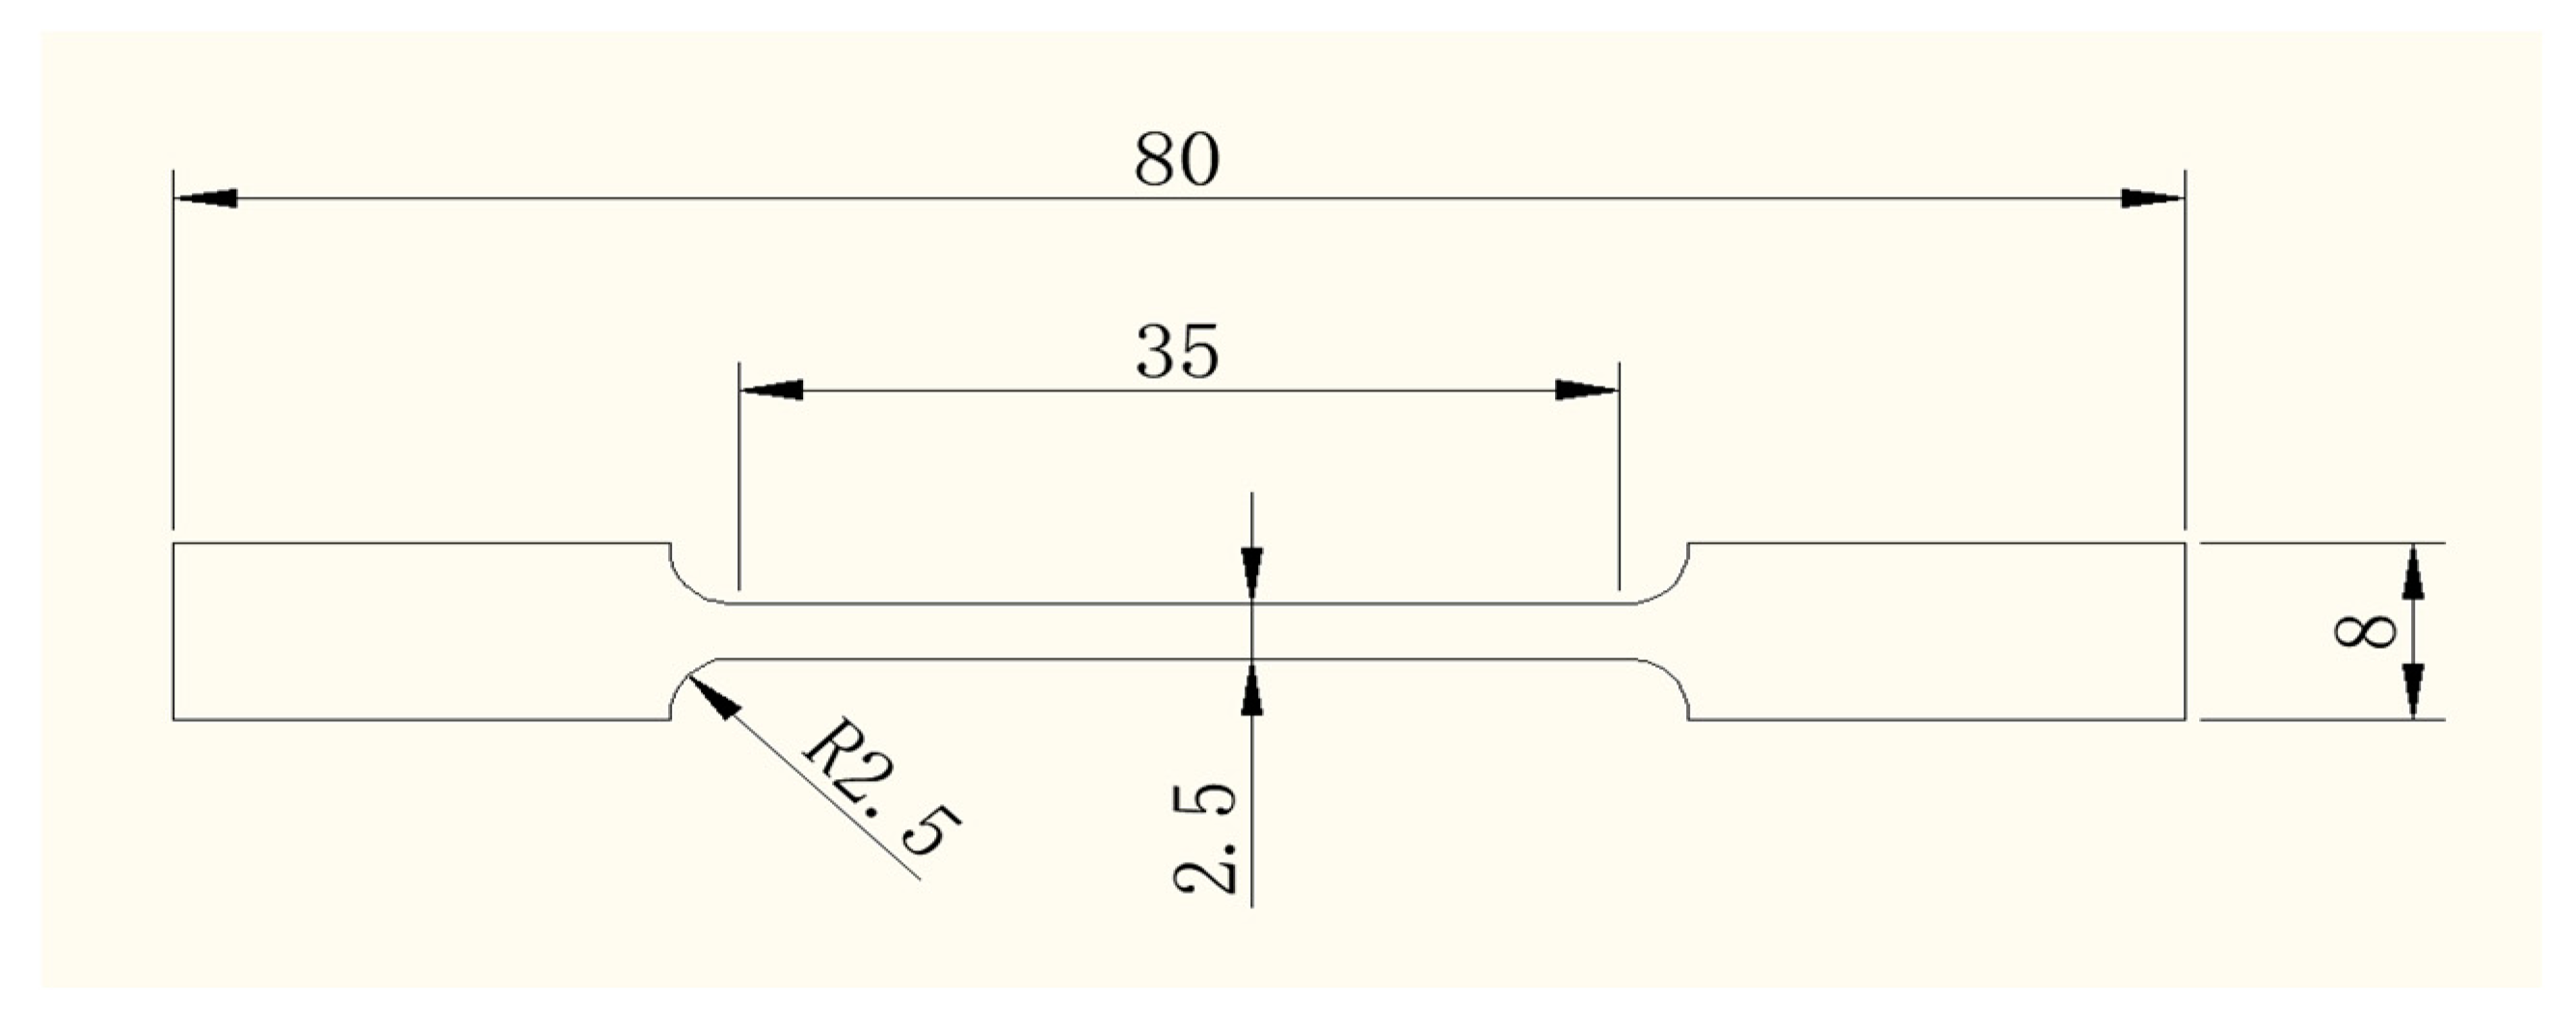
Uniaxial tension tests were conducted on miniature dogbone specimens using a WDW-300 universal testing machine (Kexin Experimental Instrument Co., Ltd, Changchun, China) from the parts that were hot-stamped at different die temperatures. The specimen size is shown in Figure 9.
10-mm long samples were taken at the fracture position of the tensile specimens. The fracture morphology was observed using a SEM to determine the fracture behavior.

3. Results and Discussion

3.1. Metallographic Analysis Results

The typical microstructures observed from C1, C2, H1, and H2 locations are shown in Figure 10. It can be seen from Figure 10a,b that the microstructures for C1 and C2 locations exhibited the packets of parallel lath crystals, which are characteristic of martensite [11]. From Figure 10c–f, it can be seen that the characteristic feature of bainite was a ferrite matrix with dispersed cementite particles [12]. As depicted in Figure 10c,d, there was little difference in the microstructures of H1 and H2 positions when the die temperature was 400 °C.
Two-stage color tint etched optical micrographs and the manually generated microstructure images are shown in Figure 11. As shown in Figure 11a, most of the quenched structures were martensite and a small amount of ferrite and bainite. The formation of abundant martensite was because of the higher cooling rate, which was the result of low die temperature. The formation of bainite and ferrite was due to the longer transfer time and the left shift of the CCT, which was caused by the plastic deformation [6]. It can be concluded from Figure 11b,c that both die conditions resulted in a martensite and bainite multiphase condition with visibly larger amounts of the softer bainite phase for the 600 °C die condition.
The area fractions of martensite, bainite, and ferrite are shown in Figure 12. With the increase of die temperature, the area fractions of quenched phases at C1 and C2 positions had the same trend. The area fraction of martensite at the C1 and C2 positions were above 74% and 64%, respectively. The proportion of ferrite and bainite at the C1 and C2 positions was small. For the H1 and H2 specimen locations, there was a strong downward trend of martensite and a strong increase in bainite, and the ferrite had a slight change, which was owed to the increasing die temperatures. As the tool temperature increased from 300 to 600 °C, on the one hand, the area fraction of bainite at the H1 position rose from 32% to 68%, and at the H2 position, the area fraction of bainite increased from 38% to 74%. On the other hand, the area fraction of martensite at the H1 position dropped by 80%, and at the H2 position, the area fraction of martensite decreased by 80.7%. The proportion of ferrite at the H1 and H2 positions was small. The martensite content on the bottom of the part (C1 and H1) was higher than that on the side (C2 and H2), as C1 and H1 made contact with the tool first.

3.2. Performance Results

Figure 13 displays the hardness measurements as the die temperature increased. The hardness of C1 and C2 could reach 445 and 428 HV, respectively. When the die temperature rose from 300 to 600 °C, the hardness at position H1 decreased from 397 to 210 HV, and the hardness at position H2 decreased from 382 HV to 180 HV. The reason behind this was the introduction of some volume fraction of bainite into the as-quenched microstructure. The hardness of the bottom (C1 and H1) of the part was higher than that of the side wall (C2 and H2). This was because the bottom of the part first contacted the die, as discussed earlier, which caused a high martensite content and high hardness. A slight decrease in hardness can also be observed at C1 and C2 (hardened region) when the die temperature was higher than 400 °C. The reason behind this was that a step existed at the interface between the tool segments (at the gap), resulting from thermal expansion. As a result, the contact between the die and the blank in the quenching section was not tight when the die was closed. Thus, more bainite was formed and the hardness fell because of the small quenching rate.
The UTS and elongation for two regions at different tool temperatures are shown in Figure 14. The tensile strength at the C1 location was slightly greater than that at the C2 location, and the tensile strength at H1 was slightly greater than that at H2. The elongation at C1 was less than C2, and the elongation at H1 was less than H2. However, the tensile strength and elongation of C1 and C2 were very close, likewise for H1 and H2. Therefore, only an average tensile strength and elongation were analyzed here. The average UTS and elongation of C1 and C2 were 1452 MPa and 6.65%, respectively. This indicated that the hardened section was in a hardened state due to its high cooling rate, as shown by its high UTS and hardness, representing the martensite-dominated microstructure (Figure 10a,b and Figure 11a). As the die temperature rose, the average UTS of H1 and H2 dropped by 47.8%, while the average elongation increased from 8.41% to 16.09%. The reason was that the appearance of bainite resulted in lower UTS and hardness, as well as higher toughness.

3.3. Fracture Behavior

Figure 15 shows the fracture morphology at locations C1 and H1. At location C1, the fracture surface was planar and there were some very shallow and small dimples. Therefore, the fracture behavior was brittle fracture. This further confirmed the high strength and low toughness of the hardened zone mentioned above. At location H1, the fracture surface was dark grey and classic cup-shaped, and some large and deep dimples could be clearly observed. The fluctuation of the fracture surface increased when the die temperature exceeded 400 °C. Therefore, the fracture behavior was ductile fracture, matching the high toughness and low strength of the ductile zone mentioned above.

4. Conclusions

In this paper, B1500HS high-strength steel was formed with a segmented hot stamping tool which could achieve tailored components. The conclusions can be drawn as follows:
(1) The area fraction of martensite at C1 and C2 position was above 74% and 64%, respectively. The proportion of ferrite and bainite at C1 and C2 positions was small. As the tool temperature increased from 300 to 600 °C, on the one hand, the area fraction of bainite at position H1 rose from 32% to 68%, and at the H2 position, the area fraction of bainite increased from 38% to 74%. On the other hand, the area fraction of martensite at the H1 position dropped by 80%, and at the H2 position, the area fraction of martensite decreased by 80.7%. The proportion of ferrite at H1 and H2 positions was small.
(2) The hardness of the hardened zone of the U-shaped part could reach 445 HV. The average UTS and elongation of C1 and C2 were 1452 MPa and 6.65%, respectively. With the increase of heating die temperature, the hardness at positions H1 decreased from 397 to 210 HV, and the hardness at positions H2 decreased from 382 to 180 HV. The average UTS of H1 and H2 dropped by 47.8%, while the average elongation increased from 8.41% to 16.09%.
(3) The fracture behavior of the hardened section was brittle fracture, and the ductile section was ductile fracture.

Author Contributions

X.L. and L.X. conceived and designed the experiments; L.X. performed the experiments; X.L. and L.X. analyzed the data; Q.Z. provided experimental guidance; and H.Z. and Y.G. polished the writing and grammar.

Acknowledgments

This research is funded by the NSFC (grant numbers 51275203), and the author is grateful for those funds.

Conflicts of Interest

The authors declare no conflict of interest.

References

  1. Gu, Z.W.; Lv, M.M.; Zhao, L.H.; Xu, H.; Li, X.; Lu, G.H. Optimization of quenching parameters of ultra high strength steel in hot stamping process. Jilin Univ. (Eng. Technol. Ed.) 2016, 46, 853–858. [Google Scholar]
  2. Bardelcik, A.; Salisbury, C.P.; Winkler, S.; Wells, M.A.; Worswick, M.J. Effect of cooling rate on the high strain rate properties of boron steel. Int. J. Impact Eng. 2010, 37, 694–702. [Google Scholar] [CrossRef]
  3. Munera, D.D.; Lacassin, L.; Pinard, F. Very and Ultra High Strength Steels based Tailored Blanks: a step further towards vehicle crash performances improvement. Rev. Metall. Int. J. Metall. 2007, 104, 613–624. [Google Scholar] [CrossRef]
  4. Mori, K.; Maeno, T.; Mongkolkaji, K. Tailored die quenching of steel parts having strength distribution using bypass resistance heating in hot stamping. J. Mater. Process. Technol. 2013, 213, 508–514. [Google Scholar] [CrossRef]
  5. Wang, Z.; Liu, P.; Xu, Y.; Wang, Y.; Zhang, Y. Hot stamping of high strength steel with tailored properties by two methods. Procedia Eng. 2014, 81, 1725–1730. [Google Scholar] [CrossRef]
  6. Yang, X.D. Effect of High Temperature Deformation on Phase Transformation of Hot-Formed Boron Steel B1500HS; Shandong University of Science and Technology: Shandong, China, 2015. [Google Scholar]
  7. George, R.; Bardelcik, A.; Worswick, M.J. Hot forming of boron steels using heated and cooled tooling for tailored properties. J. Mater. Process. Technol. 2012, 212, 2386–2399. [Google Scholar] [CrossRef]
  8. Zhang, Z.Q.; Yu, J.H.; Meng, S.F.; Zhao, Y.; He, D.Y. Effect of tool temperature on microstructure and properties of tailored hot stamping components. J. Mater. Eng. Perform. 2018, 27, 4838–4845. [Google Scholar] [CrossRef]
  9. Zhou, M.B.; Tang, J.L.; Yang, J.; Wang, G.Y. Tailored properties of a novelly-designed press-hardened 22MnMoB steel. J. Iron Steel Res. Int. 2017, 24, 508–512. [Google Scholar] [CrossRef]
  10. Omer, K.; Kortenaar, L.T.; Butcher, C.; Worswick, M.; Malcolm, S.; Detwiler, D. Testing of a hot stamped axial crush member with tailored properties experiments and models international. Impact. Eng. 2017, 103, 12–18. [Google Scholar] [CrossRef]
  11. Naylor, J.P. Influence of the Lath Morphology on the Yield Stress and Transition-Temperature of Martensitic-Bainitic Steels. Metall. Mater. Trans. 1979, 10, 861–873. [Google Scholar] [CrossRef]
  12. Feng, C.; Fang, H.S.; Zheng, Y.K.; Bai, B.Z. Mn-series low-carbon air-cooled bainitic steel containing niobium of 0.02%. J. Iron Steel Res. Int. 2010, 17, 53–58. [Google Scholar] [CrossRef]
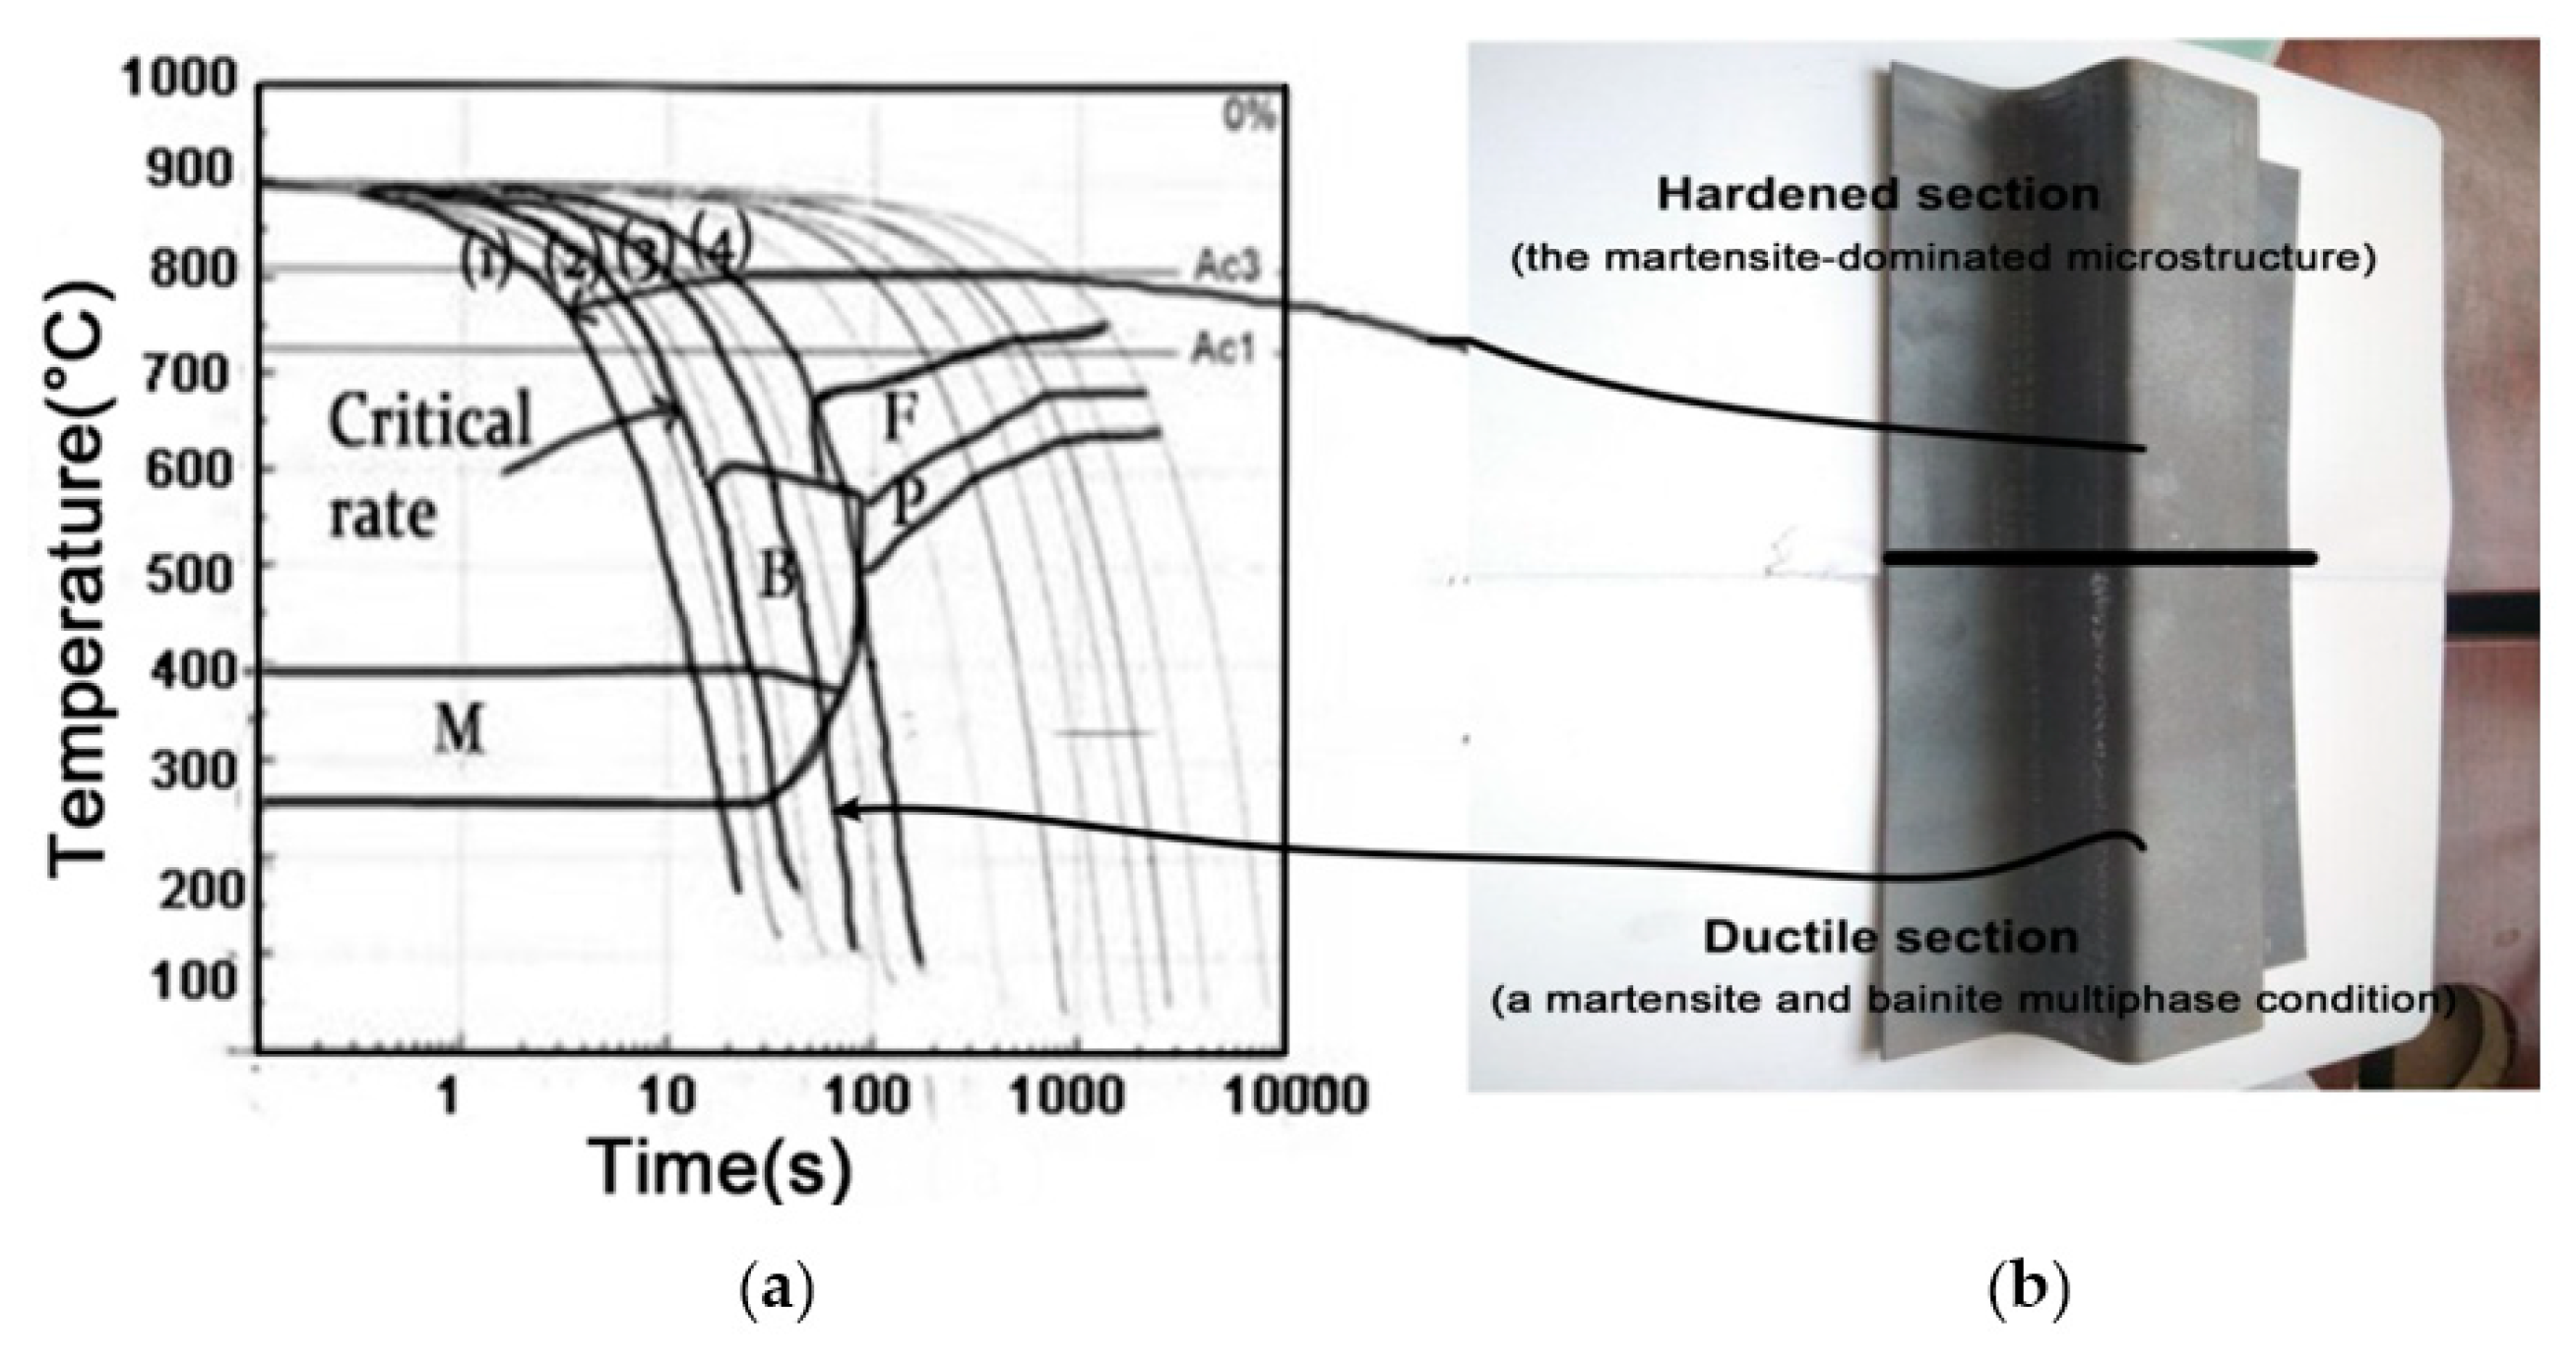
Figure 1. Phase composition: (a) prediction based on the continuous cooling transformation (CCT) diagram for B1500HS steel [6], (b) in examined U-shaped parts.
Metals 09 00593 g001
Figure 2. Schematic of the die: (a) overall structure, (b) slow cooling zone, and (c) quenching zone.
Metals 09 00593 g002
Figure 3. Predicted temperature distribution with a different holding time of (a) 5 s, (b) 8 s, (c) 10 s, and (d) 12 s.
Metals 09 00593 g003
Figure 4. The relationship between the predicted maximum temperature of the as-quenched blank and the holding time at different die temperatures.
Metals 09 00593 g004
Figure 5. Predicted temperature distribution of the blank at different air flow rates of (a) 1 m/s, (b) 3 m/s, (c) 7 m/s, and (d) 10 m/s.
Metals 09 00593 g005
Figure 6. The relationships between predicted maximum temperature of the as-quenched blanks and the number of hot stampings under various air velocities.
Metals 09 00593 g006
Figure 7. The schematic illustration of heat treatment of the blank.
Metals 09 00593 g007
Figure 8. The two regions of the U-shaped part and the sampling position.
Metals 09 00593 g008
Figure 9. The sample size of the tensile test (unit: mm).
Metals 09 00593 g009
Figure 10. The scanning electron microscope (SEM) image at: (a) location C1 with a 300 °C die temperature, (b) location C2 with a 500 °C die temperature, (c) location H1 with a 400 °C die temperature, (d) location H2 with a 400 °C die temperature, (e) location H1 with a 500 °C die temperature, and (f) location H1 with a 600 °C die temperature.
Metals 09 00593 g010
Figure 11. Various micrographs showing (from top to bottom) two-stage color tint etched optical micrographs, and the manually generated microstructure images at: (a) location C1 with a 300 °C die temperature, (b) location H1 with a 300 °C die temperature, and (c) location H1 with a 600 °C die temperature.
Metals 09 00593 g011
Figure 12. The area fraction under different tool temperatures of: (a) martensite, (b) bainite, and (c) ferrite.
Metals 09 00593 g012
Figure 13. Hardness of different locations at different die temperatures.
Metals 09 00593 g013
Figure 14. The mechanical properties for two regions at different tool temperatures: (a) the average ultimate tensile strength (UTS), and (b) the average elongation.
Metals 09 00593 g014
Figure 15. Fracture morphology at (a) location C1 at 300 °C, and (b) 500 °C; and (c) location H1 at 300 °C, (d) 400 °C, (e) 500 °C, and (f) 600 °C.
Metals 09 00593 g015