Article

Cyclic Indentation of Iron: A Comparison of Experimental and Atomistic Simulations

1
Institute of Materials Science and Engineering, University Kaiserslautern, Gottlieb-Daimler-Str. 44, 67663 Kaiserslautern, Germany
2
Physics Department and Research Center OPTIMAS, University Kaiserslautern, Erwin-Schrödinger-Straße, 67663 Kaiserslautern, Germany
*
Author to whom correspondence should be addressed.
Metals 2019, 9(5), 541; https://doi.org/10.3390/met9050541
Submission received: 15 April 2019 / Revised: 6 May 2019 / Accepted: 7 May 2019 / Published: 10 May 2019

Abstract

:
Cyclic indentation is a technique used to characterize materials by indenting repeatedly on the same location. This technique allows information to be obtained on how the plastic material response changes under repeated loading. We explore the processes underlying this technique using a combined experimental and simulative approach. We focus on the loading–unloading hysteresis and the dependence of the hysteresis width ha,p on the cycle number. In both approaches, we obtain a power-law demonstrating ha,p with respect to the hardening exponent e. A detailed analysis of the atomistic simulation results shows that changes in the dislocation network under repeated indentation are responsible for this behavior.

1. Introduction

Mechanical characterization of materials by means of micro- and nanoindentation in the form of a hardness test or cyclic indentation with different indenter shapes and measurement parameters is a useful and well-established way to estimate important material parameters such as elastic modulus, or, in some cases, even fatigue limit [1,2,3,4]. Furthermore, numerical methods add more detailed information to the experiments concerning the stress–strain behavior [3,5,6]. Molecular dynamics (MD) simulations specifically provided a valuable understanding of the nanoplasticity and dislocation density generated underneath a nanoindenter [7,8].
While the processes occurring under single indentations are well understood [9], cyclic indentation still poses challenges. In this method, the indenter tip is repeatedly pushed into the surface of a material until a pre-defined value of load is reached. Hence, subsequent indentations probe a material that has been pre-damaged and induce further plastic changes in it [10].
In this paper, we compare experimental data obtained during cyclic indentation with atomistic simulations. The evaluation of the cyclic indentation results employed in this work is based on PHYBALCHT [11,12], which is described further in Section 2. In order to increase the comparability, we used the same method to analyze the outcome of the simulation and experiment. Additionally, the substrate material on which the cyclic indentation took place in the simulation was chosen to be as comparable as possible to that in the experiment (e.g., regarding the crystallographic structure of the indented surface). This comparison will allow us to obtain an understanding of the plastic processes occurring during indentations, and their dependence on cycle number. Furthermore, evaluation of the cyclic hysteresis behavior of the indentation in the simulation and experiment allow us to quantitatively demonstrate the similarities by calculating the key parameters describing cyclic indentation behavior, such as hardening-exponentCHT.

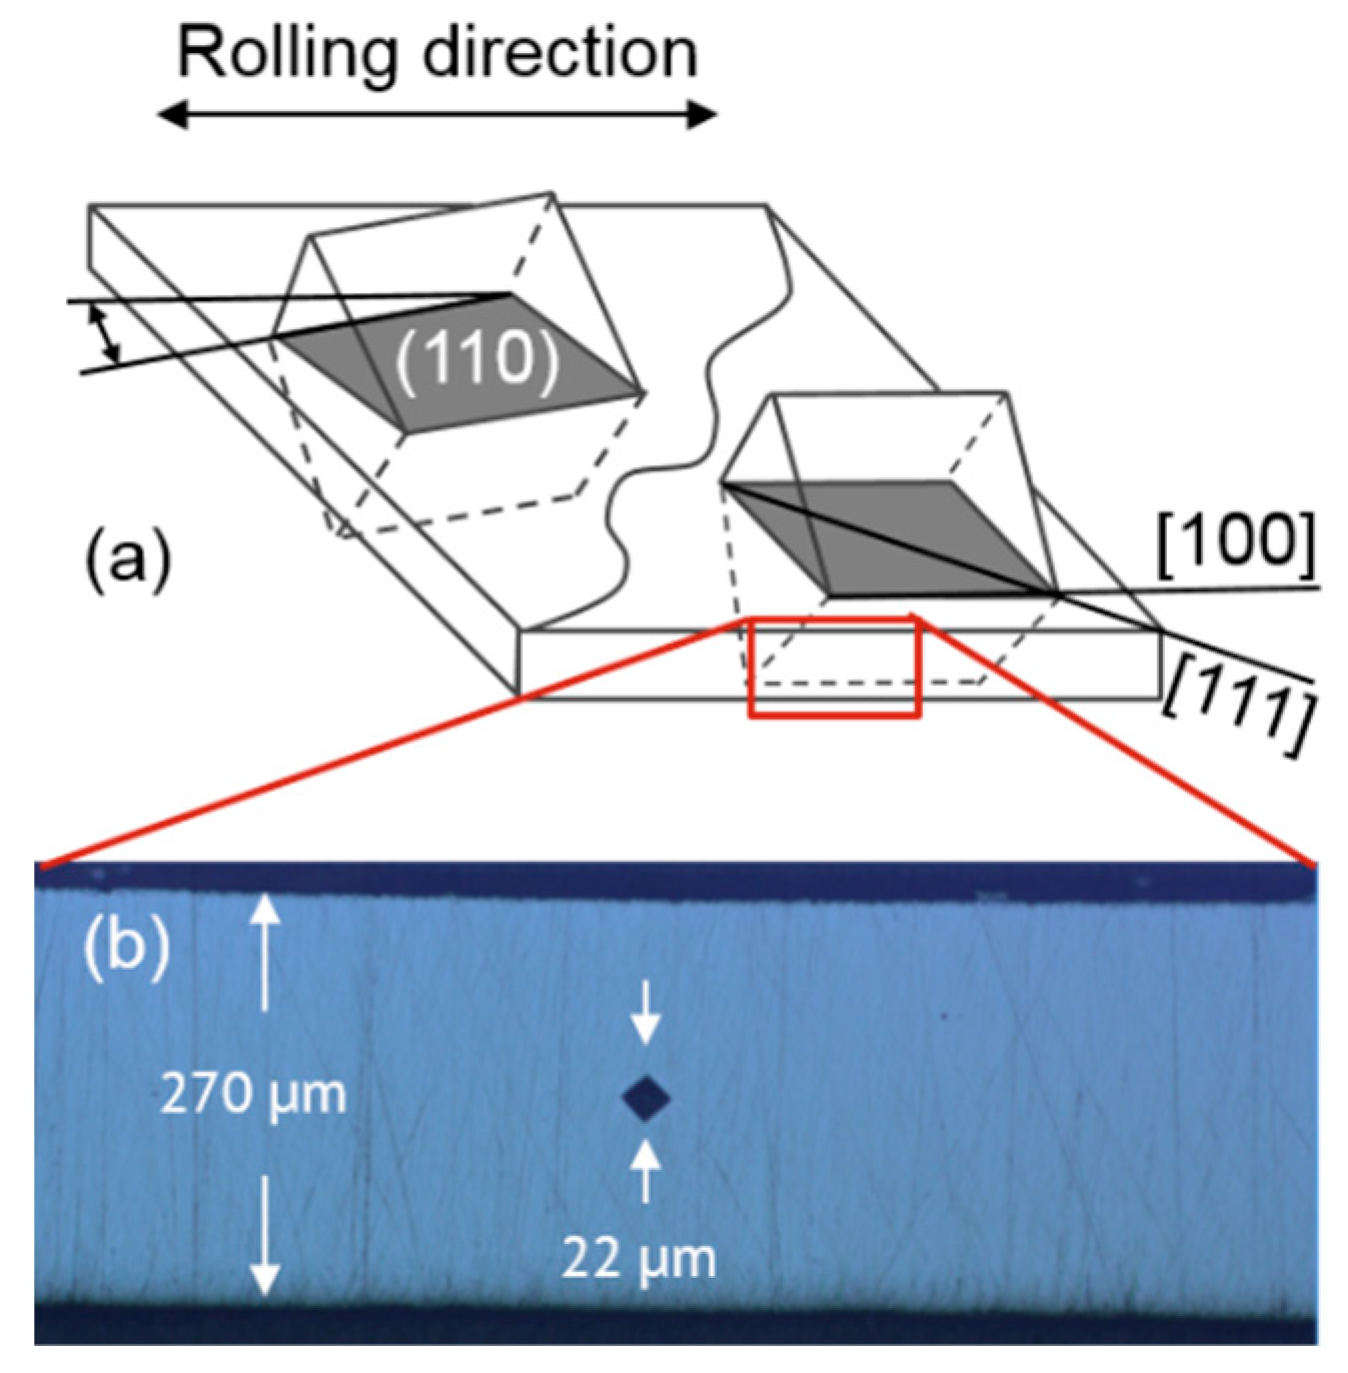
2. Materials and Experimental Method

The material investigated in the experimental section of this work is a “powercore” grain-oriented electrical steel (GOES). The mechanical behavior of GOES as core materials used in transformers and electric traction motors is important because higher performance and energy density tend to increase mechanical loadings in the core components of these electrical devices [13]. Investigation of GOES on servohydraulic fatigue testing systems is challenging due to the low thickness of GOES in its as-delivered state. However, in order to estimate the mechanical behavior of GOES under cyclic loading conditions, a short-time procedure called PHYBALCHT was employed, as described by Kramer et al. [11] and developed at TU Kaiserslautern, Institute of Materials Science and Engineering. The results of the PHYBALCHT method, which induces multiaxial compressive loadings, was proven to show a good correlation with uniaxial compression fatigue tests. This confirms that the hardening-exponentCHT (eII) obtained from PHYBALCHT can be compared with the cyclic hardening behavior of materials in uniaxial fatigue loading conditions [12]. Further studies by Bambach et al. [14] have demonstrated a successful application of the PHYBALCHT (e.g., to determine optimized heat treatment conditions of high strength steel for maximum damage tolerance during fatigue loadings). The present paper, however, focuses on understanding the local microstructural changes during cyclic indentation with help of MD simulations.
GOES held a {110}<001> texture along the rolling direction (RD), as shown in Figure 1a. This so-called Goss texture is typical for grain-oriented electrical steels. The chemical composition of the investigated material and its mechanical properties are given in Table 1 and Table 2, respectively. The investigated electrical steel sheet had a thickness of 270 µm. The grain structure indicated an extremely large grain size in the range of 10 mm with the [001] crystallographic direction [13] oriented parallel to the RD (Figure 1). The large grain structure is beneficial for the comparability of experimental indentation measurements to the MD simulation in that, if enough distance is considered from the indentation point to the adjacent grain boundary, one can assume that the indentation is performed in a single crystal, which is assumed as initial condition in the MD simulation.
It has to be addressed that while the indentation in the MD simulation was performed on a bcc Fe crystal, GOES was selected for the experiment as the substrate to expose to indentation because of its bcc, large-grain structure, as well as its Goss texture (as mentioned above). Therefore, as the indentation took place far from the grain boundary, the indented material could be assumed to have behaved as a quasi-single crystal; hence, the influence of boundaries on the indentation process is negligible. In addition to that, the crystallographic orientation of the surface was well defined {011}. Moreover, such a large grain structure is difficult to achieve by heat-treating pure bcc iron. On the other hand, a simulation of Fe-6.22 at% Si is actually not possible because of the lack of reliable interatomic potentials required for MD.
The specimen was prepared by mechanical polishing up to 4000 grid SiC grinding paper at 350 RPM using water as a lubricating agent. Furthermore, the polishing took place in 3 µm diamond suspension as polishing medium on a cotton polishing cloth at 200 RPM for 3 min.
The cyclic hardness of the material was investigated using cyclic indentation tests with a Vickers indenter and a frequency of 1/12 Hz according to Kramer et al. [11]. A Fischerscope H100 C device (Helmut Fischer GmbH + Co.KG, Sindelfingen, Germany) was used. The holding time of the indenter at maximum indentation load was 10 s. The indentation site was placed in the center of the sample’s thickness, perpendicular to the RD in the middle of the grain, to exclude the influence of grain boundaries. During the indentation tests, the indentation force and indentation depth were continuously measured.
An indentation force–indentation depth hysteresis loop was formed up from the second cycle. The plastic indentation depth amplitude (ha,p) was defined as the half-width of this hysteresis (see Figure 2a). The maximum indentation force chosen for this investigation was 500 mN, and therefore the hysteresis width was measured at 250 mN. Equation (1), a power-law function, was employed to describe the hysteresis width vs the number of cycles after the sixth cycle:
h a , p   I I = a I I N e I I ,
where ha,pII is the half-width of the hysteresis after the sixth indentation cycle, aII is the coefficient of the ha,p,II-N curve, N is the number of indentation cycle, and eII is the hardening-exponent.
According to [11,12], the ha,p-N relation (green line in Figure 2b) was described by dividing it into two sections. Up to the fourth cycle, where the slope of the ha,p-N was not constant, the hysteresis width of the cyclic indentation was described by adding up the two power-law functions ha,pI (dark blue line in Figure 2b) and ha,pII (red line in Figure 2b). This change in the slope shows that the macroscopic plastic deformation processes were not completed until the fourth cycle. After the fourth cycle with the completion of macroplastic deformation, the slope of the ha,p-N became constant (i.e., the curve can be described with one power-law function ha,pII in order to evaluate the cyclic microplastic behavior of the material). The slope of the ha,pII-N after the fourth cycle is denoted as eII.
In the present work, however, the completion of the microplastic deformation processes, and therefore the stabilization of the slope of the ha,p-N curve, occurred after the sixth cycle. As a result, the power-law Equation (1) provided a better fit to the experimental data after the sixth cycle. This variation in the load-depth curve was because of the different materials on which the cyclic indentation took place. In this work, we have used GOES, and the indentation took place in the middle of a large grain in contrast to [11,12], where fine-grained 18CrNiMo7-6 and 42CrMo4 were investigated.

3. Simulation Method

We employed a molecular dynamics (MD) simulation to study multiple (also called cyclic) indentation into a bcc Fe crystal. During this process, the indenter is pushed in a perpendicular direction into the substrate (loading); then it is retracted from the substrate until there is no interaction between the indenter and the substrate atoms (unloading). Subsequently, we repeated the same process 10 times. The first indentation was performed to a depth of d = 6 nm; all subsequent indentations were performed until the same maximum load had been reached (load-controlled mode).
We used the open-source LAMMPS code [15] with a constant time step of 1 fs to perform the simulations. The indenter was modeled as a repulsive sphere. The interaction potential between the indenter and the substrate atoms was limited to distances r < R, where R is the indenter radius; in this study, we fix it to R = 10 nm. The indenter moved at a velocity of 20 m/s. We noted that this velocity was far above experimental velocities; however, it is known [16] that the effect on the plasticity developed during indentation is minor, with the exception of thermal dislocation migration and reactions, which might occur in reality but were excluded in the simulation. The indenter interacted with the substrate atoms by the potential:
f ( x ) = { k ( R r ) 3 , r < R 0 ,     r R ,
The indenter stiffness was set to k = 10 eV/Å3 [17,18]. The crystal had a lateral extension of 65.7 nm and a depth of 42.8 nm; it contained 15,922,900 atoms.
The Mendelev potential [19] was employed to describe the interaction between Fe atoms in the substrate. Two atomic layers of the substrate at the bottom and the lateral sides were fixed to prevent the whole substrate from any translational or rotational movement during the indentation process. The next four layers were kept at <1 K by a velocity-scaling thermostat.
The dislocation extraction algorithm (DXA) [20] was used to identify the dislocations, to determine their Burgers vectors, and to measure the total length of the dislocation lines, Ldisl. The free software tools ParaView [21] and OVITO [22] were employed to visualize the atomistic configurations.

4. Experimental Results

Figure 3 shows the indentation force vs indentation depth, which were experimentally measured using the abovementioned cyclic indentation method. The forces applied in the experiment were in the range of 0–500 mN, which led to indentation depths of up to 3 µm. The progression of the indentation was about 2.9 µm in the first cycle. From the second cycle, the material showed a hysteresis during the loading and unloading of the indenter, which allowed us to use the hysteresis width as a parameter, thus permitting analysis of the mechanical behavior of the material under cyclic loading. Furthermore, the maximum indentation depth at Fmax was measured and plotted vs N.
Figure 4 shows the hysteresis being formed during the second indentation cycle. The hysteresis width, which was used as the plastic indentation depth amplitude ha,p to calculate the hardening-exponent e, was measured at 50% of the maximum indentation force based on the abovementioned PHYBALCHT method.
The dependency of the maximum indentation depth on the number of indentation cycles is plotted in Figure 5. It is observable that in the first three cycles, the indentation depth increased significantly more than during the last five to six cycles. Similar behavior was also visible in the plastic indentation amplitude curve with respect to indentation cycles (see Figure 6).
One can suggest that the investigated material behaved more linearly up from the fifth indentation cycles. Equation (1) was employed to calculate the hardening-exponent eII between N = 6 and 10. For the investigated material with the abovementioned characteristics, eII was calculated to −0.57.

5. Simulation Results

5.1. Plasticity

Figure 7 gives a graphical representation of the dislocation network after the first cycle and after the 10th cycle. Two dislocation loops had already been emitted during the first indentation; the mechanism of the loop emission has been studied in detail in the past, and was based on the so-called “lasso” mechanism for indentations into bcc crystals [23]. No new loops were added in the ensuing indentation cycles, presumably since the stress gradients built up in the subsequent cycles were not strong enough for further loop ejections. We call the network excluded the emitted loops as the ”adjacent network”, which was seen to slightly expand laterally. The majority of changes, however, occurred in the inner part of the network, close to the indent pit. There, the network actually simplified, in that network reactions led to the resolution of the complex entanglement of dislocations immediately below the indent pit.
Quantitatively, the changes in the network can be studied in Figure 8, where the total dislocation length at full penetration and after the retraction of the indenter during the 10 cycles are displayed. The length of the dislocation network quantifies the amount of plasticity generated by the indentation.
During each cycle, the dislocation length first increased until the indenter reached the full penetration depth; during indenter retraction, the dislocation length decreased again. Most of these changes were caused by the expansion and ensuing contraction of the long shear loops governing the outer structure of the adjacent dislocation network. In comparison, the innermost loops close to the indent pit were less mobile.
Figure 9 exemplifies these changes for the third cycle. The expansion of the shear loops during penetration and their subsequent contraction are clearly visible. Note also the simplification of the network immediately adjacent to the indent pit; this is most clearly visible at the bottom of the pit. We found that the b = ½ <111> dislocations were more mobile, while the <100> dislocations hardly changed position under the indenter movements.
Most notable was the reduction in plasticity with increasing cycle number. This was most pronounced during the first six cycles; after that, the dislocation length stagnated. As described above, this feature was due to the simplification of the complex network during subsequent indentations. Note that the difference between the values at full penetration and after unloading also reduced with increasing cycle number, especially in the first four cycles. All of these features provide evidence that the highly non-equilibrium network that was been built up during the first indentation was continuously transformed into a more stable equilibrium structure.
The size of the plastic zone was determined in the simulation by the distance Rpl of the farthest dislocation segment from the center of the contact area. Only dislocations that were adjacent to the indent pit are counted here, while emitted dislocation loops were discarded. Figure 10 shows that upon multiple indentations, the plastic zone increased in size; the effect amounted to around 10%. This was most pronounced in the first five cycles, before saturating. This result quantifies the size of the dislocation networks observed in the snapshots (see Figure 7).
In order to estimate dislocation densities, the values of Ldisl have to be divided by the volume of the plastic zone. This results in
ρ = L d i s l 2 3 π R p l 3 ,
where we assumed the plastic zone to be of roughly hemispheric shape. The results are plotted in Figure 11. We see that the dislocation density decreased due to expansion of the plastic zone and the decrease of the total length of the dislocation network. Note that in the simulation volume, there was no defect before indentation; this corresponds to an experimental situation of small dislocation densities of the order of 108 cm−2, since at these densities the probability of finding a dislocation line in the simulation volume is negligible. After the first cycle, it increased to 1012 cm−2, which is in agreement with the literature [21].
Finally, Figure 12 shows the residual stress distribution in the specimen at the end of the 10th cycle. To be precise, we calculated the hydrostatic stress (i.e., one-third of the trace of the stress tensor; this is done on a per-atom basis using the forces acting on each atom as calculated in the MD simulation [15]). The comparison with a snapshot displaying the location of the dislocations demonstrates that the stress was generated by the dislocations. Each individual (edge) dislocation was the origin of a stress dipole such that compressive stress occurred towards the indenter pit, while tensile stresses were located towards the interior of the considered material volume. This scenario is identical to the concept of geometrically necessary dislocations associated with strain gradients, as applied to indentation [24,25,26].
We conclude that indentation produced a high density of dislocations immediately at the tip; the density was close to the maximum density that the crystal could tolerate (i.e., 1012 cm−2) [27]. This reduced under subsequent indentation cycles, mainly because dislocation reactions simplify the network. Strain hardening (i.e., the process where subsequent cycles increase the dislocation density) cannot occur at these high densities. This feature may be in contrast with indentations possessing larger indenter radii; these have a correspondingly increased plastic zone and a reduced dislocation density, which may allow for strain-hardening reactions.

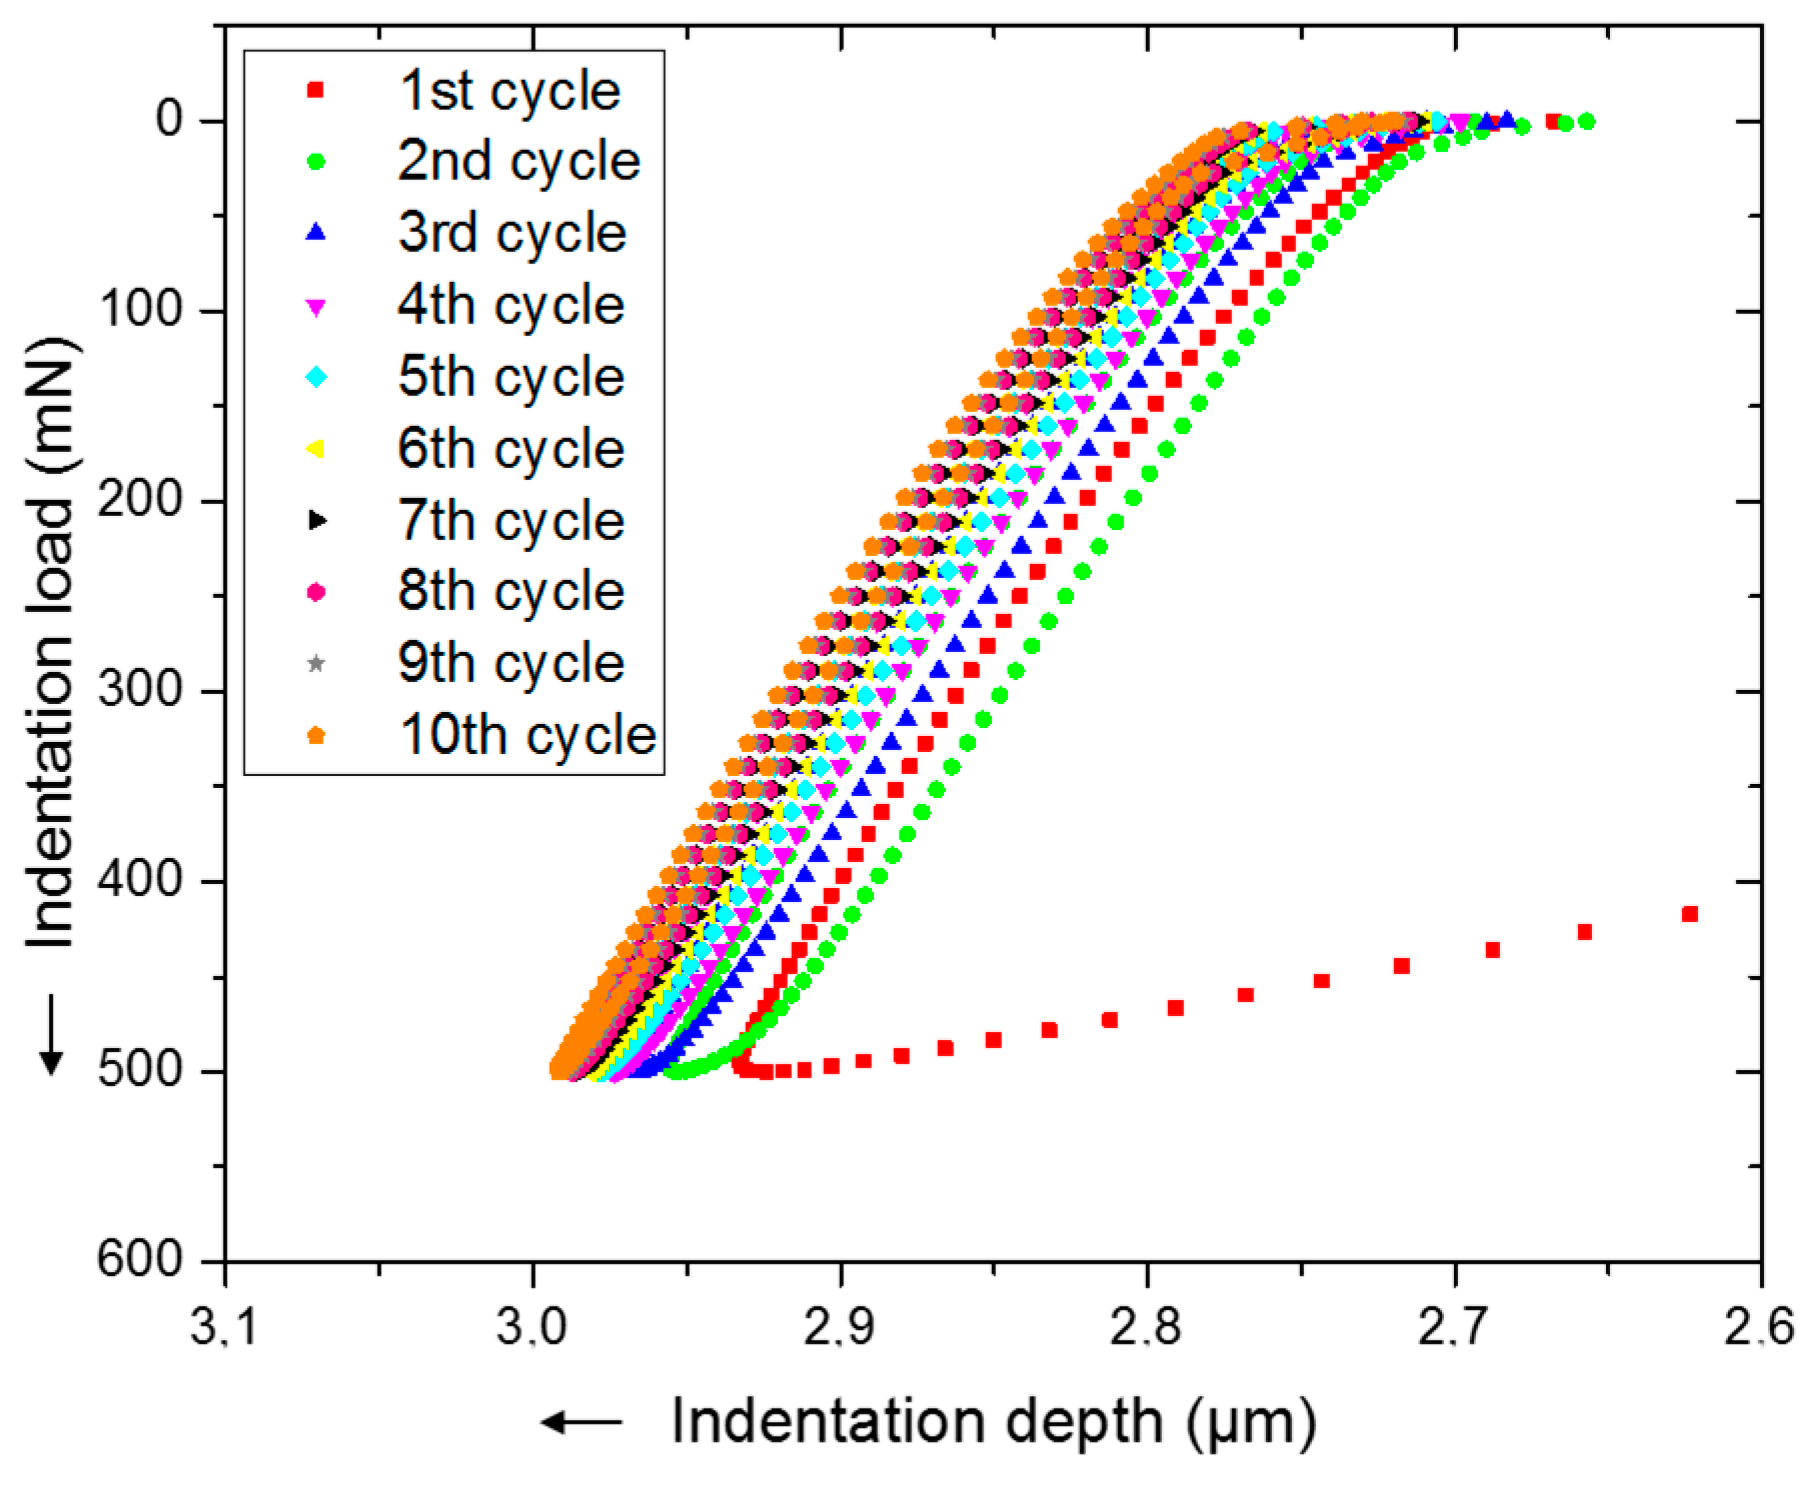
5.2. Load-Depth Curves

Figure 13 shows the evolution of the indentation force during 10 cycles of indentation. Starting with the second indentation, a hysteresis in the load-depth curve can be identified, similar to that obtained in the experiments (see Figure 2, Figure 3 and Figure 4). Since the indentations were performed at constant maximum load, the maximum indentation depth increased with each new cycle. However, the width of the hysteresis loop reduced systematically with the cycle number.
The indentation depth required to reach the fixed maximum load of 4.55 μN vs the cycle number is shown in Figure 14. With each new indentation, the indentation pit became deeper. During the first four cycles, the indentation depth increased strongly, by around 2.5 Å. After that, it stayed more or less constant. The increased indentation is correlated with the simplification in the dislocation network, which allowed the tip to move further inside the sample at the same load, and hence maintain the same contact pressure.
Figure 15 shows the plastic indentation-depth amplitude 2ha,p as a function of the number of indentation cycles N. We calculate 2ha,p from the load-depth curves of Figure 13 as an average of the widths determined at 40%, 50%, and 60% of the maximum load. The double-logarithmic plot, Figure 15, reveals that the curve can be roughly approximated by a power-law, Equation (1). We note that in simulation both the maximum indentation depth, Figure 14, and the width of the hysteresis loop, Figure 15, show a tendency of saturating with cycle number, while in the experiment they appeared to continue changing, see Figure 5 and Figure 6. The stabilizing trend was caused by the smaller plastic volume in the simulation, where dislocation reactions ceded after around five cycles (see the discussion above), while in the larger plastic zone in the experiment, reactions continued beyond 10 cycles.
Two fits are included in Figure 15, showing the limits of the coefficients obtained, a = 28 Å and e = −1.78; a = 5.67 Å and e = −0.83. Note that in the atomistic simulation, the width 2ha,p only changed between 0.62 and 3.29 Å. Compared to the nearest-neighbor distance in Fe, 2.47 Å, these changes are of atomic dimensions or below. Note that the determination of the exact power exponent in Equation (1) is subjected to some arbitrariness, see Figure 16, where two fits are provided. However, similar power-laws were found in the experiment [11], albeit with smaller exponents.
The reason for the existence of the hysteresis lies mainly in the competitive roles of elastic and plastic deformation. While during indentation the material behaves plastically, and larger forces have to be exerted to remove the material in front of the indenter, during unloading only the elastic resistance of the material is probed. Actually, the stress fields assist the indenter to move out of the specimen (elastic recovery). The area under the hysteresis curve equals the plastic work done during the indentation. The hysteresis becomes smaller in subsequent cycles, since the dislocation network then exhibits only periodic expansions and contractions under the motion of the indenter. Energy is dissipated only by the motion of dislocations, since no more reactions occur.
Even though the dislocation network in the plastic zone approximately stabilized after around six cycles (see Figure 8 and Figure 10), the hysteresis width still showed small changes, albeit on a sub-Å scale (Figure 15). These changes were caused by small re-organizations in the dislocation network, which were imperceptible on the nm scales shown in Figure 8 and Figure 10. This demonstrates that the measurement of the hysteresis width constituted a sensitive method for registering changes in the dislocation network built up during nanoindentation.

6. Conclusions

Both the experiment and simulation showed the same qualitative trends of indentation behavior and cycle number. Similarities were observed, specifically in the indentation force vs indentation depth graphs (see Figure 3 and Figure 13), and, consequently, in the maximum indentation depth vs indentation cycles (see Figure 5 and Figure 14). In addition, the decrease of the hysteresis width showed the same trends in the experiment and simulation (see Figure 16). This figure even demonstrated that the power-law decays of e with N were quantitatively comparable.
Our atomistic results on the changes in plasticity in the material under the indenter tip allow us to understand the consequences in the indentation load-depth curves.
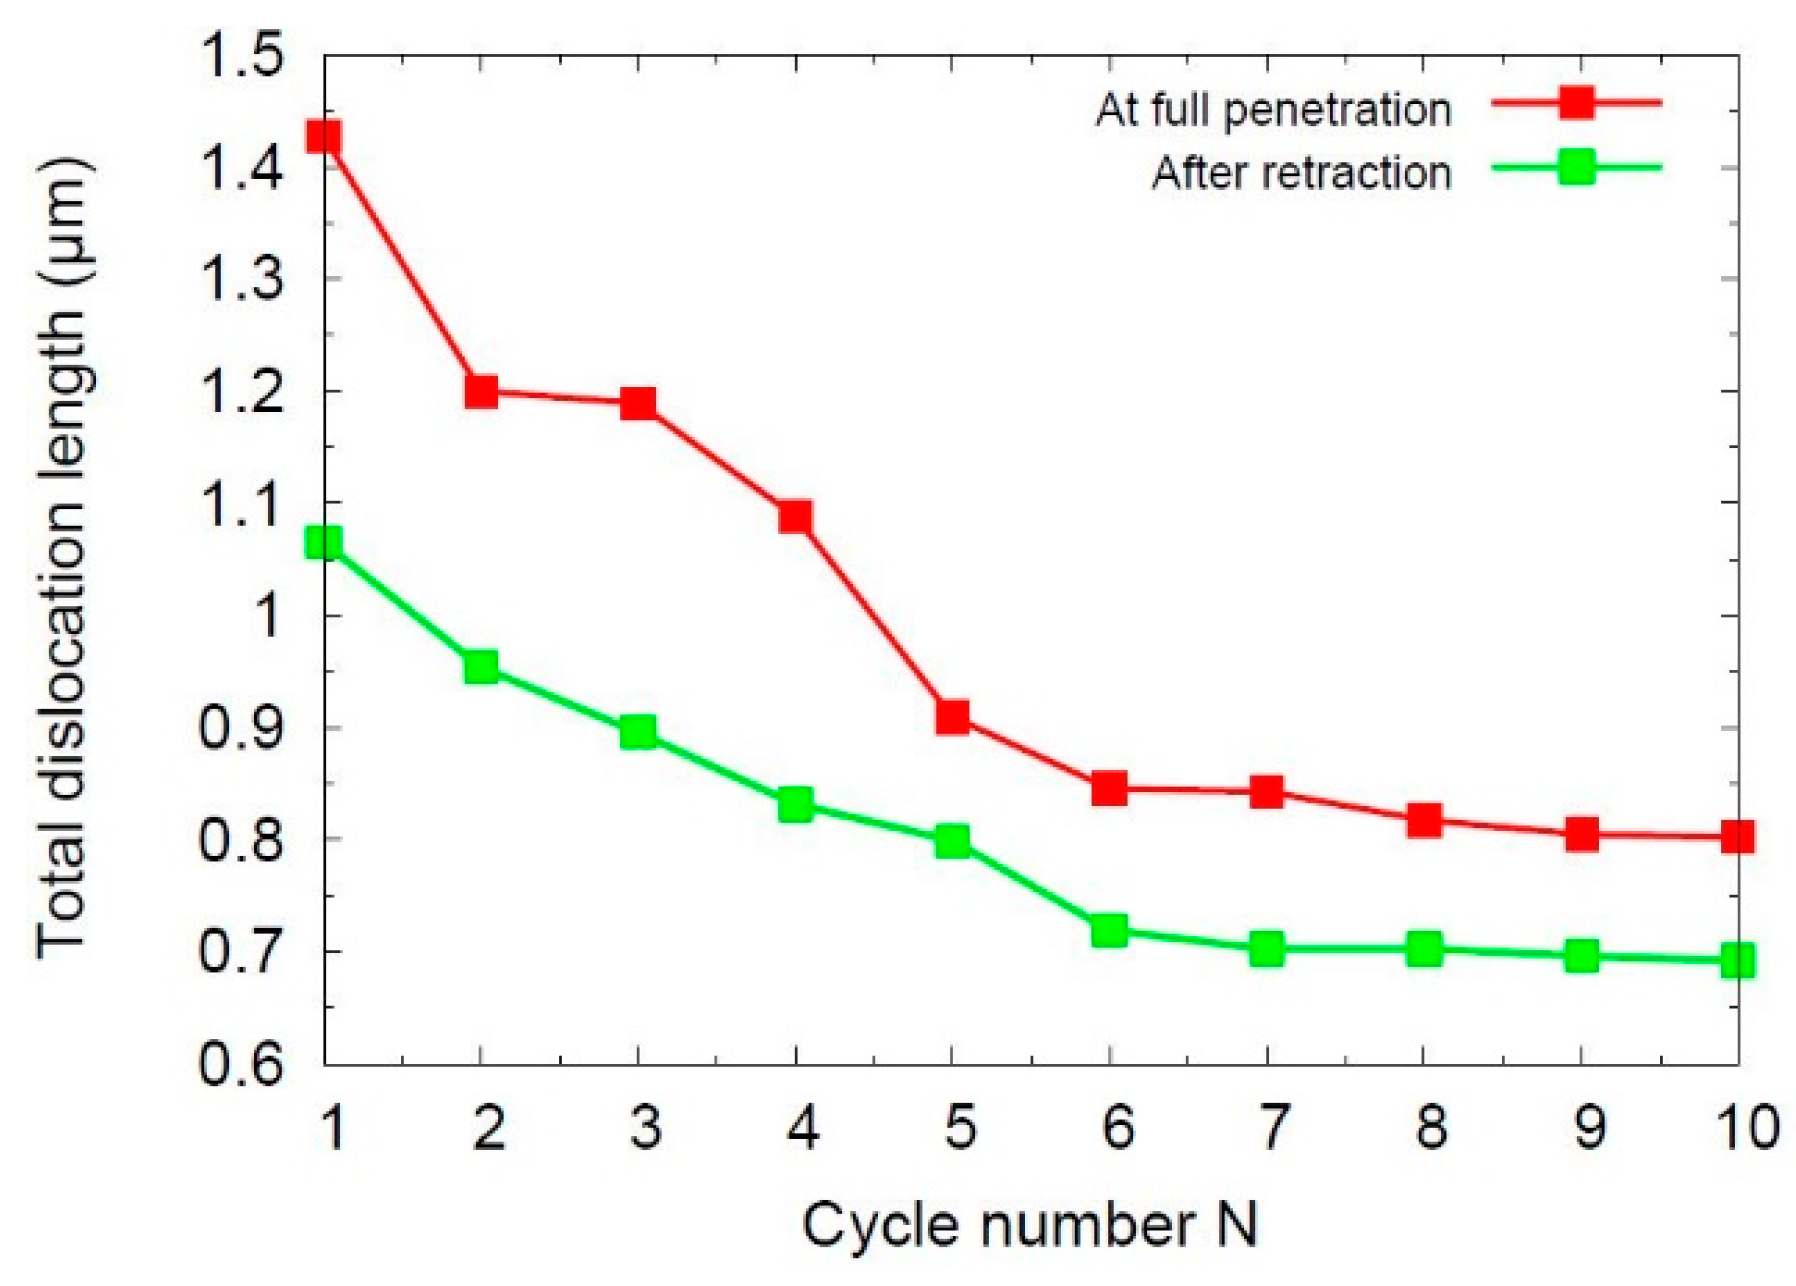
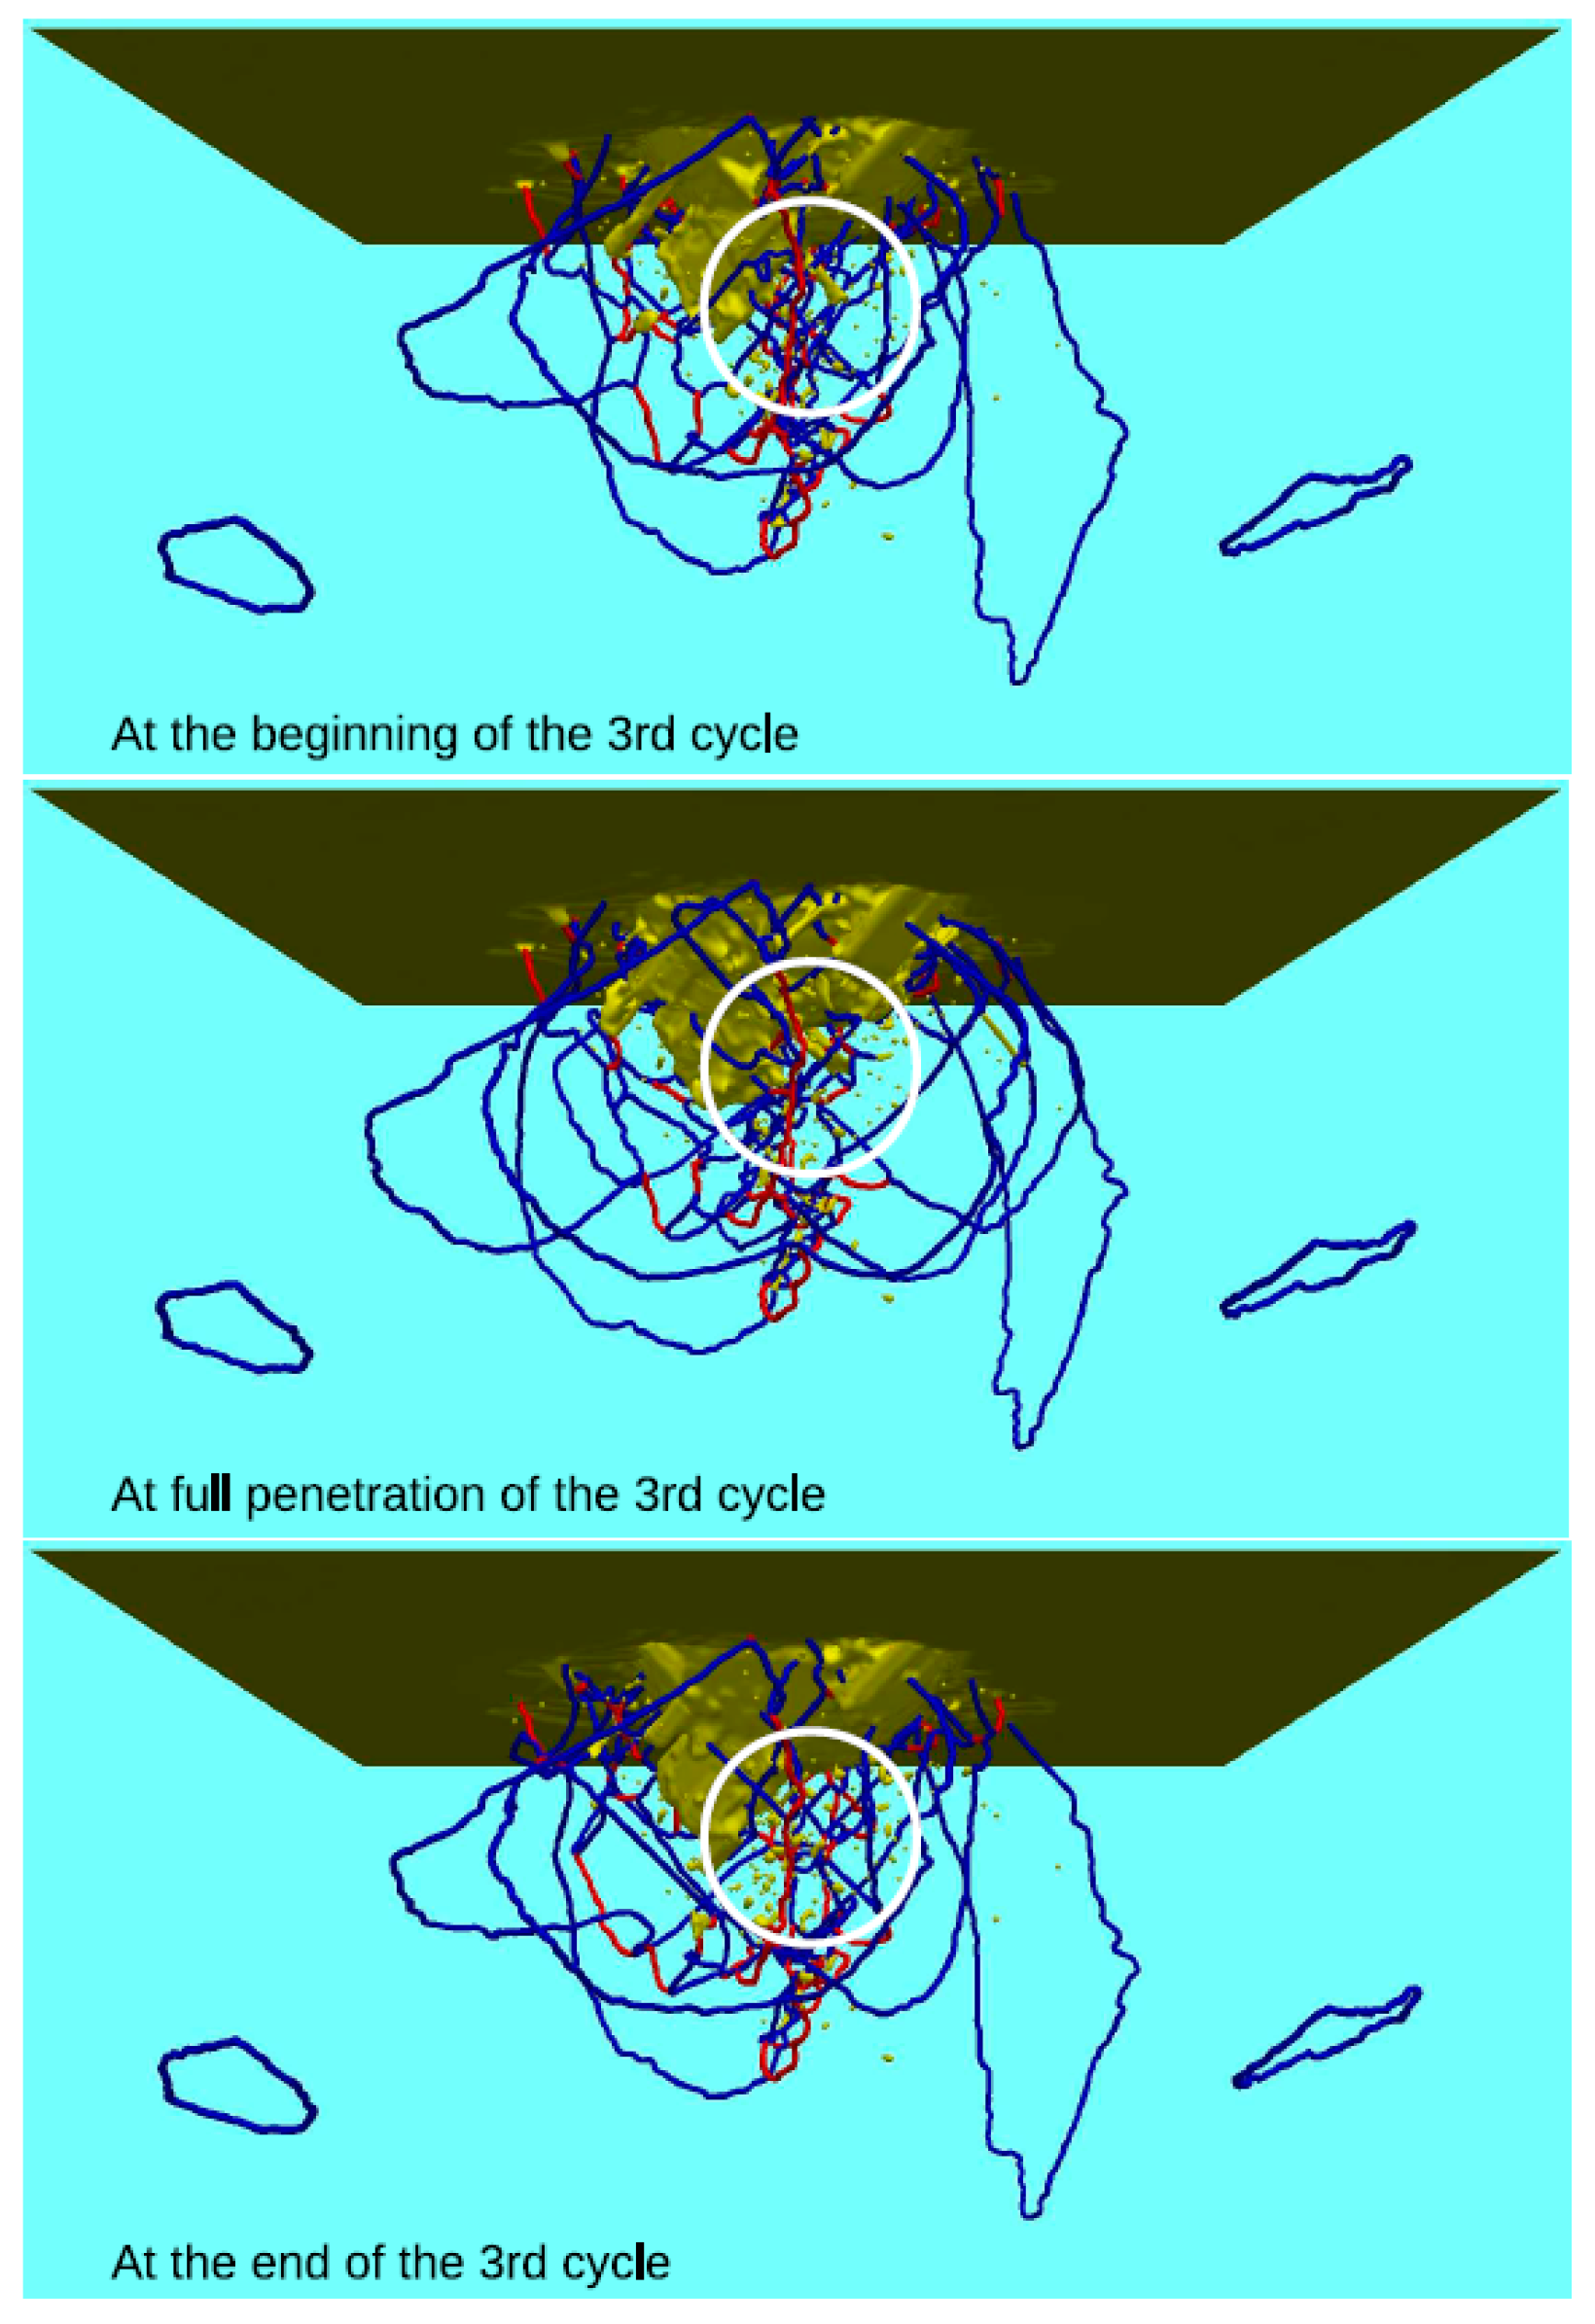
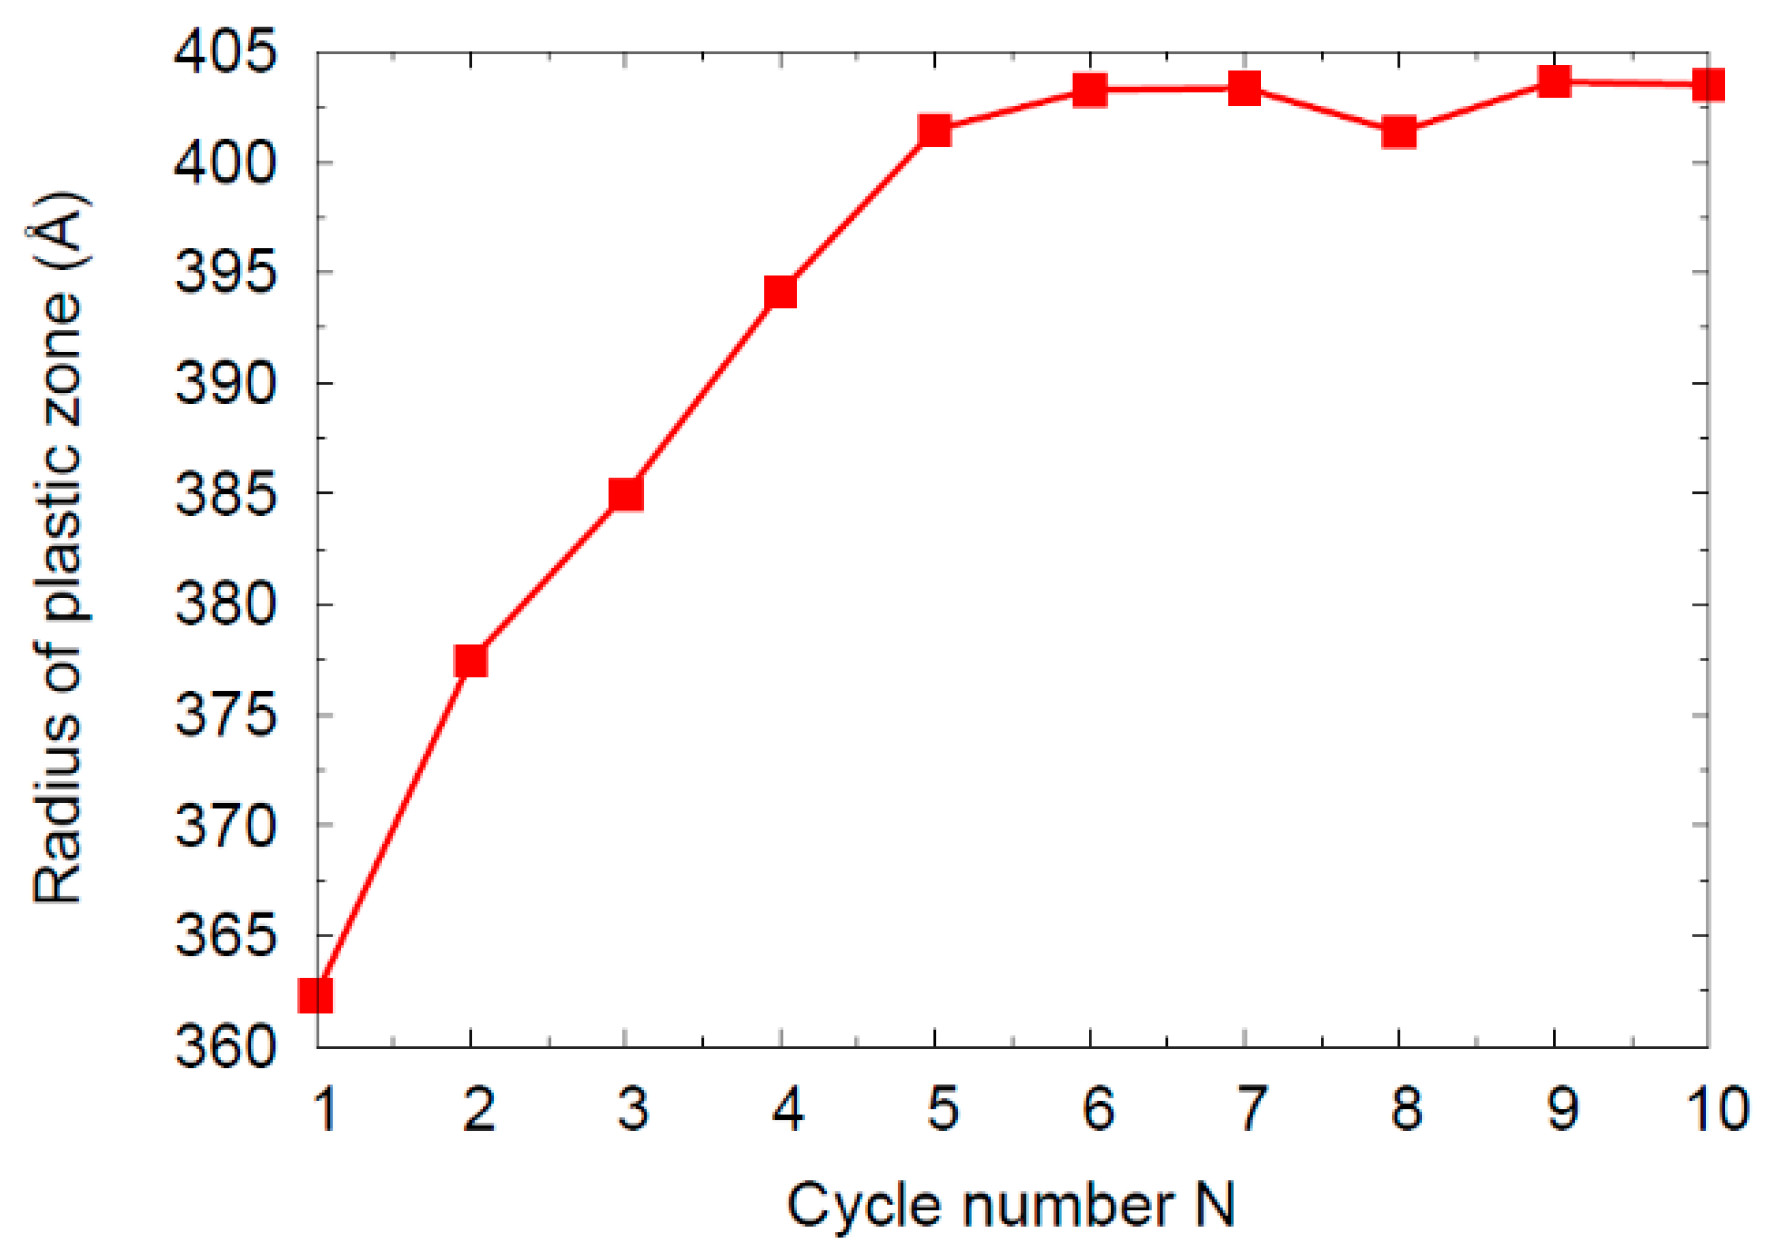
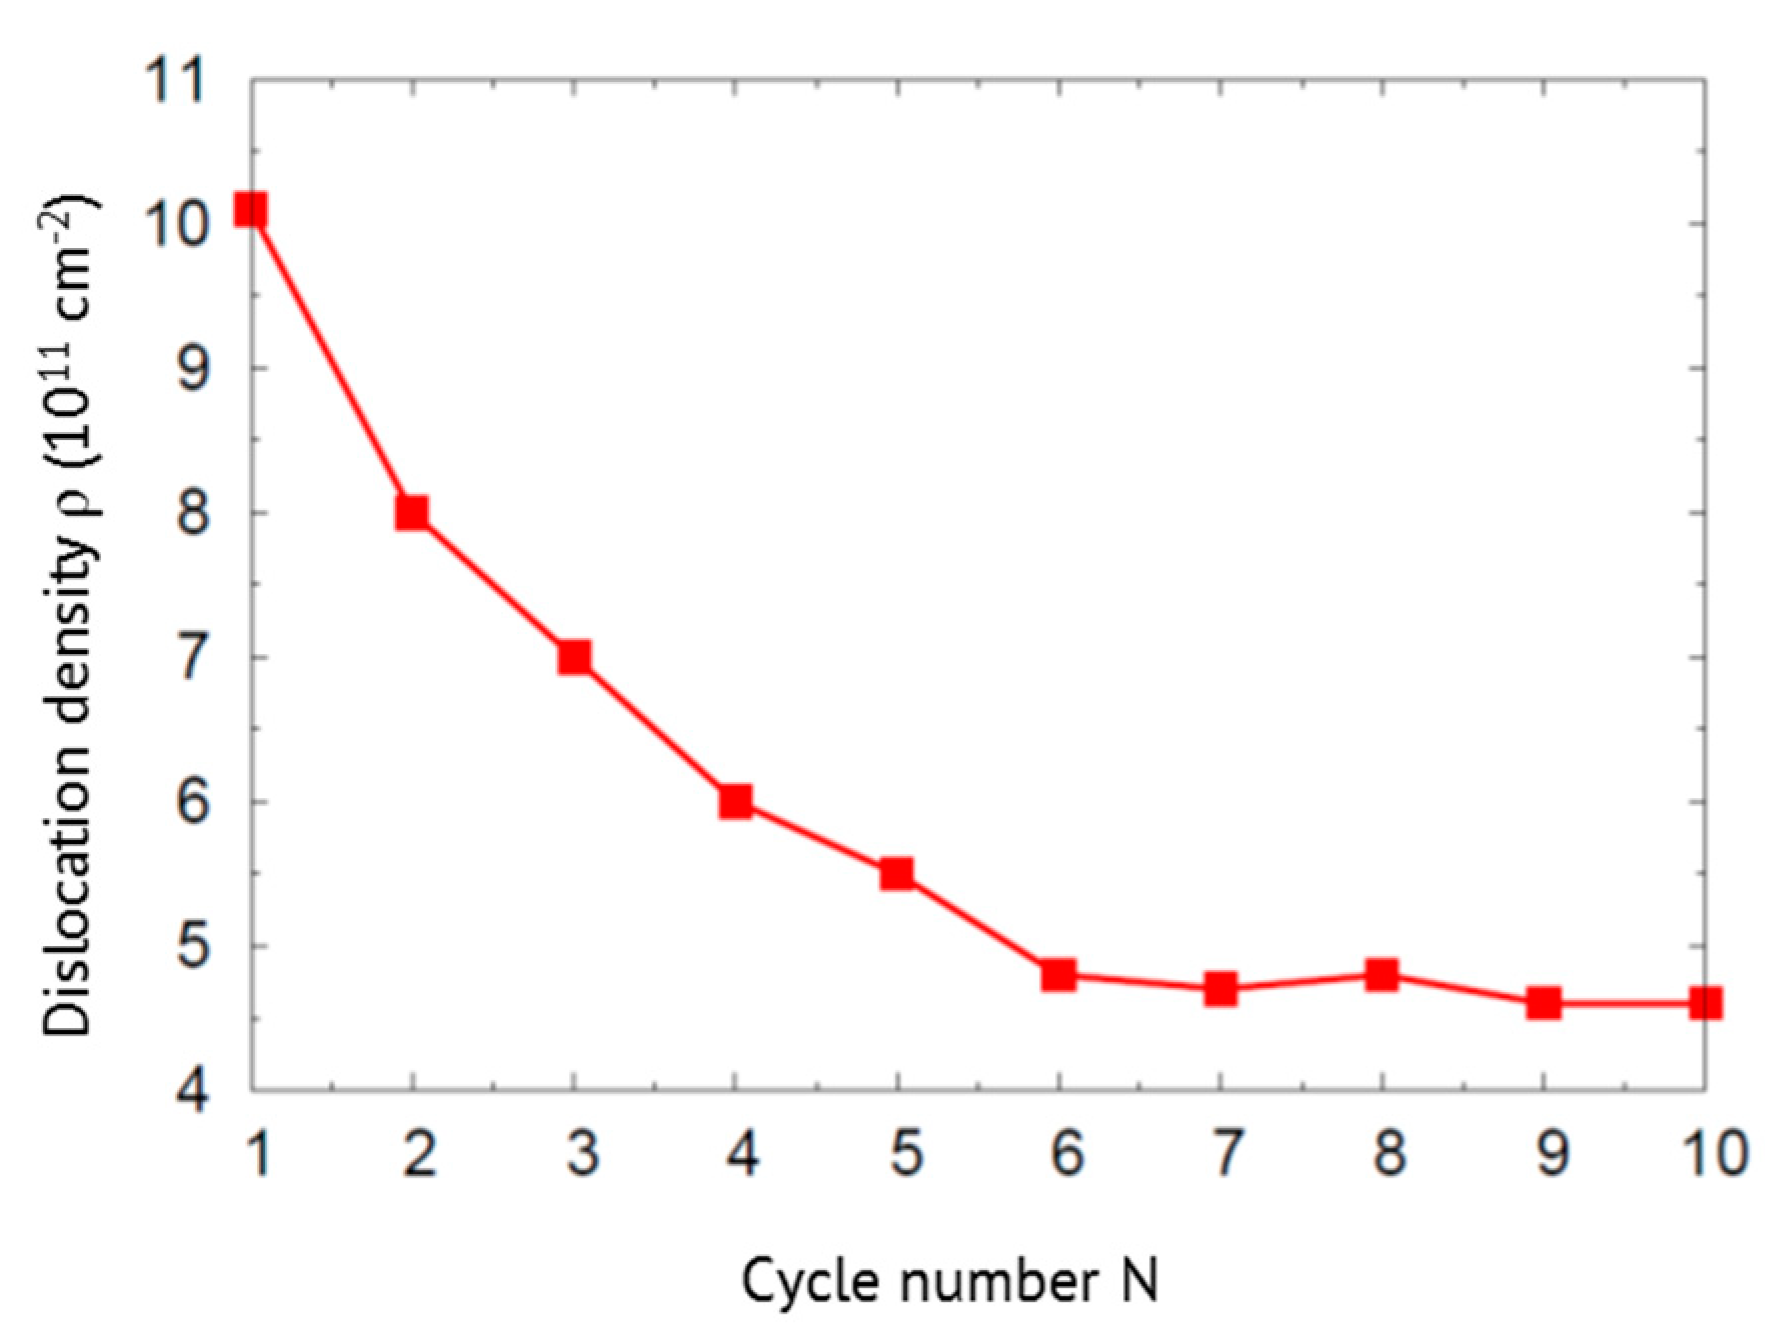
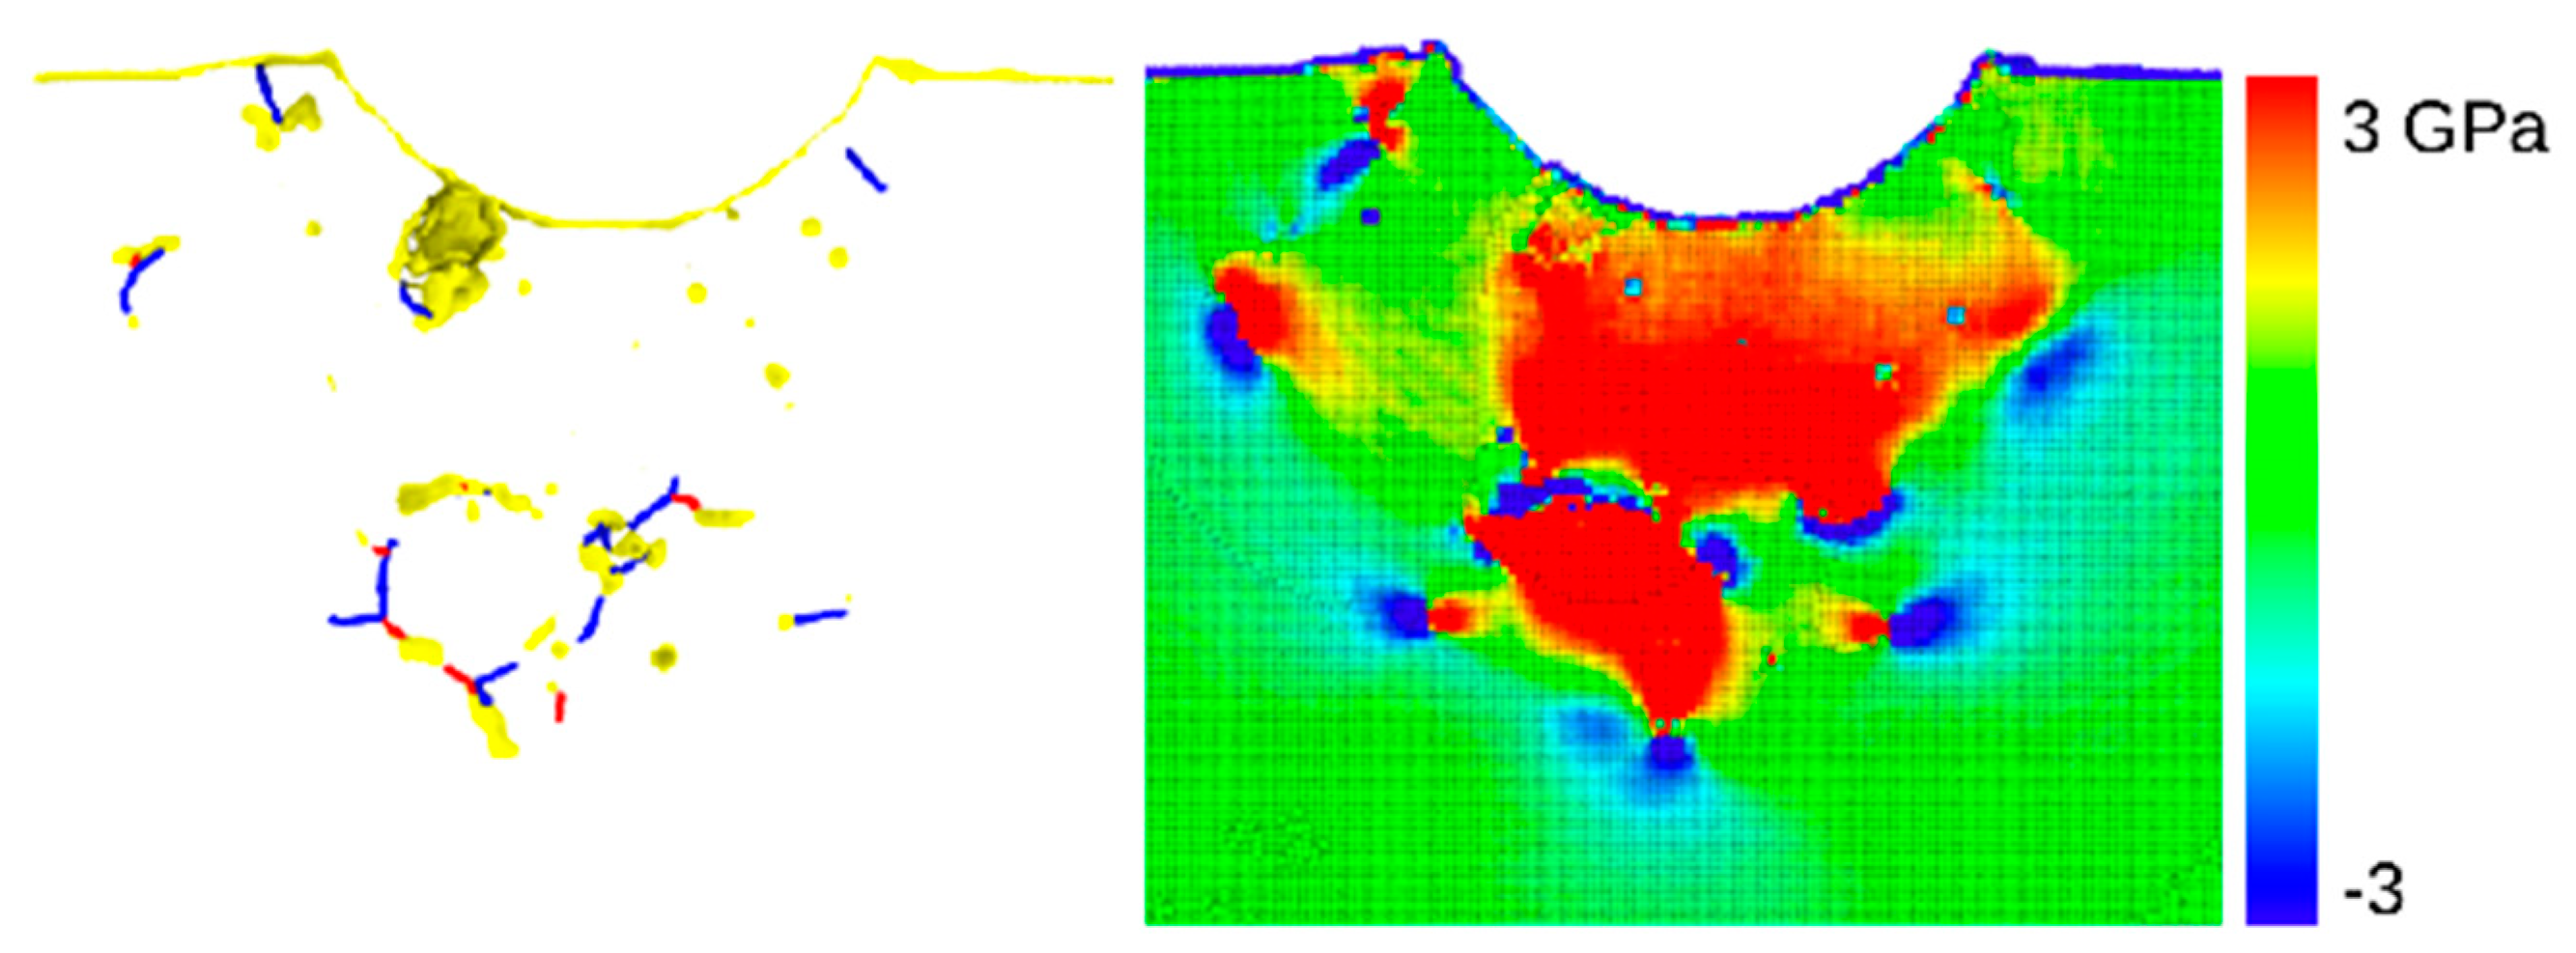
  • Under subsequent indentations: (i) the dislocation network widens slightly, since the stress gradients exerted by the indenter move the farthest shear loops further out; (ii) the network simplifies in the vicinity of the indent pit, since the highly non-equilibrium dislocation structure generated in the first indentation is subject to dislocation reactions when dislocations move in the stress fields of the subsequent indentation cycles.
  • Both effects lower the dislocation density. We thus observe in the atomistic simulations effectively a softening under cyclic indentation.
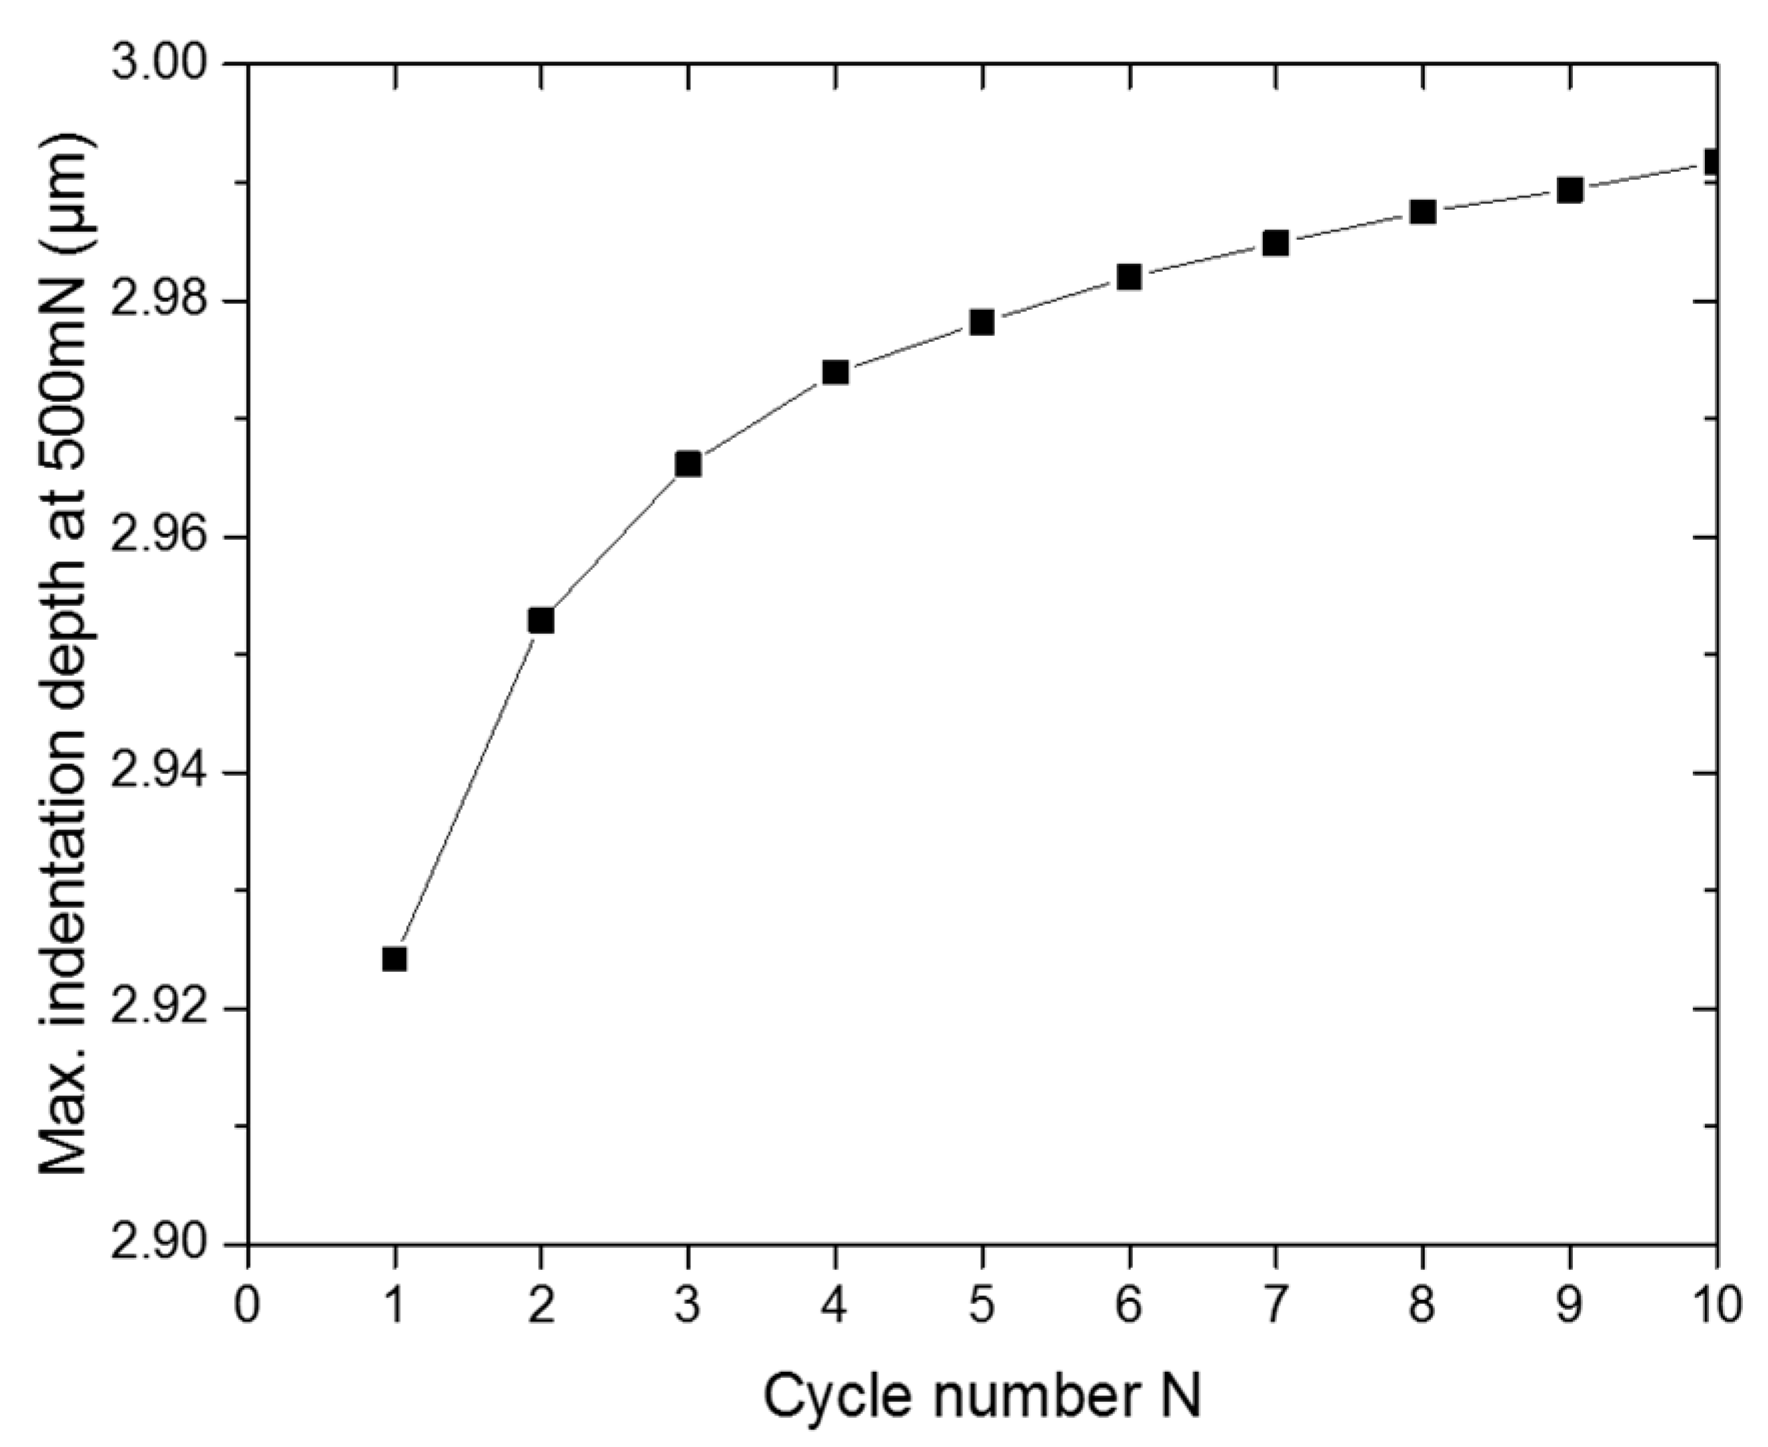
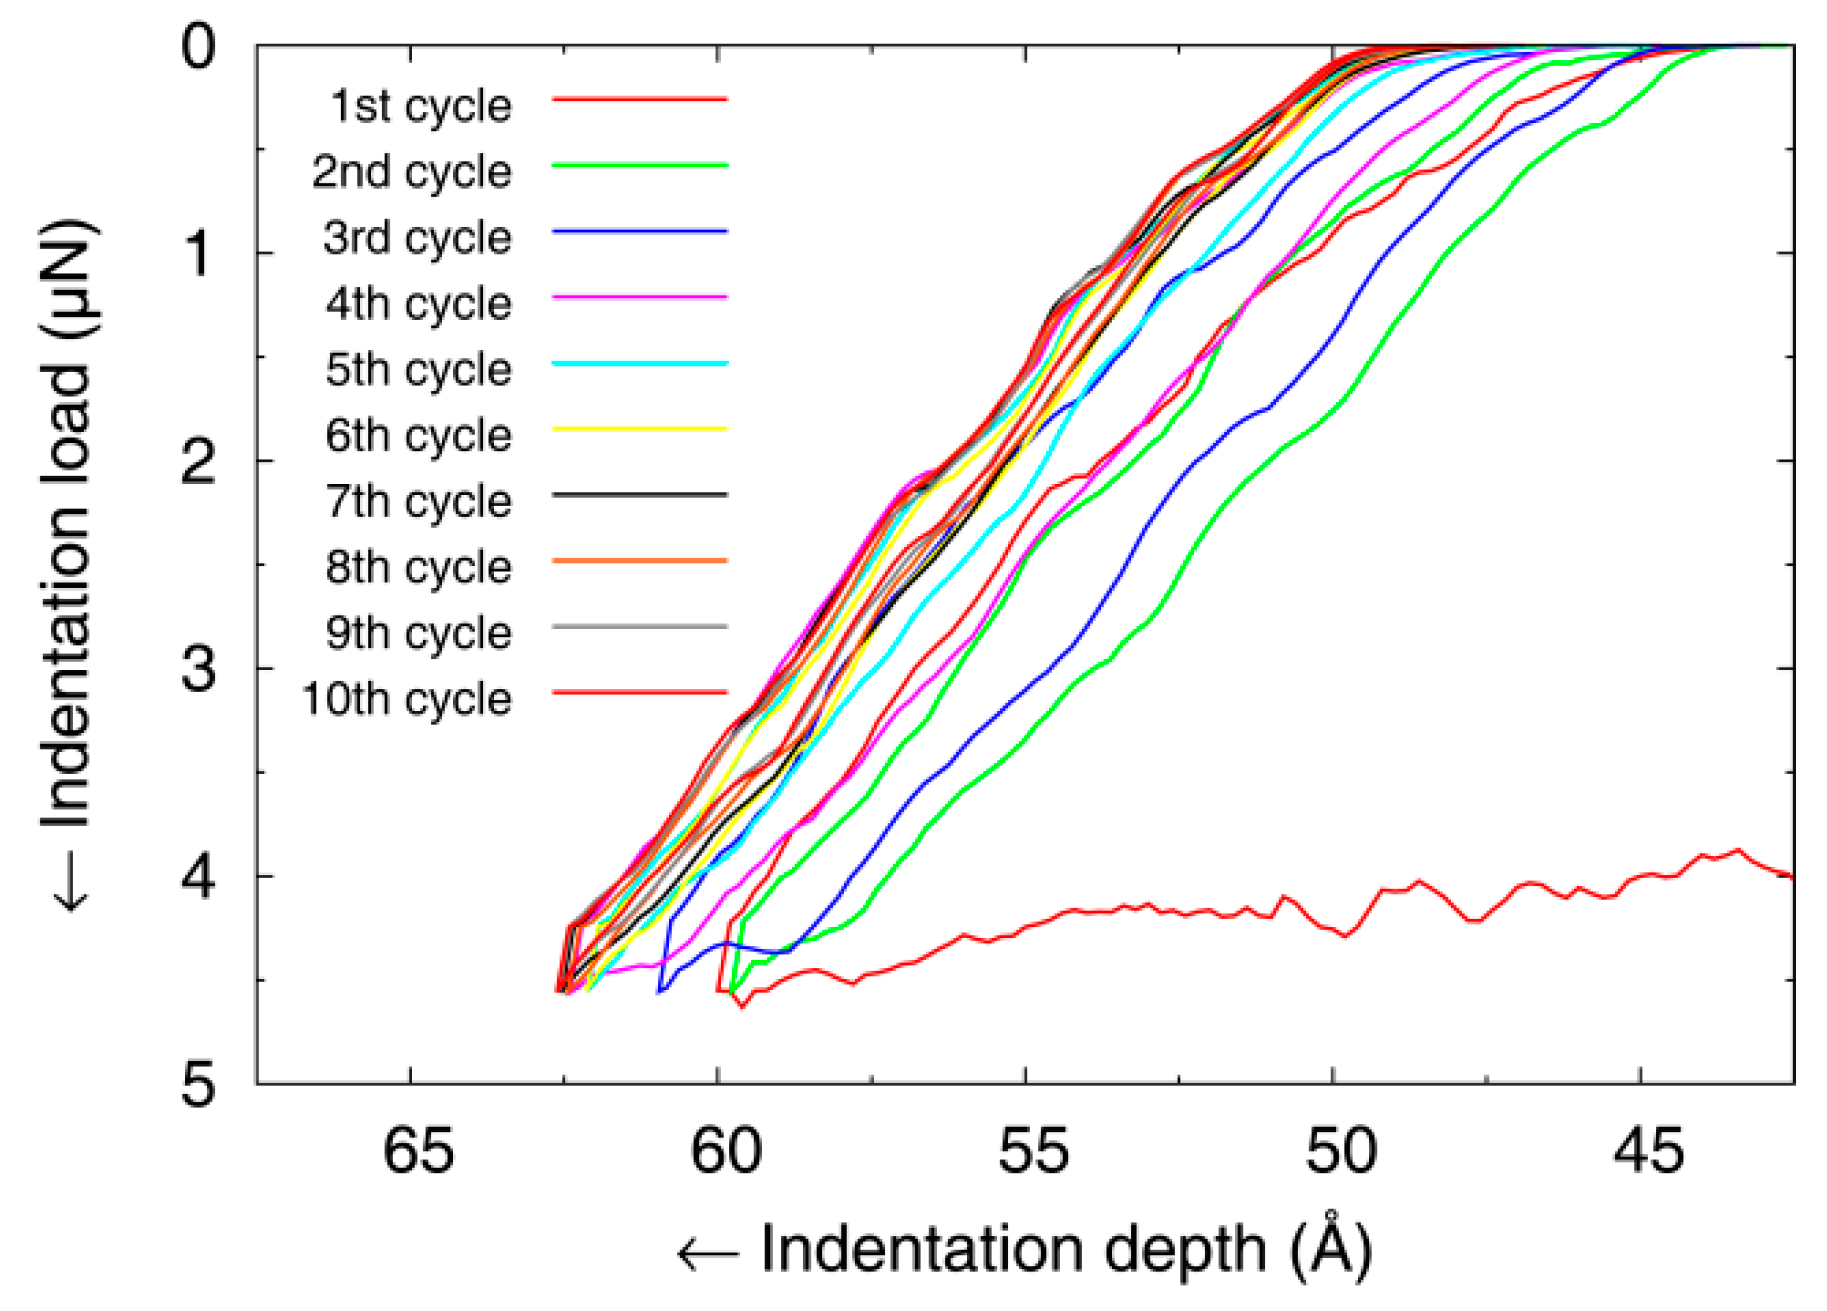
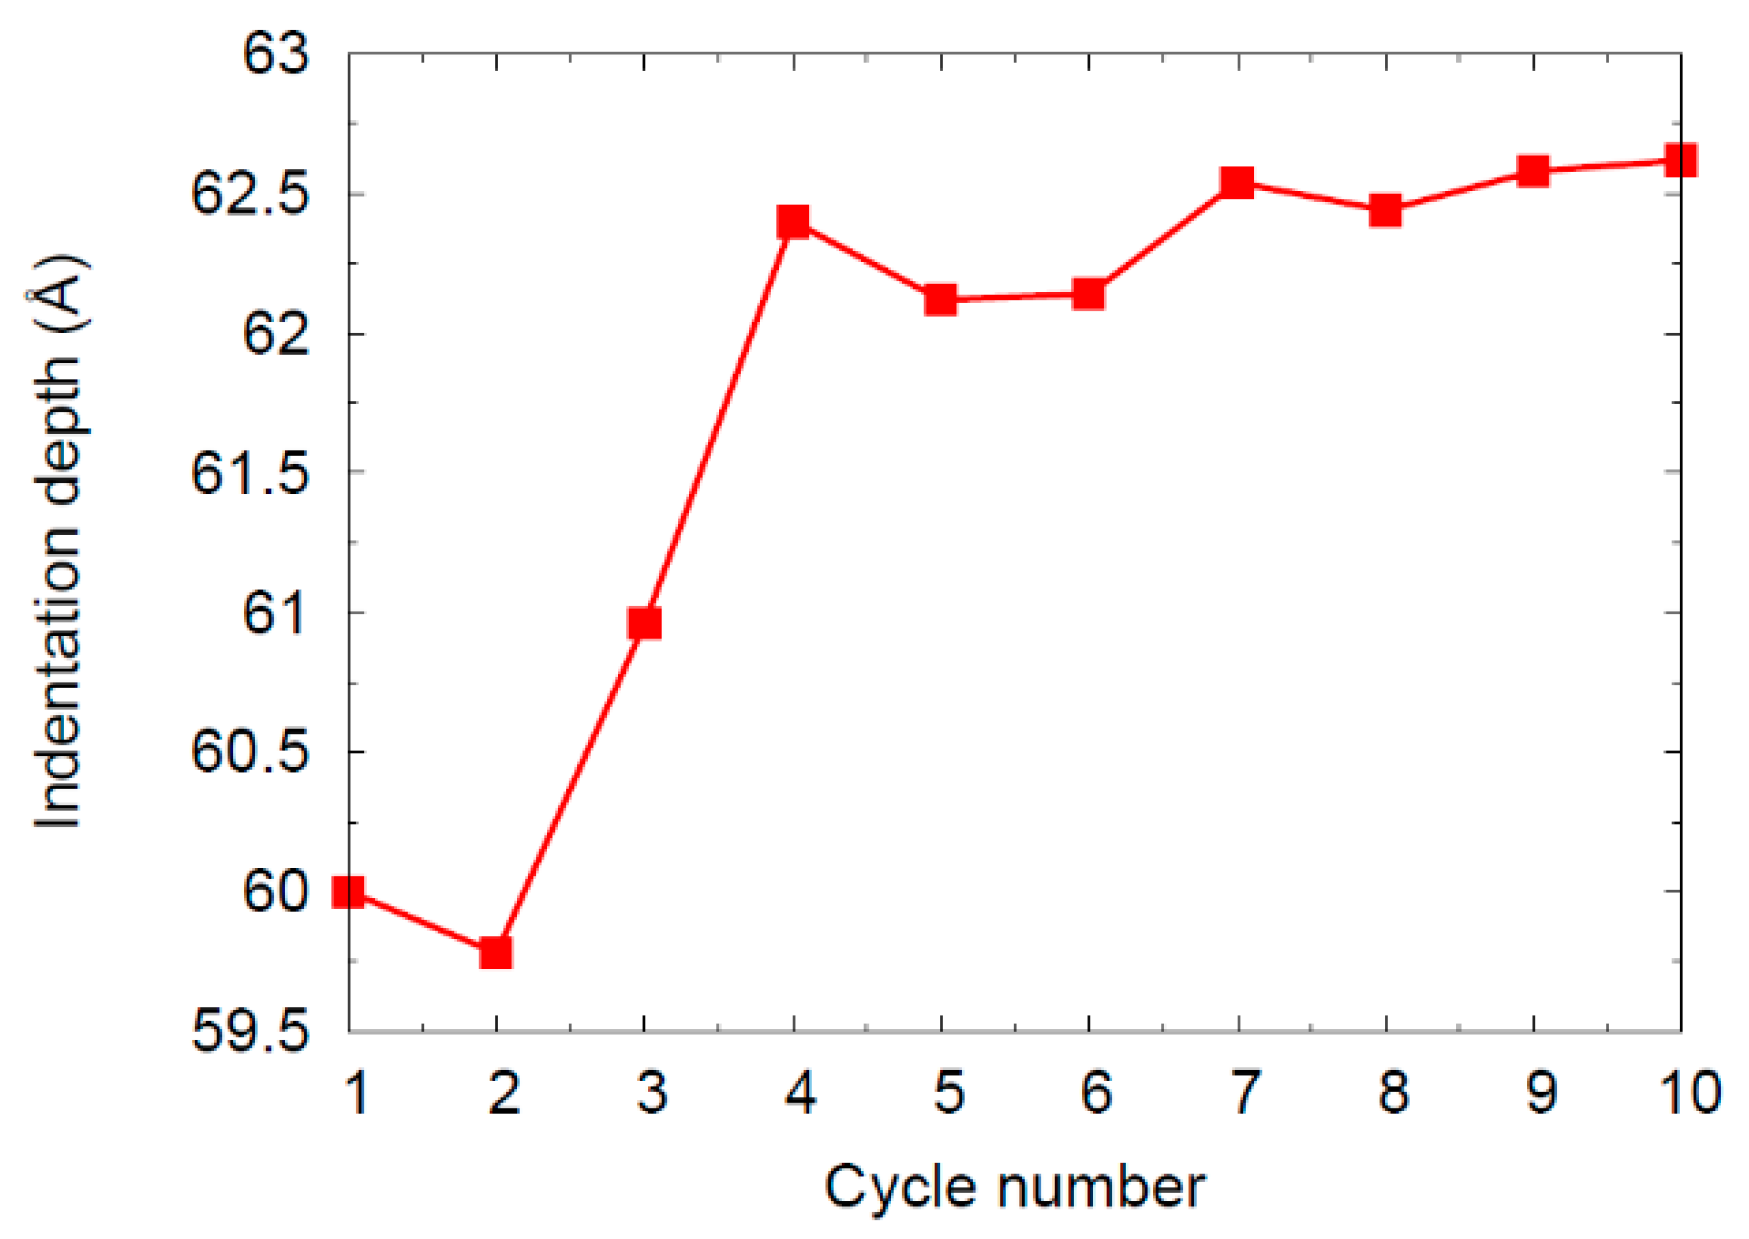
  • As a consequence, the indentation depth increases slightly under constant load.
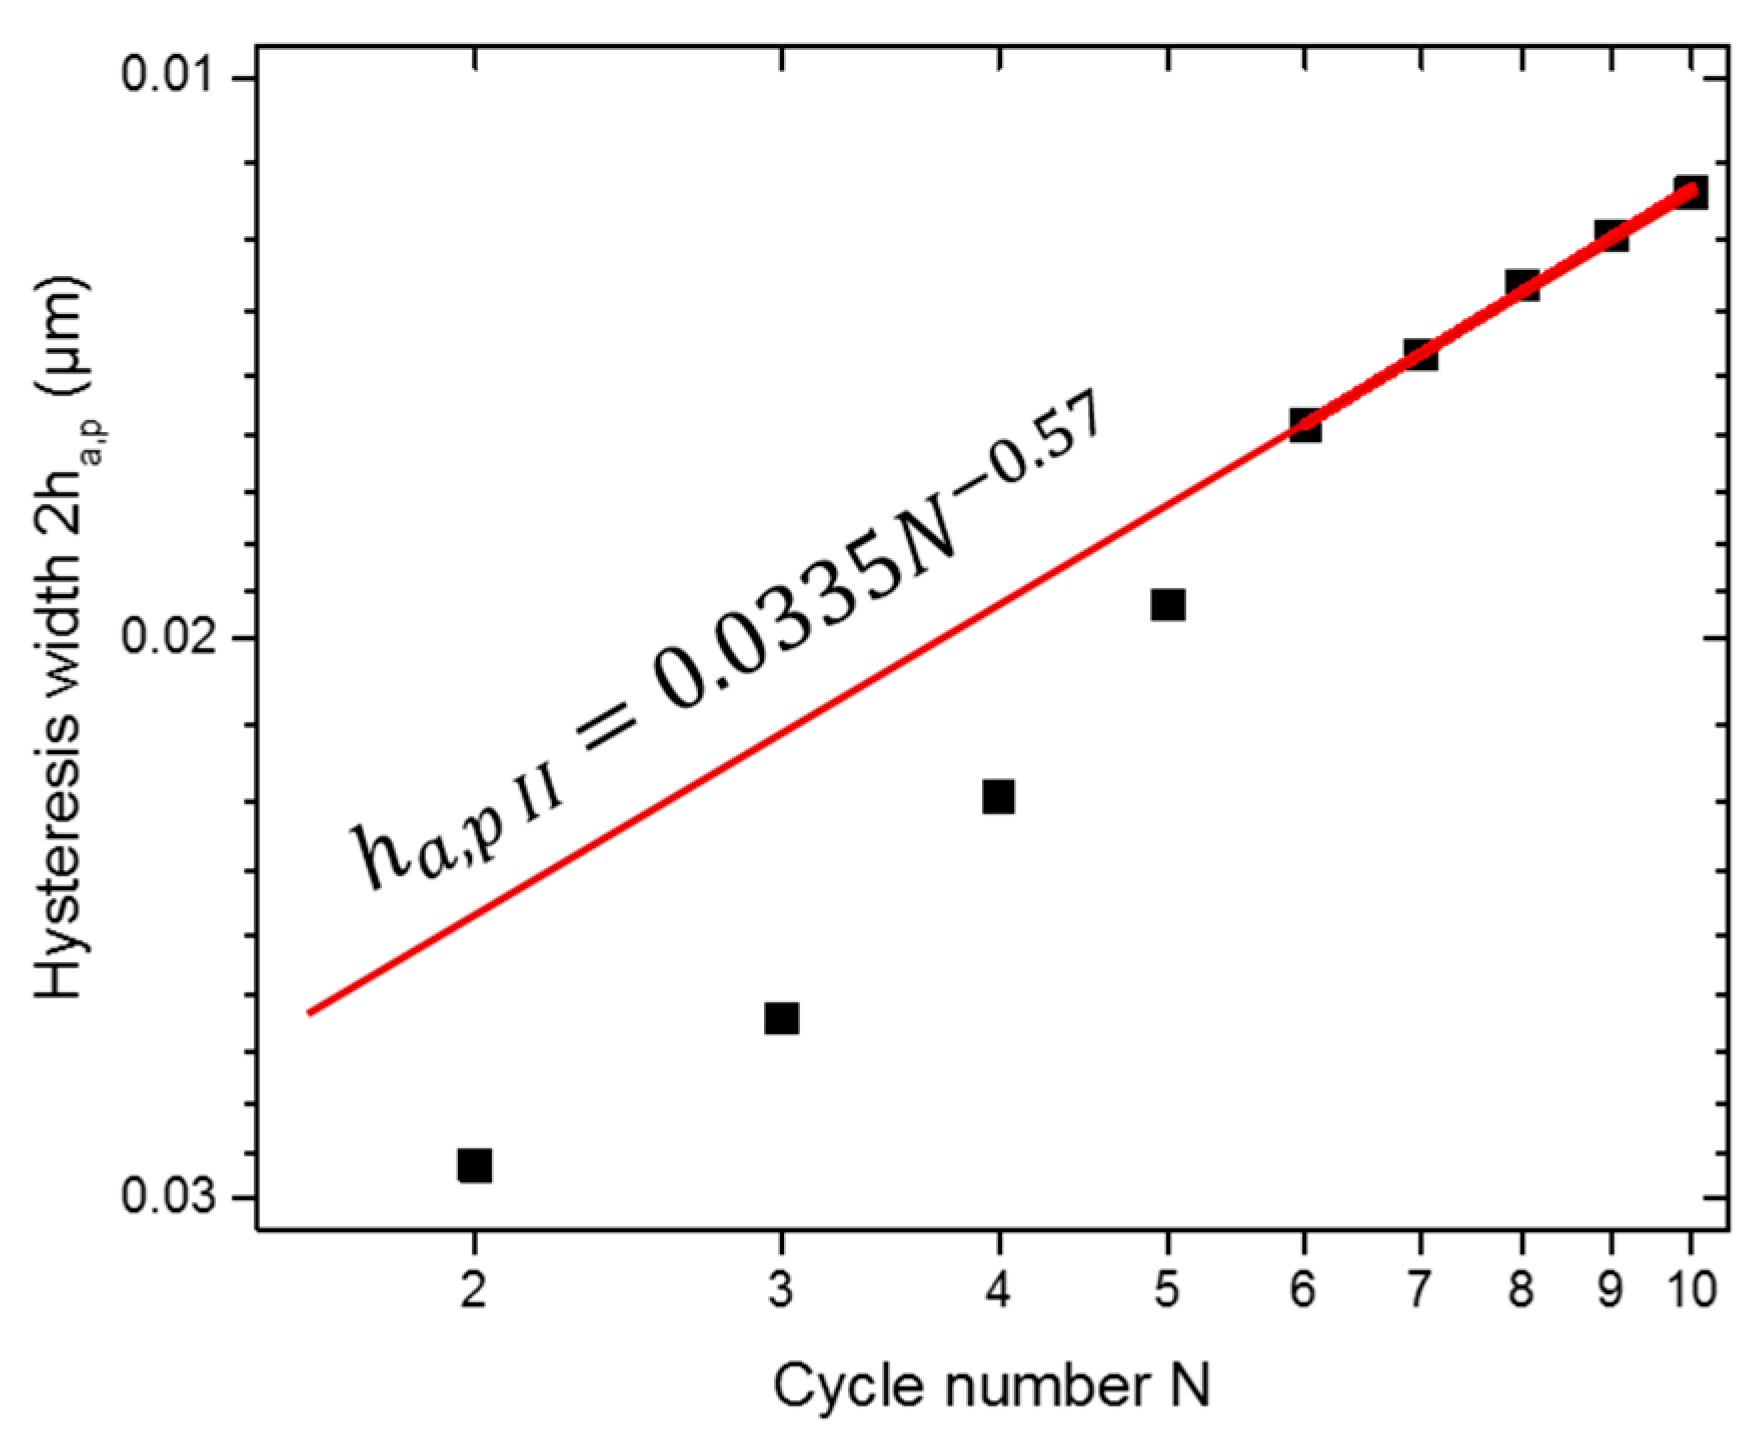
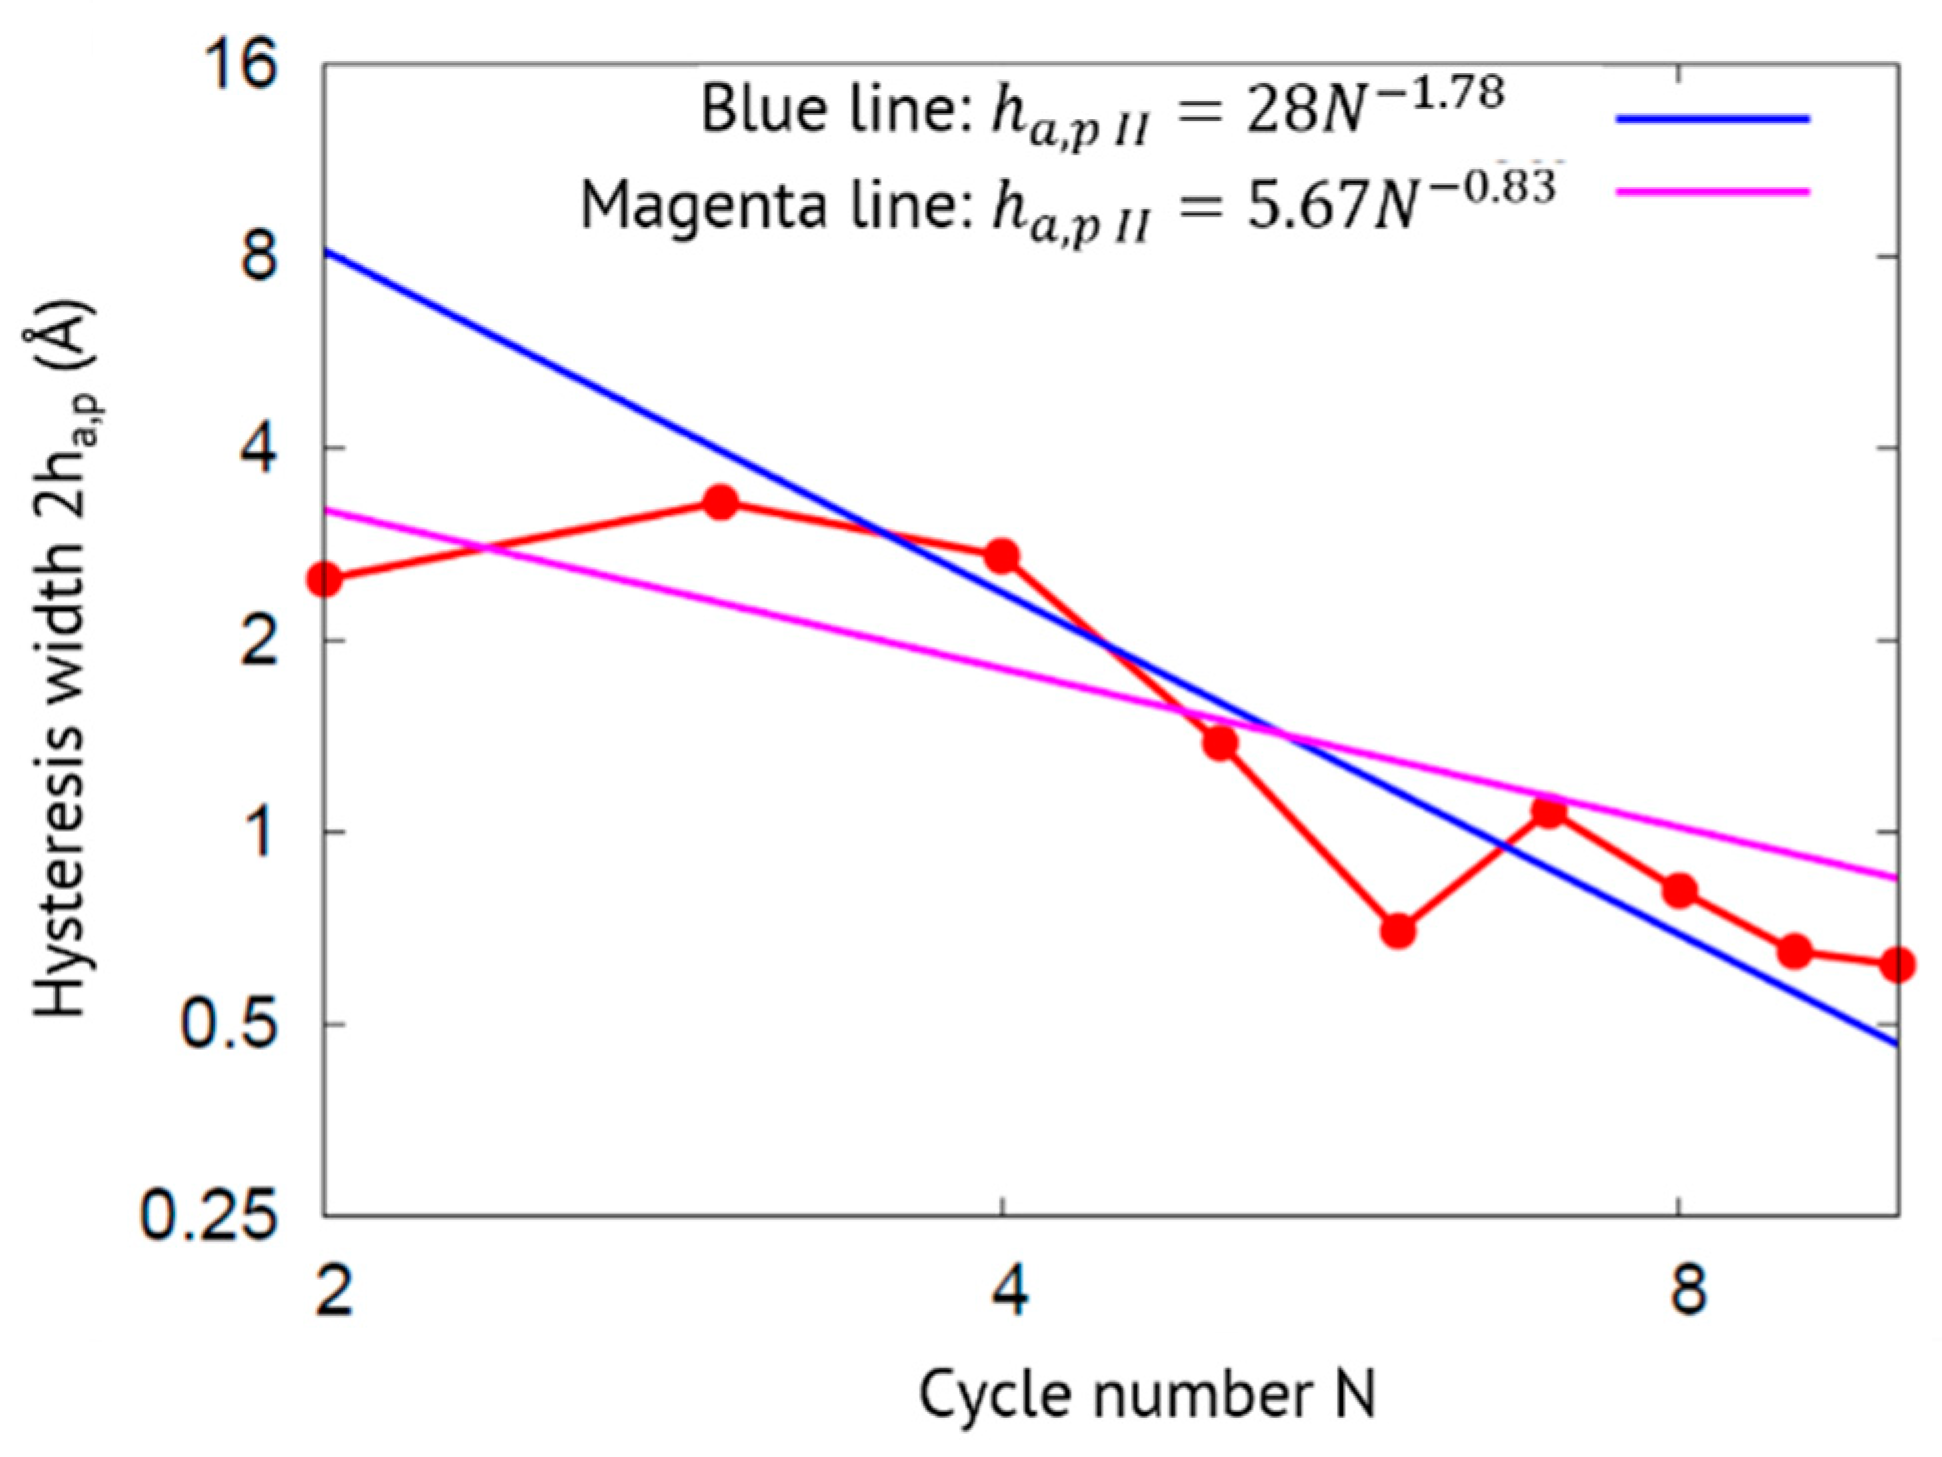
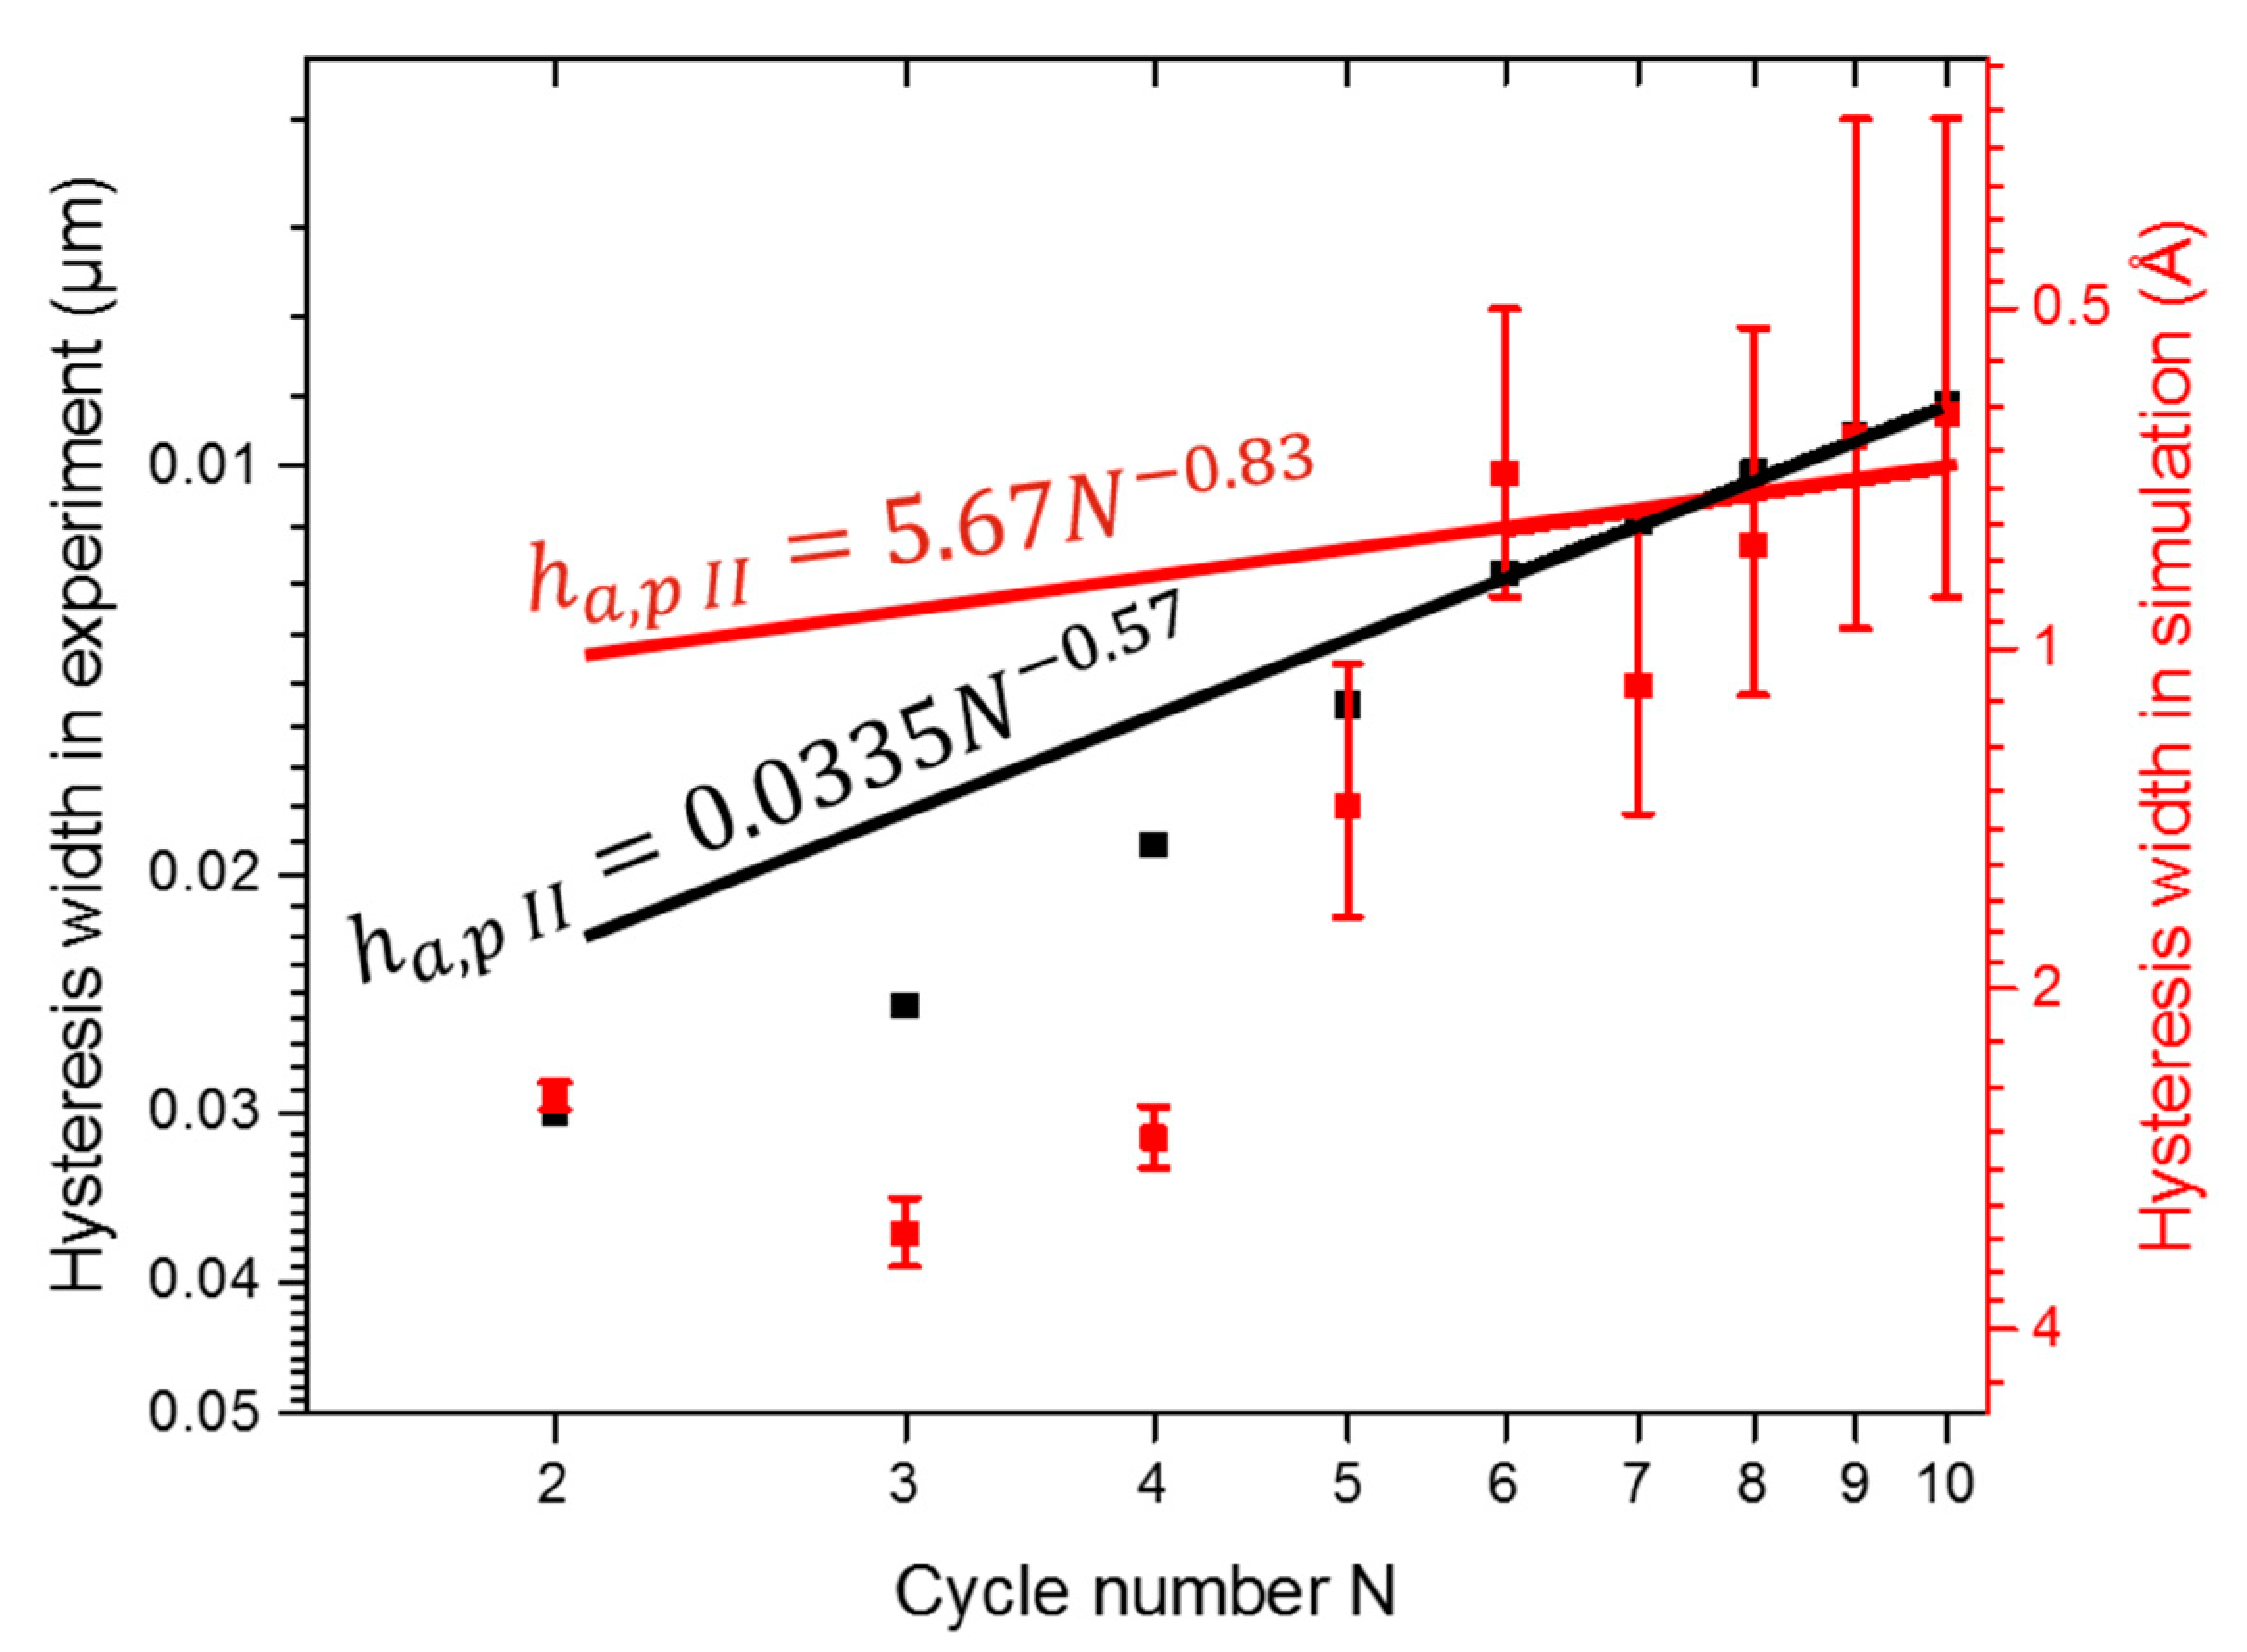
  • As the changes in the dislocation network become more and more negligible, so do the changes in the indentation depth and hysteresis width.
In the atomistic simulation, the reduction of 2ha,p can be associated with the freezing-in of dislocation reactions. While dislocations still moved under the time-varying stress fields exerted by the indenter, their motion became reversible in the sense that the network topology did not change, and energy was only dissipated by dislocation mobility. In larger-scale experiments, dislocation immobilization by pinning and formation of junctions would have a similar effect. Since the hysteresis is associated with the plastic work done under indentation, consequently, the hysteresis widths decrease.

Author Contributions

Experimental investigations, S.D.; simulations and simulation results analysis, I.A.A.; conceptualization, design of the work, supervision, and review the manuscript, M.S., T.B. and H.M.U.; writing and editing the manuscript, S.D., H.M.U.

Funding

We acknowledge support by the Deutsche Forschungs-gemeinschaft via the Sonderforschungsbereich 926–project number 172,116,086–and SFB/TRR 173 Spin+X, projects A06 and B08.

Acknowledgments

Access to the computational resources provided by the compute cluster “Elwetritsch” of the University of Kaiserslautern is appreciated.

Conflicts of Interest

The authors declare no conflict of interest.

References

  1. Schwarm, S.C.; Kolli, R.P.; Aydogan, E.; Mburu, S.; Ankem, S. Characterization of phase properties and deformation in ferritic-austenitic duplex stainless steels by nanoindentation and finite element method. Mater. Sci. Eng. A 2017, 680, 359–367. [Google Scholar] [CrossRef]
  2. Basan, R.; Franulović, M.; Smokvina Hanza, S. Estimation of cyclic stress-strain curves for low-alloy steel from hardness. Metalurgija 2010, 49, 83–86. [Google Scholar]
  3. Chicot, D.; Roudet, F.; Zaoui, A.; Louis, G.; Lepingle, V. Influence of visco-elasto-plastic properties of magnetite on the elastic modulus: Multicyclic indentation and theoretical studies. Mater. Chem. Phys. 2010, 119, 75–81. [Google Scholar] [CrossRef]
  4. Roessle, M.L.; Fatemi, A. Strain-controlled fatigue properties of steels and some simple approximations. Int. J. Fatigue 2000, 22, 495–511. [Google Scholar] [CrossRef]
  5. Blada, C.B.; Shen, Y.-L. Cyclic indentation behavior of layered nanocomposites: viscoplastic numerical study. J. Nanomech. Micromech. 2014, 4, 4013001. [Google Scholar] [CrossRef]
  6. Faisal, N.H.; Prathuru, A.K.; Goed, S.; Ahmed, R.; Droubi, M.G.; Baeke, B.D.; Fu, Y.Q. Cyclic nanoindentation and nano-impact fatigue mechanisms of functionally graded TiN/TiNi film. Shap. Mem. Superelasticity 2017, 3, 149–167. [Google Scholar] [CrossRef]
  7. Leng, Y.; Yang, G.; Hu, Y.; Zheng, L. Computer experiments on nano-indentation: A molecular dynamics approach to the elasto-plastic contact of metal copper. J. Mater. Sci. 2000, 35, 2061–2067. [Google Scholar] [CrossRef]
  8. Ruestes, C.J.; Alabd Alhafez, I.; Urbassek, H.M. Atomistic studies of nanoindentation—A review of recent advances. Crystals 2017, 7, 293. [Google Scholar] [CrossRef]
  9. Fischer-Cripps, A.C. Nanoindentation, 2nd ed.; Springer: New York, NY, USA, 2004. [Google Scholar]
  10. Cui, Y.-Y.; Jia, Y.-F.; Xuan, F.-Z. Micro-deformation evolutions of the constituent phases in duplex stainless steel during cyclic nanoindentation. Sci. Rep. 2018, 8, 6199. [Google Scholar] [CrossRef]
  11. Kramer, H.S.; Starke, P.; Klein, M.; Eifler, D. Cyclic hardness test PHYBALCHT – Short-time procedure to evaluate fatigue properties of metallic materials. Int. J. Fatigue 2014, 63, 78–84. [Google Scholar] [CrossRef]
  12. Blinn, B.; Görzen, D.; Klein, M.; Eifler, D.; Beck, T. PhyBaLCHT – Influence of indentation force on the results of cyclic hardness tests and investigations of comparability to uniaxial fatigue loading. Int. J. Fatigue 2019, 119, 78–88. [Google Scholar] [CrossRef]
  13. Deldar, S.; Smaga, M.; Beck, B. Investigating the fatigue behavior of grain-oriented Fe-3%Si steel sheets using magnet-optical Kerr microscopy and micromagnetic multiparameter, microstructure and stress analysis. MATEC Web Conf. 2018, 165, 06006. [Google Scholar] [CrossRef] [Green Version]
  14. Bambach, M.D.; Bleck, W.; Kramer, H.S.; Klein, M.; Eifler, D.; Beck, T.; Surm, H.; Zoch, H.-W.; Hoffmann, F.; Radulescu, A. Tailoring the hardening behavior of 18CrNiMo7-6 via Cu alloying. Steel Res. Int. 2016, 87, 550–561. [Google Scholar] [CrossRef]
  15. Plimpton, S. Fast parallel algorithms for short-range molecular dynamics. J. Comput. Phys. 1995, 117, 1–19. [Google Scholar] [CrossRef]
  16. Ruestes, C.J.; Bringa, E.M.; Gao, Y.; Urbassek, H.M. Molecular dynamics modeling of nanoindentation. In Applied Nanoindentation in Advanced Materials; Tiwari, A., Natarajan, S., Eds.; Wiley: Chichester, UK, 2017; pp. 313–345. [Google Scholar]
  17. Klechner, C.L.; Plimpton, S.J.; Hamilton, J.C. Dislocation nucleation and defect structure during surface indentation. Phys. Rev. B 1998, 58, 11085–11088. [Google Scholar] [CrossRef]
  18. Ziegenhain, G.; Hartmaier, A.; Urbassek, H.M. Pair vs. many-body potentials: Influence on elastic and plastic behavior in nanoindentation of fcc metals. J. Mech. Phys. Sol. 2009, 57, 1514–1526. [Google Scholar] [CrossRef]
  19. Mendelev, M.I.; Han, S.; Srolovitz, D.J.; Ackland, G.J.; Sun, D.Y.; Asta, M. Development of new interatomic potentials appropriate for crystalline and liquid iron. Philos. Mag. 2003, 83, 3977–3994. [Google Scholar] [CrossRef]
  20. Stukowski, A.; Albe, K. Extracting dislocations and non-dislocation crystal defects from atomistic simulation data. Model. Silul. Mater. Sci. Eng. 2010, 18, 085001. [Google Scholar] [CrossRef]
  21. Henderson, A. Paraview Guide, a Parallel Visualization Application; Kitware Inc.: Clifton Park, NY, USA, 2007; Available online: http://www.paraview.org (accessed on 9 May 2019).
  22. Stukowski, A. Visualization and analysis of atomistic simulation data with OVITO–the Open Visualization Tool. Modell. Simul. Mater. 2010, 18, 015012. [Google Scholar] [CrossRef]
  23. Remington, T.P.; Ruestes, C.J.; Bringa, E.M.; Remington, B.A.; Lu, C.H.; Kad, B.; Meyers, M.A. Plastic deformation in nanoindentation of tantalum: A new mechanism for prismatic loop formation. Acta Mater. 2014, 78, 378–393. [Google Scholar] [CrossRef]
  24. De Guzman, M.S.; Neubauer, G.; Flinn, P.; Nix, W.D. The role of indentation depth on the measured hardness of materials. Mater. Res. Soc. Symp. Proc. 1993, 308, 613–618. [Google Scholar] [CrossRef]
  25. Nix, W.D.; Gao, H. Indentation size effects in crystalline materials: A law for strain gradient plasticity. J. Mech. Phys. Sol. 1998, 46, 411–425. [Google Scholar] [CrossRef]
  26. Swadener, J.G.; George, E.P.; Pharr, G.M. The correlation of the indentation size effect measured with indenters of various shapes. J. Mech. Phys. Sol. 2002, 50, 681–694. [Google Scholar] [CrossRef]
  27. Cotterill, R.M.J. Does dislocation density have a natural limit? Phys. Lett. A 1977, 60, 61–62. [Google Scholar] [CrossRef]
Figure 1. Schematic grain structure of the Goss texture longitudinal to the rolling direction (a) and the cyclic hardness indentation (b) of investigated electrical steel sheet.
Metals 09 00541 g001
Figure 2. Description of the PHYBALCHT with determination of the (a) ha,p and (b) power-law ha,pI for 2 ≤ N ≤ 4 and ha,pII for N > 4, reproduced from [11,12], with permission from Elsevier, 2019.
Metals 09 00541 g002
Figure 3. Experimental load-depth curves of cyclic indentation (10 loading–unloading cycles).
Metals 09 00541 g003
Figure 4. Hysteresis curve formed after the second indentation cycle, and plastic indentation depth amplitude ha,p at 250 mN.
Metals 09 00541 g004
Figure 5. Dependence of maximum indentation depth (at Fmax) on the indentation cycle number in the experiment.
Metals 09 00541 g005
Figure 6. Plastic indentation depth amplitude ha,p vs indentation cycles N and the power-law describing the ha,pII with respect to N for N ≥ 6.
Metals 09 00541 g006
Figure 7. Snapshots of the dislocation network after (top) the first and (bottom) tenth indentations. Yellow: deformed surface and other unidentified defects. Dislocations are colored according to their Burgers vector b: blue ½ <111>, red <100>.
Metals 09 00541 g007
Figure 8. Dependence of the total dislocation length during cyclic indentation at full penetration and after the retraction of the indenter on cycle number.
Metals 09 00541 g008
Figure 9. Change of the dislocation structure during the third cycle. Colors denote dislocation type as in Figure 7. The white circle highlights the region where the most changes in dislocation structure occurred during this cycle.
Metals 09 00541 g009
Figure 10. Dependence of the plastic-zone radius Rpl during cyclic indentation on cycle number.
Metals 09 00541 g010
Figure 11. Dependence of the dislocation density in the plastic zone on cycle number.
Metals 09 00541 g011
Figure 12. Comparison of the (right) hydrostatic pressure and (left) dislocation in the specimen at the end of the 10th cycle. Positive pressures are compressive, negative pressures are tensile. Dislocations are colored as in Figure 7. The figure shows a cross-sectional view on the indented specimen; the thickness of the slab in the left-hand image is 2 nm.
Metals 09 00541 g012
Figure 13. Load-depth curves during cyclic indentation (10 loading–unloading cycles).
Metals 09 00541 g013
Figure 14. Dependence of the maximum indentation depth on cycle number.
Metals 09 00541 g014
Figure 15. Dependence of the hysteresis width 2ha,p on cycle number and fits a power-law, Equation (1). Two fits are provided to demonstrate the limits of the power-law exponents obtained.
Metals 09 00541 g015
Figure 16. Comparison of experimental and simulated hysteresis widths as a function of cycle number N.
Metals 09 00541 g016
Table 1. Chemical composition of the investigated grain-oriented electrical steel (GOES).
Chemical CompositionCMnSiFe
In wt%0.0070.0803.230Bal.
In at%0.030.766.22Bal.
Table 2. Mechanical properties of the investigated grain-oriented electrical steel.
DescriptionValue
Elastic modulus110 ± 10 GPa
Yield stress320 ± 5 MPa
Tensile strength325 ± 2 MPa
Hardness180 ± 5 HV0.1

