Article

Effect of Si Content on the Corrosion Behavior of 420 MPa Weathering Steel

1
State Key Laboratory of Metastable Materials Science & Technology, Yanshan University, Qinhuangdao 066044, China
2
National Engineering Research Center for Equipment and Technology of Cold Strip Rolling, Yanshan University, Qinhuangdao 066004, China
*
Author to whom correspondence should be addressed.
Metals 2019, 9(5), 486; https://doi.org/10.3390/met9050486
Submission received: 2 April 2019 / Revised: 19 April 2019 / Accepted: 23 April 2019 / Published: 26 April 2019
(This article belongs to the Special Issue Surface Chemistry and Corrosion of Light Alloys)

Abstract

:
The effect of Si content (0.12%, 0.34%, and 0.48%) on the corrosion behavior of weathering steel in a simulated marine environment was investigated in a dry/wet alternating cycle corrosion experiment. Corrosion weight gain, X-ray diffraction (XRD), scanning electron microscope (SEM), energy dispersive spectroscopy (EDS), X-ray photoelectron spectroscopy (XPS), and electrochemical methods were used to measure the regularity and nature of the rust. The results show that the corrosion process could be divided into an initial stage where the corrosion rate increased and a later stage where the corrosion rate decreased before remaining stable. The corrosion rate was the lowest for a Si content in the weathering steel of 0.48%. The corrosion products of all three steel groups contains α-FeOOH, β-FeOOH, γ-FeOOH, Fe3O4, and large amounts of amorphous compounds. Furthermore, Si benefits the transformation of β-FeOOH and γ-FeOOH to stable phases. The addition of the Si alloying element is beneficial to the formation of dense and compact rust layers that enhance the electrochemical resistance of weathering steel and silicon oxide influences the self-corrosion potential of the corrosion products.

1. Introduction

The negative influences of corrosion are significant in modern life. According to previous research, the overall losses from corrosion in some countries amounts to at least 3% of the gross domestic product (GDP) and more than 50% of this amount accounts for atmospheric environment corrosion [1,2]. Weathering steel is a low alloy steel mixed with a given amount of alloying elements in ordinary carbon steel. Weathering steel is used to reduce the impact of corrosion. It is generally left exposed to the atmosphere and widely used on outdoor steel structures. In recent years, weathering steels were more frequently used for road bridges, especially for bridges with upper bridge deck [3,4,5]. The crystalline corrosion products formed on the metal surface in a long-term exposure environment mainly include α-FeOOH, β-FeOOH, γ-FeOOH, and Fe3O4. They play an important role in protecting long-term exposure weathering steel from corrosion [6]. The protective layer formed on the surface of weathering steel is more compact in structure and weathering steel has a higher corrosion resistance than carbon steel so that it can be used in a variety of atmospheric environments for a long time [7,8,9]. The corrosion resistance of weathering steel exposed to a corrosive environment for a long time depends on the alloying elements added [10]. One goal is to produce high performance weathering steel by adjusting the type and the amount of alloying elements. By adding Ni, Cu, Cr, and other alloying elements to carbon steel, the United States and Japan have obtained weathering steel with a stronger protective oxide film since these elements will be distributed in the rust layer to enhance its density [7,11,12,13,14]. However, Ni, Cu, and Cr are expensive and difficult to extract. Therefore, adding Si element as a ubiquitous element in nature to regulate the weathering resistance of steel to achieve low cost and wide application, which has become an urgent problem to be solved. The addition of a higher content of Si to steel can promote the formation of M/A constituents and deteriorate the impact toughness of heat affected zones from welding, which reduces the welding performance of the steel [15,16]. However, the tensile strength of weathering steel with Si can be improved by solid solution strengthening without increasing the carbon content. Therefore, it is necessary to study the influence of the Si content on the corrosion resistance to determine the tolerable amount of Si [17]. Studies have shown that Si element has beneficial effects on weathering steel when it interacts with other elements. Kim et al. [18] believe that the addition of Si via a long-term dry/wet cycle benefits the corrosion resistance of calcium-modified weathering steel. Nishimura et al. [19,20] found that the combined action of Si and Al can increase the resistance of the rust layer since both elements favor nano-scale complex iron oxides formation in the layer of iron rust, which suppresses the corrosion process. Nevertheless, there are contradicting results on the influence of single Si element in low-alloy steel. J.A. Mejia Gomez et al. [21] studied the different Si contents (1%, 2%, and 3%) in low-alloy steel by using the cyclic immersion simulation of a marine environment to accelerate the experiment. They concluded that Si promotes the formation of rust layer containing fine grains so that the corrosion rate of steel decreases with the increase in Si content, thereby improving the corrosion resistance of steel. However, Zhang [22] simulated the industrial atmospheric environment by accelerating the cycle immersion test and concluded that the addition of Si helped the rust layer on the surface of weathering steel fall off easier and deteriorate the corrosion performance.
Based on the above results, the influence of Si in the corrosion process needs further confirmation. We simulated the marine environment in dry/wet alternate accelerant corrosion to study the corrosion regularity for different Si contents in 420 MPa weathering steel. The specific role Si plays as an alloying element in the corrosion process was explored. The corrosion mechanism was revealed for the Si alloying element content in the weathering steel.

2. Materials and Experimental

2.1. Materials

The experimental steel was melted with a 100 Kg vacuum induction furnace. The chemical composition of the three steel groups is shown in Table 1. The ingots were heated and poured into a 5-mm thick steel plate. The microstructure of the steels is shown in Figure 1. It was mainly composed of bainite and ferrite.

2.2. Sample Preparation

The specimens for the corrosion test were cut to a 20 mm × 20 mm × 4 mm size. Each specimen was mounted in cured epoxy resin. All specimens were ground with 150 to 1000 grit silicon carbide paper and cleaned with acetone after they were rinsed with distilled water. The samples were stored in a dry environment for 24 h before use.

2.3. Accelerated Corrosion Test

We simulated the coastal atmosphere with a 0.3% NaCl solution. The test sequence was separated into five stages: (1) wetting the sample surfaces with 0.4 L/m2 of 0.3% NaCl solution in mass; (2) placing the samples in a constant temperature and humidity chamber (25 °C, RH 60%) for 12 h; (3) rinsing the samples with distilled water to dissolve the salt remaining on the surface and avoid corrosion growth; (4) placing the washed samples were put in a drying set at 25 °C for 1 h; (5) repeating steps (1–4). A cycle of wet/dry process lasted 12 h. The total duration was 120 cycles for two months. The anti-corrosion performance was tested by taking samples periodically. The weight gain of a unit area was calculated by (W1W0)/S where W1 is the sample weight after the drying link (step 4) every two corrosion cycles. The initial mass of the parallel samples for each type of steel was weighed W0, and S is the corrosion area on the sample. The regularity of the weight gain in the distinguished steels was evaluated.

2.4. Analysis of Corrosion Products

Rust powder was examined using a X-ray diffraction system (Rigaku D/max-2500/PC, Rigaku, Tokyo, Japan). The samples underwent an angle measurement in the range of 10° to 75° at 0.02°/s with a Cu target. The voltage and the current were 40 kV and 200 mA, respectively. The microstructure of the rust was observed in a scanning electron microscope (SEM, Hitachi S-3400, Hitachi, Tokyo, Japan) at a cathode voltage of 15 kV and a current of 40 mA. The rust layer closest to the steel substrate was scraped off and the elemental composition was measured by energy dispersive spectroscopy (EDS, Hikari EDAX, EDAX Inc., Mahwah, NJ, USA). The alloying element oxides precipitated from the surface of the steel matrix were analyzed by X-ray photoelectron spectroscopy (XPS, EscaLab 250xi, EscaLab, MA, USA) and the state of the alloying element was determined.

2.5. Electrochemical Experiments

A three-electrode system was employed to test the electrochemical properties of the rust. Polarization measurements were performed at 0.001667 mV/s in a saturated 0.3% NaCl solution in mass at 25 °C using a saturated calomel electrode as the reference and a Pt electrode as the counter. A 10 mm × 10 mm corrosion sample was the working electrode. Electrochemical impedance spectroscopy (EIS, CHI660e, CHI, Shanghai, China) measurements were carried out in the 100 kHz–10 mHz frequency range at the open circuit potential. Before all the electrochemical experiments were performed, the specimens were kept in the solution for 30 min to reach a stable open circuit potential.

3. Results

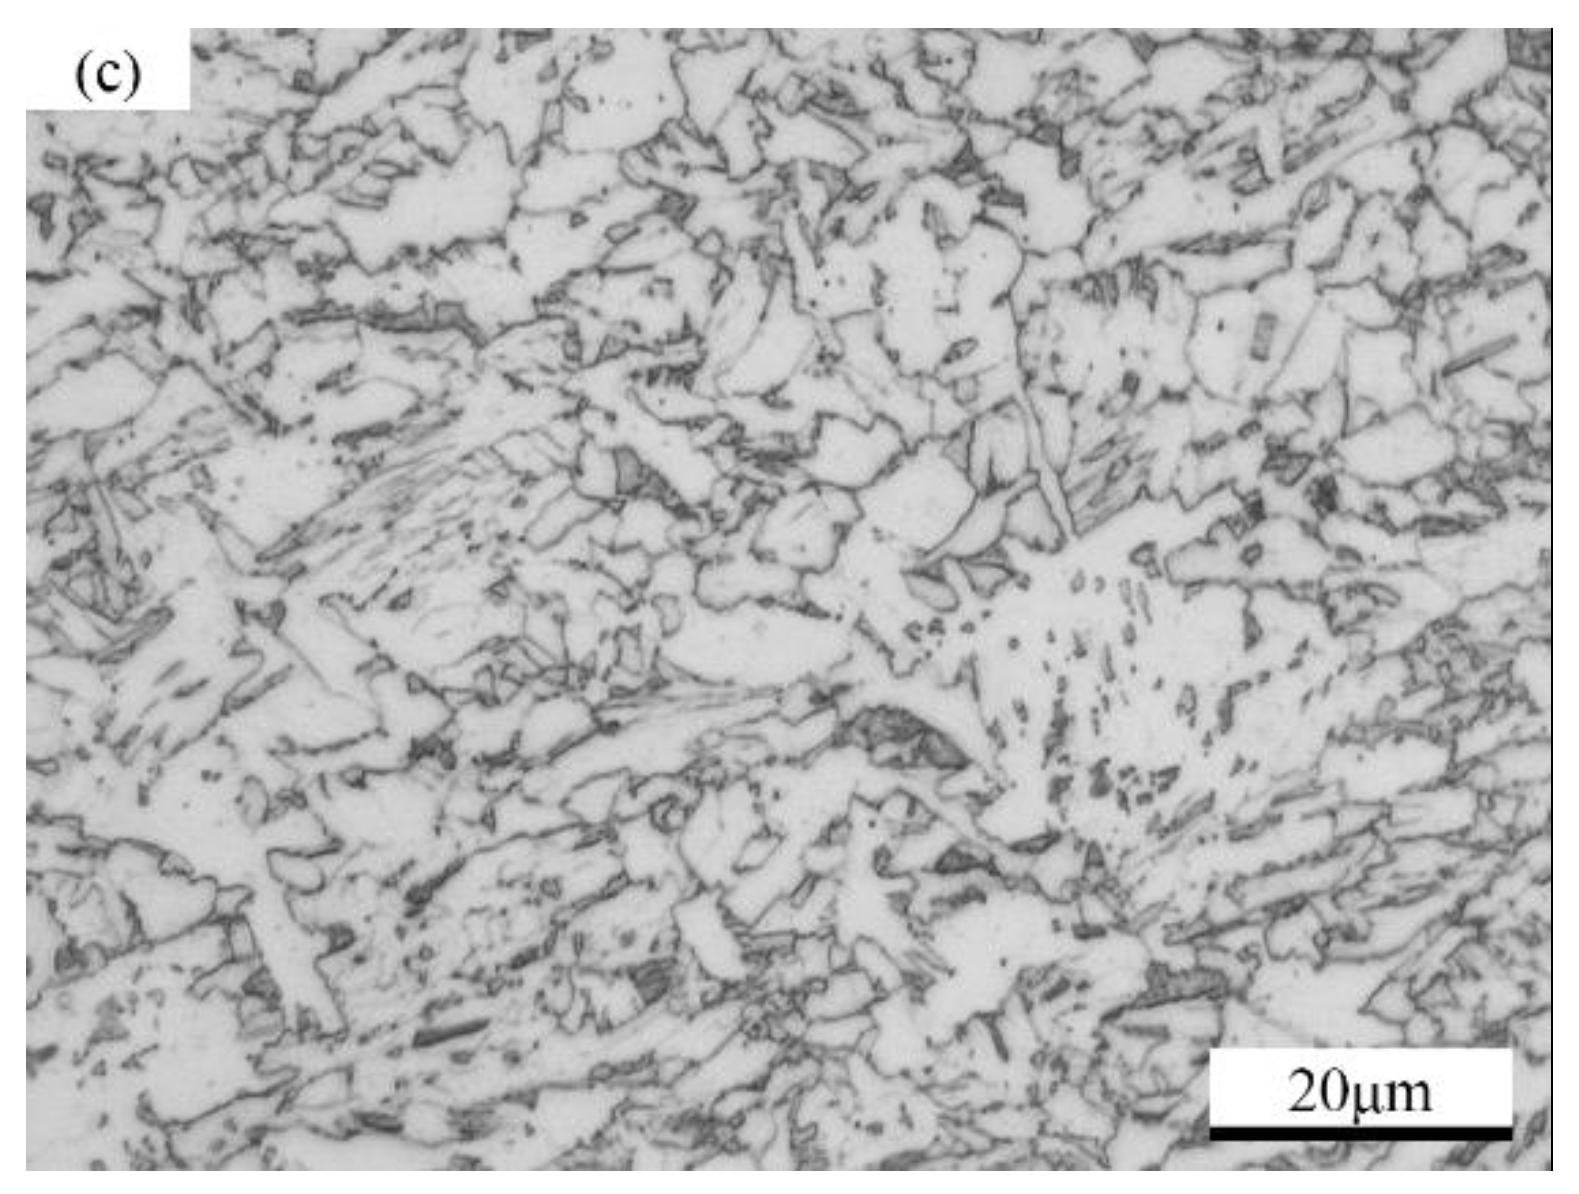
3.1. Corrosion Kinetics

Figure 2a shows the weight gain curves of the three group of steels in the simulated marine environment. The corrosion weight gain of the three group of steels accelerates with the increasing number of dry/wet cycles and the slope of the curve gradually decreases. It indicates that the sample quality increases constantly but the increment decreases gradually. During the whole experiment, the weight gain quality of the WS0.48Si steel was significantly lower. Generally, the corrosion kinetics of steel in the atmospheric environment conforms to the power function [23,24].
Δ W = A N n
where N is the number of dry/wet corrosion cycles; Δ W (g) is the accumulated corrosion weight per unit area of the sample when for the Nth dry/wet cycle; A is the corrosion weight gain of the sample per unit area and per unit time, reflecting the corrosion rate in the first dry/wet alternate corrosion cycle; n is the power and usually a constant. According to Equation (1), the instantaneous corrosion rate of iron and steel, Vi in mg/cm2·d, can be expressed as:
V i = d Δ W / d N = A n N n 1
The logarithm of both sides of Equations (1) and (2) yields:
l g Δ W = l g A + n l g N
l g   d Δ W / d N = l g A + l g n + ( n - 1 ) l g N
Equation (4) shows that when n > 1, the corrosion rate increases with N. When n < 1, the corrosion rate decreases with N increases. When n = 1, the corrosion rate is constant and a smaller n means a slower corrosion rate.
Figure 2b is the linear regression analysis of the weight gain data according to Equation (3). The details of the regression are listed in Table 2. The result shows that the corrosion of the steel in the simulated atmospheres can be decomposed in four parts according to the different slopes fitted. The correlation coefficients were all above 0.99. The slope of all three curves shows a significant turning point after six cycles and decreases with the increase of N. Combined with the fitting equation, we can state that: in the first six cycles, when n > 1, the corrosion rate increases; after six cycles, when n < 1, the corrosion rate decreases. According to the fitting equation in part 2/3/4 after six cycles, n decreases with the corrosion time, indicating that the corrosion rate gradually decreases. By comparing the values of n in the fitting formulas for each part, we found that the values for WS0.48Si are always minimum. The curve for WS0.48Si steel (Figure 2b) has the smallest slope compared to the other two kinds of steel.
Figure 2c is the corrosion rate (Equation (2)) curve. According to the corrosion rate, the whole corrosion process can be divided into three stages according to Figure 2. In the first stage (time < 6), the corrosion rate accelerates. In the second stage (85 > time > 6), the corrosion rate decreases rapidly. In the third stage (120 > time > 85), the corrosion rate decreases slowly and the curve flattens out and the corrosion rate tends to be constant. In addition, the corrosion rate of WS0.48Si steel is the lowest. The variation of corrosion rate in the whole test process may be related to the formation and transformation of the phase in the corrosion process.

3.2. Phase Composition of the Rust Layer

Figure 3 shows the XRD patterns of the corrosion products of three group of steels in the simulated marine environment after an increasing number of dry/wet cycles. The crystalline products formed in the rust layer are α-FeOOH, β-FeOOH, γ-FeOOH, Fe3O4 and amorphous phase. The results showed that the peak strength of the crystal products gradually increased with the corrosion time, which indicated that the number of crystals gradually accumulated with the formation of corrosion products. In the sixth cycle (Figure 3a), the content of γ-FeOOH and β-FeOOH was higher than in the later corrosion cycles. Midway through the corrosion process (Figure 3b), the α-FeOOH content increases relatively to γ-FeOOH and β-FeOOH. In the later stage of the corrosion process (Figure 3c), the peak intensity for α-FeOOH is relatively high, which indicates the α-FeOOH products are accumulated during the corrosion reaction. The peaks for the γ-FeOOH and β-FeOOH phases are weak, which indicates that these products are consumed. When comparing all three steel groups, there was a relatively high content in β-FeOOH and γ-FeOOH in the WS0.12 Si and WS0.34 Si steels. However, WS0.48 Si steel had lower β-FeOOH and γ-FeOOH contents but a higher α-FeOOH content at all stages of the corrosion process (Figure 3).

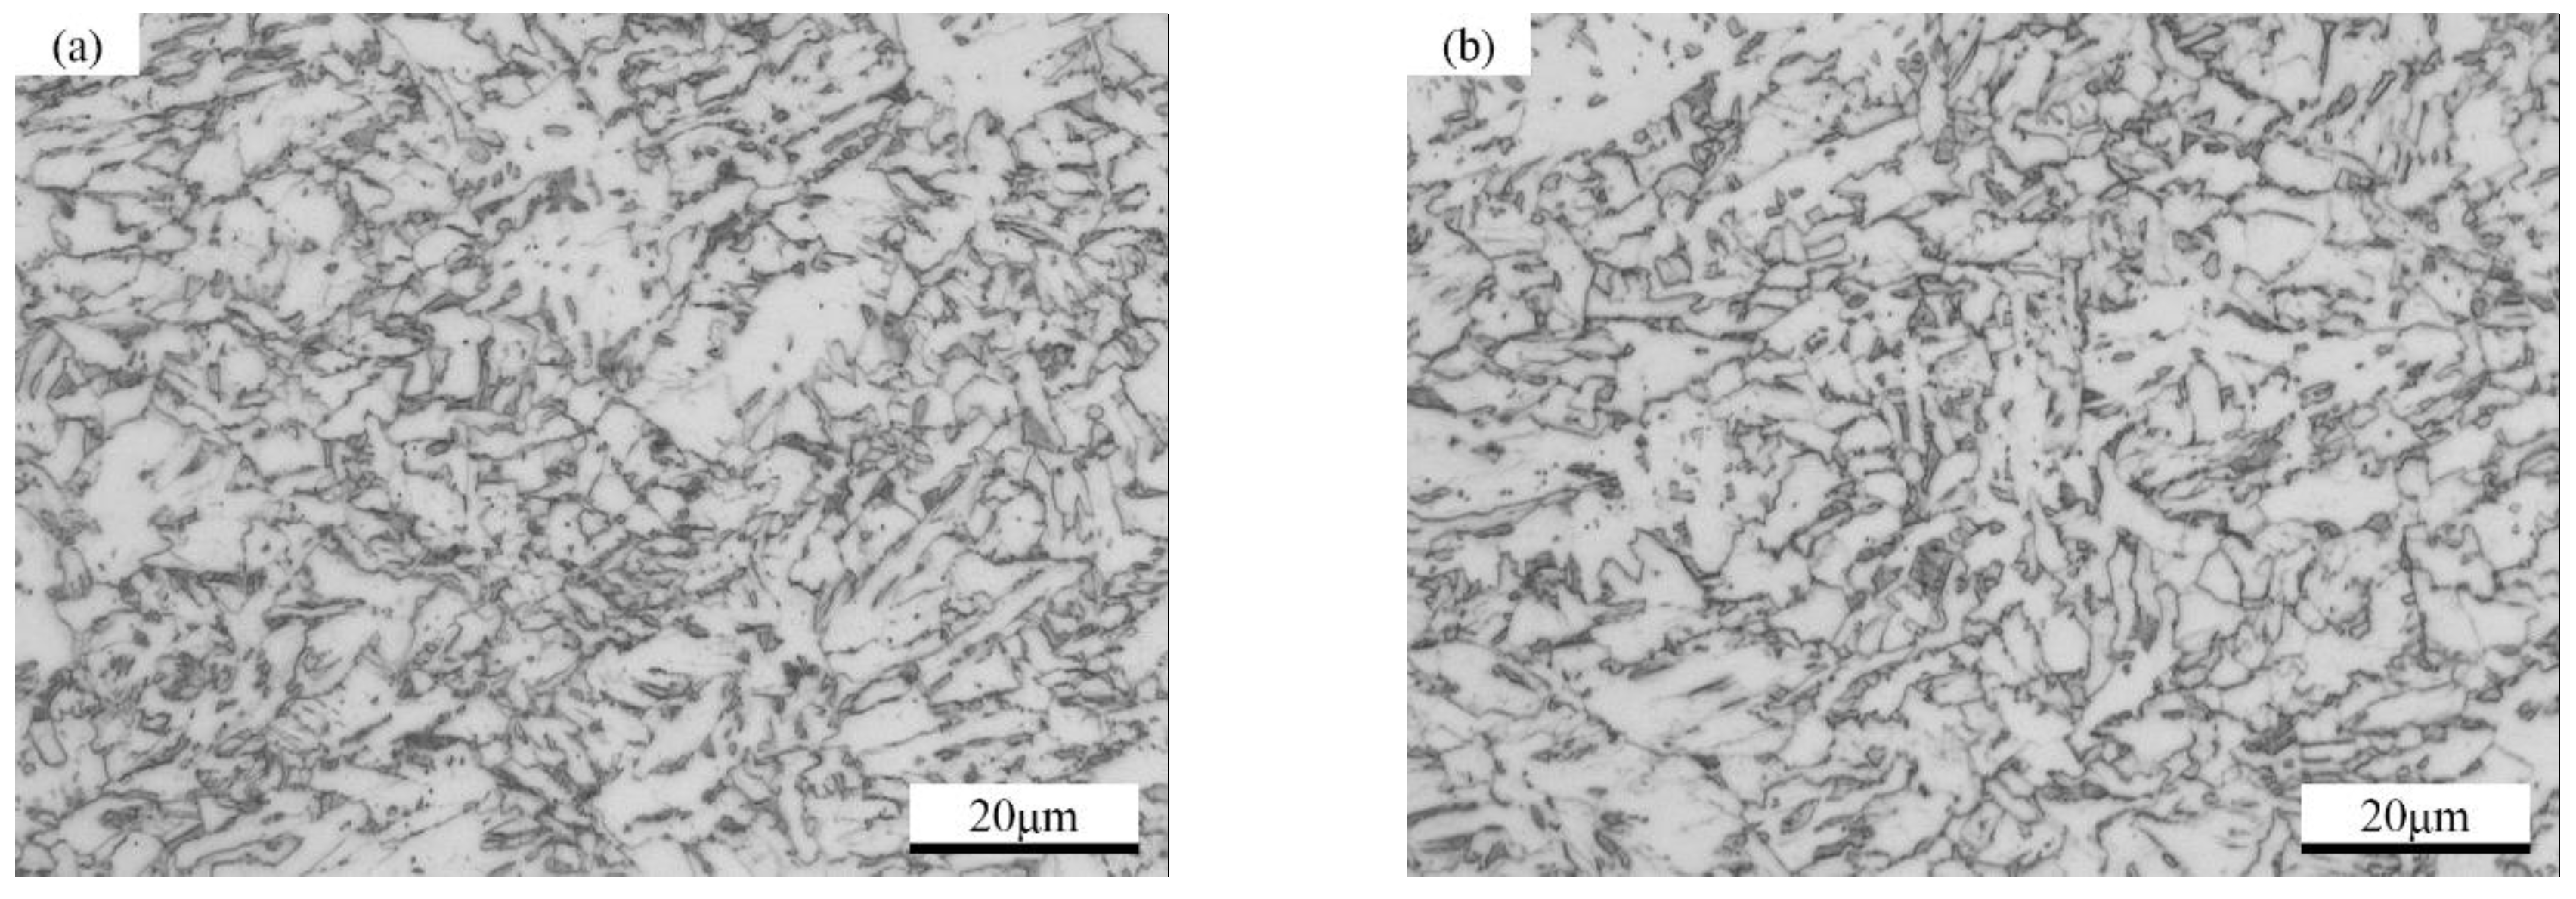
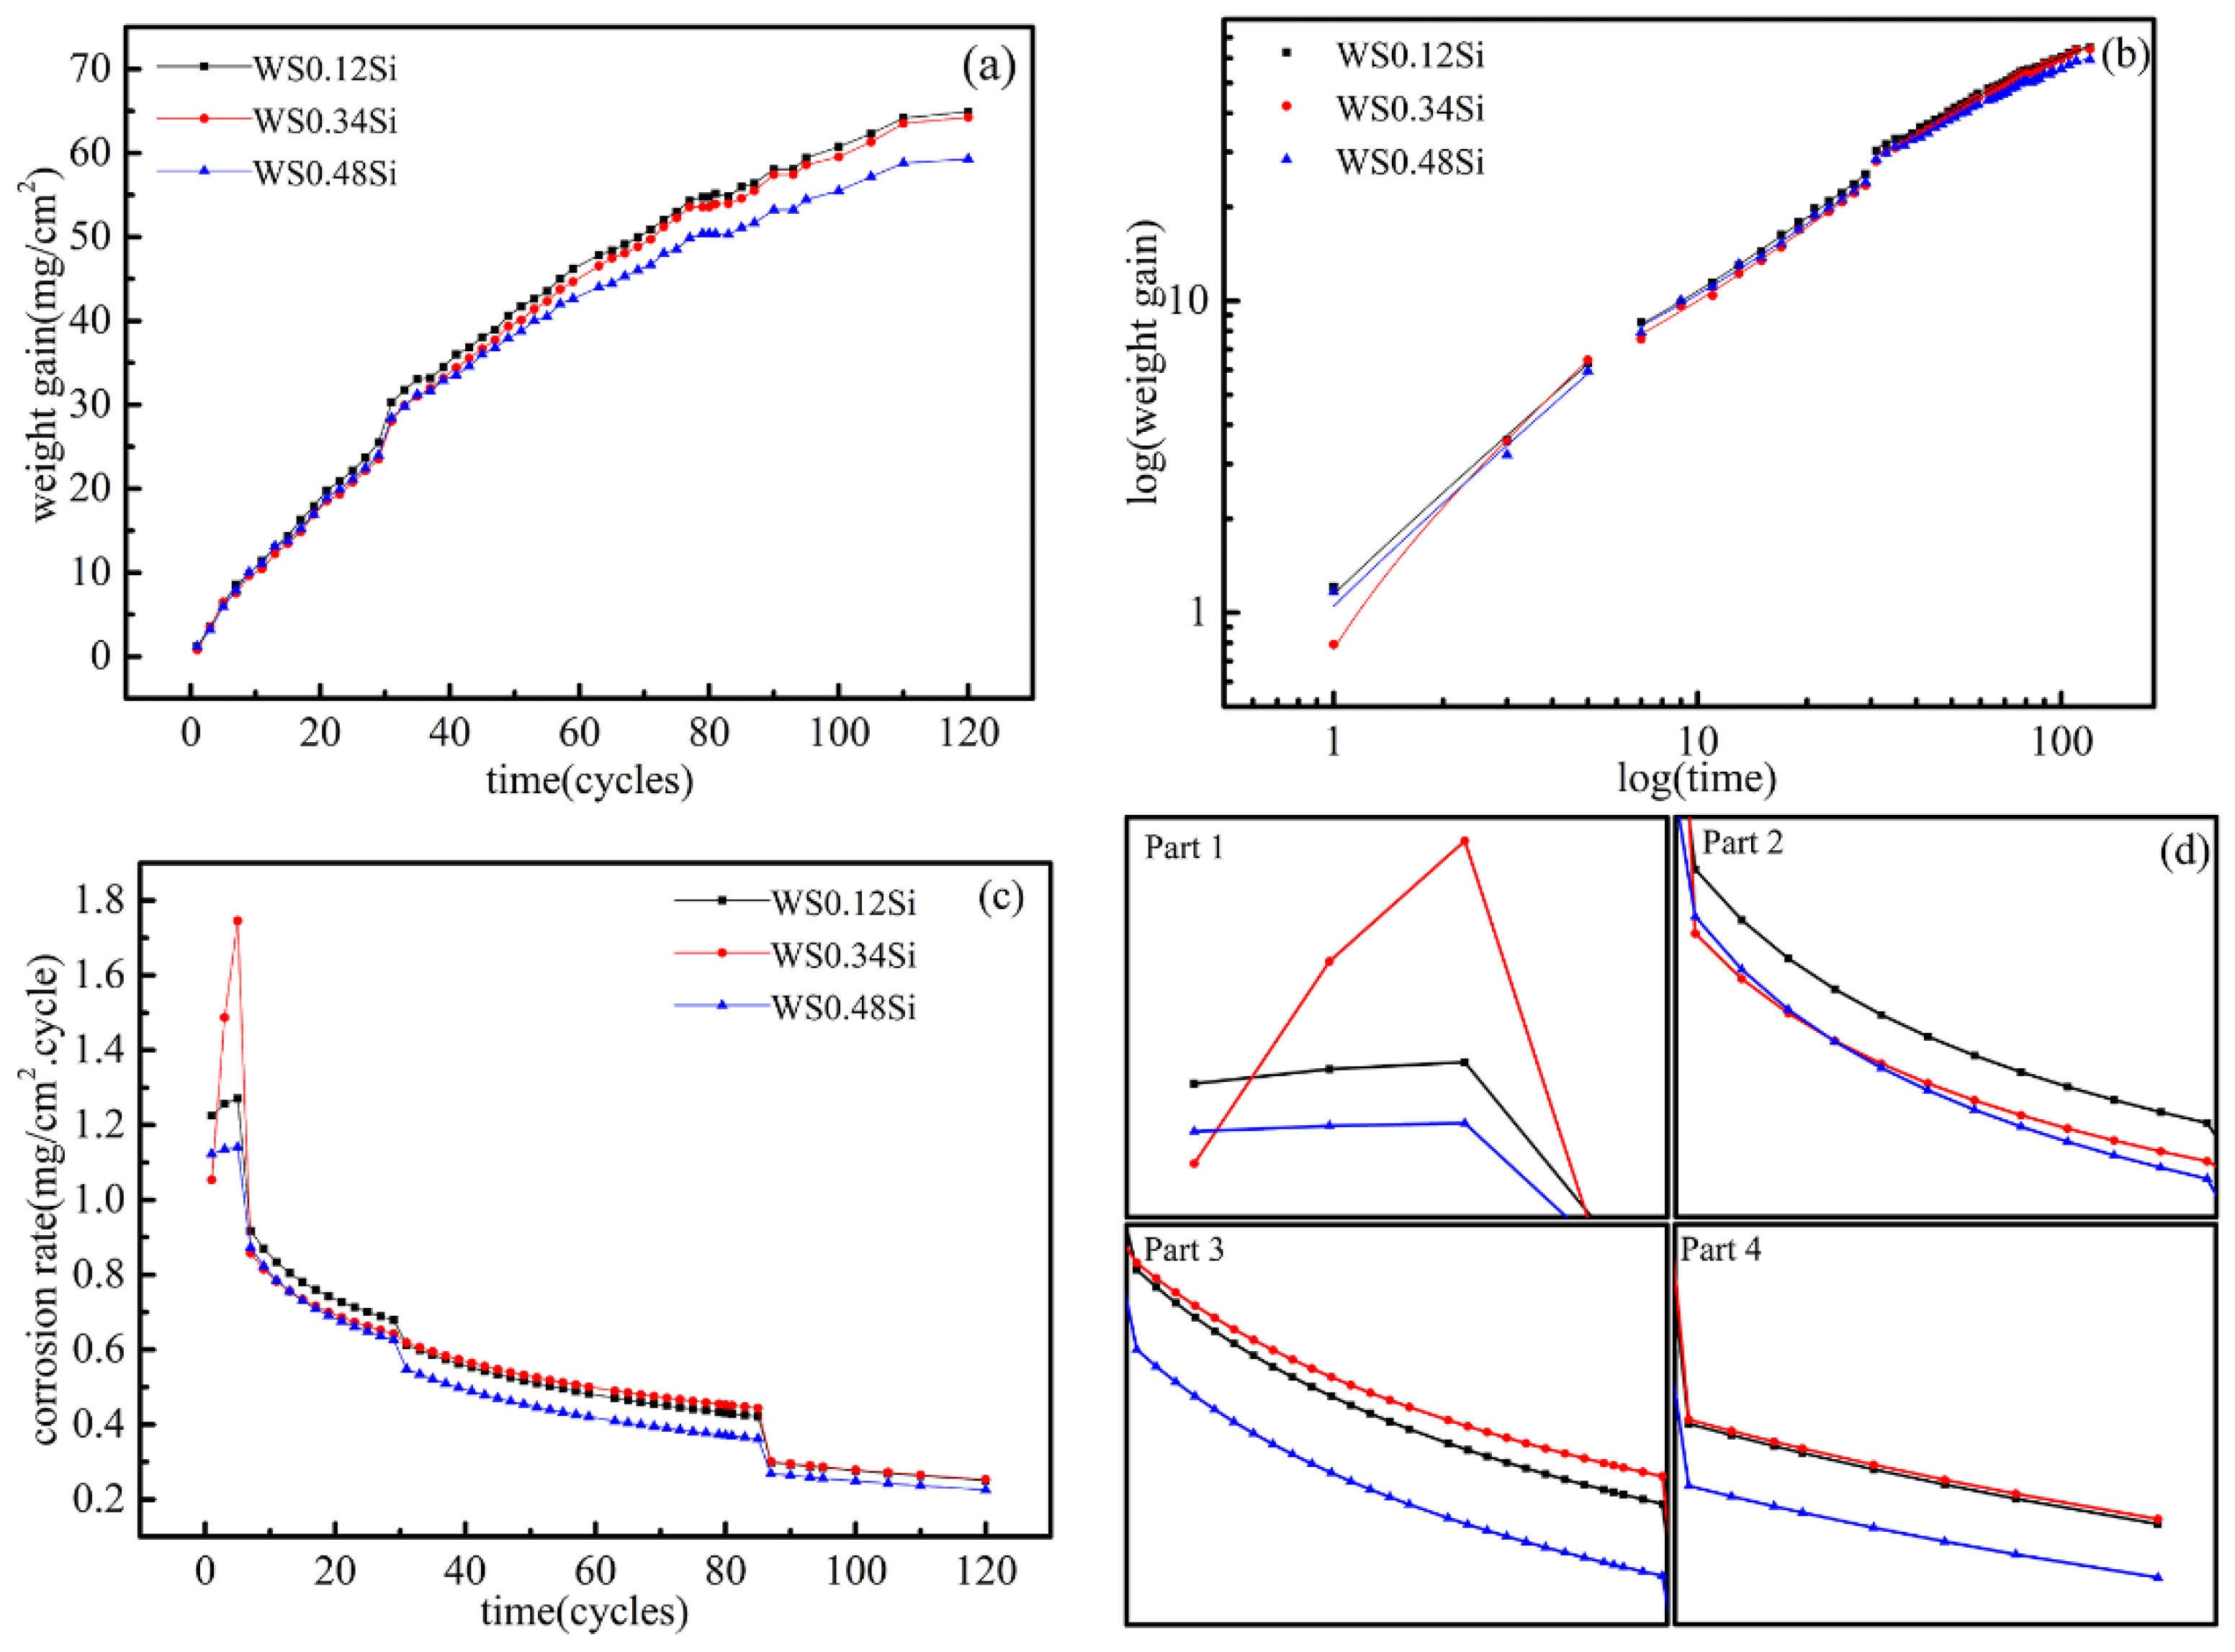
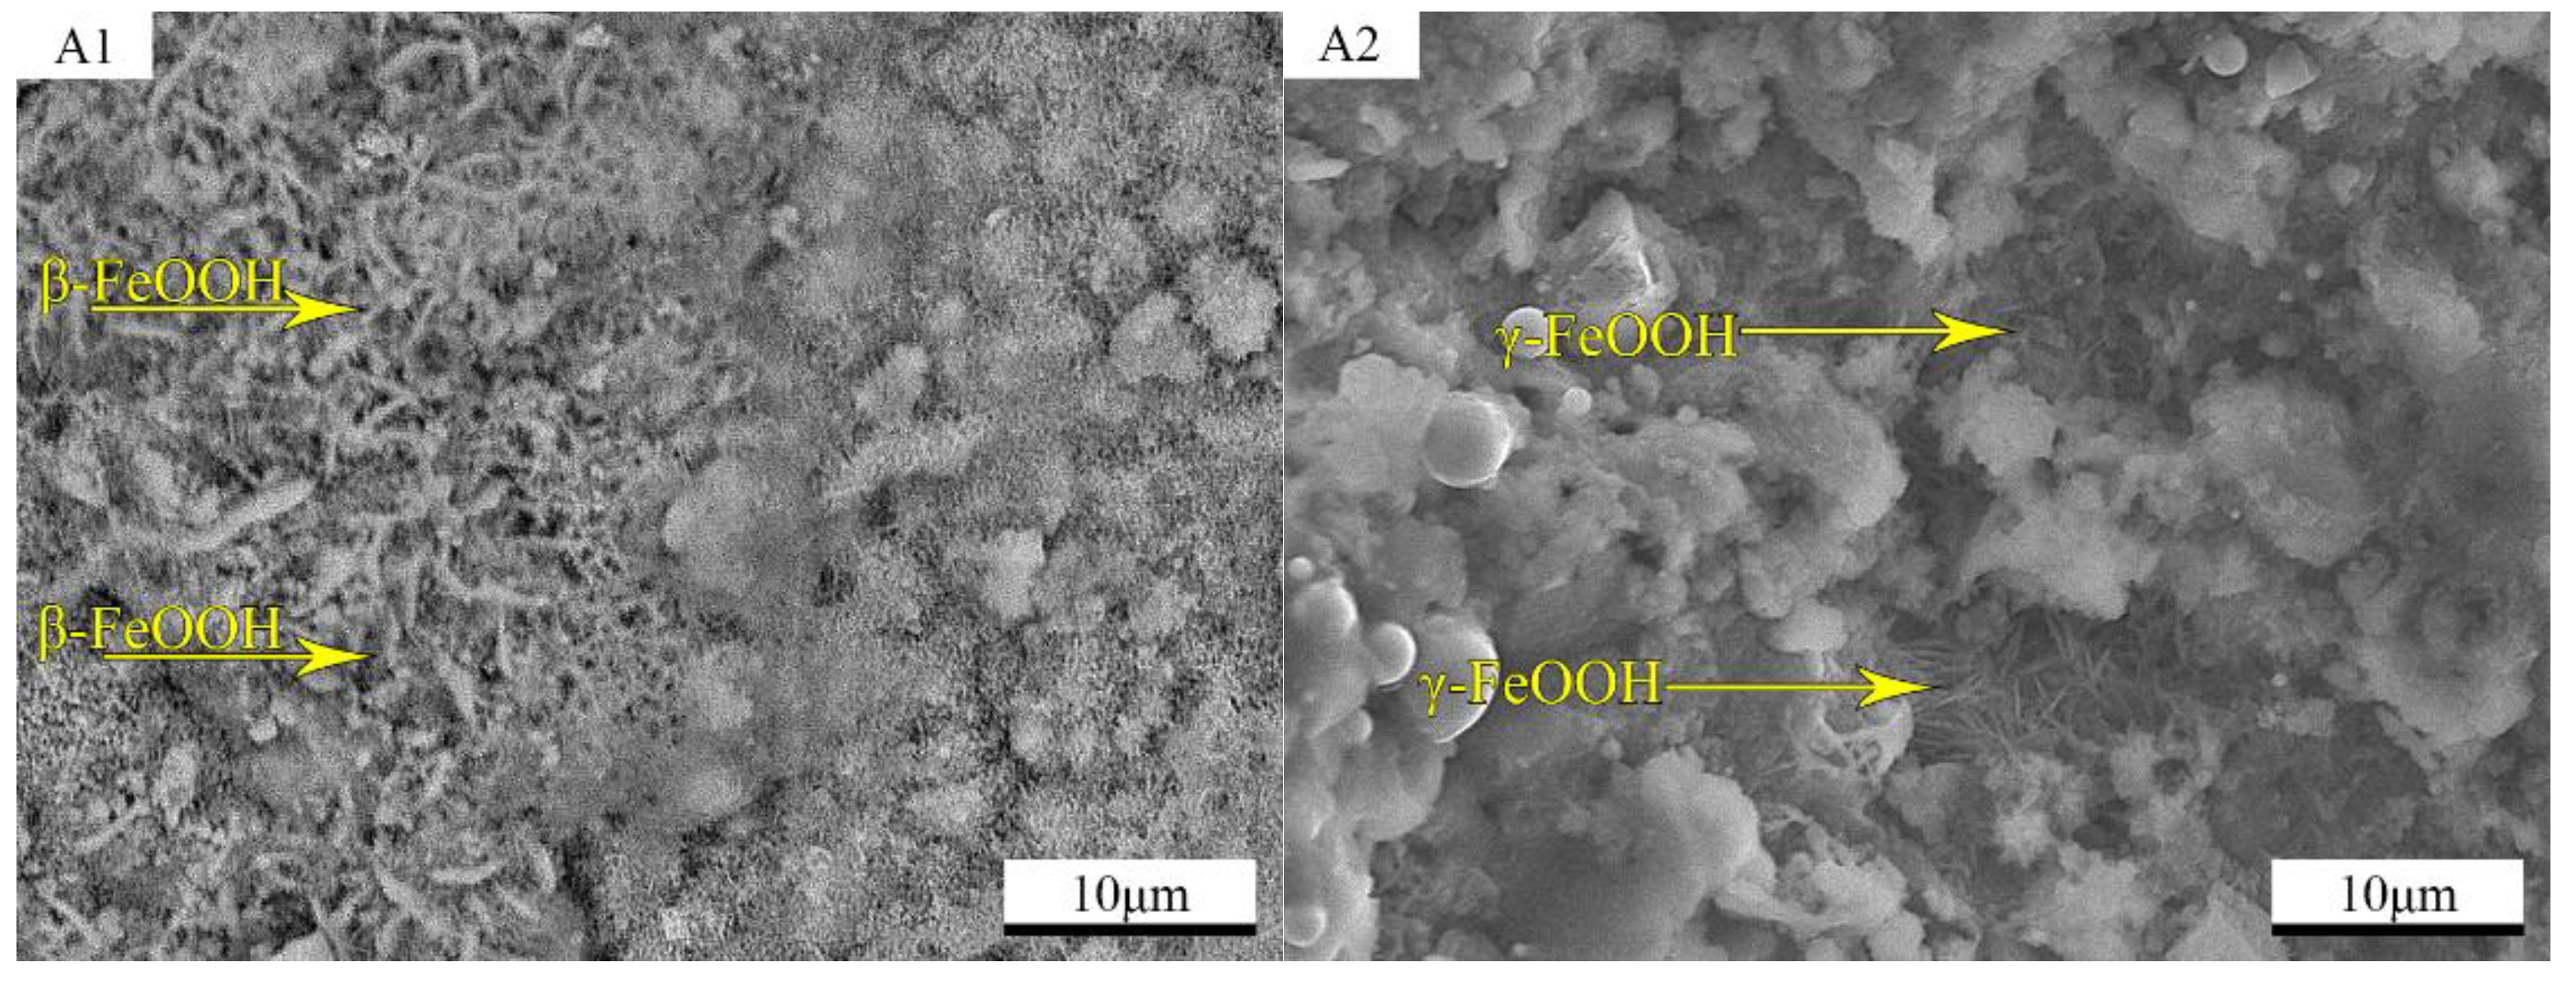
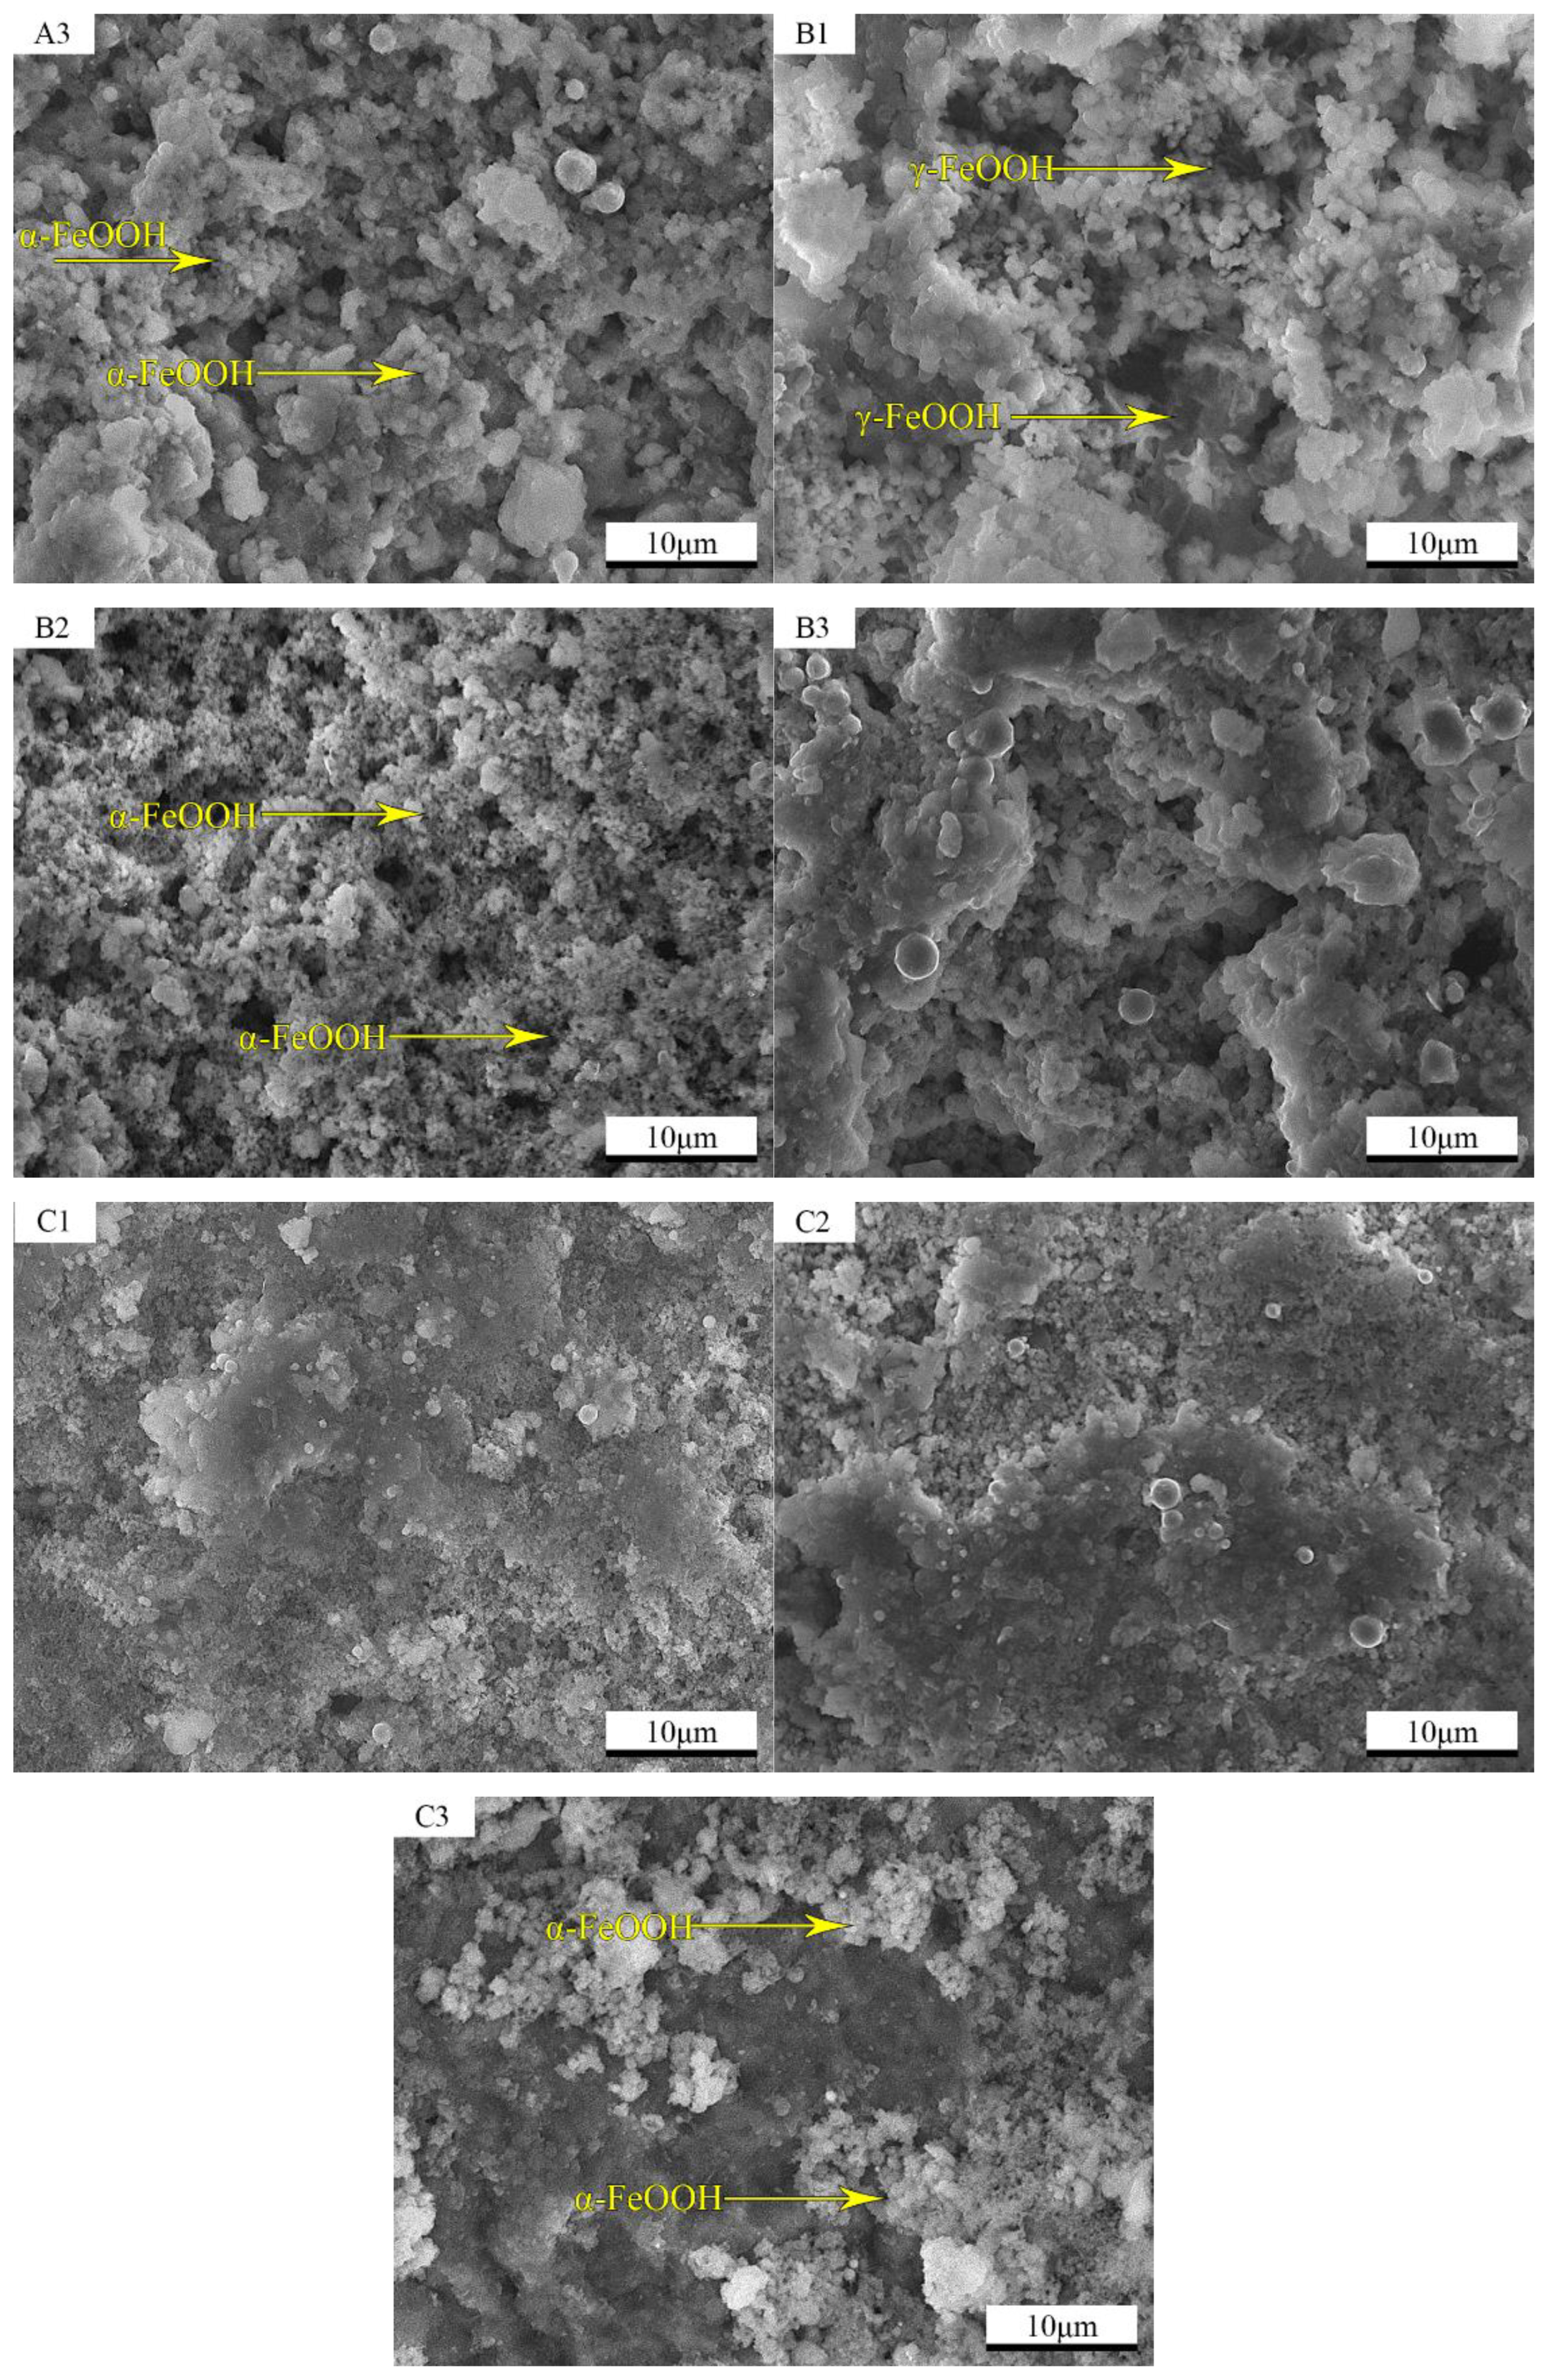
3.3. Microscopic Morphology of the Rust Layer

The corrosion resistance of weathering steel is mainly in connection with the nature of the rust layer. Therefore, the evolution of the rust layer generated on weathering steel can be studied according to the change in the crystal morphology of the rust layer [6,25,26]. Figure 4 shows the corrosion microstructure of the corrosion products of three groups of steel at the 6th, 30th, and 120th cycles, respectively. The main morphological features include whisker α-FeOOH, plate-like β-FeOOH, and flower petals γ-FeOOH [6]. When corrosion proceeds, the rust layer becomes more and more dense, but the corrosion morphology of the different steel types is different. The β-FeOOH phase is clearly present in WS0.12Si (Figure 4A1) after six corrosion cycles, which originates from using an NaCl solution to simulate the environment [27,28]. After 30 corrosion cycles, β-FeOOH in WS0.12Si (Figure 4A2) steel was gradually transformed into a relatively stable α-FeOOH phase and partially into γ-FeOOH. The WS0.34Si steel (Figure 4B1) presents some flower petals of γ-FeOOH after 6 corrosion cycles, but γ-FeOOH is unstable and is gradually converted to more stable α-FeOOH, as seen in Figure 4B2 after 30 corrosion cycles. After 120 cycles, the rust layers of the WS0.12Si (Figure 4A3) steel and the WS0.34Si (Figure 4B3) steel are obviously denser than those in the earlier stages. In WS0.48 Si steel, Over the 120 cycles (Figure 4C1–C3), the rust has grown into a tight and continuous layer. In addition, the rust layer is relatively fine and the WS0.48Si steel shows obviously more compact and flatter than that of the WS0.12Si and WS0.34Si steels.

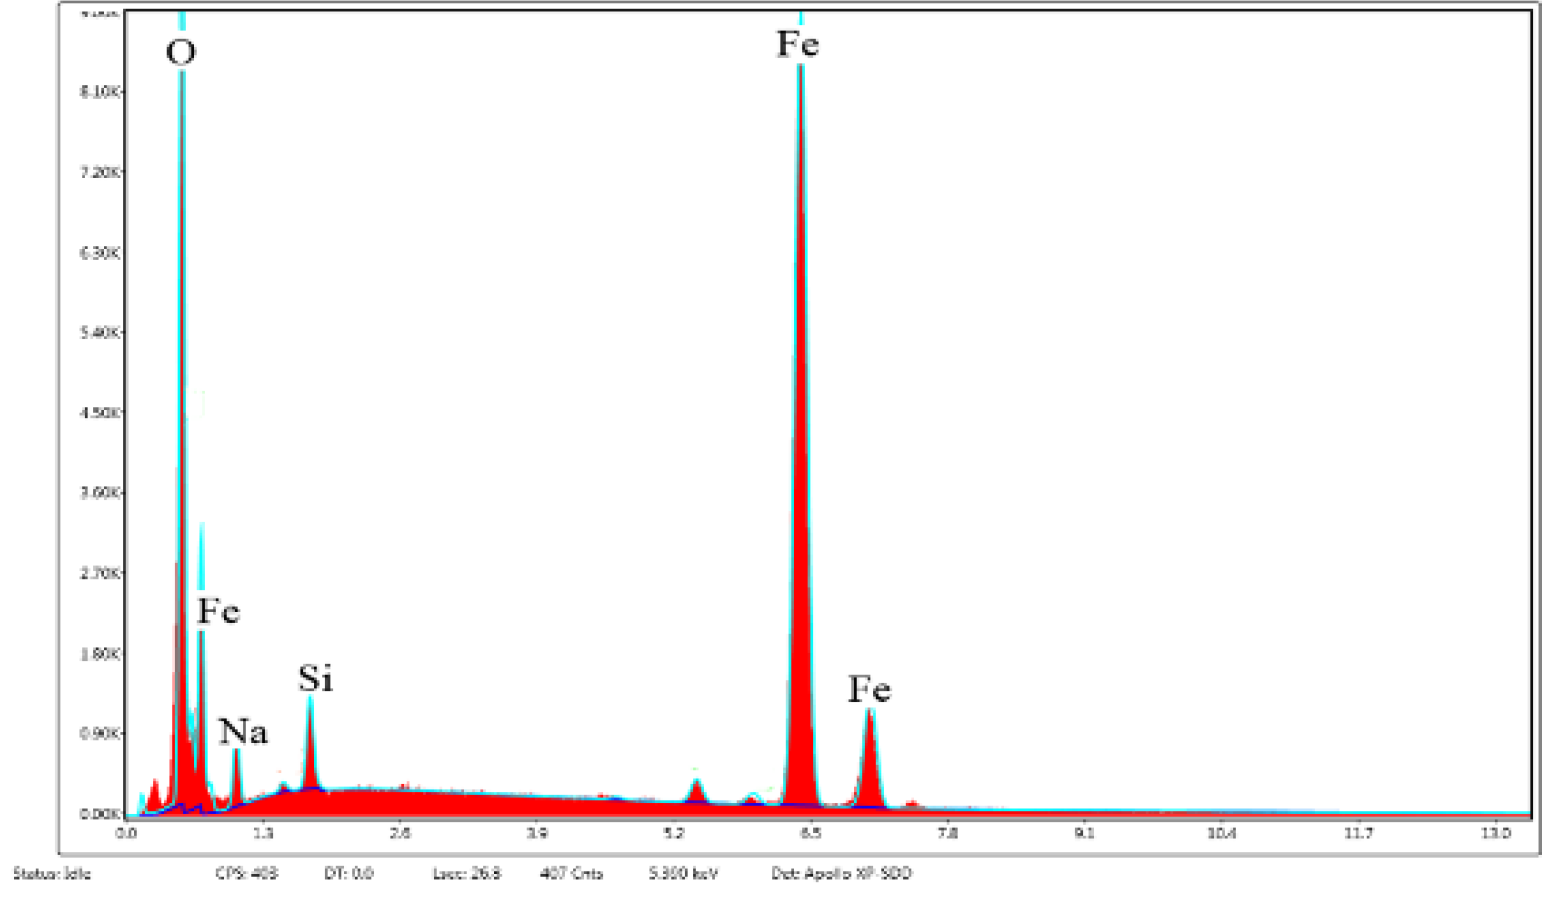
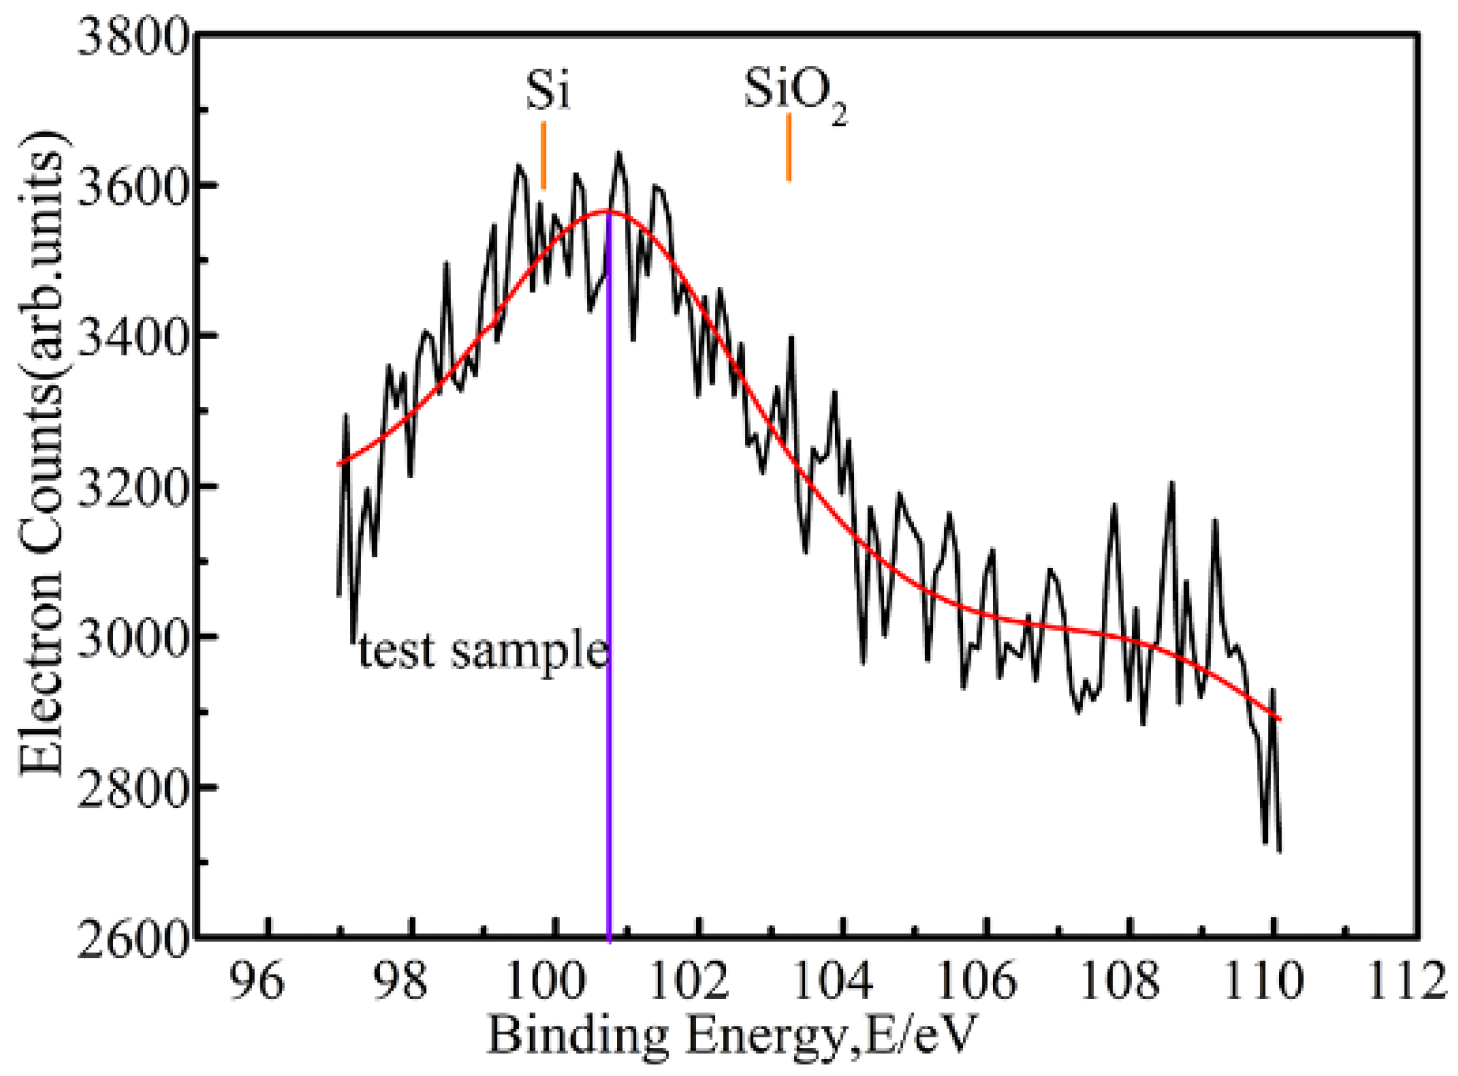
3.4. Elemental Analysis of the Internal Rust Layer

The alloying elements added to the weathering steel will precipitate the corrosion products in the form of oxides, which plays an important role in the growth of the rust layer [12]. T Nishimura et al. showed that Si alloying elements exist as Si2+ in the corrosion products and combine with Al and Fe to form complex oxides [20,29,30]. The powder of the rust layer after 120 cycles close to the WS0.48Si steel matrix was analyzed. According to the rust layer energy spectrum (Figure 5), there is a 0.48% content of Si element in the rust layer in addition to the high content in O and Fe. According to the XPS analysis (Figure 6) of the Si element in the rust layer powder, the peaks detected are between the peak of metallic Si and that for the oxidation state SiO2, indicating that Si exists in the complex oxide rust layer in an intermediate valence state between elemental Si and SiO2, after precipitation.

3.5. Electrochemical Properties

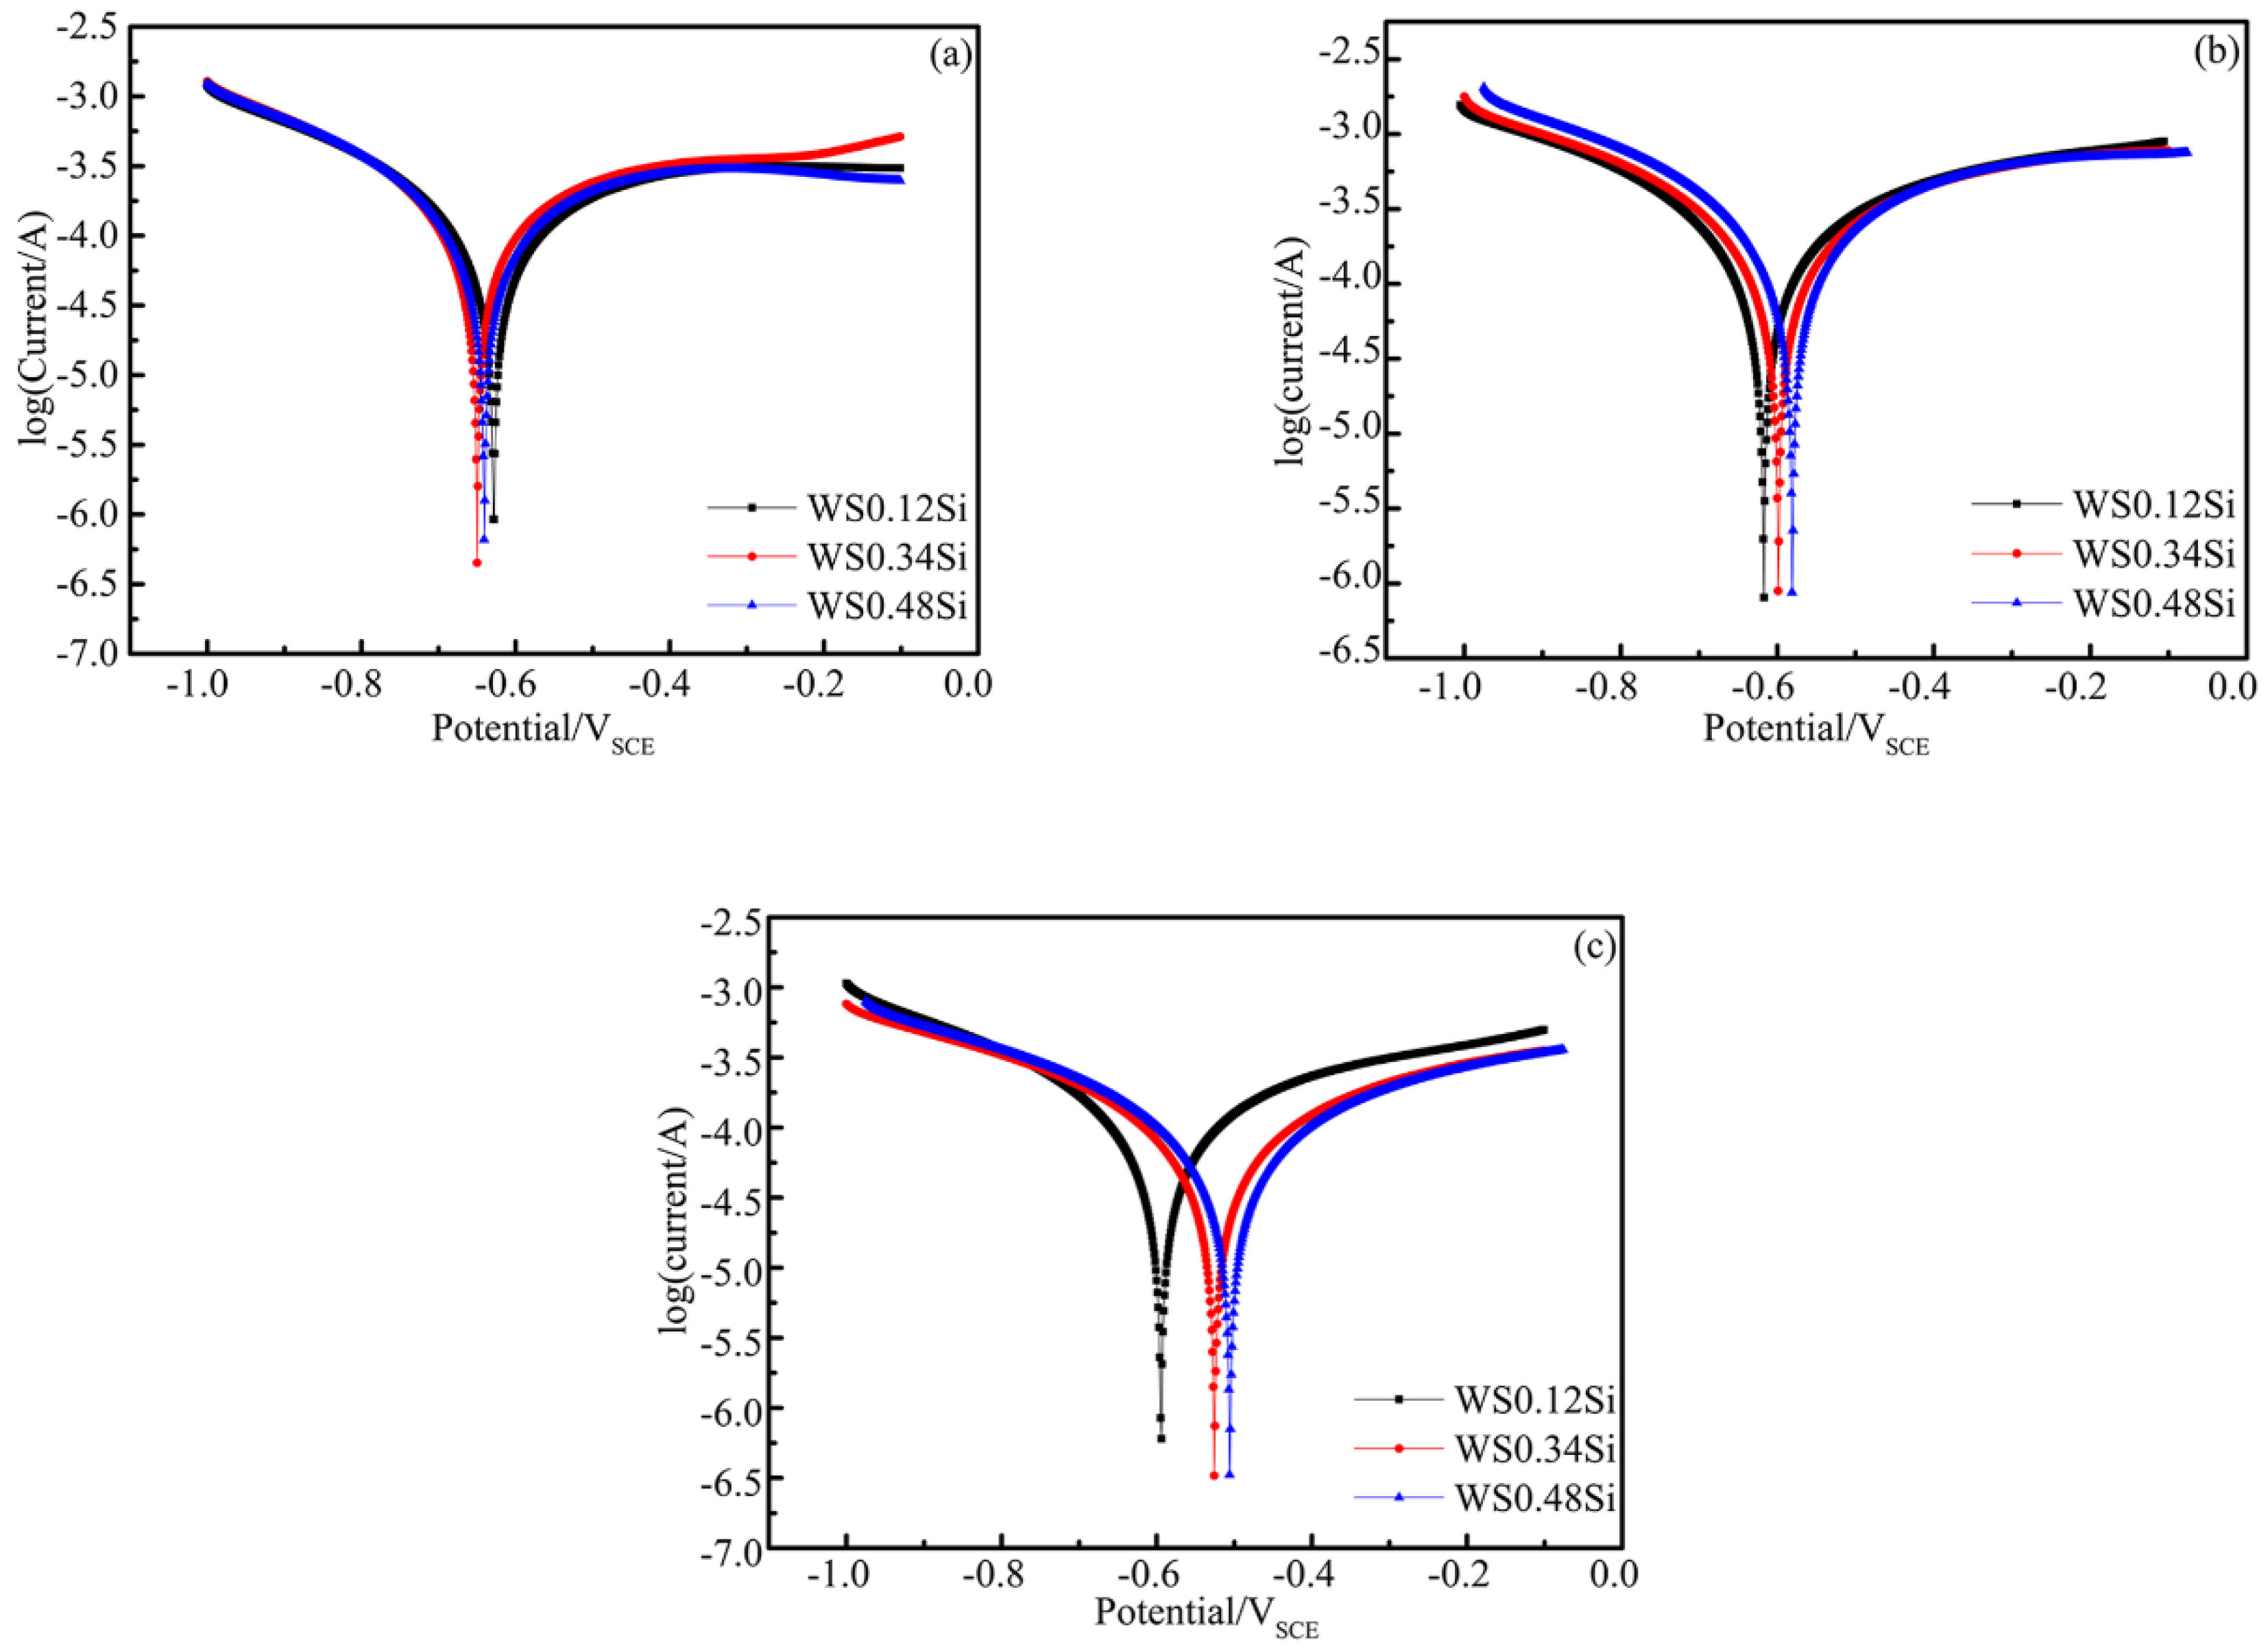
3.5.1. Polarization Curves

Figure 7a–c are the polarization curves after six, 30, and 120 cycles. The shapes of the anodic and cathodic polarization curves of the three groups of steel at different times of the corrosion process are generally consistent. It indicates that a different Si content in the weathering steel will not affect the electrode reaction. In fact, the electrochemical corrosion potential is closely related to the corrosion resistance of the weathering steel and a positive potential indicates a better corrosion resistance [2]. Therefore, the corrosion resistance can be assessed by the corrosion potential in the polarization curve. The potential of the three groups of steel barely changed after six cycles (Figure 7a), which indicates that different Si contents had little influence on the corrosion potential in the early stage of the formation of the corrosion products. After 30 cycles (Figure 7b), the potentials of the three groups of steel were different, and the self-corrosion potential gradually increased with the Si content. After 120 cycles (Figure 7c), the corrosion potential of the WS0.48Si steel was significantly more positive than the other steels, which indicates that the self-corrosion potential increased after the addition of Si. Beyond that, the anodic and cathodic curves of WS0.34Si and WS0.48Si shifted downwards when the Si content increased, which indicates that the anode and cathode reaction rates were relatively lower at this stage.

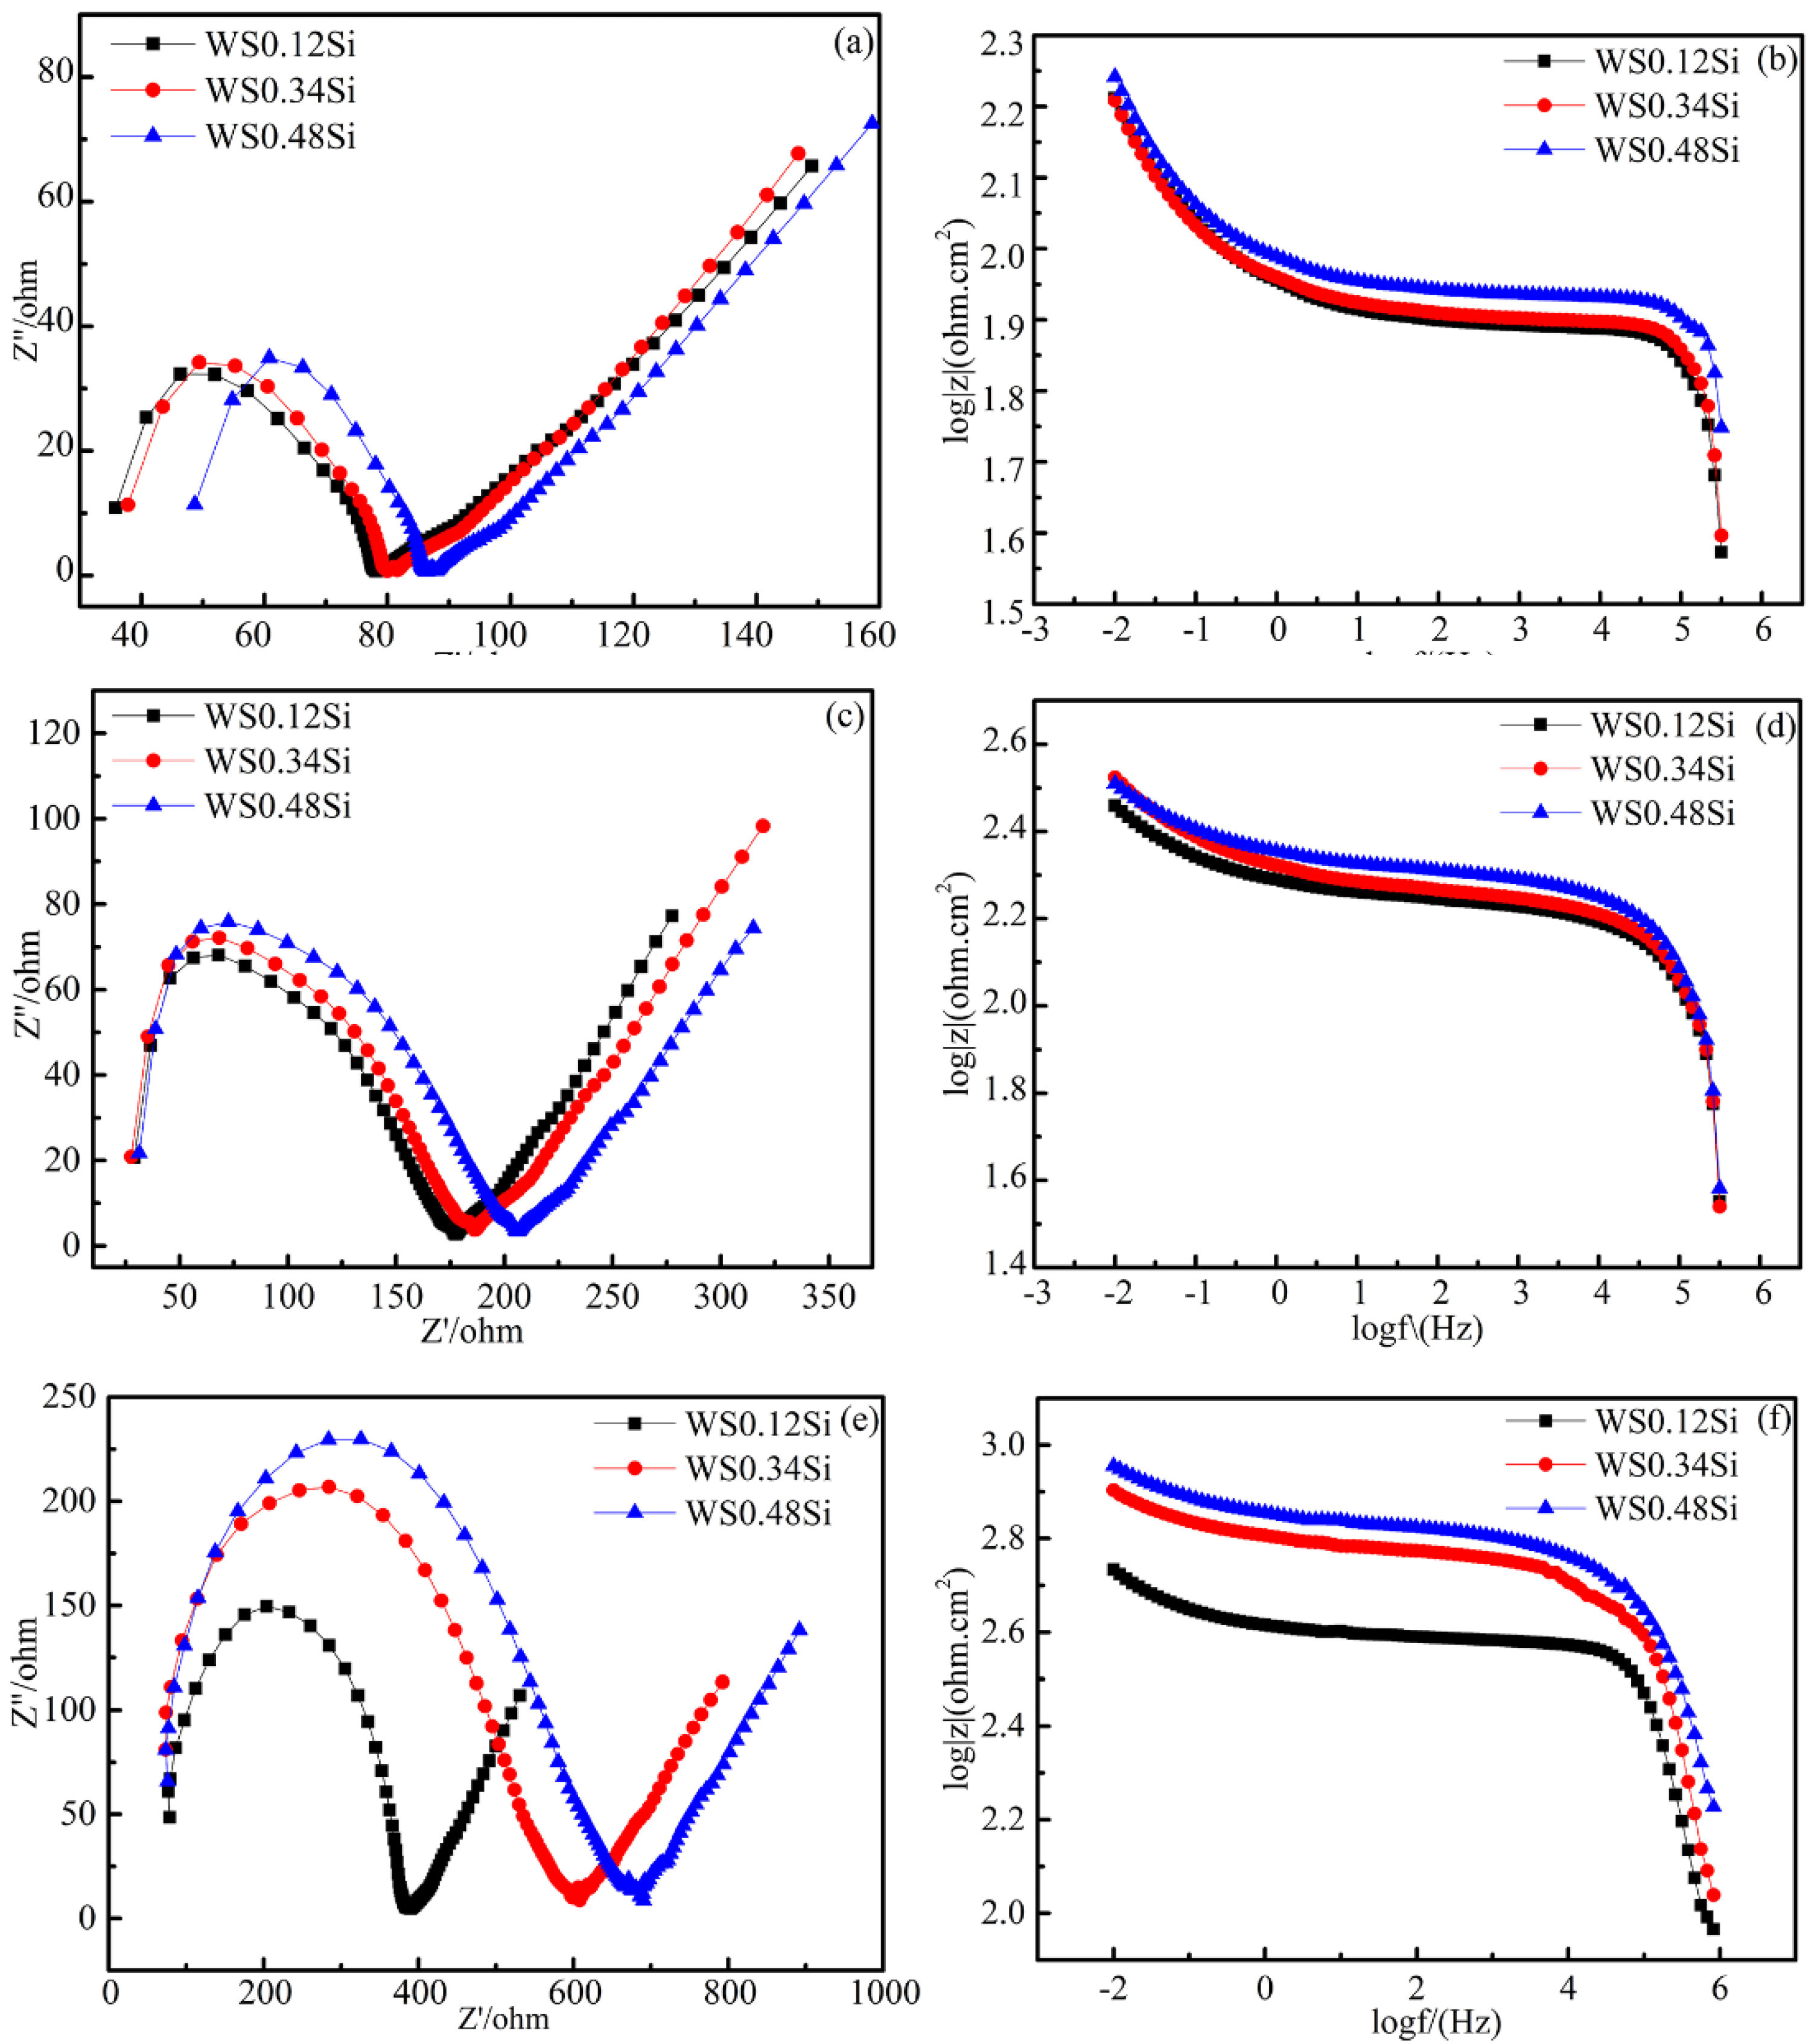
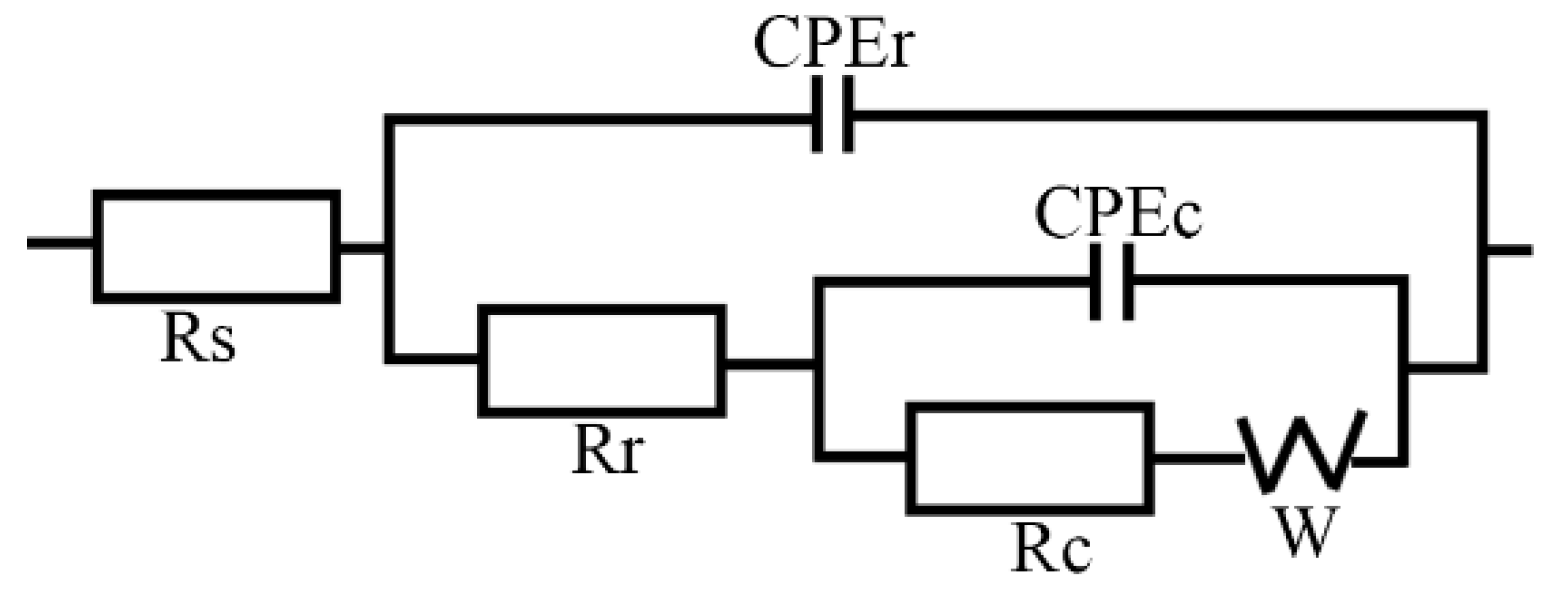
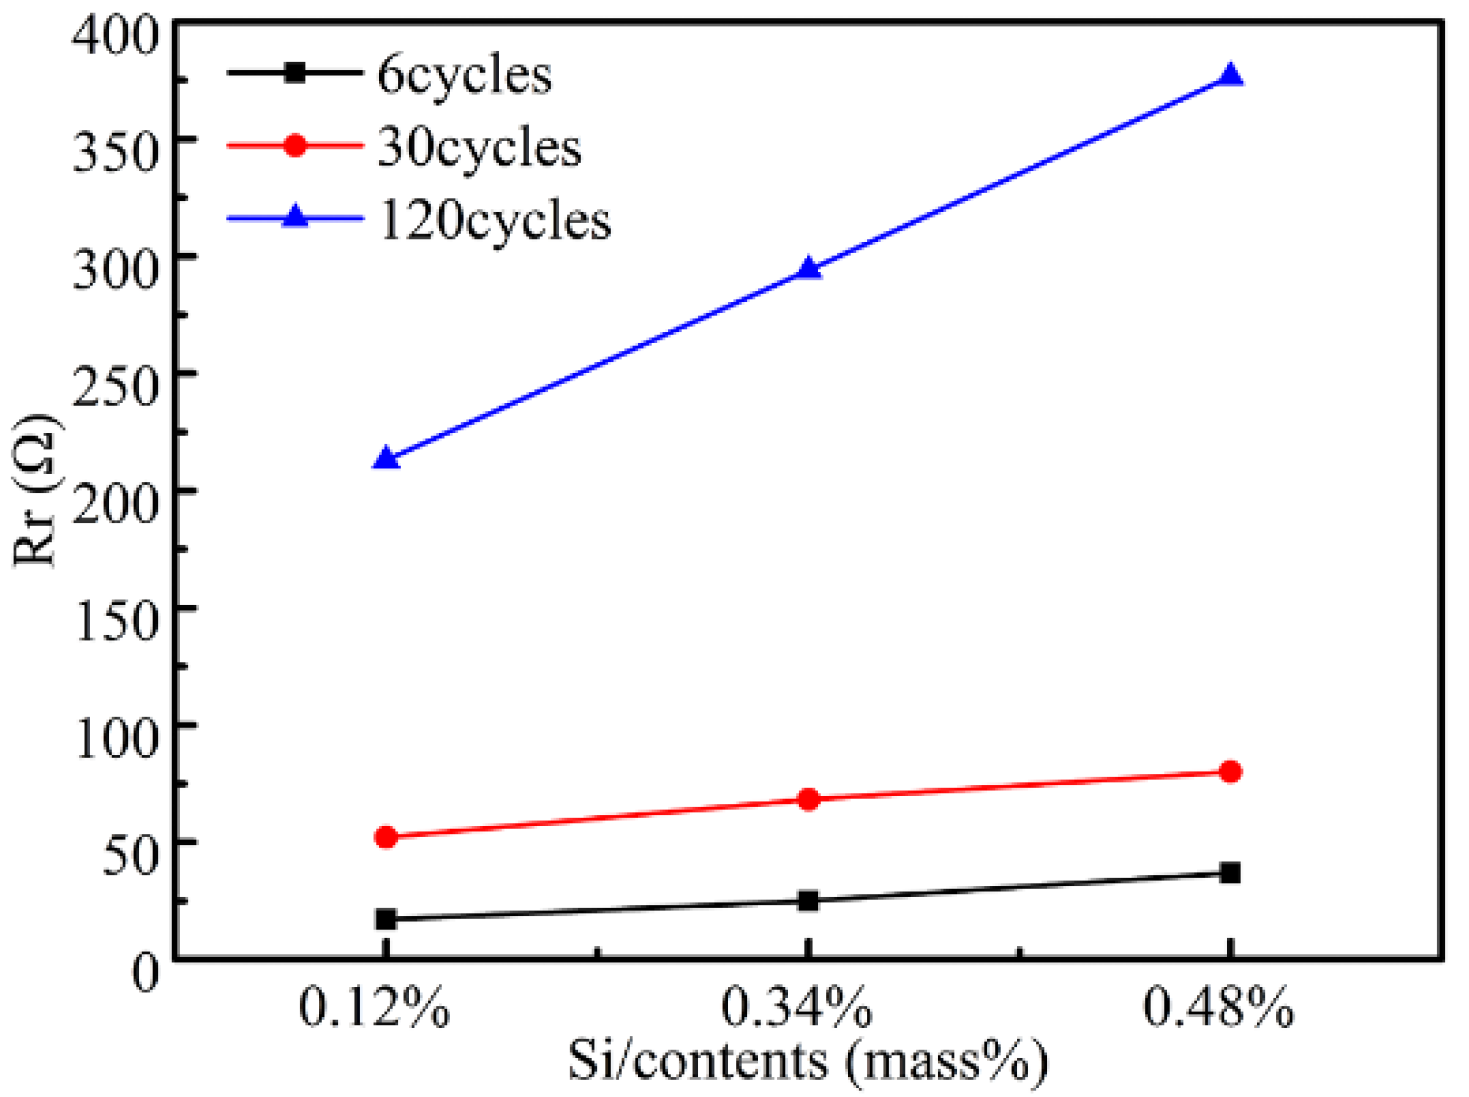
3.5.2. Electrochemical Properties of the Rusted Steel

The Nyquist plots mainly showed semi-circular arc curves in the high frequency region and narrow long curves in the low frequency region. There are two double layers in the electrochemical reaction for the electrolytic solution and for the corrosion sample. At a high frequency, the electric field changes rapidly and the variation in the concentration can be ignored since the electrochemical reaction dominates, in this part, a dielectric layer of the capacitive arc reactance exists between the solution and the rust layer, which reflects the speed of the electrode reaction. At a low frequency, the electric field changes slowly and the reaction time is slow. The influence of the concentration difference on the electrode reaction cannot be ignored. Therefore, in the middle and low frequency regions, the contribution is mainly from the faradaic impedance and the concentration difference impedance. In the low frequency region, a capacitive reactance arc exists between the solution and the matrix, and the Warburg impedance contributes strongly, which indicates that the rust layer produces a resistance to the diffusion process of the corrosion solution to the matrix [31,32]. The Bode diagrams (Figure 8b,d,f) show that the impedance of the three groups of steel all increase with the corrosion time, indicating that the resistance accelerates with the number of dry/wet cycles. After 6 cycles, the radiuses in the Nyquist plot for the three groups of steel are equivalent (Figure 8a). However, the WS0.48Si steel has the highest impedance. After 30 and 120 corrosion cycles, the radiuses of the capacitive reactance arc of the WS0.48Si steel is the largest (Figure 8c,e). Meanwhile, in the Bode diagrams (Figure 8d,f), the WS0.48Si steel has the highest impedance, which further verifies that the addition of a 0.48% content of Si improves the corrosion resistance of weathering steel.
Figure 9 is the impedance circuit used for data interpretation. Rs represent the solution resistance. Rr represent rust layer resistance, which is related to the thickness and the density of the rust layer. CPEr represent the constant phase element, which includes the inside and the outside the rust layer as well as the electrolyte solution capacitance. Rc represents the charge transfer resistance for the anodic and cathodic reactions. CPEc represents the double-layer capacitance of the internal rust layer. W represents the concentration polarization resistance caused by the concentration difference [28,33]. The effect of the Si content on the resistance of the rust layer after 6, 30, and 120 cycles is shown in Figure 10. The resistance of the rust layer in the initial and later stages is proportional to the Si content in the weathering steel. In addition, the resistance of the rust layer in the later stages is significantly higher than that in the earlier stages. These results show that the higher Si contents in weathering steel increase the density of the rust layer. As the corrosion proceeds, the rust layer becomes thicker and its resistance increases significantly. This is related to the composition and compactness of the corrosion products.

4. Discussion

4.1. Corrosion Process and Kinetics

In this investigation, when simulating the marine environment in the NaCl solution, the surface of the iron matrix began to contact the oxygen and water. The reaction that occurs is:
O 2 + 2 Fe + 2 H 2 O 2 Fe ( OH ) + + 2 OH
anode reaction:
Fe Fe 2 + + 2 e
cathode reaction:
O 2 + 2 H 2 O + 4 e 4 OH
When the corrosion product is immersed in the solution, the sample will decompose. Fe ( OH ) + is instability and the subsequent reactions are described by:
4 Fe ( OH ) + + 4 OH + O 2 4 β - FeOOH + 2 H 2 ( Cl )
4 Fe ( OH ) + + 4 OH + O 2 4 γ - FeOOH + 2 H 2
Subsequently, corrosion products begin to accumulate and the corrosion reaction slows down because the oxide film blocks the solution from entering. Due to the instability of γ-FeOOH and β-FeOOH, the phase is transformed into stable α-FeOOH during the reaction and, under certain conditions, partial dehydration occurs and it gradually transforms into Fe3O4, making the rust layer more compact.
γ / β - FeOOH α - FeOOH
Fe 2 + + 8 FeOOH + 2 e 3 Fe 3 O 4 + 4 H 2 O
On the other hand, the corroding iron chloride ions destroy the tightness of the rust layer in a dry environment and the following reaction occurs:
Fe 2 + + 2 Cl FeCl 2
( Fe 2 + , Fe 3 + ) + Cl + OH FeOCl + HCl
FeOCl β - FeOOH
When simulating the drying conditions, tubular β-FeOOH (Equation (8)) crystals are often generated [34]. In rust layers containing more β-FeOOH, the solute particles have smaller barriers to cross making the steel matrix easier to destroy. γ-FeOOH (Equation (9)) has a high redox activity and the cathodic reaction rate is very fast, so when more γ-FeOOH is generated, the corrosion rate will be increased [35]. Therefore, the composition of rust with a higher content of γ-FeOOH and β-FeOOH will accelerate the corrosion rate. This is reflected in the first stage of the corrosion rate diagram (Figure 2c) for a cycle number <6. With time extension, due to the instability of γ-FeOOH and β-FeOOH, they are gradually transformed into a stable α-FeOOH phase throughout the reaction process (Equation (10)) [13]. In the rust layer, α-FeOOH is the most stable material and is therefore not easily transformed after its formation [36]. Low conductivity of the α phase which consequence the small current density is indeed one element that slows down the electron transfer rate [37]. So the cathodic reduction reaction of α-FeOOH is very slow. Therefore, after six cycles, the corrosion rate (Figure 2c) is changed. With the transitions of the unstable γ-FeOOH and β-FeOOH phases, the corrosion rate continues to decrease. So in the Table 1, the value of n > 1 before 6 cycles but after 6 cycles n < 1.The phase formed by the rust layer also includes part of the amorphous phase. As the phase transform, we can see from the SEM (Figure 4) results that the morphology of the rust layer is more and more tightness. In the later stage, the number of crystals gradually accumulated with the formation of corrosion products, the resistance of the matrix to continue to react with the outside solution is increasing, which is also an important reason for the gradual decline of corrosion rate in the later stage. At this stage, the corrosion rate (Figure 2c) and the value of n (Table 1) is in a decreasing state and tends to flatten out.

4.2. Effect of Silicon Alloying Elements on Corrosion Resistance

The three groups of steel have a different rust composition. Among them, the WS0.48Si steel had the highest α-FeOOH content and lower β-FeOOH and γ-FeOOH contents during the entire corrosion process (Figure 3). From the perspective of the microstructure (Figure 4), the WS0.48Si steel shows good compactness at all stages and its surface is obviously more compact and flatter than that of the WS0.12Si and WS0.34Si steels. This shows that a high content of Si alloy promotes the transformation of β-FeOOH and γ-FeOOH to a stable phase. It indicates that the WS0.48 steel entered a stable state in advance, since the rust layers protect the steel offering the best corrosion resistance. That makes in the subsequent corrosion reaction WS0.48Si inhibited the growth of corrosion products compare the WS0.12Si and WS0.34Si steels. So the corrosion rate smaller, and that the corrosion rate of WS0.48Si steel is minimum comparing with other two kinds of steel.
Other studies [38,39] have shown that the oxides generated by Si are fine and that the silicon oxides will enter the crystal gaps in the corrosion products to refine them. The results show that complex silicon oxides in the rust plays an important role in the densification and may influences the electrochemical properties of the corrosion product. Combined with the EDS (Figure 5) and XPS (Figure 6) results, we showed that the Si alloying element in the weathering steel precipitate from the steel matrix and their valence is changed from zero to positive values, which impacts the anodic corrosion reaction. The silicon compounds may play an important role in improving the corrosion potential and enhancing the corrosion resistance of steel. In terms of electrochemical properties, the WS0.48Si steel has the highest impedance. The Si elements promote the rust layer to become more stable and more compact, which makes mass transfer more difficult. Therefore, the concentration impedance is increased. With the accumulation and thickening of the rust layer, the resistance in the electrochemical corrosion process increases. Which means that the electrode reaction is slow due to the high electrode resistance because Si increases the density of the rust layer in the later stages and prevents diffusion and charge transfer. Compared to WS0.12Si and WS0.34Si steel, the rust layer in the WS0.48Si steel has higher resistance, which shows the rust layer further hinders the diffusion of the ion solution and slows down the corrosion reaction. Eventually, this reduces the corrosion damage to weathering steel and prolongs its service life.

5. Conclusions

The following conclusions in this investigation can be drawn from the results on weathering steels with different Si contents in a simulated marine atmosphere:
1. When corrosion proceeds, the corrosion rates of the three groups of steel first increased, then decreased, as seen from certain inflection points, before finally remaining constant. The corrosion rate of the WS0.48Si steel is the lowest compared to WS0.12Si and WS0.34Si steels, indicating that the addition of a 0.48% content of Si will reduce the corrosion rate of weathering steel.
2. The corrosion products consist of α-FeOOH, β-FeOOH, γ-FeOOH, and Fe3O4 for different Si contents in a simulated marine environment. The formation of β-FeOOH and γ-FeOOH in the early stage results from accelerated corrosion and Si alloying promotes the transformation of β-FeOOH and γ-FeOOH into stable phases. In addition, α-FeOOH formation reduces the corrosion rate.
3. Si is precipitated from the steel matrix in the complex oxide rust layer in an intermediate valence state between elemental Si and SiO2. The complex silicon oxide in the rust layer plays an important role in the electrochemical potential and in corrosion resistance.
4. As corrosion proceeds, the resistance of the rust layer significantly increases and the addition of a 0.48% content of Si to the weathering steel makes the rust layer denser and thereby increases its resistance. This helps prevent the electrochemical corrosion reaction and improves the corrosion resistance of the weathering steel.

Author Contributions

C.Z. and R.S. conceived and designed the experiments; Q.Y. and Y.Z. performed the experiments; X.Y. analyzed the data; Y.L. contributed analysis tools; Q.W. directed the testing process; C.Z. and R.S. wrote the paper.

Funding

This research was funded by [the National Key Research and Development Program of China], grant number [2017YFB0304800] and [2017YFB0304802]. The APC was funded by [2017YFB0304800].

Acknowledgments

This work was support by the National Key Research and Development Program of China (Grant No. 2017YFB0304800 and Grant No. 2017YFB0304802 for the second sub project).

Conflicts of Interest

The authors declare no conflict of interest.

References

  1. Natesan, M.; Selvaraj, S.; Manickam, T.; Venkatachari, G. Corrosion behavior of metals and alloys in marine-industrial environment. Sci. Technol. Adv. Mater. 2016, 9. [Google Scholar] [CrossRef] [PubMed]
  2. Wang, J.; Wang, Z.Y.; Ke, W. A study of the evolution of rust on weathering steel submitted to the Qinghai salt lake atmospheric corrosion. Mater. Chem. Phys. 2013, 139, 225–232. [Google Scholar] [CrossRef]
  3. Hara, S.; Kamimura, T.; Miyuki, H.; Yamashita, M. Taxonomy for protective ability of rust layer using its composition formed on weathering steel bridge. Corros. Sci. 2007, 49, 1131–1142. [Google Scholar] [CrossRef]
  4. Tewary, N.K.; Kundu, A.; Nandi, R.; Saha, J.K.; Ghosh, S.K. Microstructural characterisation and corrosion performance of old railway girder bridge steel and modern weathering structural steel. Corros. Sci. 2016, 113, 57–63. [Google Scholar] [CrossRef]
  5. Krivy, V.; Kubzova, M.; Kreislova, K.; Urban, V. Characterization of Corrosion Products on Weathering Steel Bridges Influenced by Chloride Deposition. Metals 2017, 7. [Google Scholar] [CrossRef]
  6. Yang, J.; Lu, Y.; Guo, Z.; Gu, J.; Gu, C. Corrosion behaviour of a quenched and partitioned medium carbon steel in 3.5 wt.% NaCl solution. Corros. Sci. 2018, 130, 64–75. [Google Scholar] [CrossRef]
  7. Díaz, I.; Cano, H.; Lopesino, P.; de la Fuente, D.; Chico, B.; Jiménez, J.A.; Medina, S.F.; Morcillo, M. Five-year atmospheric corrosion of Cu, Cr and Ni weathering steels in a wide range of environments. Corros. Sci. 2018, 141, 146–157. [Google Scholar] [CrossRef]
  8. Tamura, H. The role of rusts in corrosion and corrosion protection of iron and steel. Corros. Sci. 2008, 50, 1872–1883. [Google Scholar] [CrossRef]
  9. Yamashita, M.; Miyuki, H.; Matsuda, Y.; Nagano, H.; Misawa, T. The long term growth of the protective rust layer formed on weathering steel by atmospheric corrosion during a quarter of a century. Corros. Sci. 1994, 36, 283. [Google Scholar] [CrossRef]
  10. Soares, C.G.; Garbatov, Y.; Zayed, A.; Wang, G. Influence of environmental factors on corrosion of ship structures in marine atmosphere. Corros. Sci. 2009, 51, 2014–2026. [Google Scholar] [CrossRef]
  11. Cano, H.; Neff, D.; Morcillo, M.; Dillmann, P.; Diaz, I.; de la Fuente, D. Characterization of corrosion products formed on Ni 2.4 wt%–Cu 0.5 wt%–Cr 0.5 wt% weathering steel exposed in marine atmospheres. Corros. Sci. 2014, 87, 438–451. [Google Scholar] [CrossRef]
  12. Ma, Y.; Li, Y.; Wang, F. Weatherability of 09CuPCrNi steel in a tropical marine environment. Corros. Sci. 2009, 51, 1725–1732. [Google Scholar] [CrossRef]
  13. Zhou, Y.; Chen, J.; Xu, Y.; Liu, Z. Effects of Cr, Ni and Cu on the Corrosion Behavior of Low Carbon Microalloying Steel in a Cl−Containing Environment. J. Mater. Sci. Technol. 2013, 29, 168–174. [Google Scholar] [CrossRef]
  14. Wang, Z.; Liu, J.; Wu, L.; Han, R.; Sun, Y. Study of the corrosion behavior of weathering steels in atmospheric environments. Corros. Sci. 2013, 67, 1–10. [Google Scholar] [CrossRef]
  15. Laird, G.; Powell, G.L.F. Solidification and solid-state transformation mechanisms in Si alloyed high-chromium white cast irons. Metall. Trans. A (Phys. Metall. Mater. Sci.) 1993, 24, 5. [Google Scholar] [CrossRef]
  16. Ruan, L.H.; Wu, K.M.; Qiu, J.A.; Shirzadi, A.A.; Rodionova, I.G. Effect of Silicon Content on Carbide Precipitation and Low-Temperature Toughness of Pressure Vessel Steels. Met. Sci. Heat Treat. 2017, 59, 97–101. [Google Scholar] [CrossRef]
  17. Garrison, W.M. The effect of silicon and nickel additions on the sulfide spacing and fracture toughness of a 0.4 carbon low alloy steel. Metall. Trans. A (Phys. Metall. Mater. Sci.) 1986, 17, 8. [Google Scholar] [CrossRef]
  18. Kim, K.Y.; Hwang, Y.H.; Yoo, J.Y. Effect of Silicon Content on the Corrosion Properties of Calcium-Modified Weathering Steel in a Chloride Environment. Corros. Sci. Sect. 2001, 58, 570. [Google Scholar] [CrossRef]
  19. Nishimura, T. Electrochemical behaviour and structure of rust formed on Si- and Al-bearing steel after atmospheric exposure. Corros. Sci. 2010, 52, 3609–3614. [Google Scholar] [CrossRef]
  20. Nishimura, T. Rust formation and corrosion performance of Si- and Al-bearing ultrafine grained weathering steel. Corros. Sci. 2008, 50, 1306–1312. [Google Scholar] [CrossRef]
  21. Mejía Gómez, J.A.; Antonissen, J.; Palacio, C.A.; De Grave, E. Effects of Si as alloying element on corrosion resistance of weathering steel. Corros. Sci. 2012, 59, 198–203. [Google Scholar] [CrossRef]
  22. Zhang, Q. Eflect of Si on Corrosion Resistance of Cabon Steel in Atmospheric Conditions. Available online: http://new.oversea.cnki.net/kns/brief/default_result.aspx (accessed on 25 April 2019).
  23. Chen, W.; Hao, L.; Dong, J.; Ke, W. Effect of sulphur dioxide on the corrosion of a low alloy steel in simulated coastal industrial atmosphere. Corros. Sci. 2014, 83, 155–163. [Google Scholar] [CrossRef]
  24. Hao, L.; Zhang, S.; Dong, J.; Ke, W. Evolution of atmospheric corrosion of MnCuP weathering steel in a simulated coastal-industrial atmosphere. Corros. Sci. 2012, 59, 270–276. [Google Scholar] [CrossRef]
  25. Castaño, J.G.; Botero, C.A.; Restrepo, A.H.; Agudelo, E.A.; Correa, E.; Echeverría, F. Atmospheric corrosion of carbon steel in Colombia. Corros. Sci. 2010, 52, 216–223. [Google Scholar] [CrossRef]
  26. Su, G.; Gao, X. Comparison of Medium Manganese Steel and Q345 Steel on Corrosion Behavior in a 3.5 wt % NaCl Solution. Materials 2017, 10. [Google Scholar] [CrossRef]
  27. Ma, Y.; Li, Y.; Wang, F. Corrosion of low carbon steel in atmospheric environments of different chloride content. Corros. Sci. 2009, 51, 997–1006. [Google Scholar] [CrossRef]
  28. Lu, Y.; Dong, J.; Ke, W. Effects of Cl− Ions on the Corrosion Behaviour of Low Alloy Steel in Deaerated Bicarbonate Solutions. J. Mater. Sci. Technol. 2016, 32, 341–348. [Google Scholar] [CrossRef]
  29. Nishimura, T. Crevice Corrosion Resistance and Structure of Passive Film on Fe-Mn-Si-Cr-Ni Steel. ISIJ Int. 2016, 56, 654–660. [Google Scholar] [CrossRef]
  30. Nishimura, T. Corrosion Behavior of Silicon-Bearing Steel in a Wet/Dry Environment Containing Chloride Ions. Mater. Trans. 2007, 48, 1438–1443. [Google Scholar] [CrossRef]
  31. Guo, J.; Yang, S.; Shang, C.; Wang, Y.; He, X. Influence of carbon content and microstructure on corrosion behaviour of low alloy steels in a Cl− containing environment. Corros. Sci. 2009, 51, 242–251. [Google Scholar] [CrossRef]
  32. Wang, J.; Wang, Z.Y.; Ke, W. Corrosion behaviour of weathering steel in diluted Qinghai salt lake water in a laboratory accelerated test that involved cyclic wet/dry conditions. Mater. Chem. Phys. 2010, 124, 952–958. [Google Scholar] [CrossRef]
  33. Xu, S.; Ikpt, M.E.; Dong, J.; Wei, J.; Ke, W.; Chen, N. Effects of Cadmium alloying on the Corrosion and Mechanical Properties of Magnesium. Int. J. Electrochem. Sci. 2012, 7, 4735–4755. [Google Scholar]
  34. Nishimura, T.; Katayama, H.; Noda, K.; Kodama, T. Effect of Co and Ni on the corrosion behavior of low alloy steels in wet/dry environments. Corros. Sci. 2000, 42, 1611–1621. [Google Scholar] [CrossRef]
  35. Kamimura, T.; Hara, S.; Miyuki, H.; Yamashita, M.; Uchida, H. Composition and protective ability of rust layer formed on weathering steel exposed to various environments. Corros. Sci. 2006, 48, 2799–2812. [Google Scholar] [CrossRef]
  36. Zou, Y.; Wang, J.; Zheng, Y.Y. Electrochemical techniques for determining corrosion rate of rusted steel in seawater. Corros. Sci. 2011, 53, 208–216. [Google Scholar] [CrossRef]
  37. Asami, K.; Kikuchi, M. In-depth distribution of rusts on a plain carbon steel and weathering steels exposed to coastal–industrial atmosphere for 17 years. Corros. Sci. 2003, 45, 2671–2688. [Google Scholar] [CrossRef]
  38. Murayama, M.; Nishimura, T.; Tsuzaki, K. Nano-scale chemical analysis of rust on a 2% Si-bearing low alloy steel exposed in a coastal environment. Corros. Sci. 2008, 50, 2159–2165. [Google Scholar] [CrossRef]
  39. Sei, J.; Oha, D.C.; Townsend, H. Atmospheric corrosion of different steels in marine, rural and industrial environments. Corros. Sci. 1999, 41, 1687–1702. [Google Scholar]
Figure 1. Optical micrographs of the three experimental steel groups: (a) refers to WS0.12Si steel; (b) refers to WS0.34Si steel; (c) refers to WS0.48Si steel.
Metals 09 00486 g001aMetals 09 00486 g001b
Figure 2. Corrosion kinetics evolution of three experimental steel groups in simulated marine environment: (a) Weight gain curve; (b) fitting curve; (c) corrosion rate curve; (d) the magnification of the corrosion rate curve in four parts(1–6, 7–29, 30–85, 86–120 cycles), separately.
Metals 09 00486 g002
Figure 3. X-ray diffraction patterns of three experimental steel groups at (a) 6th cycle, (b) 30th cycle, and (c) 120th cycle.
Metals 09 00486 g003
Figure 4. SEM micrographs of the rust layer for the three experimental steel groups. (A1A3) refers to WS0.12Si steel at the 6th cycle; (B1B3) refers to WS0.34Si steel at the 30th cycle; (C1C3) refers to WS0.48Si steel at the 120th cycle.
Metals 09 00486 g004aMetals 09 00486 g004b
Figure 5. Elemental analysis of the inner rust layer from the powder energy spectrum of the WS0.48Si steel at 120th cycle.
Metals 09 00486 g005
Figure 6. X-ray photoelectron spectroscopy analysis of Si in the inner rust layer of the powder at 120th cycle of the WS0.48Si steel.
Metals 09 00486 g006
Figure 7. Polarization curves of three experimental steel groups at (a) 6th cycle, (b) 30th cycle, and(c) 120th cycle.
Metals 09 00486 g007
Figure 8. Nyquist plots and Bode diagrams of three experimental steel groups at (a,b) 6th cycle, (c,d) 30th cycle, and (e,f) 120th cycle.
Metals 09 00486 g008
Figure 9. Equivalent impedance circuit for EIS data of three experimental steel groups.
Metals 09 00486 g009
Figure 10. Relationship between Si content and resistance at 6th, 30th, 120th cycle.
Metals 09 00486 g010
Table 1. Chemical compositions of the test materials.
SteelCSiMnPSNiCrMoCuNbTi
WS0.12Si0.0530.121.250.0070.0020.310.510.050.260.0280.013
WS0.34Si0.0580.341.270.0070.0050.300.520.050.250.0260.013
WS0.48Si0.0580.481.270.0080.0020.310.510.060.270.0280.014
Table 2. Corrosion weight gain fitting equation.
SteelPart One (1–6)Part Two (7–29)Part Three (30–85)Part Four (86–120)
WS0.12Si lg Δ w = 0.078 + 1.023 lgN lg Δ w = 0.245 + 0.788 lgN lg Δ w = 0.545 + 0.628 lgN lg Δ w = 0.869 + 0.457 lgN
WS0.34Si lg Δ w = 0.095 + 1.314 lgN lg Δ w = 0.202 + 0.798 lgN lg Δ w = 0.457 + 0.670 lgN lg Δ w = 0.843 + 0.467 lgN
WS0.48Si lg Δ w = 0.059 + 1.003 lgN lg Δ w = 0.254 + 0.766 lgN lg Δ w = 0.580 + 0.590 lgN lg Δ w = 0.847 + 0.449 lgN

