Micromechanical Modelling of the Cyclic Deformation Behavior of Martensitic SAE 4150—A Comparison of Different Kinematic Hardening Models

 , and
, and 
Abstract
:1. Introduction
2. Material and Experiments
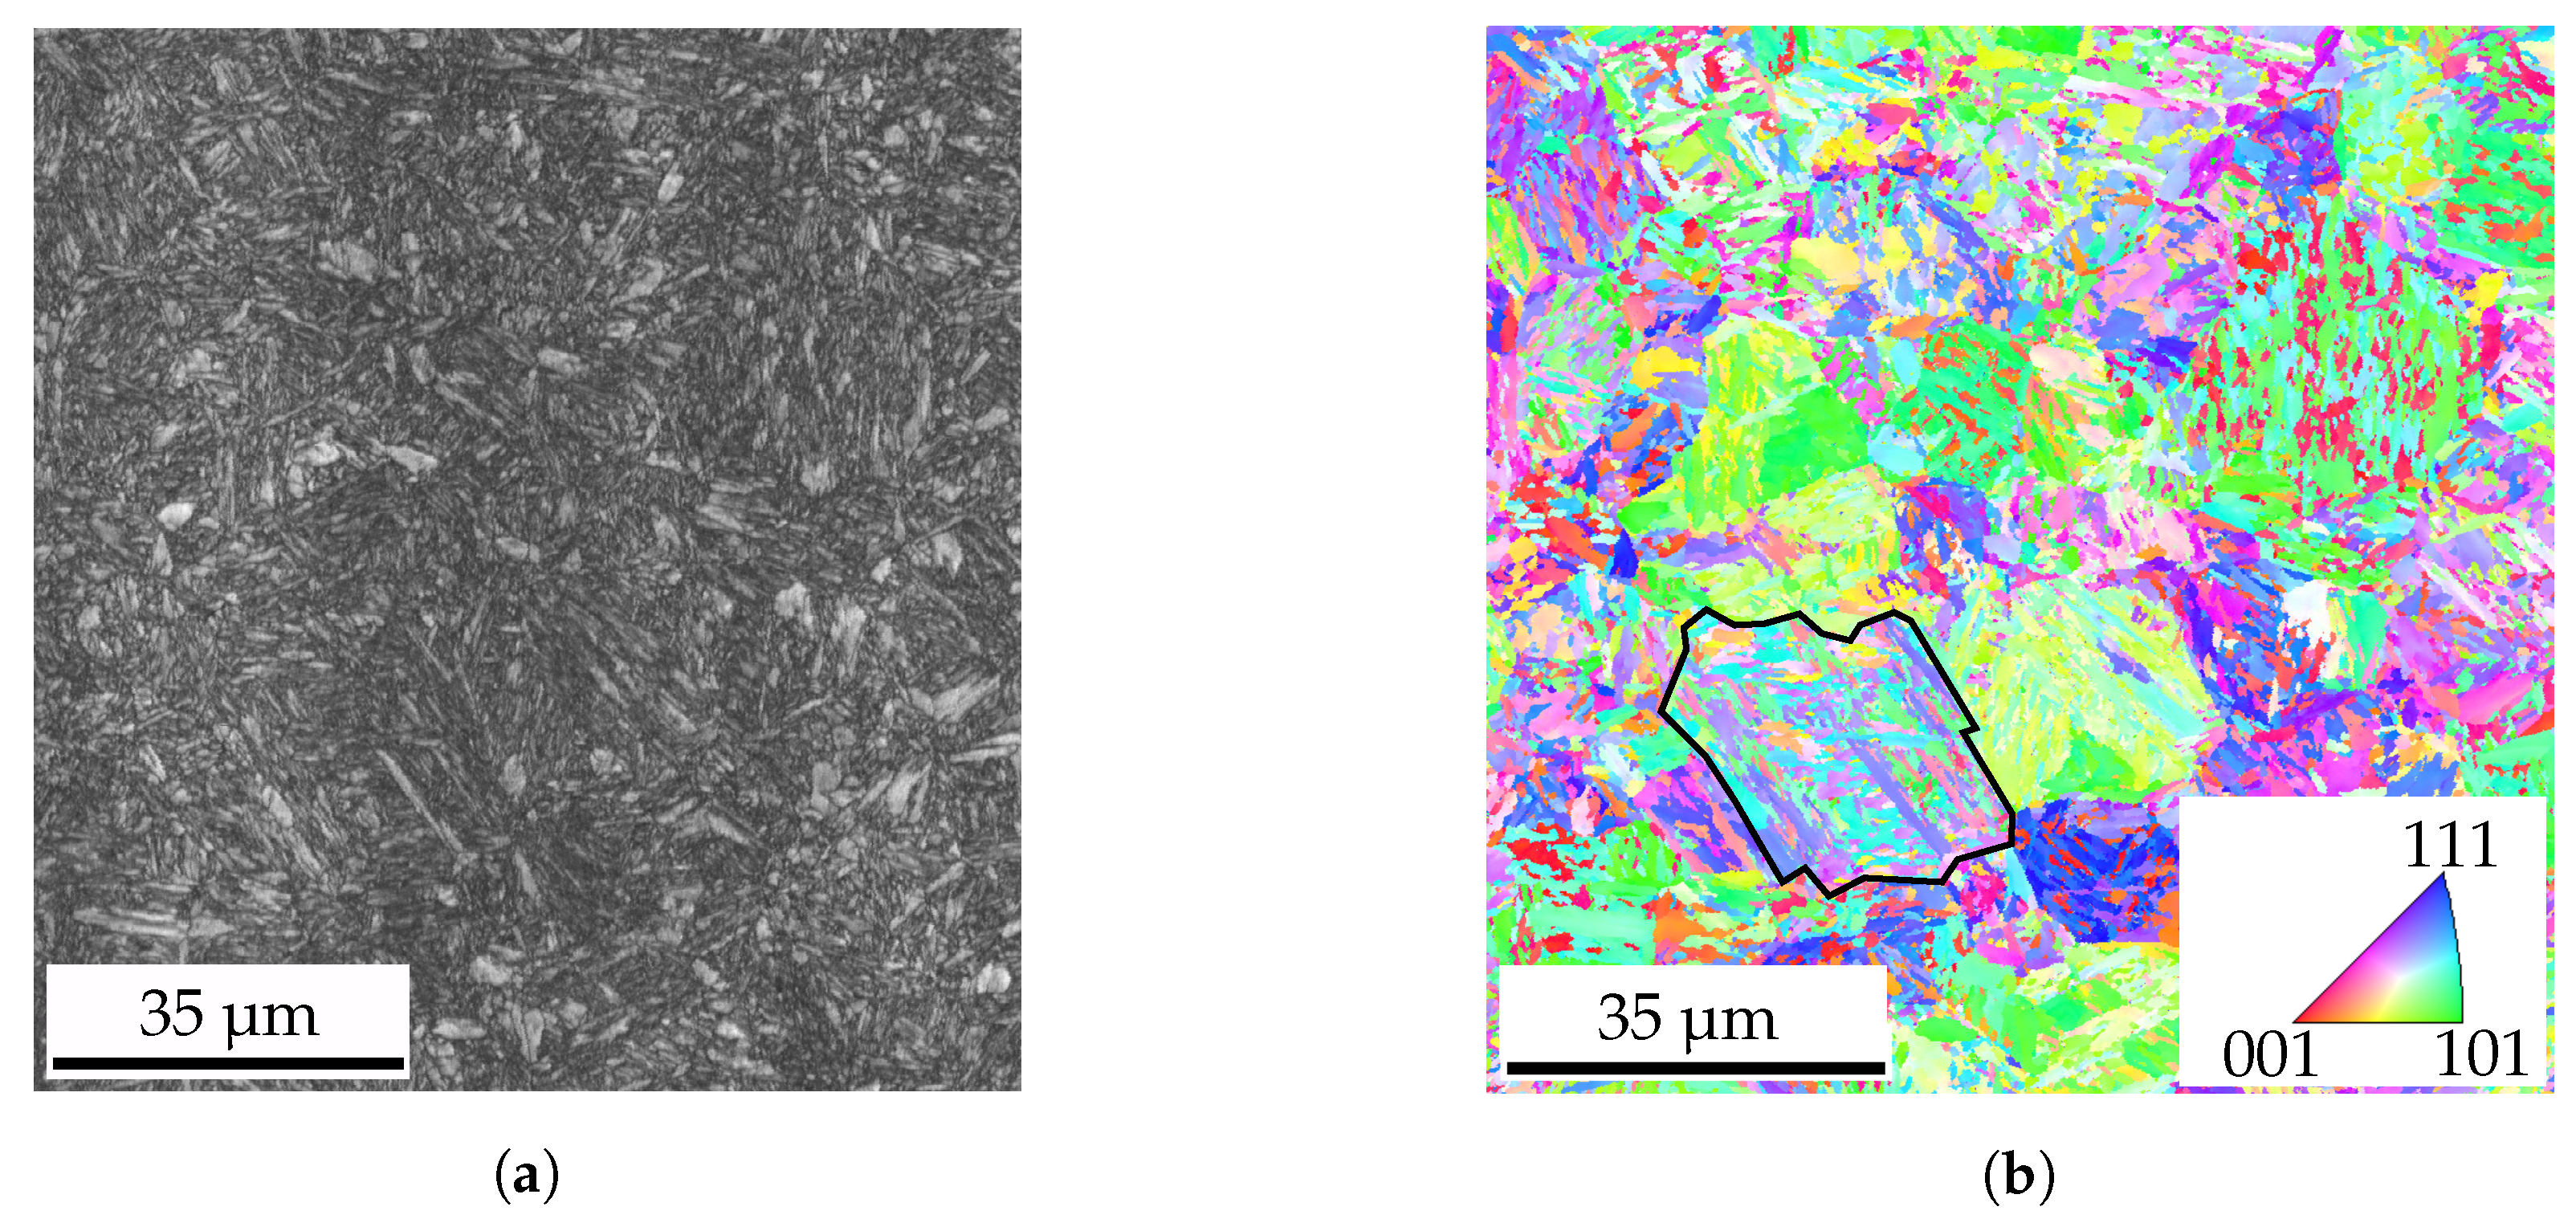
2.1. Microstructure Characterization
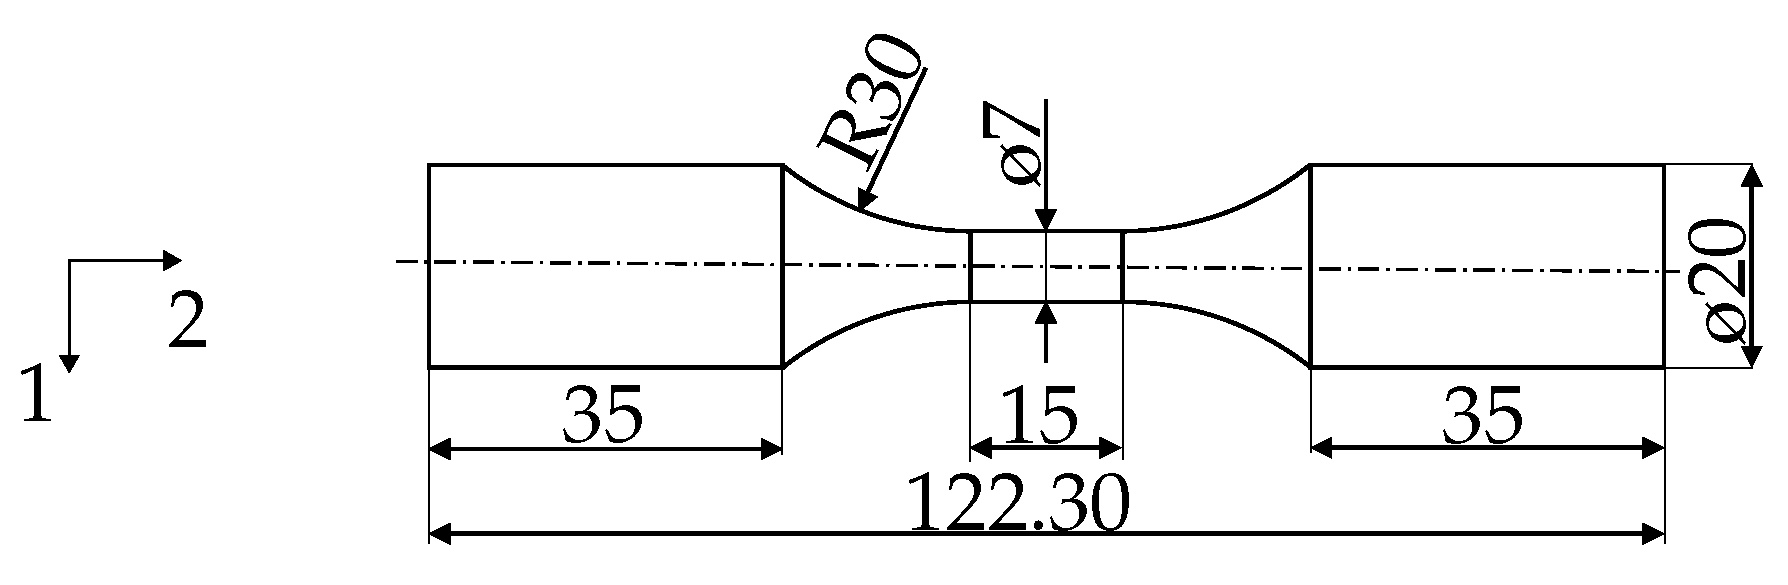
2.2. Mechanical Cyclic Properties
3. Modelling Methodology and Constitutive Calibration Strategy
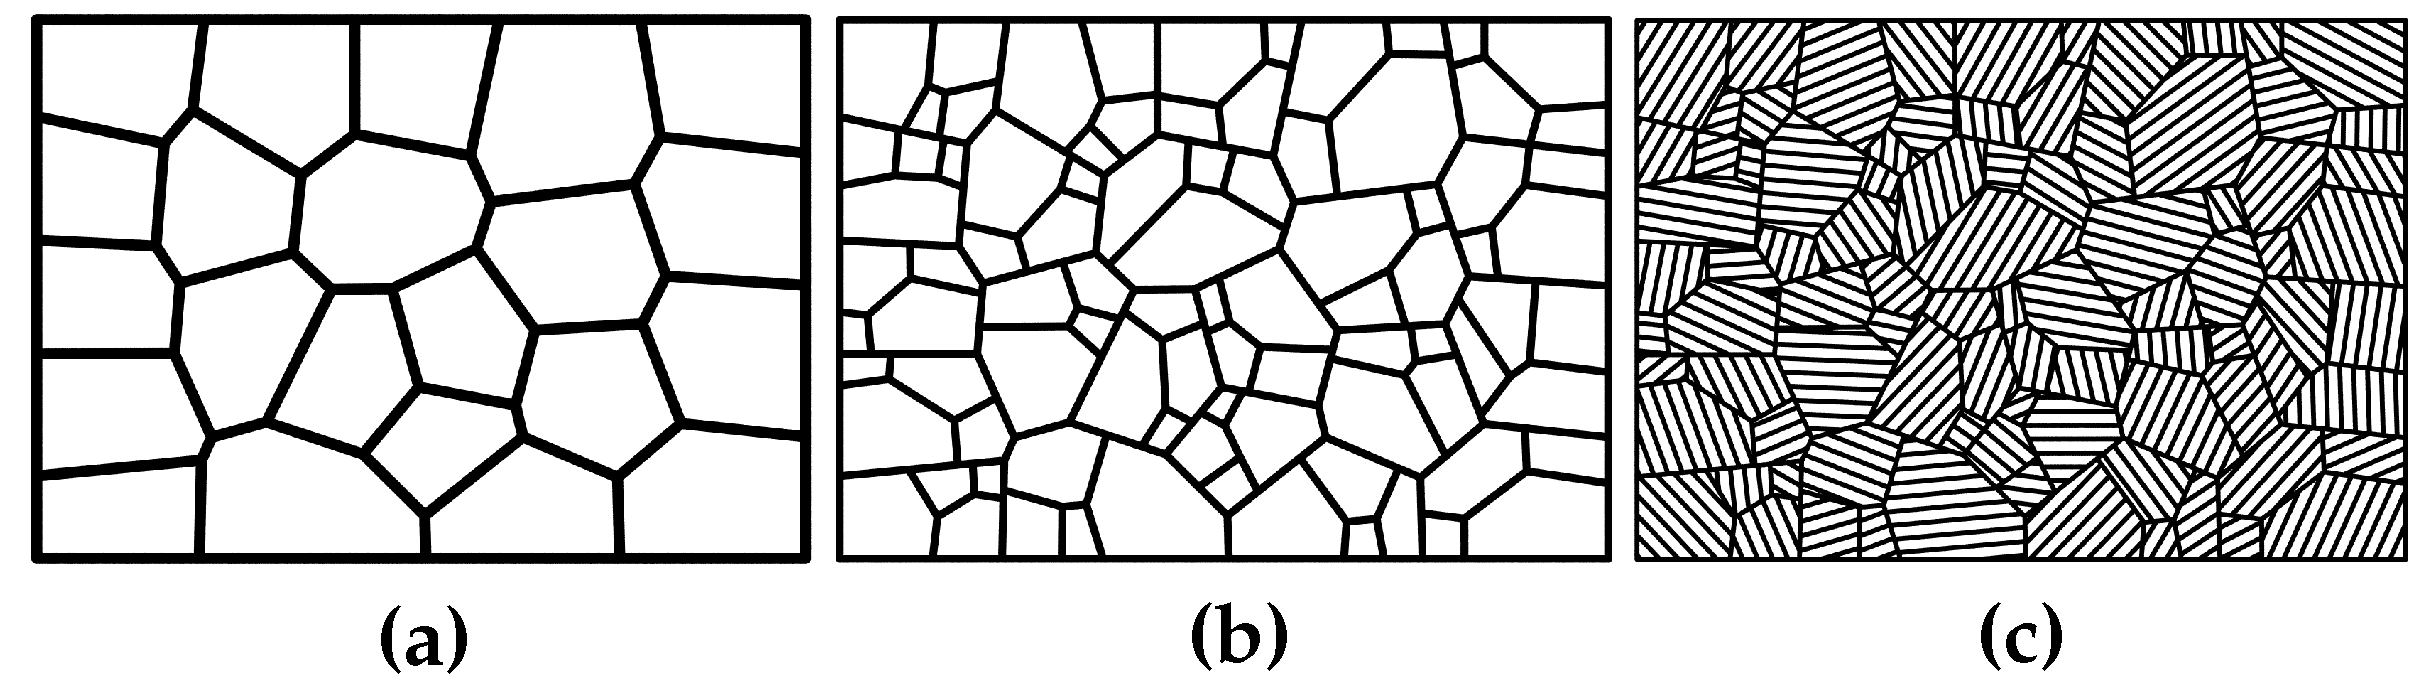
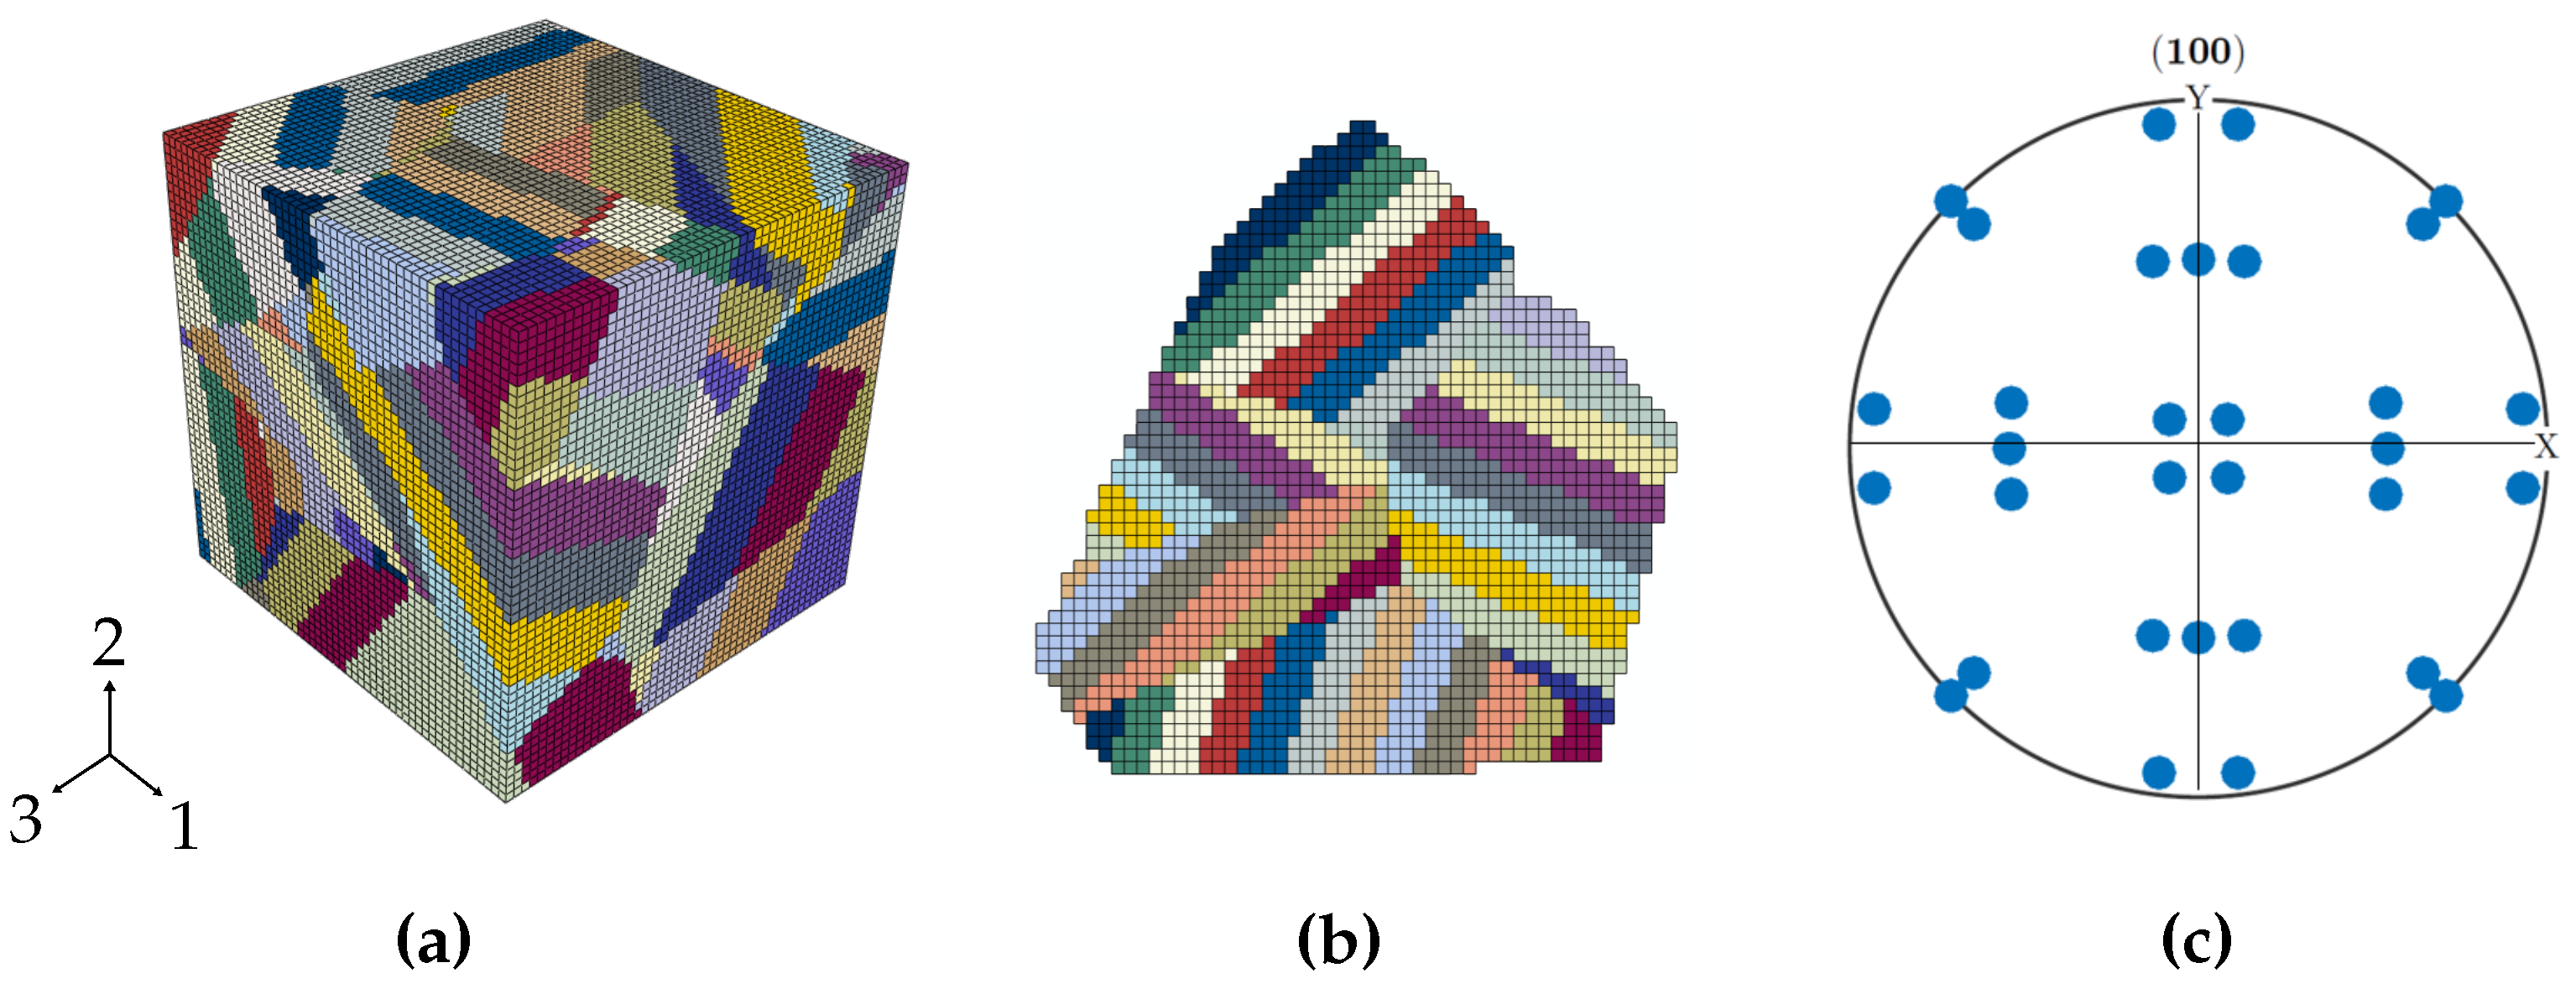
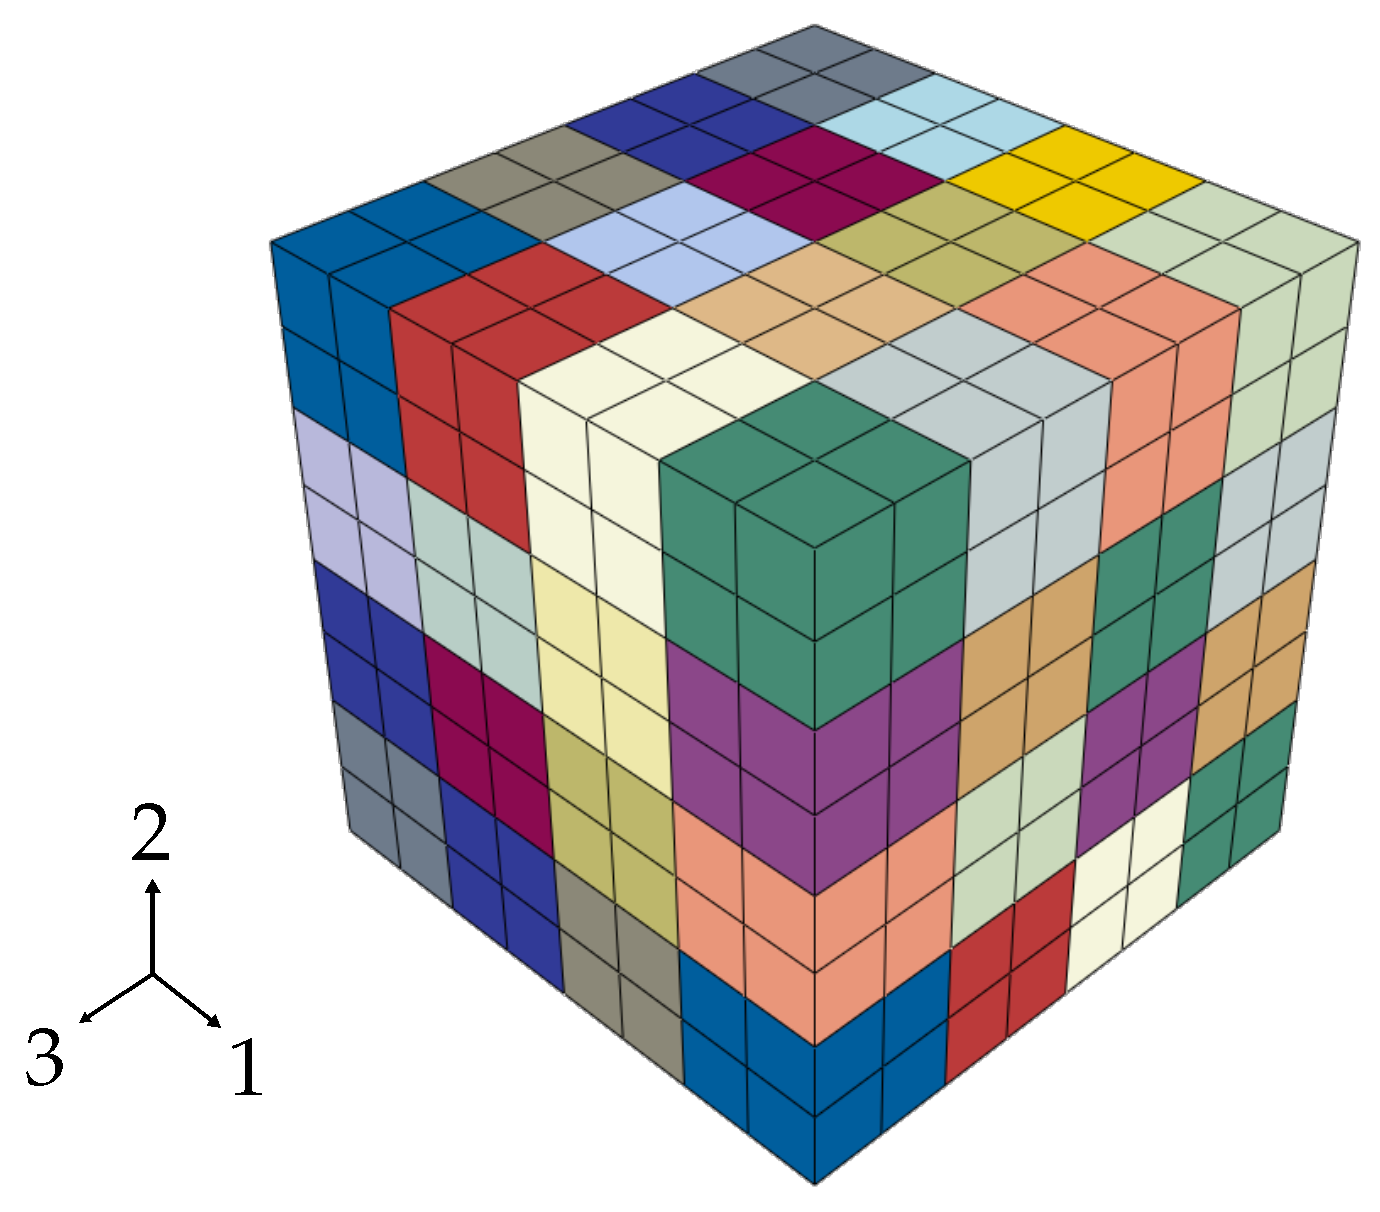
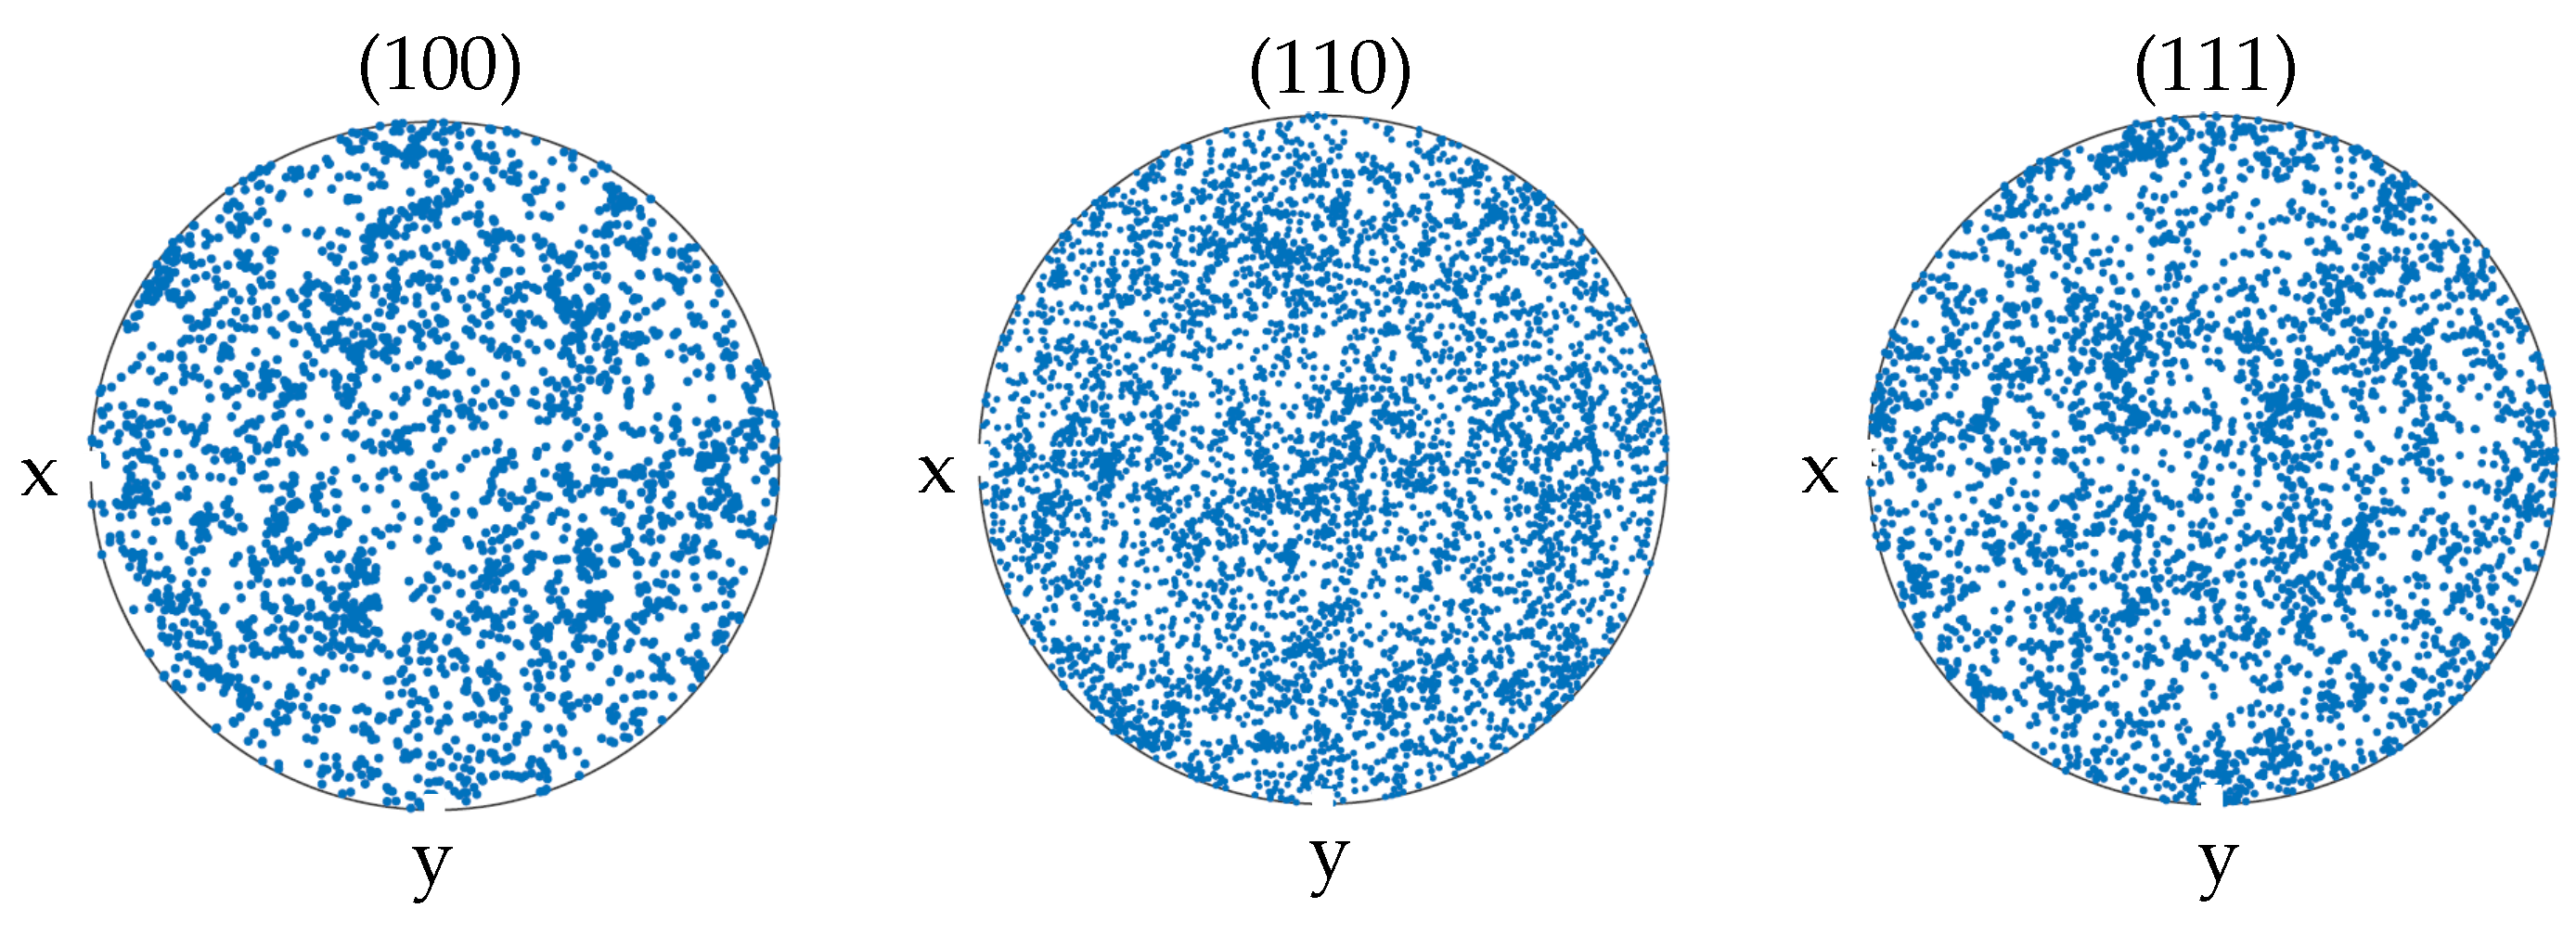
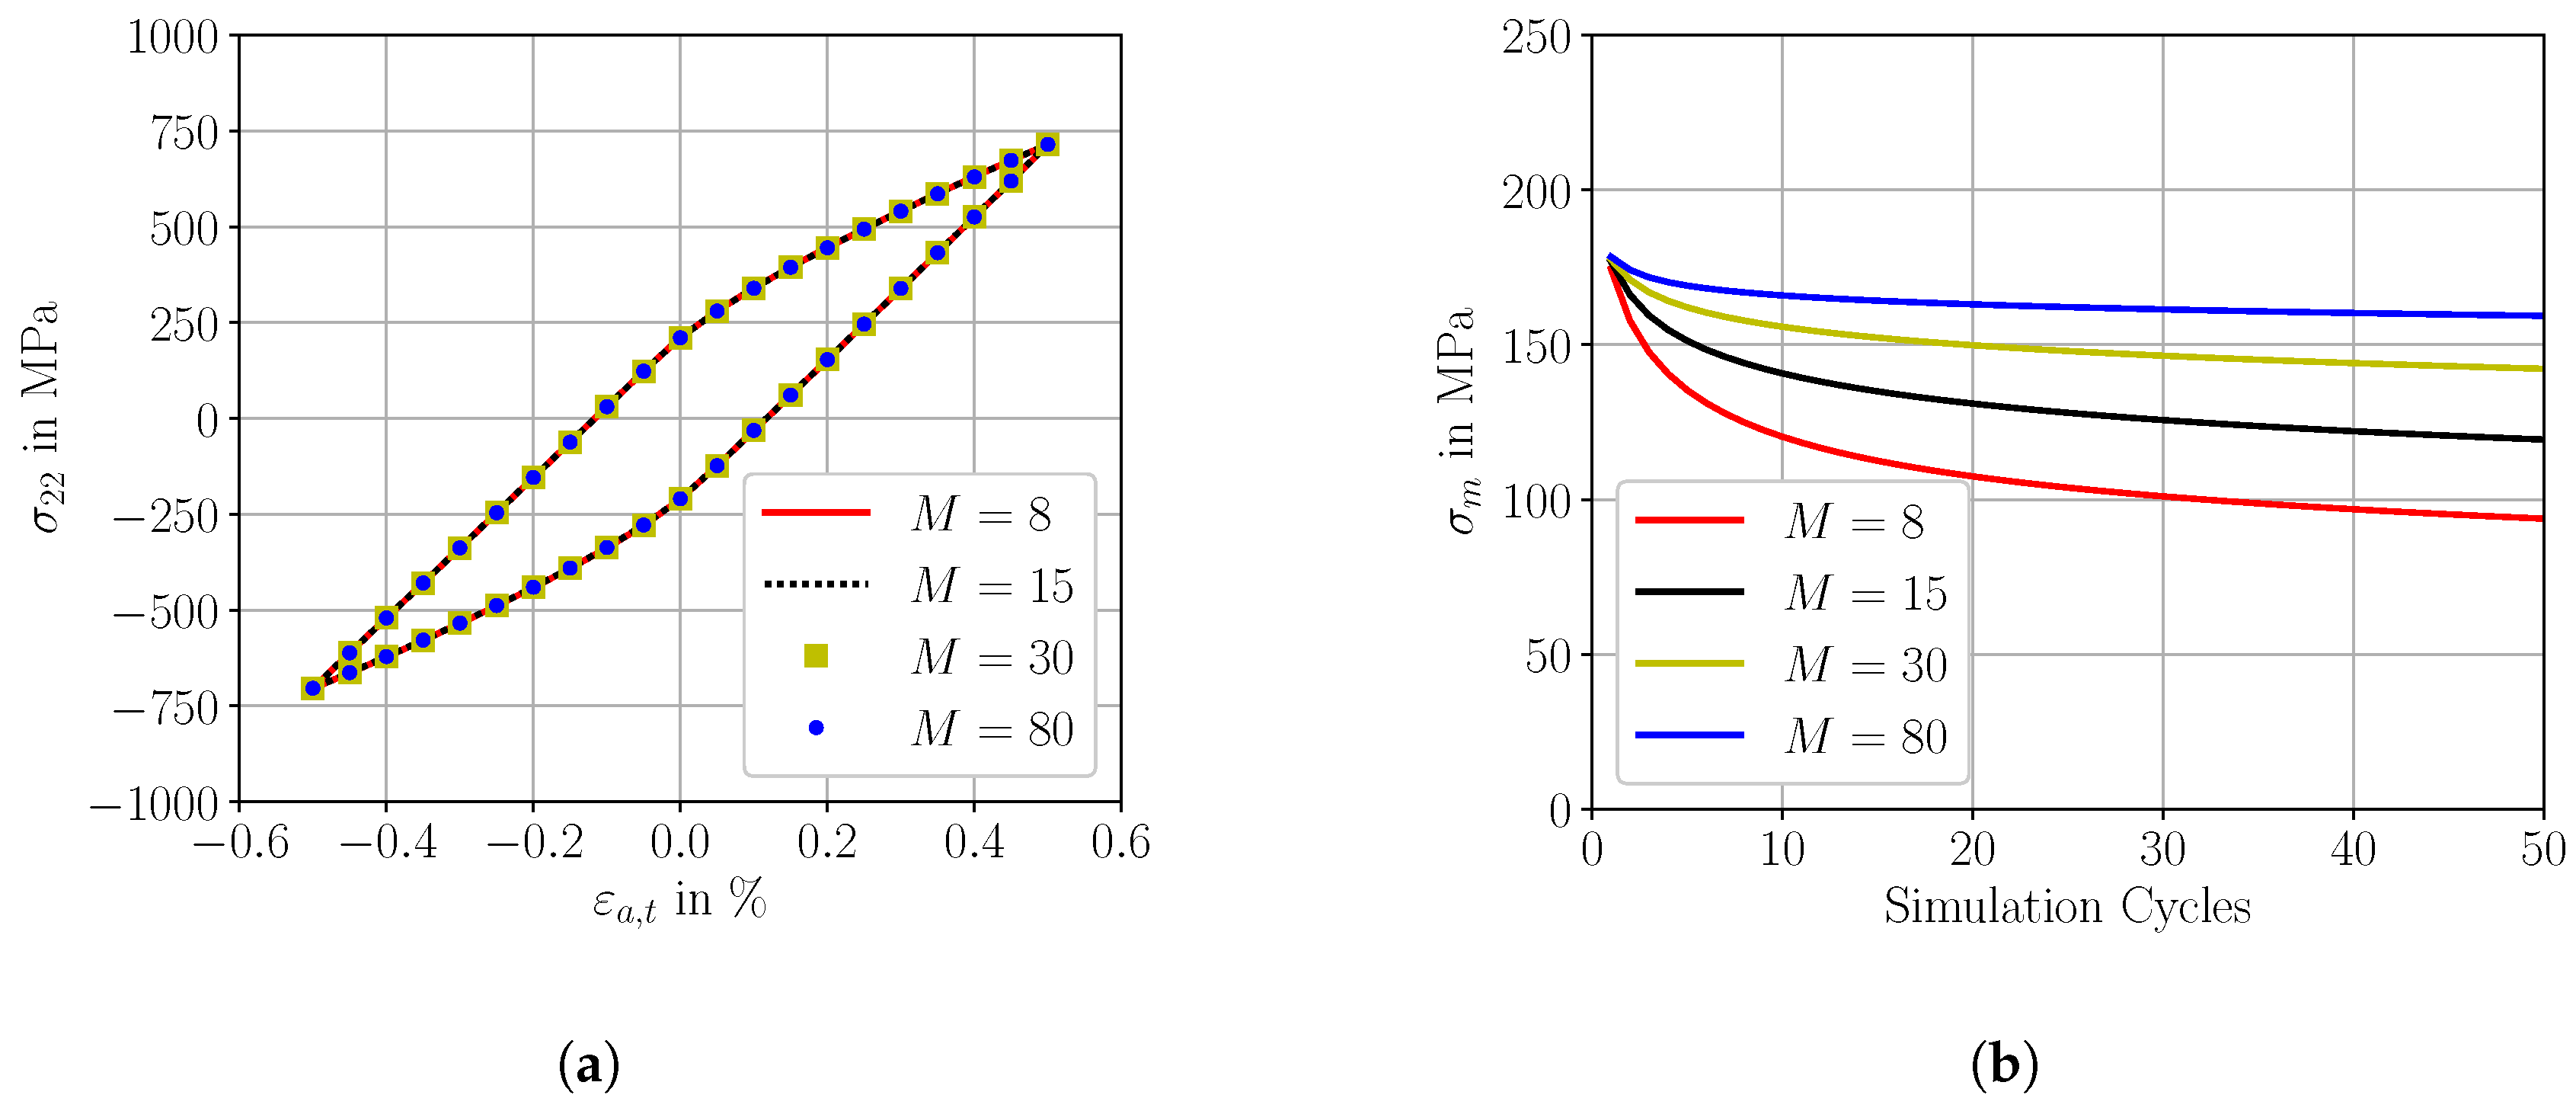
3.1. Generation of Representative Volume Elements
3.2. Constitutive Framework
3.2.1. Crystal Plasticity Model
3.2.2. Phenomenological Hardening Models
3.3. Parametrization of the Crystal Plasticity Model
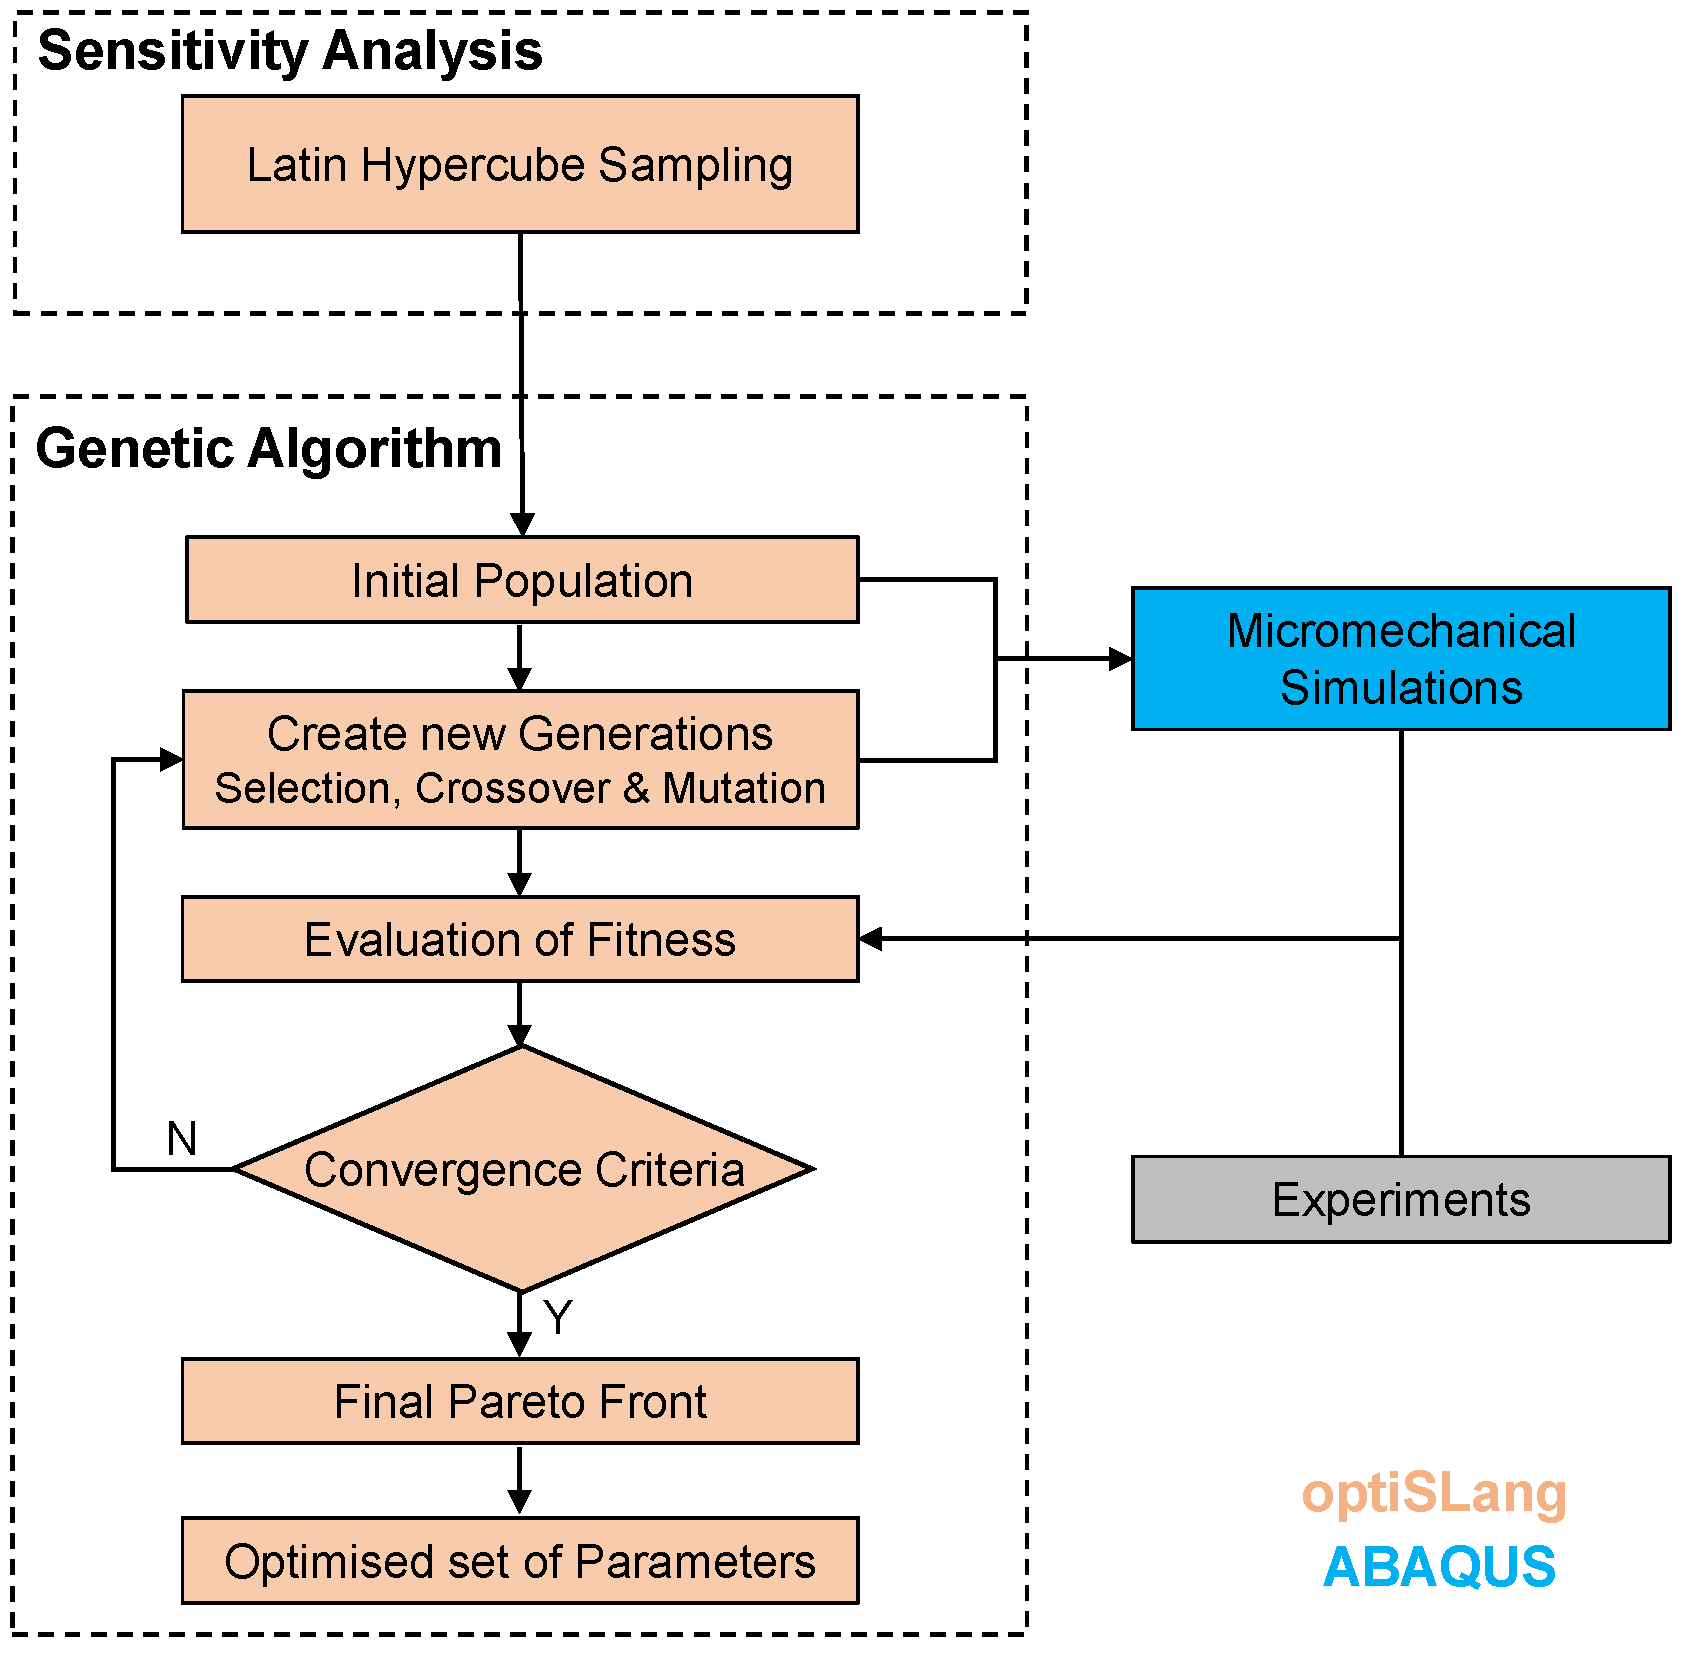
Calibration Strategy
- a set of elastic constants of the crystal
- a set related to the flow rule
- a set related to the isotropic hardening
- a set related to the KH
4. Results and Discussion
4.1. Calibration of the Constitutive Models
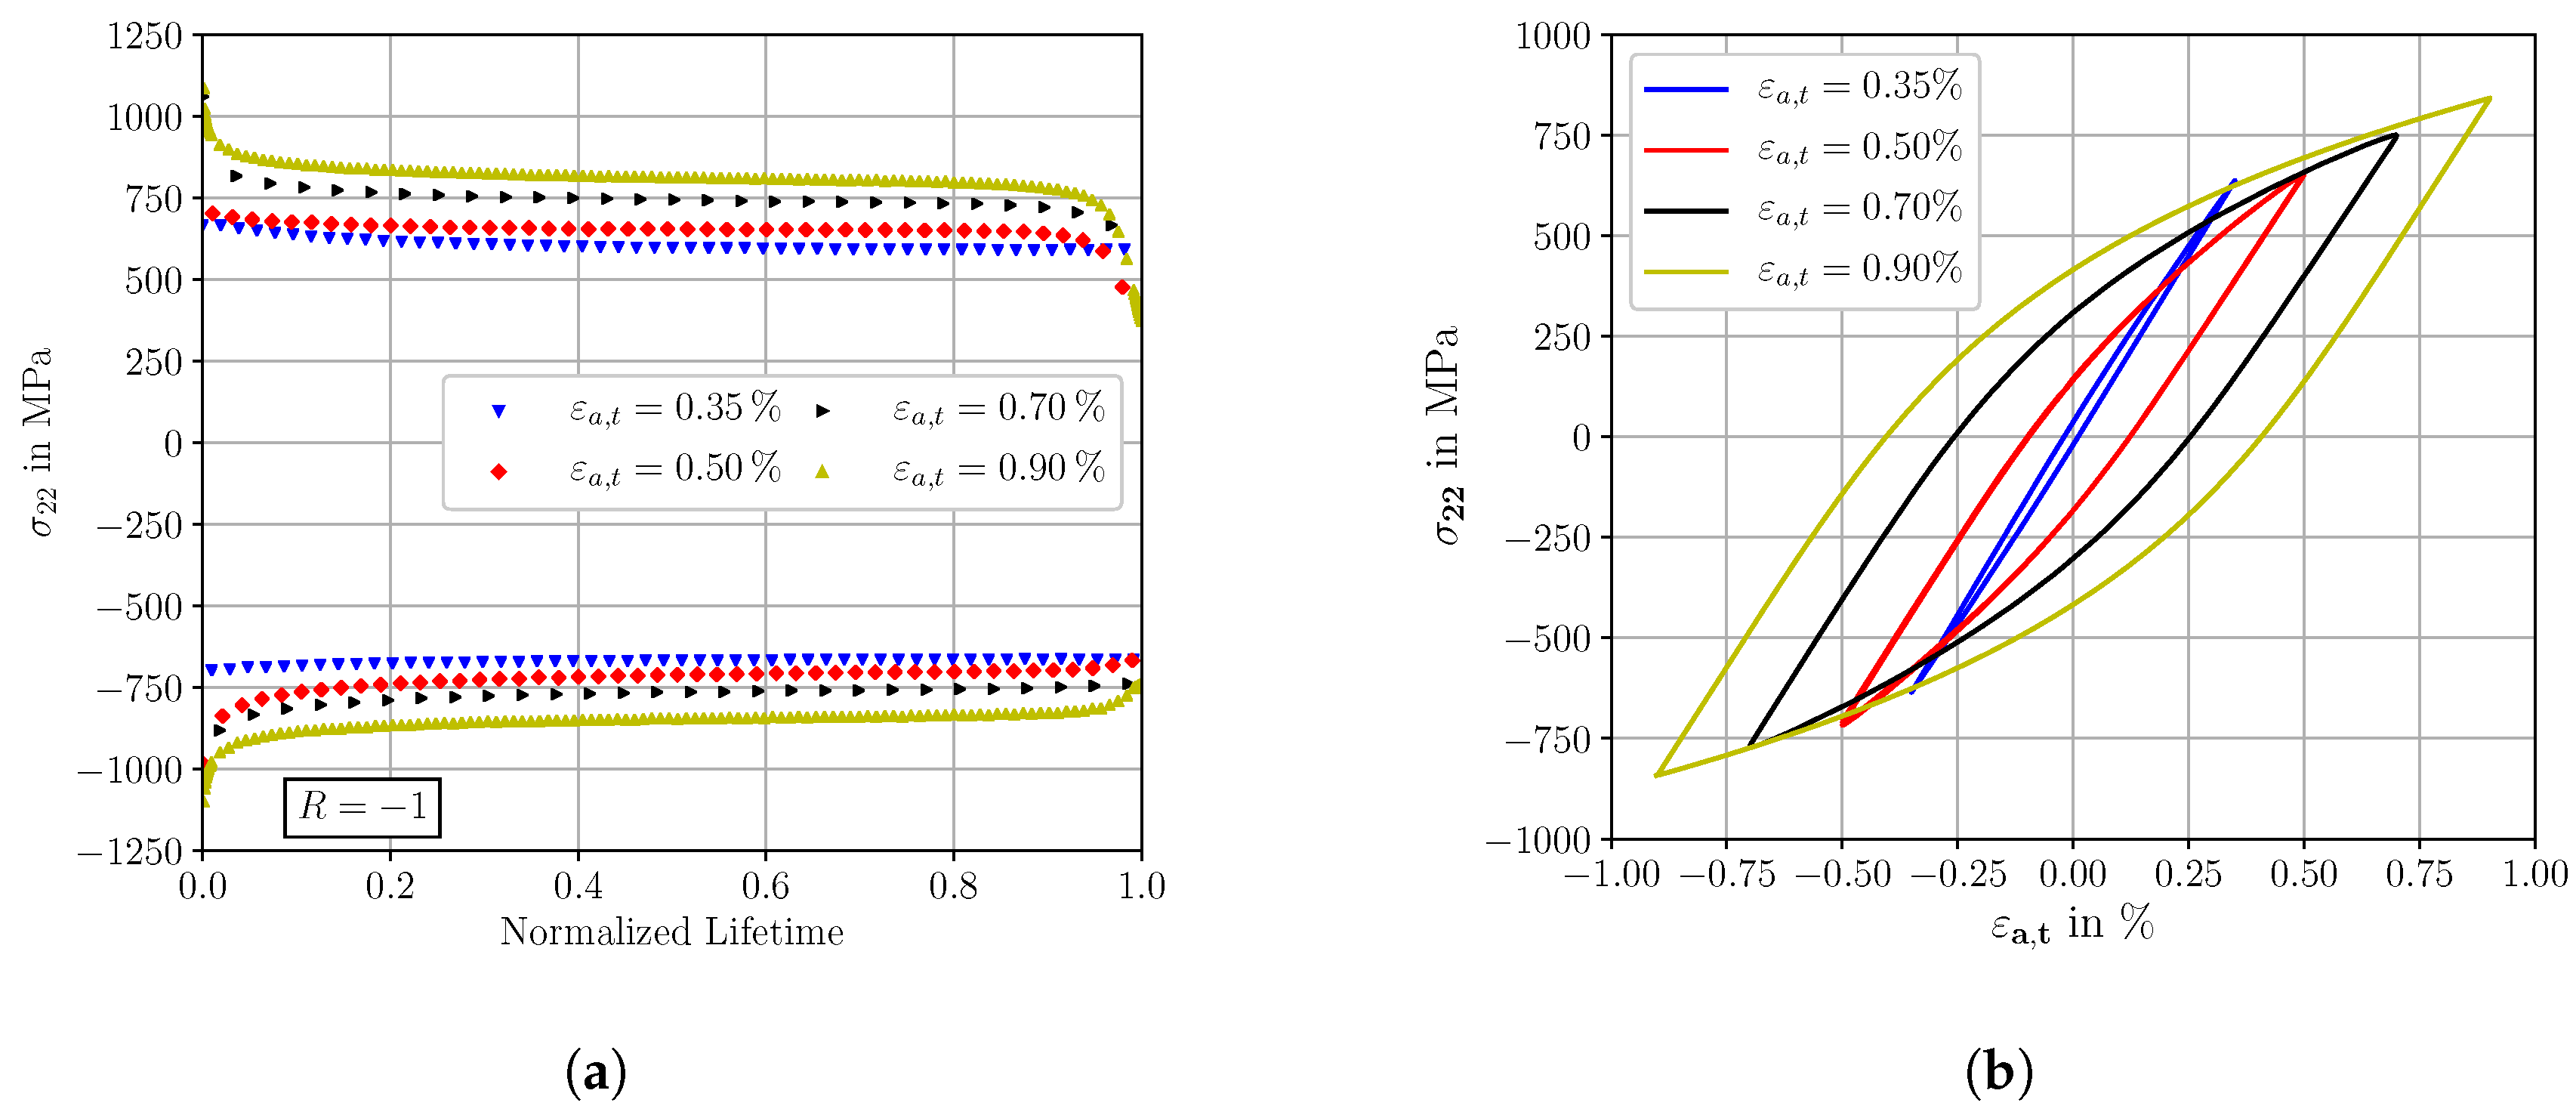
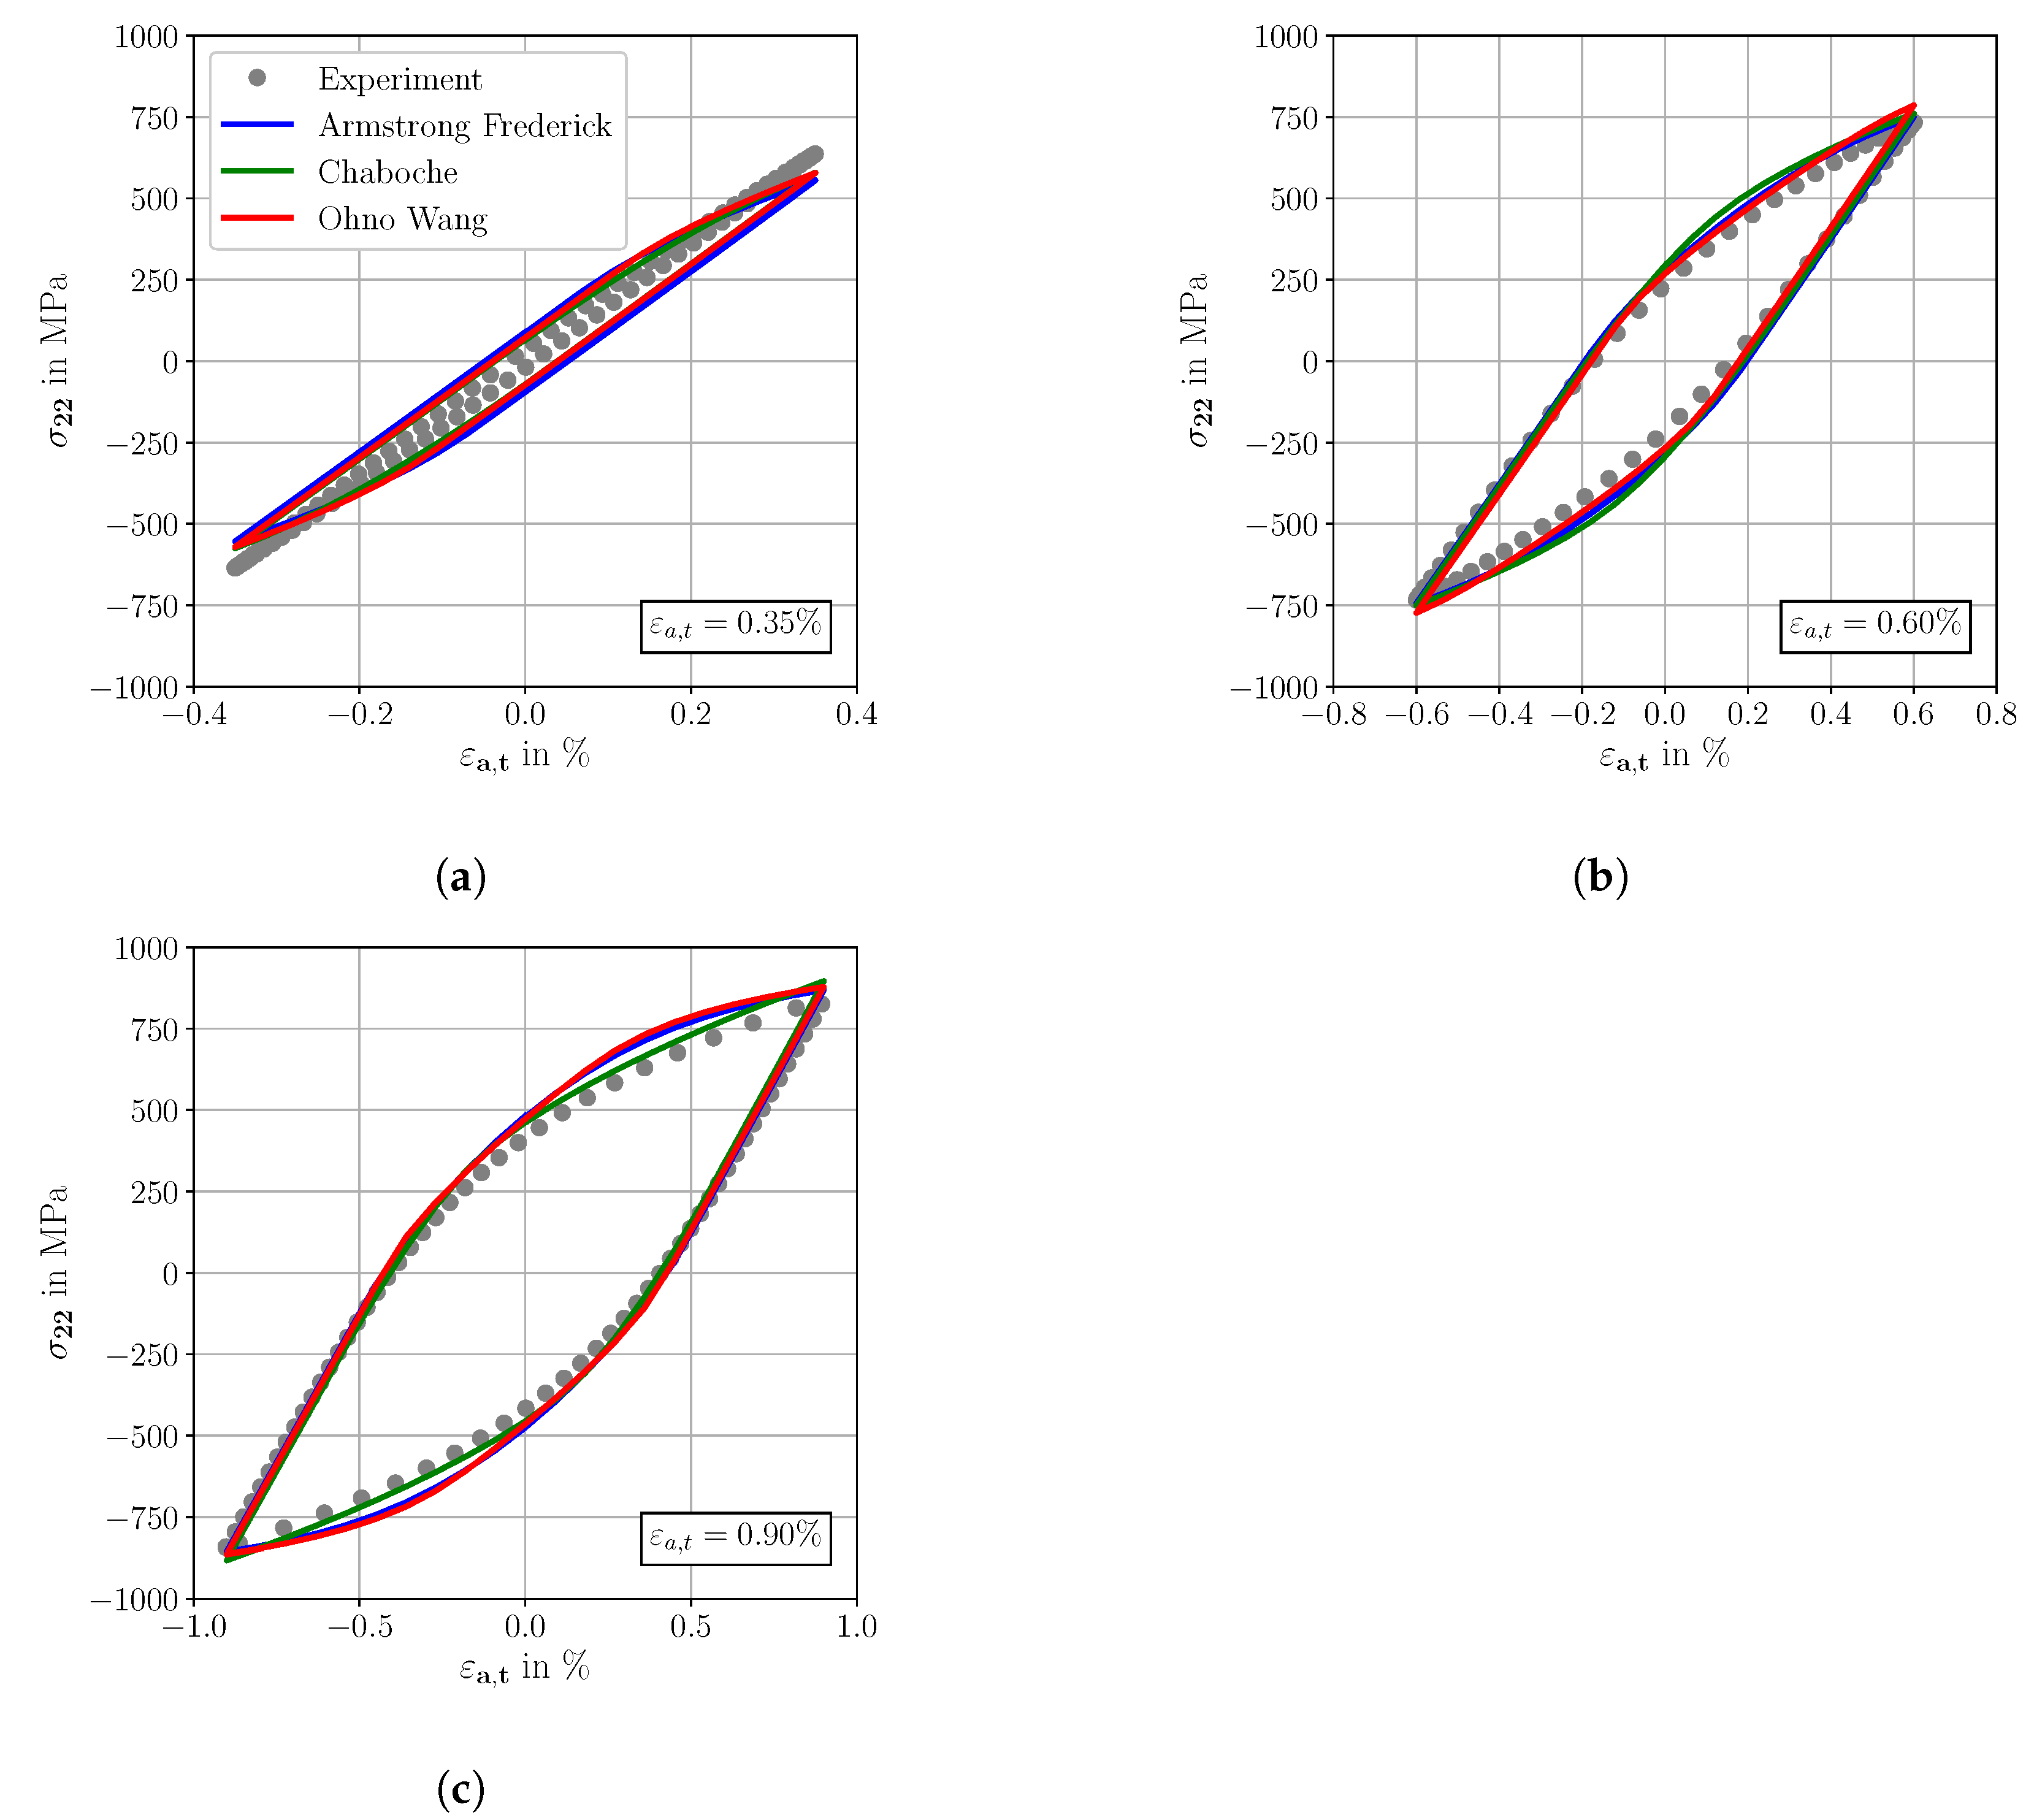
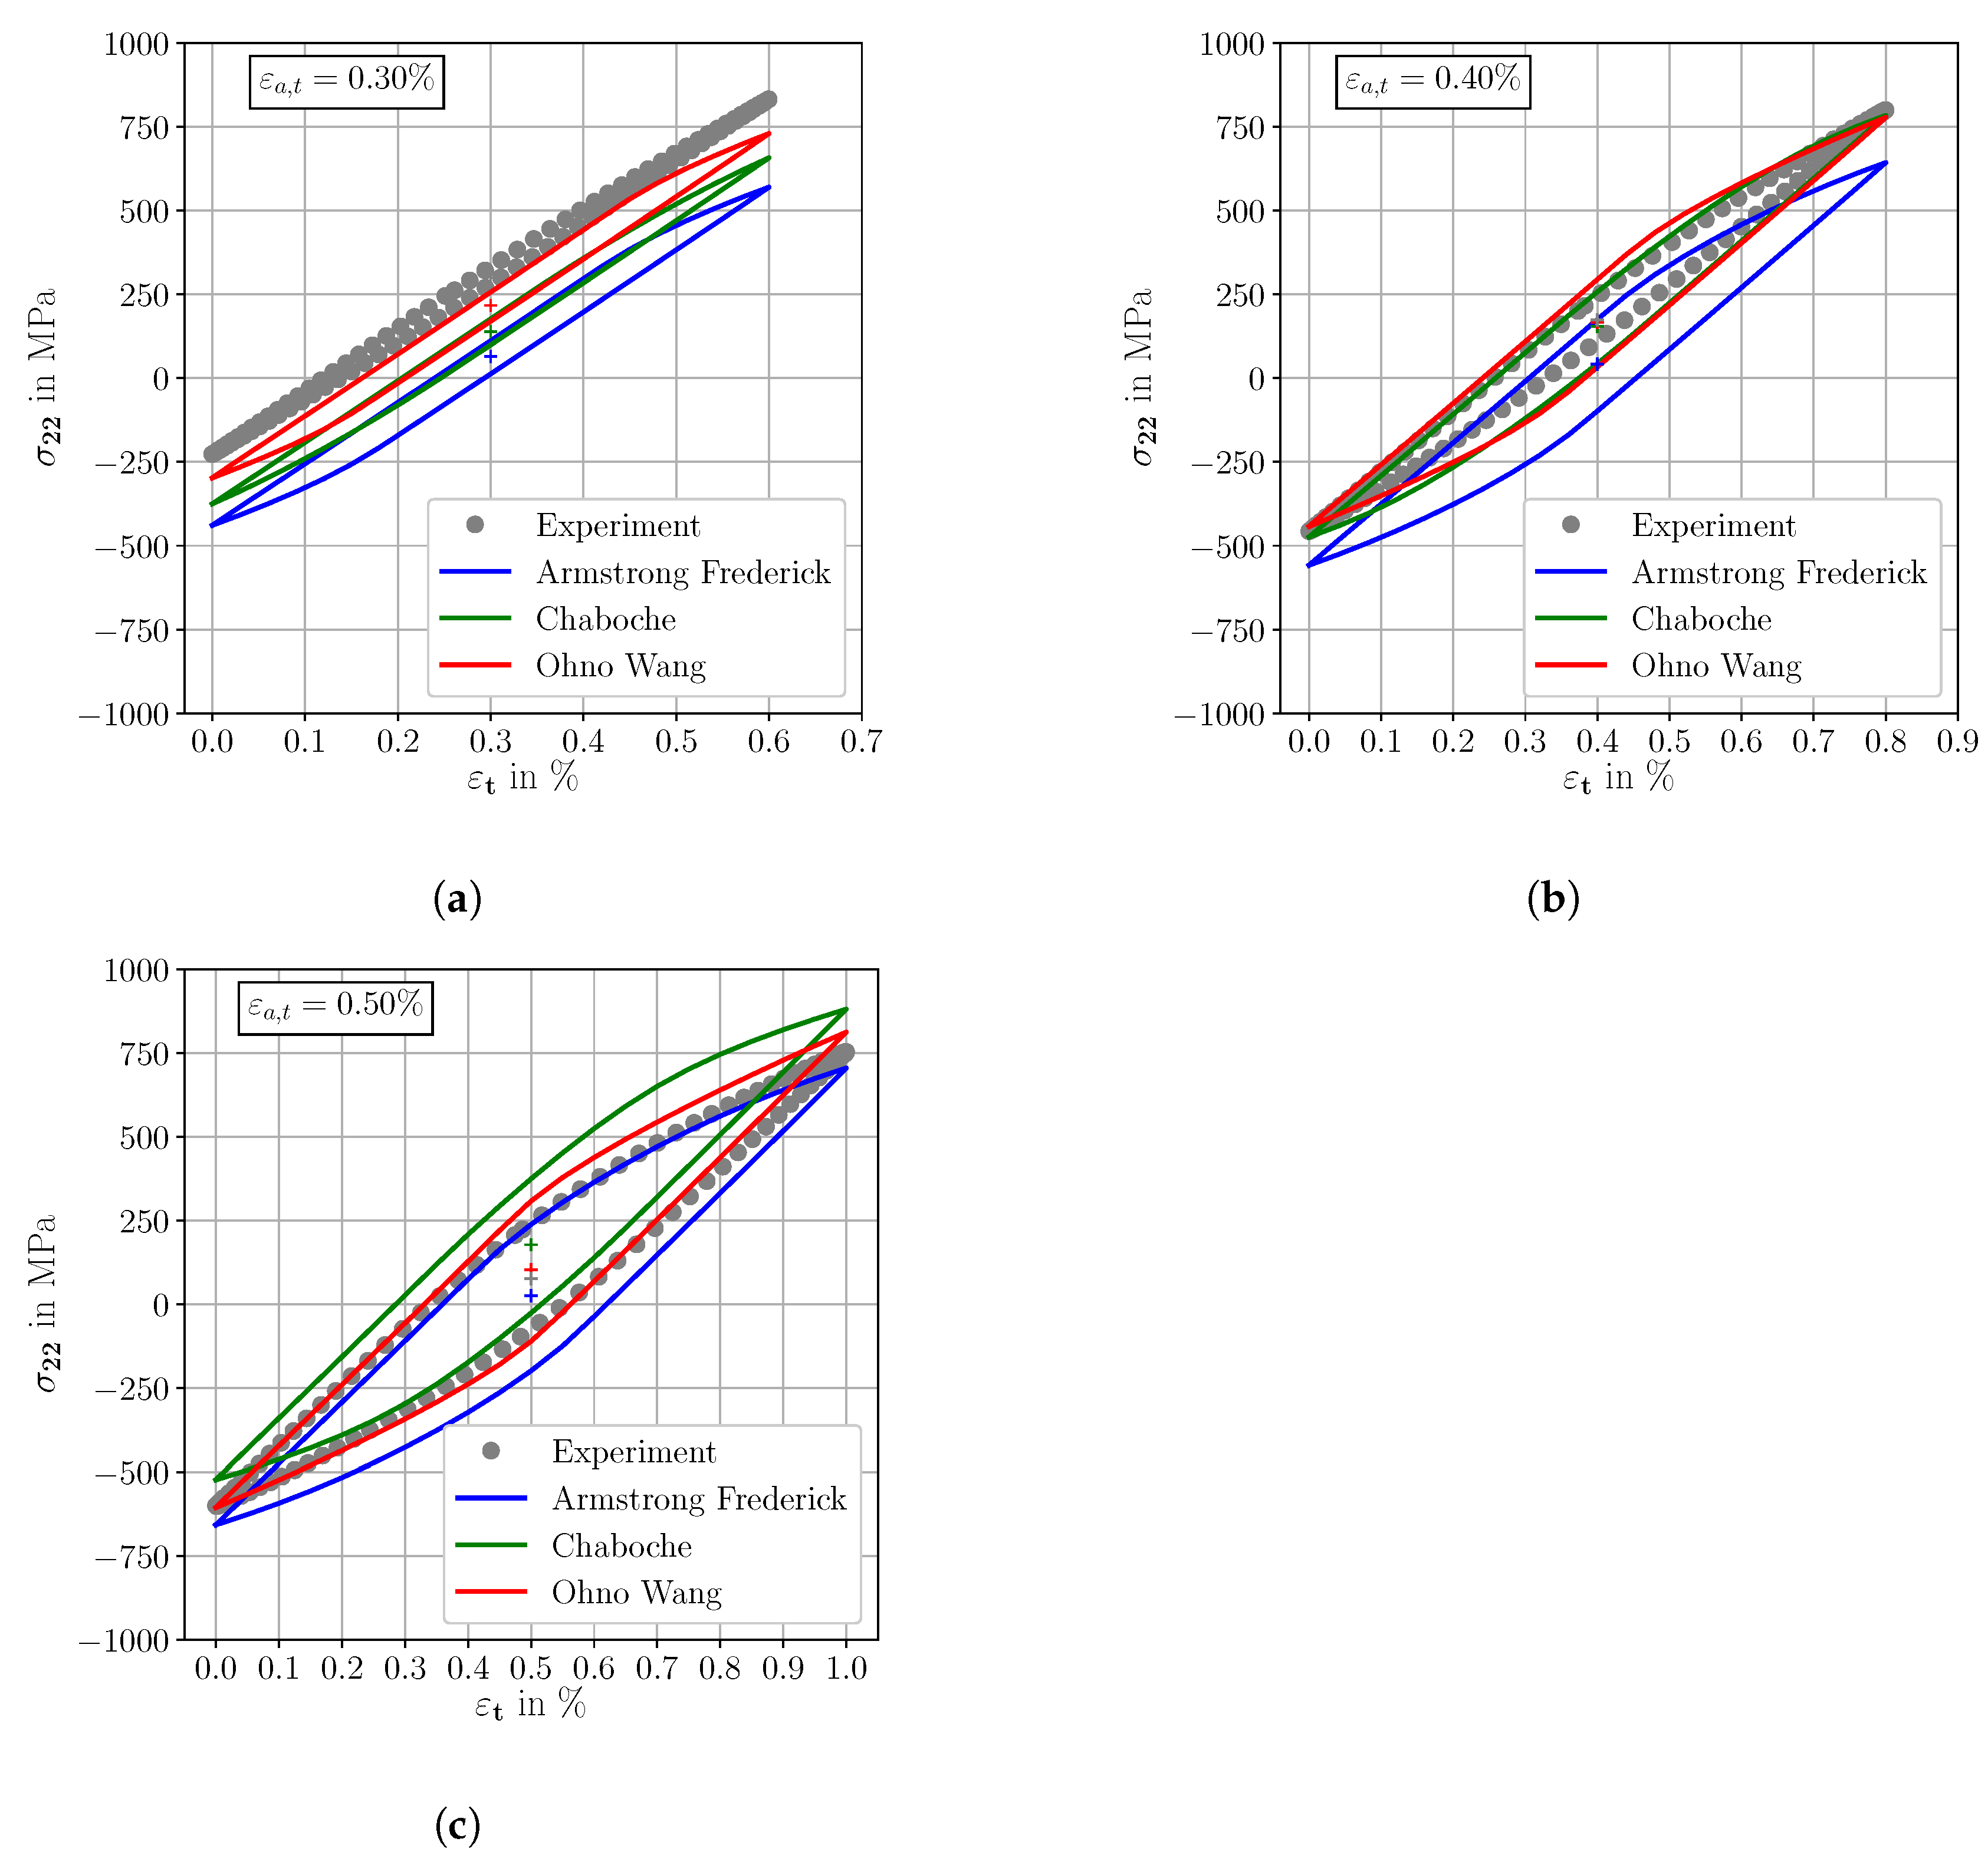
4.2. Cyclic Deformation Behavior at R = −1—KH Model Comparison
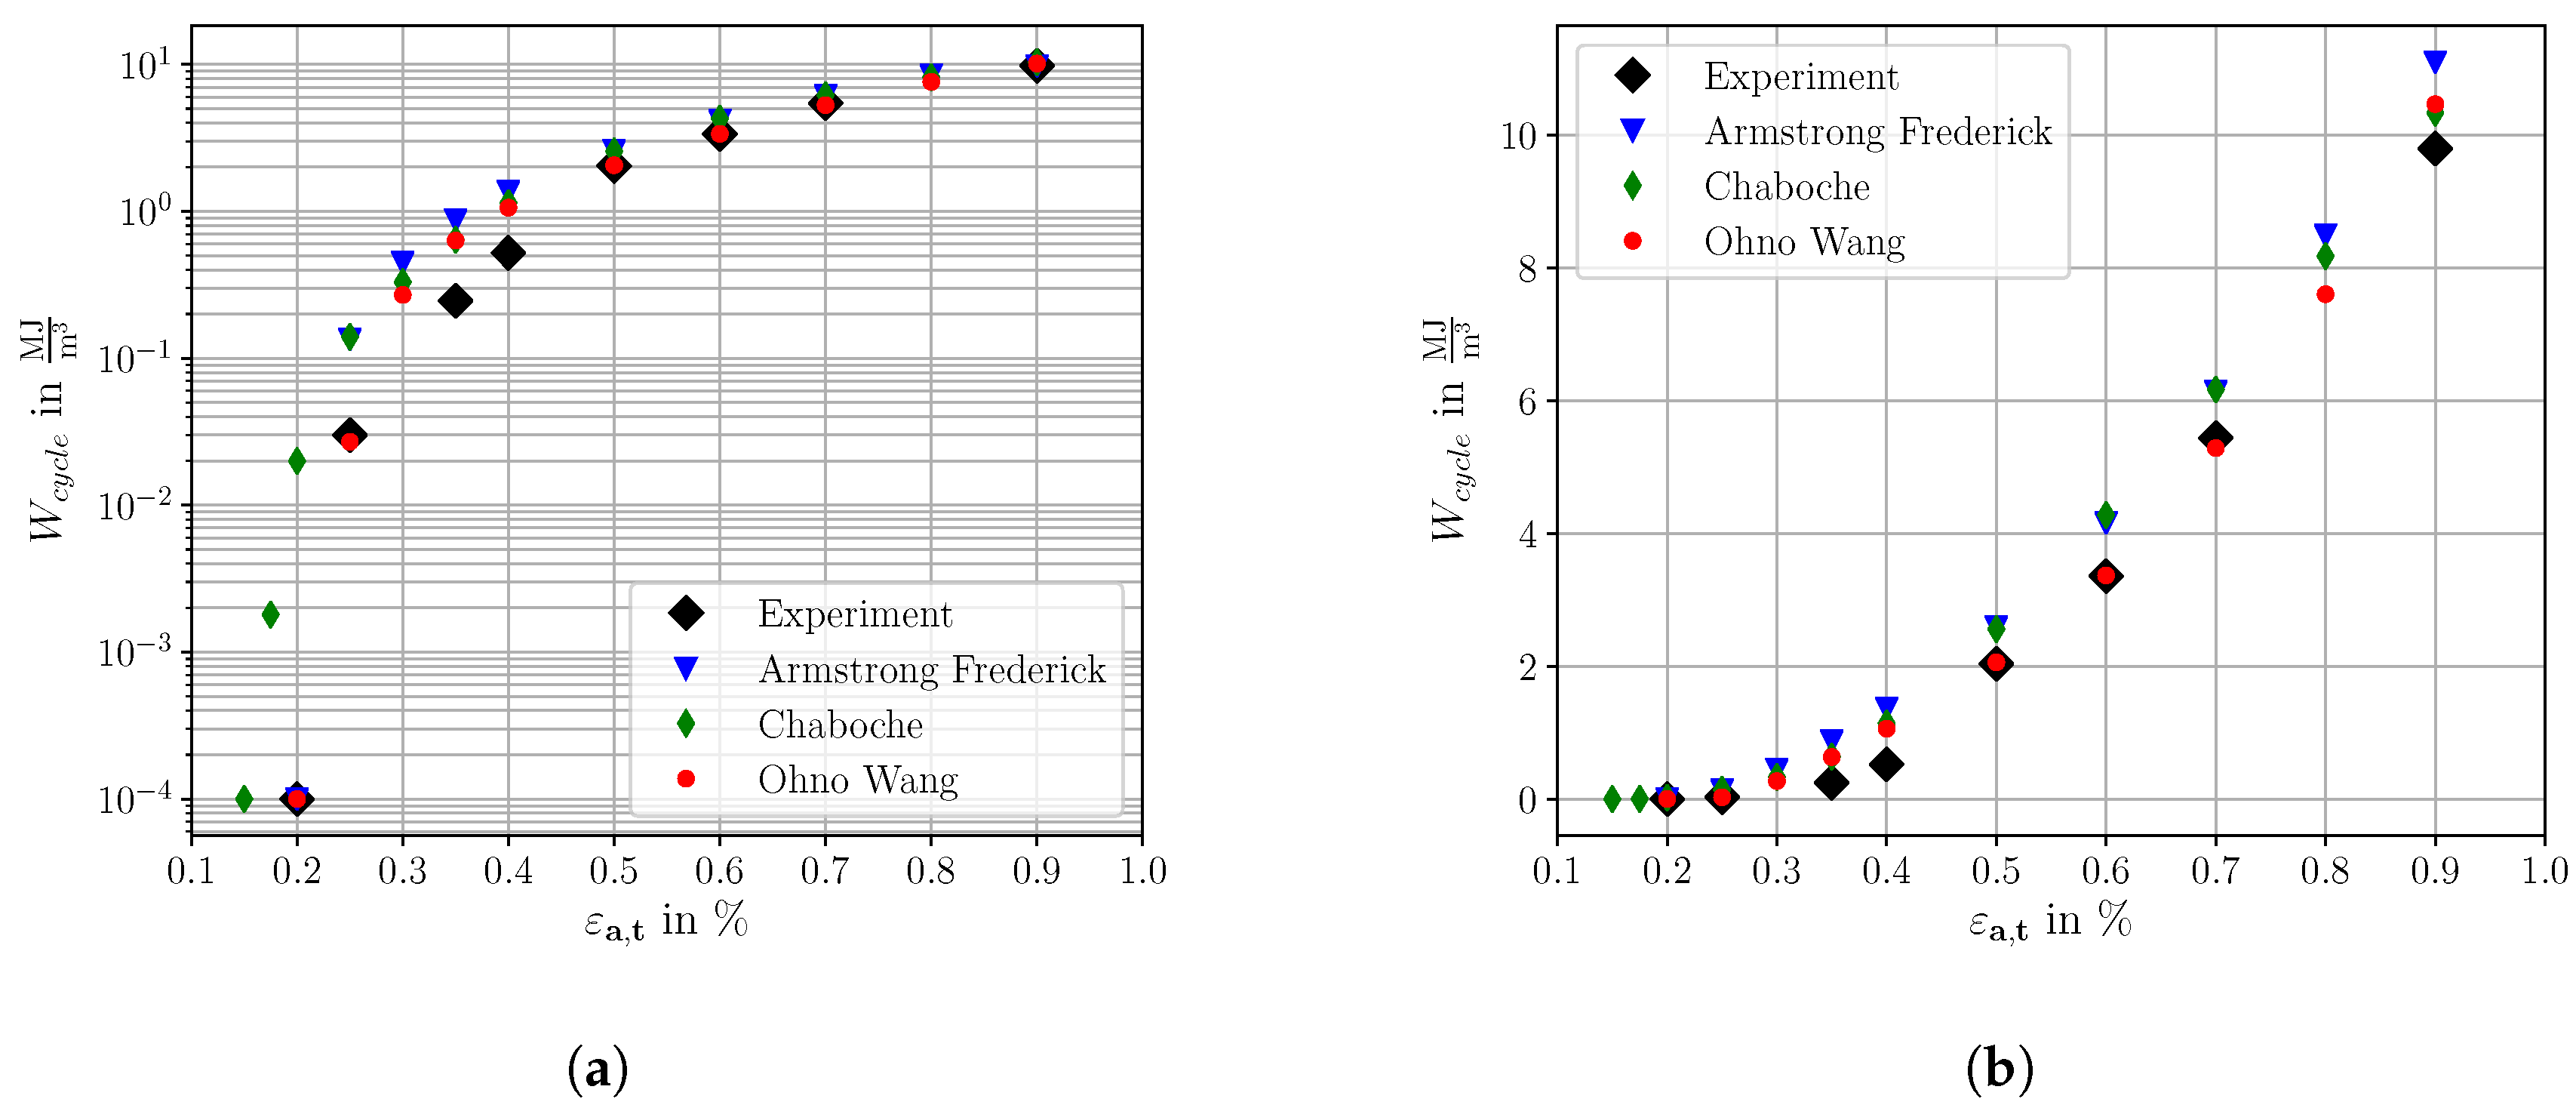
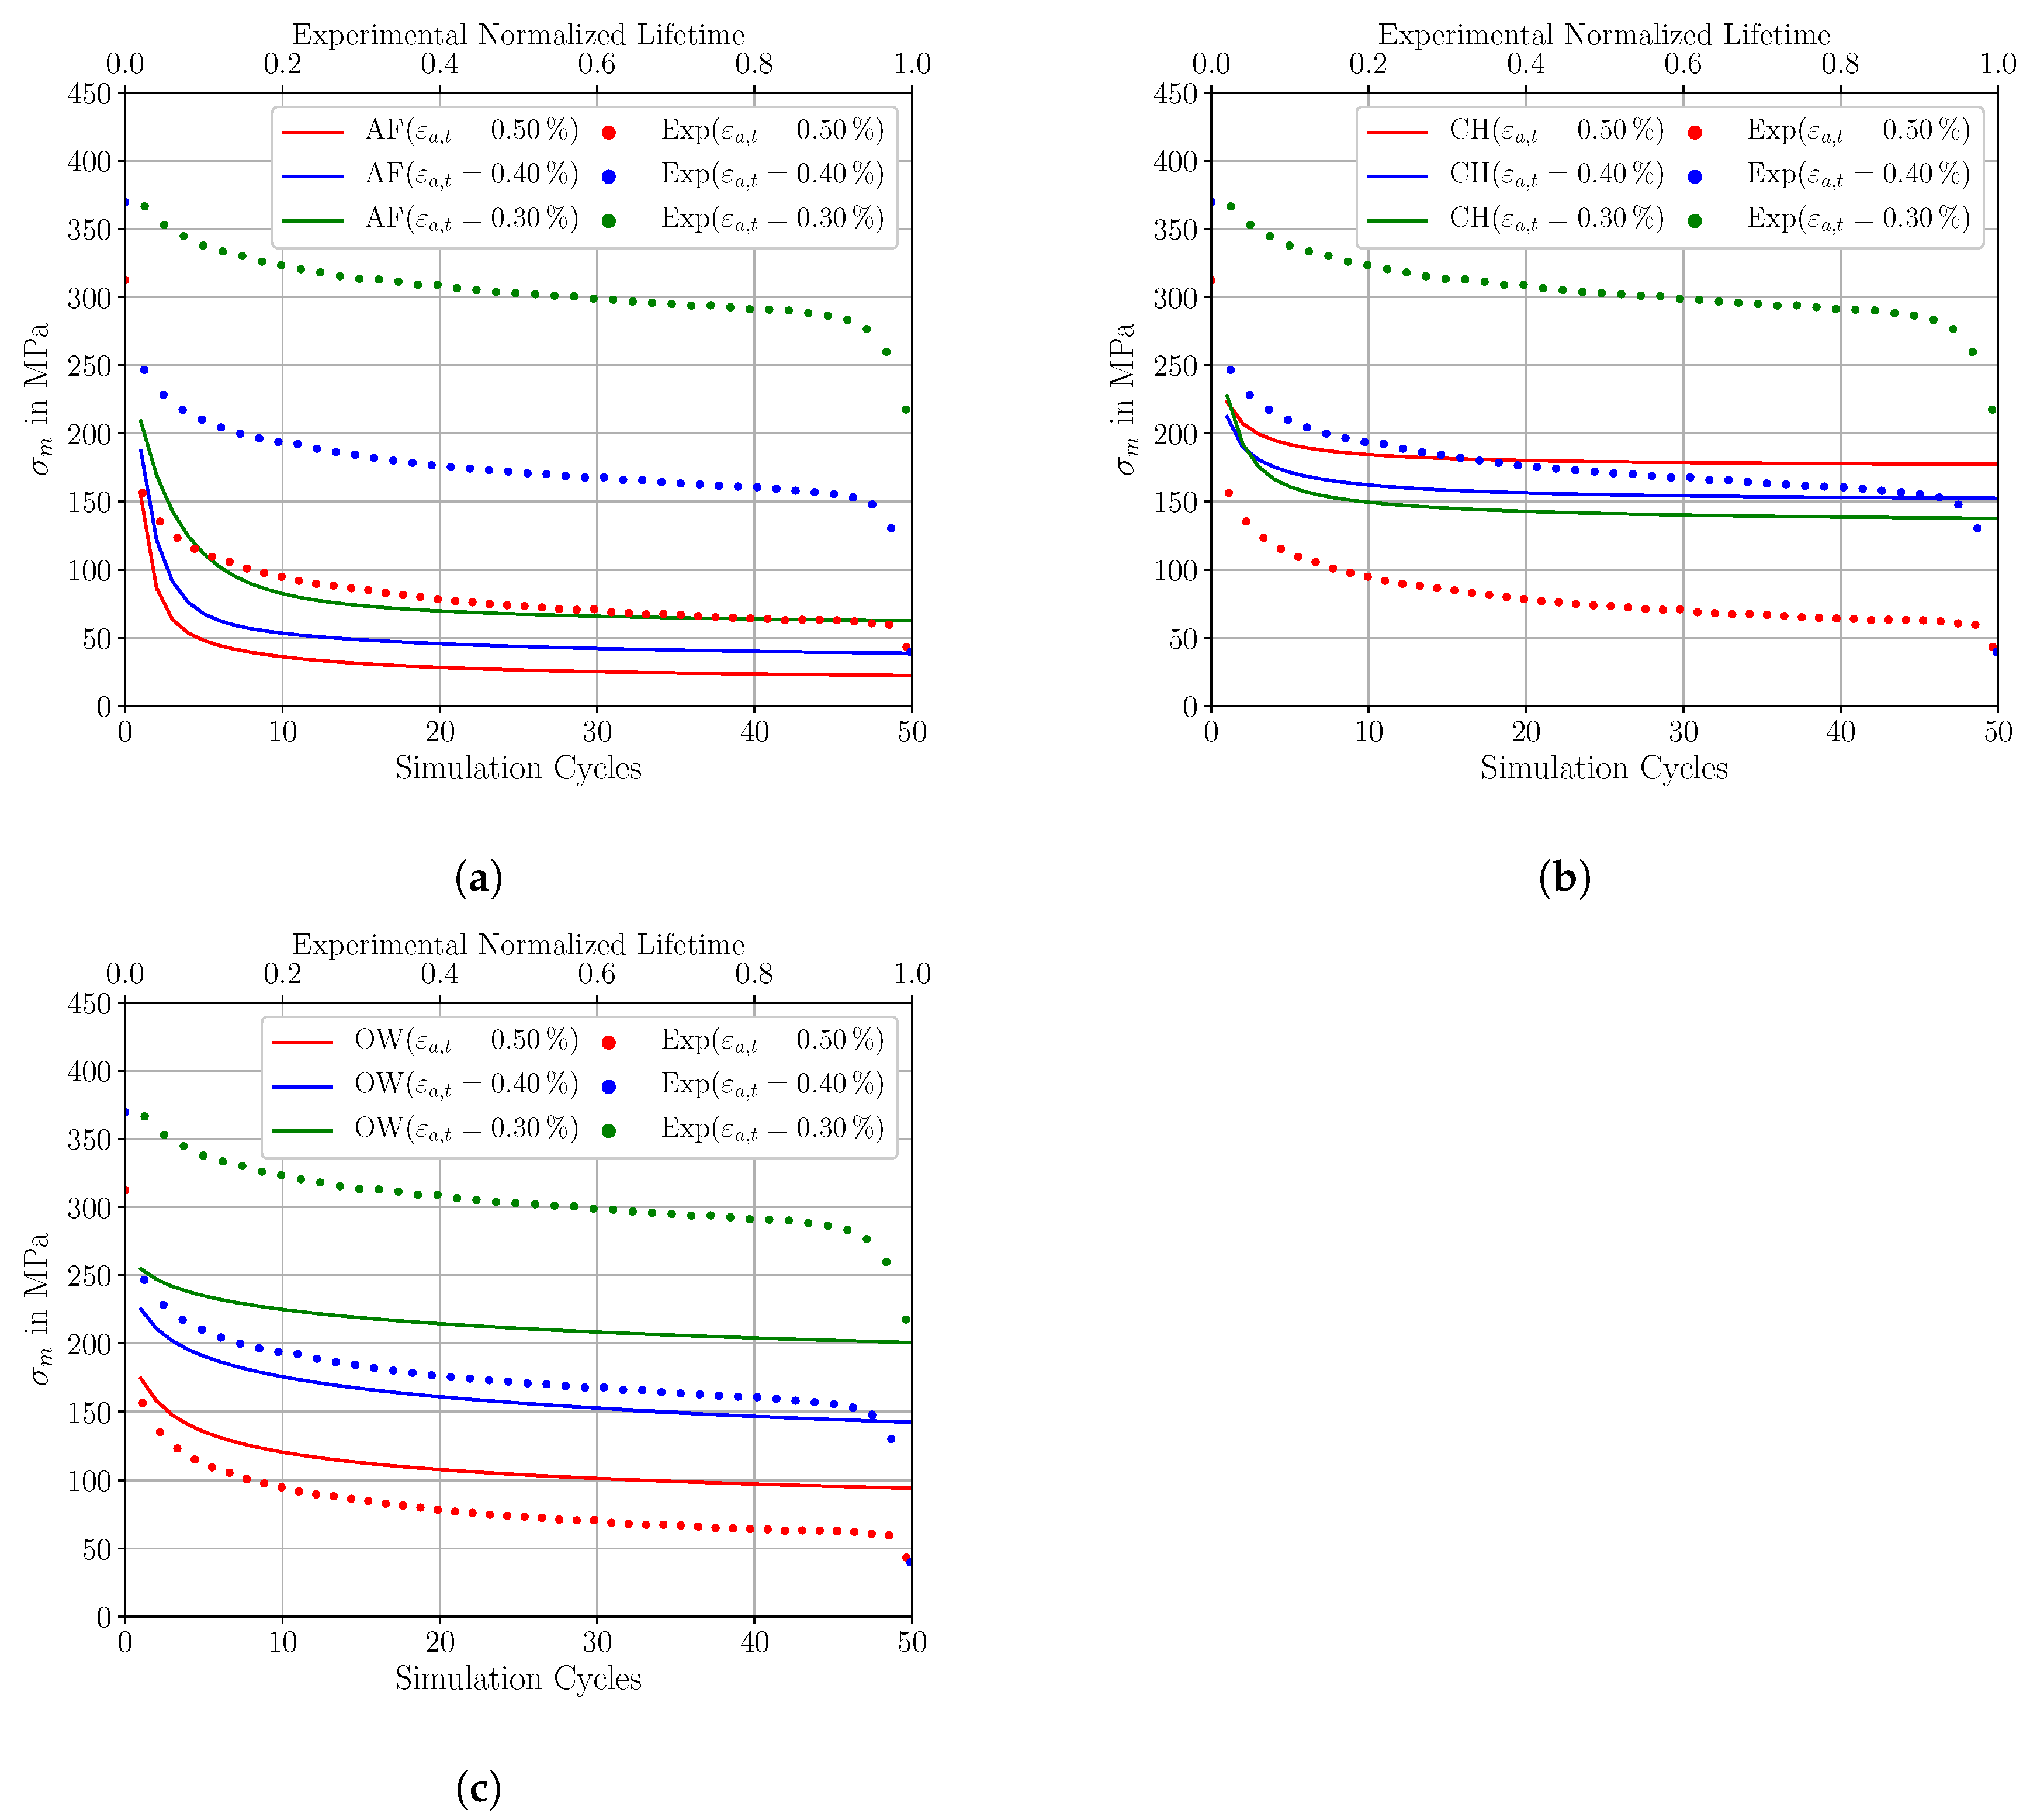
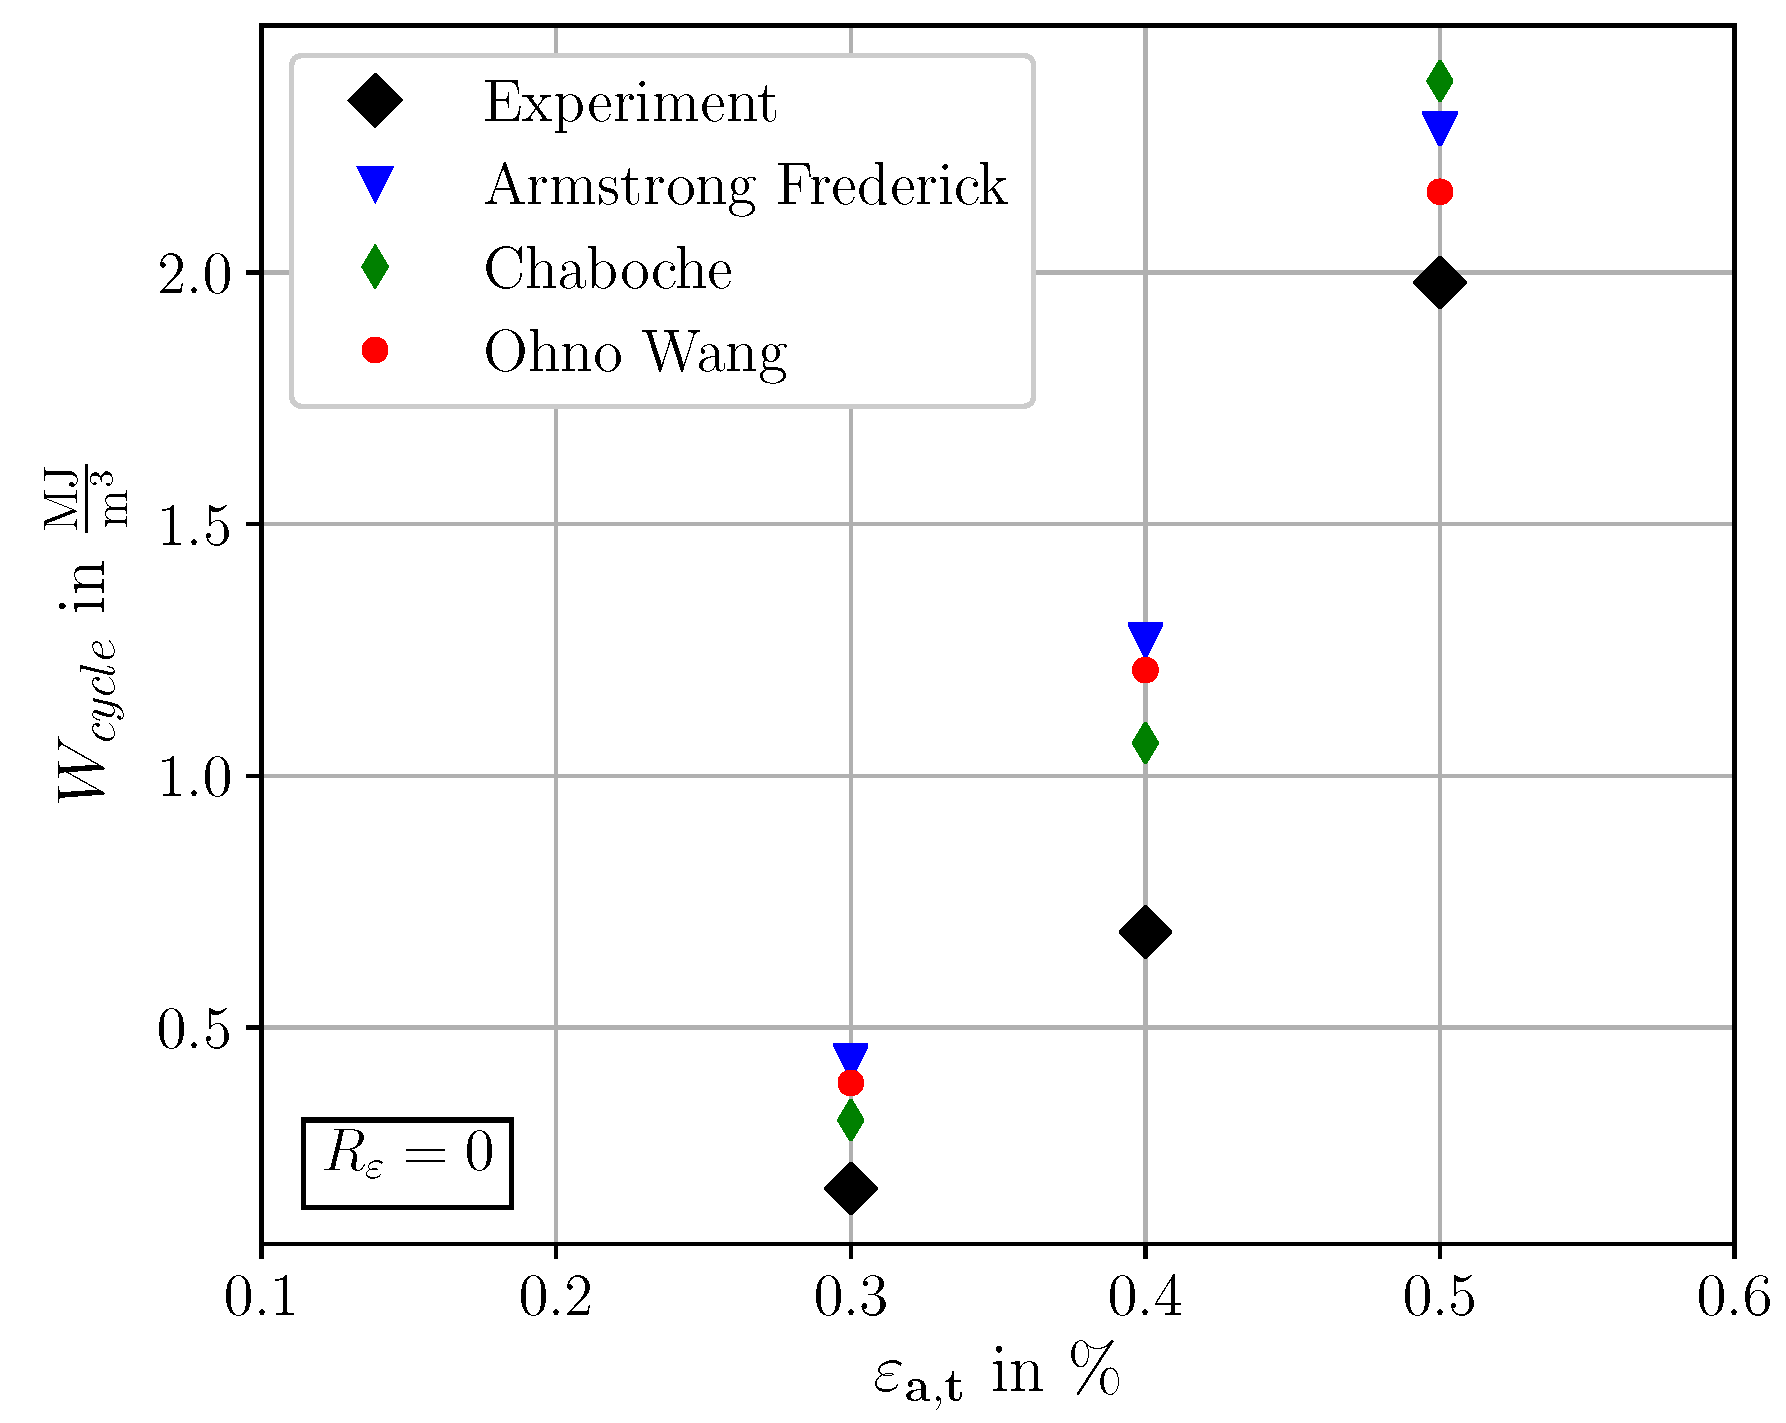
4.3. Cyclic Deformation Behavior at R = 0—KH Model Comparison
5. Conclusions
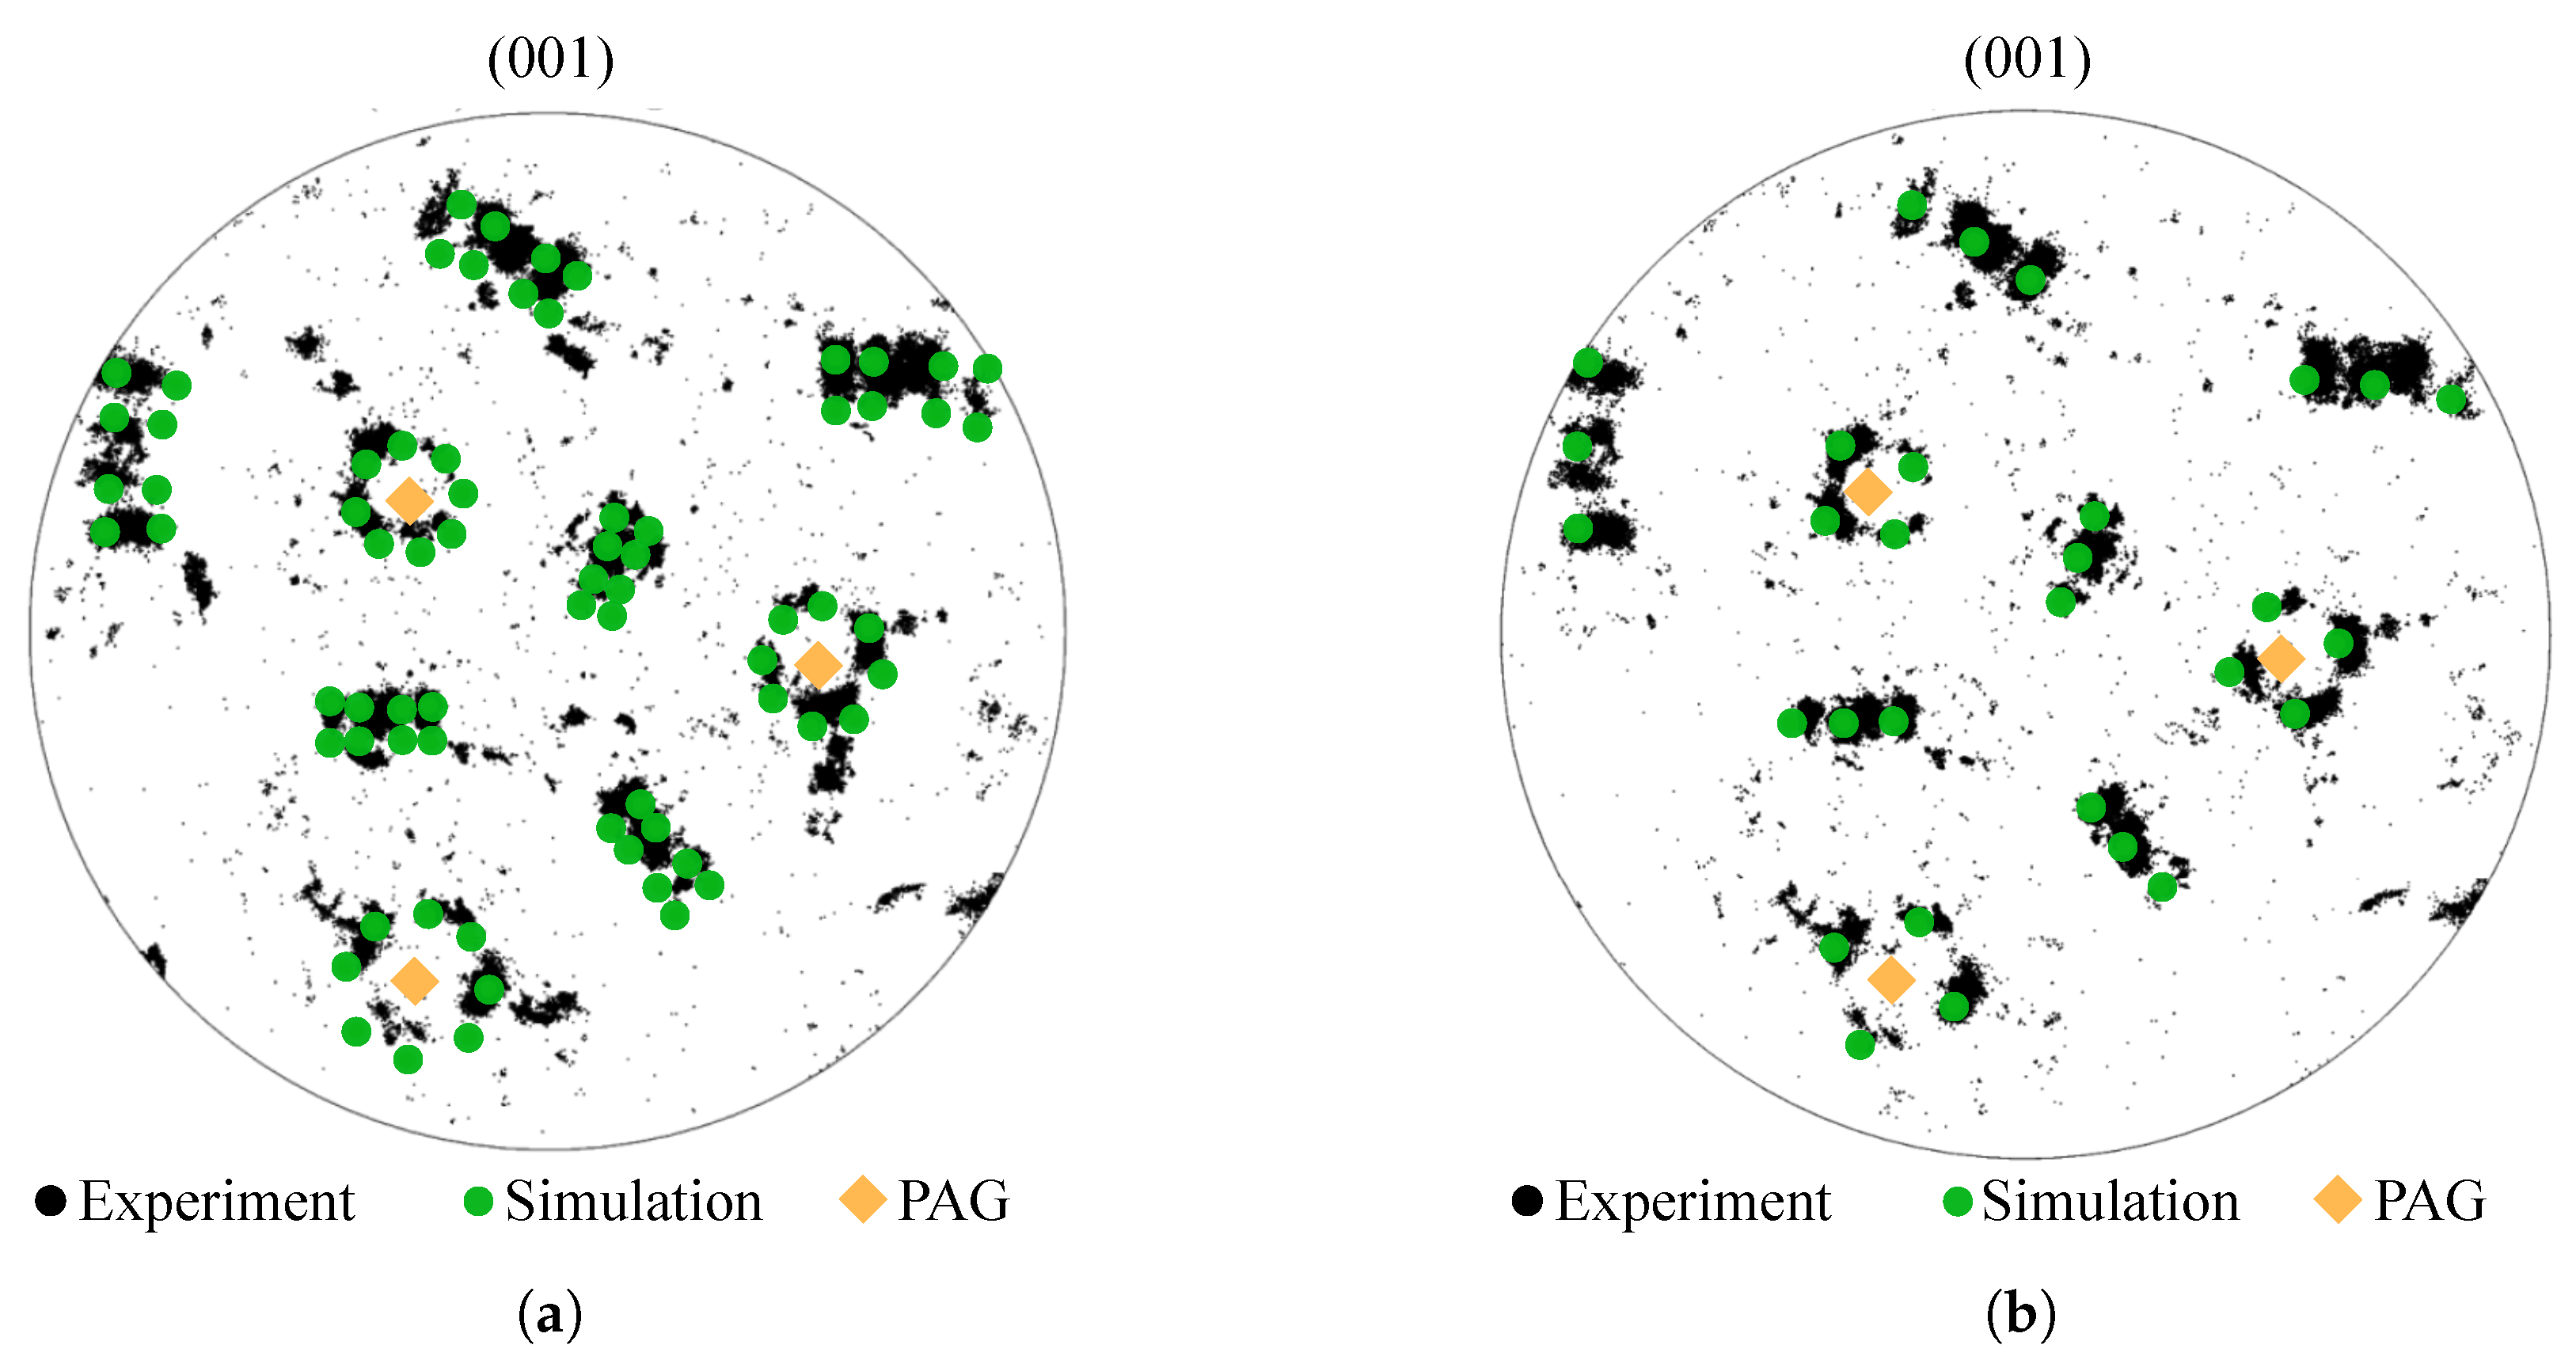
- A comparison of experimental EBSD data and calculated OR indicates that the Nishiyama– Wassermann orientation relationship is well suited for representing the martensitic variants.
- A microstructure model for lath martensite incorporating the Nishiyama–Wassermann orientation relationship is proposed using a multiscale Voronoi tessellation technique.
- A multi-objective calibration procedure for the determination of the cyclic crystal plasticity constitutive parameters based on experimental LCF data is proposed. Thereby, a simplified numerical efficient RVE is used for the combined sensitivity analysis and the subsequent genetic algorithm. The simplified RVE shows macroscopically an almost equivalent stress-strain behavior than the most complex proposed martensitic RVE with deviations smaller than 1.0%.
- For fully reversed loadings (R = −1), the OW model shows an excellent agreement to experimental data, in particular for small applied total strain amplitudes. The agreement of the AF and Chaboche model to the experimental data are adequate, but with increasing errors. Consequently, the OW model is superior to the AF and Chaboche model for all applied total strain amplitudes, except for = 0.90% where the Chaboche model agrees better to experimental data than the OW model.
- Simulations of the KH model dependent mean stress relaxation behavior for (R = 0) indicate that the AF model is not able to capture mean stress effects. The mean stress relaxation predicted by the Chaboche model shows a non-consistent characteristic due to high mean stresses for large applied strain amplitudes and small mean stresses for small applied strain amplitudes. The OW model shows a good agreement to the experimental stress-strain hystereses at R = 0. Furthermore, the predicted mean stress relaxation characteristic by the OW model agrees well with the experimental characteristic with small deviations.
Author Contributions
Funding
Conflicts of Interest
References
- Kitahara, H.; Ueji, R.; Tsuji, N.; Minamino, Y. Crystallographic features of lath martensite in low-carbon steel. Acta Mater. 2006, 54, 1279–1288. [Google Scholar] [CrossRef]
- Krauss, G. Martensite in steel: Strength and Structure. Mater. Sci. Eng. A 1999, 273–275, 40–57. [Google Scholar] [CrossRef]
- Stephens, R.I.; Fatemi, A.; Stephens, R.R.; Fuchs, H. Metal Fatigue in Engineering, 2nd ed.; John Wiley & Sons, Inc.: Hoboken, NJ, USA, 2001. [Google Scholar]
- Shijve, J. Fatigue of Structures and Materials, 2nd ed.; Springer: Dordrecht, The Netherlands, 2009. [Google Scholar]
- Morito, S.; Tanaka, H.; Konishi, R.; Furuhara, T.; Maki, T. The morphology and crystallography of lath martensite in Fe-C alloys. Acta Mater. 2003, 51, 1789–1799. [Google Scholar] [CrossRef]
- Kitahara, H.; Ueji, R.; Ueda, M.; Tsuji, N.; Minamino, Y. Crystallographic analysis of plate martensite in Fe–28.5 at. % Ni by FE-SEM/EBSD. Mater. Charact. 2005, 54, 378–386. [Google Scholar] [CrossRef]
- Morito, S.; Huang, X.; Furuhara, T.; Maki, T.; Hansen, N. The morphology and crystallography of lath martensite in alloy steels. Acta Mater. 2006, 54, 5323–5331. [Google Scholar] [CrossRef]
- Morito, S.; Yoshida, H.; Maki, T.; Huang, X. Effect of block size on the strength of lath martensite in low carbon steels. Mater. Sci. Eng. A 2006, 438–440, 237–240. [Google Scholar] [CrossRef]
- Swarr, T.; Krauss, G. The effect of structure on the deformation of as-quenched and tempered martensite in an Fe-0.2 % C-alloy. Metall. Trans. A 1976, 7, 41–48. [Google Scholar] [CrossRef]
- McDowell, D.; Dunne, F. Microstructure-sensitive computational modeling of fatigue crack formation. Int. J. Fatigue 2010, 32, 1521–1542. [Google Scholar] [CrossRef]
- Cruzado, A.; Gan, B.; Jiménez, M.; Barba, D.; Ostolaza, K.; Linaza, A.; Molina-Aldareguia, J.; Llorca, J.; Segurado, J. Multiscale modeling of the mechanical behavior of IN718 superalloy based on micropillar compression and computational homogenization. Acta Mater. 2015, 98, 242–253. [Google Scholar] [CrossRef]
- Wu, B.; Vajragupta, N.; Lian, J.; Hangen, U.; Wechsuwanmanee, P.; Münstermann, S. Prediction of plasticity and damage initiation behaviour of C45E+N steel by micromechanical modelling. Mater. Des. 2017, 121, 154–166. [Google Scholar] [CrossRef]
- Boeff, M.; Hassan, H.U.; Hartmaier, A. Micromechanical modeling of fatigue crack initiation in polycrystals. J. Mater. Res. 2017, 32, 4375–4386. [Google Scholar] [CrossRef]
- Ghassemi-Armaki, H.; Chen, P.; Bhat, S.; Sadagopan, S.; Kumar, S.; Bower, A. Microscale-calibrated modeling of the deformation response of low-carbon martensite. Acta Mater. 2013, 61, 3640–3652. [Google Scholar] [CrossRef]
- Altendorf, H.; Latourte, F.; Jeulin, D.; Faessel, M.; Saintoyant, L. 3D Reconstruction of a multiscale microstructure by anisotropic tessellation models. Image Anal. Stereol. 2014, 33, 121–130. [Google Scholar] [CrossRef]
- Sun, F.; Meade, E.D.; Dowd, N.P.O. Microscale modelling of the deformation of a martensitic steel using the Voronoi tessellation method. J. Mech. Phys. Solids 2018, 113, 35–55. [Google Scholar] [CrossRef]
- Hennessey, C.; Castelluccio, G.M.; McDowell, D.L. Sensitivity of polycrystal plasticity to slip system kinematic hardening laws for Al 7075-T6. Mater. Sci. Eng. A 2017, 687, 241–248. [Google Scholar] [CrossRef]
- Bari, S.; Hassan, T. Anatomy of coupled constitutive models for ratcheting simulation. Int. J. Plast. 2000, 16, 381–409. [Google Scholar] [CrossRef]
- Ohno, N.; Wang, J.D. Kinematic hardening rules with critical state of dynamic recovery, part I: Formulation and basic features for ratchetting behavior. Int. J. Plast. 1993, 9, 375–390. [Google Scholar] [CrossRef]
- Cruzado, A.; LLorca, J.; Segurado, J. Modeling cyclic deformation of inconel 718 superalloy by means of crystal plasticity and computational homogenization. Int. J. Solids Struct. 2017, 122–123, 148–161. [Google Scholar] [CrossRef]
- Sweeney, C.A.; Brien, B.O.; McHugh, P.E.; Leen, S.B. Experimental characterisation for micromechanical modelling of CoCr stent fatigue. Biomaterials 2014, 35, 36–48. [Google Scholar] [CrossRef] [PubMed]
- Herrera-Solaz, V.; Segurado, J.; LLorca, J. On the robustness of an inverse optimization approach based on the Levenberg–Marquardt method for the mechanical behavior of polycrystals. Eur. J. Mech. A Solids 2015, 53, 220–228. [Google Scholar] [CrossRef]
- Prithivirajan, V.; Sangid, M.D. The role of defects and critical pore size analysis in the fatigue response of additively manufactured IN718 via crystal plasticity. Mater. Des. 2018, 150, 139–153. [Google Scholar] [CrossRef]
- Xie, C.L.; Gosh, S.; Groeber, M. Modeling Cyclic Deformation of HSLA Steels Using Crystal Plasticity. J. Eng. Mater. Technol. 2004, 126, 339–352. [Google Scholar] [CrossRef]
- Krupp, U. Fatigue Crack Propagation in Metals and Alloys: Microstructural Aspects and Modelling Concepts; Wiley-VCH: Weinheim, Germany, 2007. [Google Scholar]
- Bain, E.C. The nature of martensite. Trans. Metall. Soc. AIME 1924, 70, 25–46. [Google Scholar]
- Kurdjumov, G.; Sachs, G. Über den Mechanismus der Stahlhärtung. Zeitschrift für Physik 1930, 64, 325–340. [Google Scholar] [CrossRef]
- Greninger, A.; Troiano, A. The mechanism of martensite formation. Trans. Metall. Soc. AIME 1949, 185, 590–598. [Google Scholar] [CrossRef]
- Nishiyama, Z. X-ray investigation of the mechanism of the transformation from face-centred cubic lattice to body-centred cubic. Sci. Rep. Tohoku Imp. Univ. Ser. 1 Math. Phys. Chem. 1934, 23, 637–664. [Google Scholar]
- Wassermann, G. Über den Mechanismus der alpha-gamma Umwandlung des Eisens. In Mitteilungen aus dem Kaiser-Wilhelm-Institut für Eisenforschung zu Düsseldorf; Verlag Stahleisen: Düsseldorf, Germany, 1935. [Google Scholar]
- Suikkanen, P.P.; Cayron, C.; DeArdo, A.J.; Karjalainen, L.P. Crystallographic Analysis of Martensite in 0.2C-2.0Mn-1.5Si-0.6Cr Steel using EBSD. J. Mater. Sci. Technol. 2011, 27, 920–930. [Google Scholar] [CrossRef]
- Bachmann, F.; Hielscher, R.; Schaeben, H. Texture Analysis with MTEX—Free and Open Source Software Toolbox. Solid State Phenom. 2010, 160, 63–68. [Google Scholar] [CrossRef]
- Cayron, C. ARPGE: A computer program to automatically reconstruct the parent grains from electron backscatter diffraction data. J. Appl. Crystallogr. 2007, 40, 1183–1188. [Google Scholar] [CrossRef] [PubMed]
- Gillner, K.; Münstermann, S. Numerically predicted high cycle fatigue properties through representative volume elements of the microstructure. Int. J. Fatigue 2017, 105, 219–234. [Google Scholar] [CrossRef]
- E606/E606M-12, A. Standard Test Method for Strain-Controlled Fatigue Testing; ASTM International: West Conshohocken, PA, USA, 2012. [Google Scholar]
- Christ, H.J. Wechselverformung von Metallen; Springer: Berlin/Heidelberg, Germany, 1990. [Google Scholar]
- Totten, G.; Howes, M.; Inoue, T. (Eds.) Handbook of Residual Stress and Deformation of Steel, 1st ed.; ASM International: Materials Park, OH, USA, 2002. [Google Scholar]
- Wehner, T.; Fatemi, A. Effects of mean stress on fatigue behaviour of a hardened carbon steel. Int. J. Fatigue 1991, 13, 241–248. [Google Scholar] [CrossRef]
- Wu, D.L.; Xuan, F.Z.; Guo, S.J.; Zhao, P. Uniaxial mean stress relaxation of 9–12% Cr steel at high temperature: Experiments and viscoplastic constitutive modeling. Int. J. Plast. 2016, 77, 156–173. [Google Scholar] [CrossRef]
- Koh, S.K.; Stephens, R.I. Mean stress effects on low cycle fatigue for a high strength steel. Fatigue Fract. Eng. Mater. Struct. 1991, 14, 413–428. [Google Scholar] [CrossRef]
- Rycroft, C.H. Voro++: A Three-Dimensional Voronoi Cell Library in C++. Available online: http://math.lbl.gov/voro++/ (accessed on 1 February 2018).
- Engler, O.; Randle, V. Introduction to Texture Analysis: Macrotexture, Microtexture, and Orientation Mapping, 2nd ed.; CRC Press: Boca Raton, FL, USA, 2009. [Google Scholar]
- Smit, R.; Brekelmans, W.; Meijer, H. Prediction of the mechanical behavior of nonlinear heterogeneous systems by multi-level finite element modeling. Comput. Methods Appl. Mech. Eng. 1998, 155, 181–192. [Google Scholar] [CrossRef]
- Roters, F.; Eisenlohr, P.; Hantcherli, L.; Tjahjanto, D.; Bieler, T.; Raabe, D. Overview of constitutive laws, kinematics, homogenization and multiscale methods in crystal plasticity finite-element modeling: Theory, experiments, applications. Acta Mater. 2010, 58, 1152–1211. [Google Scholar] [CrossRef]
- Hall, E.O. The Deformation and Ageing of Mild Steel: II Characteristics of the Lüders Deformation. Proc. Phys. Soc. Sect. B 1951, 64, 742. [Google Scholar] [CrossRef]
- Petch, N.J. The Cleavage Strength of Polycrystals. J. Iron Steel Inst. 1953, 174, 25–28. [Google Scholar]
- Peirce, D.; Asaro, R.; Needleman, A. Material rate dependence and localized deformation in crystalline solids. Acta Metall. 1983, 31, 1951–1976. [Google Scholar] [CrossRef]
- Meissonnier, F.; Busso, E.; O’Dowd, N. Finite element implementation of a generalised non-local rate-dependent crystallographic formulation for finite strains. Int. J. Plast. 2001, 17, 601–640. [Google Scholar] [CrossRef]
- Rice, J. Inelastic constitutive relations for solids: An internal-variable theory and its application to metal plasticity. J. Mech. Phys. Solids 1971, 19, 433–455. [Google Scholar] [CrossRef]
- Hutchinson, J.W. Bounds and self-consistent estimates for creep of polycrystalline materials. Proc. R. Soc. Lond. A Math. Phys. Eng. Sci. 1976, 348, 101–127. [Google Scholar] [CrossRef]
- Cailletaud, G. A micromechanical approach to inelastic behaviour of metals. Int. J. Plast. 1992, 8, 55–73. [Google Scholar] [CrossRef]
- Frederick, C.; Armstrong, P. A Mathematical Representation of the Multiaxial Bauschinger Effect; Technical report, Berkeley Nuclear Laboratories—CEGB Report RD/B/N731; Berkeley Nuclear Laboratories: Berkeley, CA, USA, 1966. [Google Scholar]
- Prager, W. Recent Developments in the Mathematical Theory of Plasticity. J. Appl. Phys. 1949, 20, 235–241. [Google Scholar] [CrossRef]
- Chaboche, J.L.; Dang, K.; Cordier, G. Modelization of the strain memory effect on the cyclic hardening of 316 stainless steel. Struct. Mech. React. Technol. 1979, 12, 1–10. [Google Scholar]
- Chaboche, J. A review of some plasticity and viscoplasticity constitutive theories. Int. J. Plast. 2008, 24, 1642–1693. [Google Scholar] [CrossRef]
- Herrera-Solaz, V.; LLorca, J.; Dogan, E.; Karaman, I.; Segurado, J. An inverse optimization strategy to determine single crystal mechanical behavior from polycrystal tests: Application to AZ31 Mg alloy. Int. J. Plast. 2014, 57, 1–15. [Google Scholar] [CrossRef]
- Segurado, J.; Llorca, J. Simulation of the deformation of polycrystalline nanostructured Ti by computational homogenization. Comput. Mater. Sci. 2013, 76, 3–11. [Google Scholar] [CrossRef]
- Schmid, S. Untersuchungen zum Ermüdungsverhalten von mittel- und hochfesten Stählen bei sehr hohen Lastspielzahlen unter Berücksichtigung von Schwingungsrisskorrosion infolge moderner Biokraftstoffe. Ph.D. Thesis, University Bremen, Bremen, Germany, 2013. [Google Scholar]
- Dynardo GmbH. optiSLang—The Optimizing Structural Language, version 6.2.0; Dynardo GmbH: Weimar, Germany, 2018.
- Konak, A.; Coit, D.W.; Smith, A.E. Multi-objective optimization using genetic algorithms: A tutorial. Reliab. Eng. Syst. Saf. 2006, 91, 992–1007. [Google Scholar] [CrossRef]
- McKay, M.D.; Beckman, R.J.; Conover, W.J. Comparison of Three Methods for Selecting Values of Input Variables in the Analysis of Output from a Computer Code. Technometrics 1979, 21, 239–245. [Google Scholar]
- Zitzler, E.; Laumanns, M.; Thiele, L. SPEA2: Improving the Strength Pareto Evolutionary Algorithm; Technical Report 103; Computer Engineering and Networks Laboratory, Swiss Federal Institute of Technology (ETH): Zürich, Switzerland, 2001; Volume 103. [Google Scholar]
- Zitzler, E.; Thiele, L.; Deb, K. Comparison of Multiobjective Evolutionary Algorithms: Empirical Results. Evol. Comput. 2000, 8, 173–195. [Google Scholar] [CrossRef]
- Harvey, D.P.; Bonenberger, R.J.; Wolla, J.M. Effects of sequential cyclic and monotonic loadings on damage accumulation in nickel 270. Int. J. Fatigue 1998, 20, 291–300. [Google Scholar] [CrossRef]
- Ellyin, F.; Golos, K. Multiaxial Fatigue Damage Criterion. J. Eng. Mater. Technol. 1988, 110, 63–68. [Google Scholar] [CrossRef]
- Landgraf, R.W.; Chernenkoff, R.A. Residual Stress Effects on Fatigue of Surface Processed Steels. In Analytical and Experimental Methods for Residual Stress Effects in Fatigue; ASTM STP 1004; ASTM: West Conshohocken, PA, USA, 1988; pp. 1–12. [Google Scholar]


| Material | C | Si | Mn | P | S | Cr | Mo |
|---|---|---|---|---|---|---|---|
| SAE 4150 | 0.52 | 0.26 | 0.74 | 0.014 | 0.008 | 1.31 | 0.18 |
| Orientation Relationship | Plane Parallel | Direction Parallel |
|---|---|---|
| Kurdjumov–Sachs | // | |
| Nishiyama–Wassermann | // |
| 253.1 GPa | 132.4 GPa | 75.8 GPa |
| Armstrong Frederick (AF) | Chaboche (CH) | Ohno–Wang (OW) | |
|---|---|---|---|
| 187 MPa | 155 MPa | 209 MPa | |
| 79,397 MPa | 254,385 MPa | 65,506 MPa | |
| 491 | 2636 | 499 | |
| - | 90,000 MPa | - | |
| - | 8547 | - | |
| - | 20,303 MPa | - | |
| - | 0 | - | |
| M | - | - | 8 |
© 2019 by the authors. Licensee MDPI, Basel, Switzerland. This article is an open access article distributed under the terms and conditions of the Creative Commons Attribution (CC BY) license (http://creativecommons.org/licenses/by/4.0/).
Share and Cite
Schäfer, B.J.; Song, X.; Sonnweber-Ribic, P.; ul Hassan, H.; Hartmaier, A. Micromechanical Modelling of the Cyclic Deformation Behavior of Martensitic SAE 4150—A Comparison of Different Kinematic Hardening Models. Metals 2019, 9, 368. https://doi.org/10.3390/met9030368
Schäfer BJ, Song X, Sonnweber-Ribic P, ul Hassan H, Hartmaier A. Micromechanical Modelling of the Cyclic Deformation Behavior of Martensitic SAE 4150—A Comparison of Different Kinematic Hardening Models. Metals. 2019; 9(3):368. https://doi.org/10.3390/met9030368
Chicago/Turabian StyleSchäfer, Benjamin J., Xiaochen Song, Petra Sonnweber-Ribic, Hamad ul Hassan, and Alexander Hartmaier. 2019. "Micromechanical Modelling of the Cyclic Deformation Behavior of Martensitic SAE 4150—A Comparison of Different Kinematic Hardening Models" Metals 9, no. 3: 368. https://doi.org/10.3390/met9030368
APA StyleSchäfer, B. J., Song, X., Sonnweber-Ribic, P., ul Hassan, H., & Hartmaier, A. (2019). Micromechanical Modelling of the Cyclic Deformation Behavior of Martensitic SAE 4150—A Comparison of Different Kinematic Hardening Models. Metals, 9(3), 368. https://doi.org/10.3390/met9030368