Communication

Properties of NiTi Shape Memory Alloy Micro-Foils Obtained by Pulsed-Current Sintering of Ni/Ti Foils

1
Department of Solid State Physics, Faculty of Physics and Applied Computer Science, AGH University of Science and Technology, Al. Mickiewicza 30, 30-059 Krakow, Poland
2
Department of Engineering Science and Mechanics, Shibaura Institute of Technology, 3-7-5 Toyosu, Koto-ku, Tokyo 135-8548, Japan
3
Faculty of Metals Engineering and Industrial Computer Science, AGH University of Science and Technology, Al. Mickiewicza 30, 30-059 Krakow, Poland
*
Author to whom correspondence should be addressed.
Metals 2019, 9(3), 323; https://doi.org/10.3390/met9030323
Submission received: 30 January 2019 / Revised: 5 March 2019 / Accepted: 8 March 2019 / Published: 13 March 2019

Abstract

:
Successful one-step manufacturing of micro-foils of NiTi shape memory compound by pulsed-current sintering of nickel and titanium is reported. Sandwich-like starting configurations of Ni/Ti/Ni (ST1, ST4), Ti/Ni/Ti (ST3), and a simple Ni/Ti (ST2) one, were used. XRD and differential scanning calorimetry (DSC) measurements revealed multistep martensitic transformation, much more pronounced for ST1 than for ST2 and ST3. SEM/energy dispersive X-ray spectrometer (EDS) measurements showed the predominant NiTi phase in ST1, ST4, and other intermetallic compounds in addition to it, for ST2 and ST3. The temperature dependence of the electrical resistance for ST4 shows a peak corresponding to the R-phase and a high residual resistivity. The shape memory effect of 100% was obtained for ST1 and ST4, with the temperature range of its recovery dependent on the initial strain. The ST2 and ST3 materials revealed brittleness and a lack of plasticity due to the dominancy of the austenite phase and/or the intermetallic compound content.

1. Introduction

Ni-Ti alloys have been a subject of interest to many scientists and engineers in the world. Their extraordinary properties (e.g., super-elasticity and shape memory effect (SME) of the NiTi compound) have found applications in many areas of industry [1,2,3]. SME originates in them from the martensitic and the reverse martensitic transformations due to external stress and thermal treatment (martensite, B19’ monoclinic phase ↔ austenite, B2 cubic phase) [4]. Between the B19’ and the B2 phases, a rhombohedral R phase can also appear for alloys due to different physical parameters (e.g., thermal processing and Ni4Ti3 particles appearance) [5]. The demanding restrictions on the synthesis conditions are one of the main technological problems, where, for example, small content variation can significantly influence transformation properties [6,7]. In alloy production, vacuum melting methods are mainly used, and deposition methods are applied in the case of thin films [8], e.g., magnetron sputtering, pulsed laser deposition (PLD) [9,10], or biased target ion beam deposition (BTIBD) [11]. Sputtering methods are very effective for obtaining thin films of thickness up to few micrometers. Deposition from NiTi target can provide fully crystallized material, and with co-sputtering it is partly crystallized or amorphous. The appropriate heat treatment or additional annealing process have to be included for improvement of the crystallinity. Depending on the initial composition and thermal processing, they can exhibit transition peaks broadening and/or multipeak presence in differential scanning calorimetry (DSC) patterns, revealing a broad or multistep character of the transition [12,13]. Interpretation of such transitions by DSC can be disrupted by the presence of inhomogenous areas with slightly different compositions. It was shown that electrical resistivity measurements are more sensitive for detection of the R-phase in comparison with DSC [14]. Titanium deficiency in the final material can often be a problem, but it can be corrected by co-sputtering with a pure titanium target [13,15,16,17,18].
Gas atmosphere purity during the sputtering process is also an important factor due to a possible creation of oxides [10,19]. For complex structures, the selective laser melting method can be used [20]. Cold rolling with post thermal processing was found to be efficient for foil manufacturing. Laminates consisting of many layers of nickel and titanium (with appropriate proportions) are sealed in a container under vacuum and eventually cold/hot rolled. After that, heat treatment is required to obtain desirable properties [21]. A hot pressing technique was shown to be very effective for obtaining nickel/titanium plates and multilayers of thin films for diffusion bonding purposes [22,23], powder metallurgy [24], and micro-foil/laminate preparation [21,25,26,27,28]. The positive influence of the application of electrical current during synthesis on the NiTi phase creation was reported in [26,27,29]. It was also shown that pulsed direct current has an impact on the recrystallization process after deformation [30]. During annealing, Kirkendall voids are often created close to the material surfaces [31]. It was shown that pressing techniques can be effective not only to assure smooth diffusional interfaces, but also to prevent creation of voids.
The present paper focuses on the possibility of one-step fabrication of NiTi shape memory micro-foils by pulse-current pressure sintering from elemental micro-foils of their lowest number. The materials have been obtained at different experimental conditions and different starting configurations of elemental foils. A thorough characterization of the composition and the crystallographic structure along with temperature dependence of the electrical resistivity has been carried out. The results are presented and discussed with respect to the material parameters and pulse-current pressure sintering conditions used, to draw conclusions on their influence on the final material quality, its shape recovery rate, and the effectiveness of this one-step manufacturing process.

2. Materials and Methods

For the starting materials of pure nickel and titanium metal foils of thicknesses of a few micrometers, their numbers were calculated to fit with the content into the Ni-Ti phase occurrence (based on the phase diagram [7]), i.e., of 49 atom % nickel content. Two different foil configurations were used to test the diffusion effectiveness, possible compound creation, and shape memory effect properties of the materials obtained. The appropriate sets of 1 and 2 μm nickel and 2 and 5 μm titanium foils manufactured by Furuuchi Chemical Co., Ltd. (Tokyo, Japan) with purity of 99.6% were used.
For sintering, the appropriate sets of elemental foils were placed into graphite dies of the pulse-current pressure sintering machine (PLASMAN, S S Alloy Co., Ltd., Hiroshima Prefecture, Japan) between two 1 mm thick tantalum foils, with a protective thin layer of boron nitride sprayed on their outer surfaces. The sintering process was performed at 973 K for 60 min under an uniaxial compression pressure of 13 MPa by current heating, at a low vacuum atmosphere of ~10 Pa. A free increase of the pressure up to 20 MPa was occurring due to thermal expansion, and the pressure was released at 973 K during cooling of the machine. The temperature was measured by a thermocouple placed in the graphite die, next to the sample. Four kinds of samples were prepared. For three of them, the synthesis was controlled by the temperature, and pulsed-current waveform was in the range of high level: 210 amperes, and low level: 190 amperes with 0.5 Hz frequency, 1:1 pulse length ratio, and 10 mm in diameter. They were the ST1: starting from a sandwich-like structure consisting of 3/10/3 μm nickel/titanium/nickel foils, ST2: starting from a structure consisting of 6/10 μm nickel/titanium, and ST3: a sandwich-like structure consisting of 5/6/5 μm titanium/nickel/titanium foils. The fourth one, ST4, starting from 5/16/5 μm nickel/titanium/nickel foils, was prepared by application of the same temperature for 120 min of sintering under uniaxial pressure of 3 MPa (500 amperes, same frequency, 1:1 pulse length ratio, and 20 mm in diameter). As a result, foils of ~15–16 μm thicknesses were obtained after the sintering process for ST1-3 with diameter of 10 mm, and for ST4: ~25–26 μm and 20 mm diameter.
X-ray diffraction (XRD, Siemens d5000 Diffractometer, Siemens, Munich, Germany) measurements of the sintered foils were performed at various temperatures, using CuKα radiation at 40 kV and 40 mA with a molybdenum holder. Measurements were done at the angle range 2θ from 20° to 120° with the step of 0.03°/min, at the temperatures of 300, 333, and 393 K. A scanning electron microscope (SEM, FEI Nova NanoSEM 450, Hillsboro, OR, USA) and JSM-7100F (JEOL Ltd., Tokyo, Japan), equipped with energy dispersive X-ray spectrometer (EDS), and back scattering electron (BSE) detector, was employed for the microstructural characterization. The accelerating voltage of 20 kV was used. Pieces of foil were put between 6 mm fixation clips (Struers GmbH, Willich, Germany) and inserted into graphite resin (KEM 70 Pulver, ATM GMBH, Mammelzen, Germany). After 24 h of curing, the resin holder was ready for the cutting and grinding process, starting from 200 and finishing on 3000 of sandpaper granulation. The last part involved the polishing process: initially with aluminum oxide and finishing with silicon oxide powders. At the end of the process, undesirable pollution was removed from the surface by washing with ethanol and drying.
Thermal analysis was carried out with a DSC-60 Plus Differential Scanning Calorimeter (DSC, Shimadzu Corporation, Kyoto, Japan) in the temperature ranges from 143 to 423 K in argon, at a heating/cooling rate of 10 K/min. The weight of ST1-3 was 1.1 mg, and that of ST4 was 1.4 mg. The shape recovery rate (SRR) was determined from the bending test performed at room temperature, based on [20]. Bending rod diameter was adjusted to the samples’ thickness for the required bending strain. The system consisted of the heater, camera, and container with mineral oil, the sample holder, and a thermometer (placed close to the sample position). Shape recovery (angle change) recorded by a camera placed above the sample and heated to different temperatures in the range from ambient temperature to 393 K. Sample dimensions were 5 × 2 mm, with the thickness of that of the individual sample studied. Temperature was measured by a K-type thermocouple with its working range of 253 to 1473 K and accuracy of ±1 K.
The electrical resistivity of the micro-foils obtained were measured with the Physical Properties Measurement System (PPMS, LOT-QuantumDesign GmbH, Darmstadt, Germany) at the temperature range between 2 and 350 K.
OriginLab (v. 2018 SR1 Academic, OriginLab Corporation, Northampton, MA, USA) software used for data and graphical visualizations, X’Pert HighScore Plus (v. 2.1.0, PANalytical B.V. Almelo, The Netherlands) for XRD patterns analysis, and ImageJ (v. 1.51j8, Wayne Rasband, National Institutes of Health and University of Wisconsin, Bethesda, MD, USA) for image processing.

3. Results and Discussion

XRD patterns obtained at ambient temperature for the ST1–ST3 foils are presented in Figure 1.
Patterns for both sides of the sample ST2 and for the ST3 exhibit differences at room temperature in comparison to ST1, as shown in Figure 1. The ST1 material exhibited the presence of a B19’ NiTi phase. The ST2 pattern corresponding to initial nickel side of the presence of Ni3Ti and B2 NiTi phases, and for the titanium foil side, the presence of a B19’ NiTi phase and Ti2Ni diffraction peaks can be observed. Analysis software also suggests content of Ni2Ti4O phase from the Ti surface, but their positions were very similar to B19’ and Ti2Ni phases. At 26.6 of 2Theta, a peak of BN can be seen, which was a residue after the cleaning process.
XRD patterns obtained at 300 (ambient temperature), 333, and 393 K for the Ni-Ti alloy foil of the sample ST1 are presented in Figure 2a. To test completeness of the recovery with XRD, a sample of the ST1 batch was measured at 300 K, then heated to 373 K, cooled back to 300 K, and measured again. The patterns are presented in Figure 2b.
Diffraction peaks corresponding to the martensite and austenite phases were observed. Their relative intensities strongly change with temperature, revealing the occurrence of the martensitic and the reverse martensitic transformation. The austenite peaks grow with increasing temperature, whereas an opposite tendency is seen for the martensitic phase.
Figure 3 presents the DSC results for the Ni-Ti alloy micro-foils obtained during heating and cooling down. The XRD and DSC results show for the ST1 alloy micro-foil (obtained from the Ni/Ti/Ni “sandwich”) a considerable thermal hysteresis of the structural transformation. A smaller hysteresis was observed for the samples ST2 and ST3 (obtained from simple Ni/Ti and “sandwich” Ti/Ni/Ti configurations, respectively), which also show much weaker transformation peaks. The heating curve for the ST1 sample shows the occurrence of the reverse martensitic transition manifested in broad endothermic peaks with an austenite start/finish at ~333/378 K and an exothermic one with a martensite start/finish transformation at ~343/306 K. Two separate peaks can be distinguished during heating and they are attributed to the presence of inhomogeneities. During cooling three peaks were present, which were respectively attributed to the transition from austenite to the R-phase, and others to inhomogeneities. Based on the literature, the R-phase creation during transformation can be attributed to the Ni4Ti3 particles’ presence for the high nickel [32,33,34] and Ti2Ni for the high titanium alloys [35,36]. The reverse transition was reflected on cooling down, where more than one peak was observed. A similar effect was observed during the NiTi ageing process [32,34,35]. It could also be caused by the presence of multi-compositions of NiTi, slightly differing in their transformation temperatures.
SEM images presented in Figure 4 show smooth cross-section surfaces of the foils. EDS measurements were taken at the points marked with red numbers, starting from the upper surface to the lower one, for (a) ST2, (b) ST1, and (c) ST3 samples.
For the Ni/Ti configuration, as shown in Figure 4a, an uncompleted diffusion process can be observed. Phases with higher content of nickel show up as brighter areas, and titanium richer—as darker. From the top of the image almost pure titanium can be seen, then Ti2Ni (~2.4 μm), NiTi (rich in titanium and further in nickel, ~10.5 μm in total), and Ni3Ti (~3–4 μm) at the opposite surface. The SEM image shows a fine, dendritic-like microstructure in the region of the NiTi phase, developing towards the Ni side. The titanium side is characterized mainly by a rough boundary of this phase and the Ti-rich phase (possibly Ti2Ni), extending between points 2 and 3. The latter shows elongated forms perpendicular to the sample surface towards residual Ti, similarly to those reported in [27,37]. It is worth noting that the better homogenized NiTi region is located at the Ni3Ti phase—in the initial nickel zone.
The Ni/Ti/Ni configuration, as shown in Figure 4b, shows a significant difference in comparison with the Ni/Ti one. Diffusion occurred in the whole volume, with some inhomogeneities which were closer to both surfaces (points 2 and 5) here. The central part of the material is well diffused (about 50:50 atom % Ti:Ni), which was similar to the Ni/Ti configuration, but the difference in the elemental compositions between their boundary points was smaller for the Ni/Ti/Ni one. Closer to the surfaces, a slight increase of titanium content was observed (although remaining below 60 atom %). The microstructure shows an increase of titanium-rich inclusions area along both surfaces. In the middle, Kirkendall voids can be seen (examples are marked by arrows in Figure 4b,c). In the diffusion process, the last undiffused phase in such a configuration is Ti2Ni, which was close to the composition of the observed inclusions.
For the Ti/Ni/Ti “sandwich”, the diffusion occurred also in the whole material volume. Higher titanium content was found closer to the surfaces and small elemental content variations around the 50:50 atom %, occurring in the center, as shown in Figure 4c. The material shows different microstructure in comparison with the previous types. It was similar to that in the NiTi area from the Ni/Ti configuration, close to the titanium surface. Also, small Kirkendall voids appearing in characteristic rows parallel to the sample surfaces can be observed (next to points 3 and 4). At both sample surfaces, a Ti-rich phase was found. At the center, some undiffused Ni-rich areas (64 atom % Ni) can be seen, as shown in Figure 5. The image denoted as (a) shows the final steps of Ni3Ti area decomposition with diffusion progress into a visible Ni-rich area and, finally, into NiTi. The image (b), of a higher magnification, shows the presence of small elongated particles—Ni-rich particles (light grey color) in the NiTi matrix with a diameter of 0.1 μm and a length of ~0.5–1.3 μm. Closer to the surfaces, a collection of Ti-rich (dark grey color) particles of different sizes between NiTi phase dendrites can be seen. With respect to their shape, these particles are very similar to those of the Ni4Ti3 phase obtained upon annealing of the Ni-Ti nickel-rich compound [38,39] and with powder sintering [40]. Also, external stress may lead to similar behavior [41]. Lighter areas can also be seen in the region of NiTi dendrites and, based on the Ni-Ti phase diagram [7], such particles can be identified as Ni3Ti phase or, according to the study [40], as Ni4Ti3. This illustrates a transformation of Ni3Ti compound to the NiTi phase, by its disintegration into smaller elongated particles, which further were transformed into the NiTi phase. In a closer look, some similarities of their shape to NiTi dendritic structure can be noted. Due to the NiTi phase growth, the Ni-rich phase content lowers [27].
It is considered that during the diffusion process, due to a concentration gradient, titanium from the Ti-rich phase diffuses into the Ni-rich phase. Nickel diffusion occurs predominantly in the opposite direction, from the nickel-rich dendrites, which then transform into the NiTi phase. The diffusion and elemental mixing result in the appearance of needle-like particles as can be seen in the SEM image. External pressure creates stress, which additionally influences the process. It is worth noting, that the lowest melting point (~1215 K) in the Ni-Ti phase diagram occurs in the Ti-Ti2Ni phase area [42]. The next eutectic point is in the NiTi-Ni3Ti zone—at ~1391 K [42]. Thus, at an elevated temperature of the sintering process, the diffusion within those phases would be very effective. Having in mind their beneficial thermodynamic parameters [27], this may explain why the Ti2Ni and Ni3Ti phases were initially formed, and finally, why the NiTi phase was created in such a synthesis process.
Comparing SEM and EDS results of Ni/Ti/Ni and Ti/Ni/Ti configurations, it can be seen that the difference between them is dendritic structure for the latter and Ti-rich inclusions for the former. Dendritic-like patterns were observed mainly at the Ti-sides of the Ti/Ni/Ti and Ni/Ti configurations, and the contrast variations indicate local content inhomogeneities at the scale of dendrite size. This shows that a better homogenization of the NiTi phase was obtained for the Ni/Ti/Ni configuration. A possible explanation of the effect can be the fact, that in such a geometry of pulsed-current synthesis, where sintered foils are in series for the current flow, the Joule heat is an order of magnitude higher in the Ti layer than in the Ni layer, due to much higher Ti resistivity. At the same sintering parameters used, the Ti layer in the Ni/Ti/Ni configuration would have a higher temperature enabling a faster elemental diffusion and alloy homogenization, than in the Ti/Ni/Ti/ and Ni/Ti configuration, where the excess heat generated in the Ti layer(s) was partly dissipated into the graphite molds.
Further parts of the study were focused on the detailed study of properties of the obtained NiTi shape memory micro-foil material. For this purpose, the ST4 sample was used and the results of its characterization are presented in Figure 6.
The XRD data for ST4 are presented in Figure 6a and peaks corresponding to the martensite and austenite phases can be seen, also with a possible Ni2Ti4O phase. Figure 6b shows DSC results, where two broad endothermic peaks can be observed with austenite start/finish at ~338/363 K and an exothermic one with martensite start/finish transformation at ~343/303 K. Figure 6c presents a SEM image of the foil cross-section with rows of titanium-rich particles close to the surfaces, and (d) shows EDS point measurements showing very well diffused material. Oxygen content was low (<5 atom %).
Figure 7 shows a closer look at the particles found in Figure 6c, with elemental composition corresponding to the marked points (see Table 1).
Their shape was irregular. and size varied from ~0.2 to ~1 μm. The composition reveals the Ti-rich phase. The progression of these particles can be attributed to the fact that titanium initially was placed between nickel foils. Looking at the stage of the diffusion process imaged in Figure 3b, it can be stated that the Ti-rich phase disappears during synthesis as the last phase in the interior of the material, in favor of NiTi.
For the ST4 sample, the temperature dependence of the electrical resistivity was measured and results are presented in Figure 8.
Above approximately 50 K, the ST4 sample exhibits the temperature dependence of resistivity close to linear with a bump at cooling and a small deviation from linearity at the highest temperatures upon heating. The residual resistivity is relatively high and the ratio of R(293K)/R(4K) is of 3.5. The bump appearing at cooling is attributed to the appearance of the R-phase. The effects are similar to those reported in [14,43,44].
The shape recovery rate (SRR) was studied with bending tests for the ST1 and ST4 materials and the results are presented in Figure 9.
They show that shape recovery runs along different paths for different initial strains. For the lower strain, full shape recovery was obtained in a temperature range narrower than for the higher one. This was consistent with the DSC data, as shown in Figure 3 and Figure 6, where a multistep transformation can be observed. The samples exhibit a 100% SRR for both initial bending strains applied. The analogous test was tried for the ST2 and ST3 samples, but it indicated their brittleness with no signs of plasticity at room temperature. Their bending to a similar strain value as for the ST1 sample caused their breaking.

4. Conclusions

The sintering process of the elemental Ni and Ti micro-foils has been carried out at 973 K for 60 min under pressure of 13 MPa. The foils of respective thicknesses were used in two configurations: Ni/Ti/Ni and Ti/Ni/Ti “sandwich”, termed ST1 and ST3, respectively, and a simple Ti/Ni one, denoted as ST2. In addition, properties of shape memory effect for material prepared under lower pressure, higher diameter/thickness, and longer diffusion time, termed ST4, were studied. The results obtained are summarized as follows:
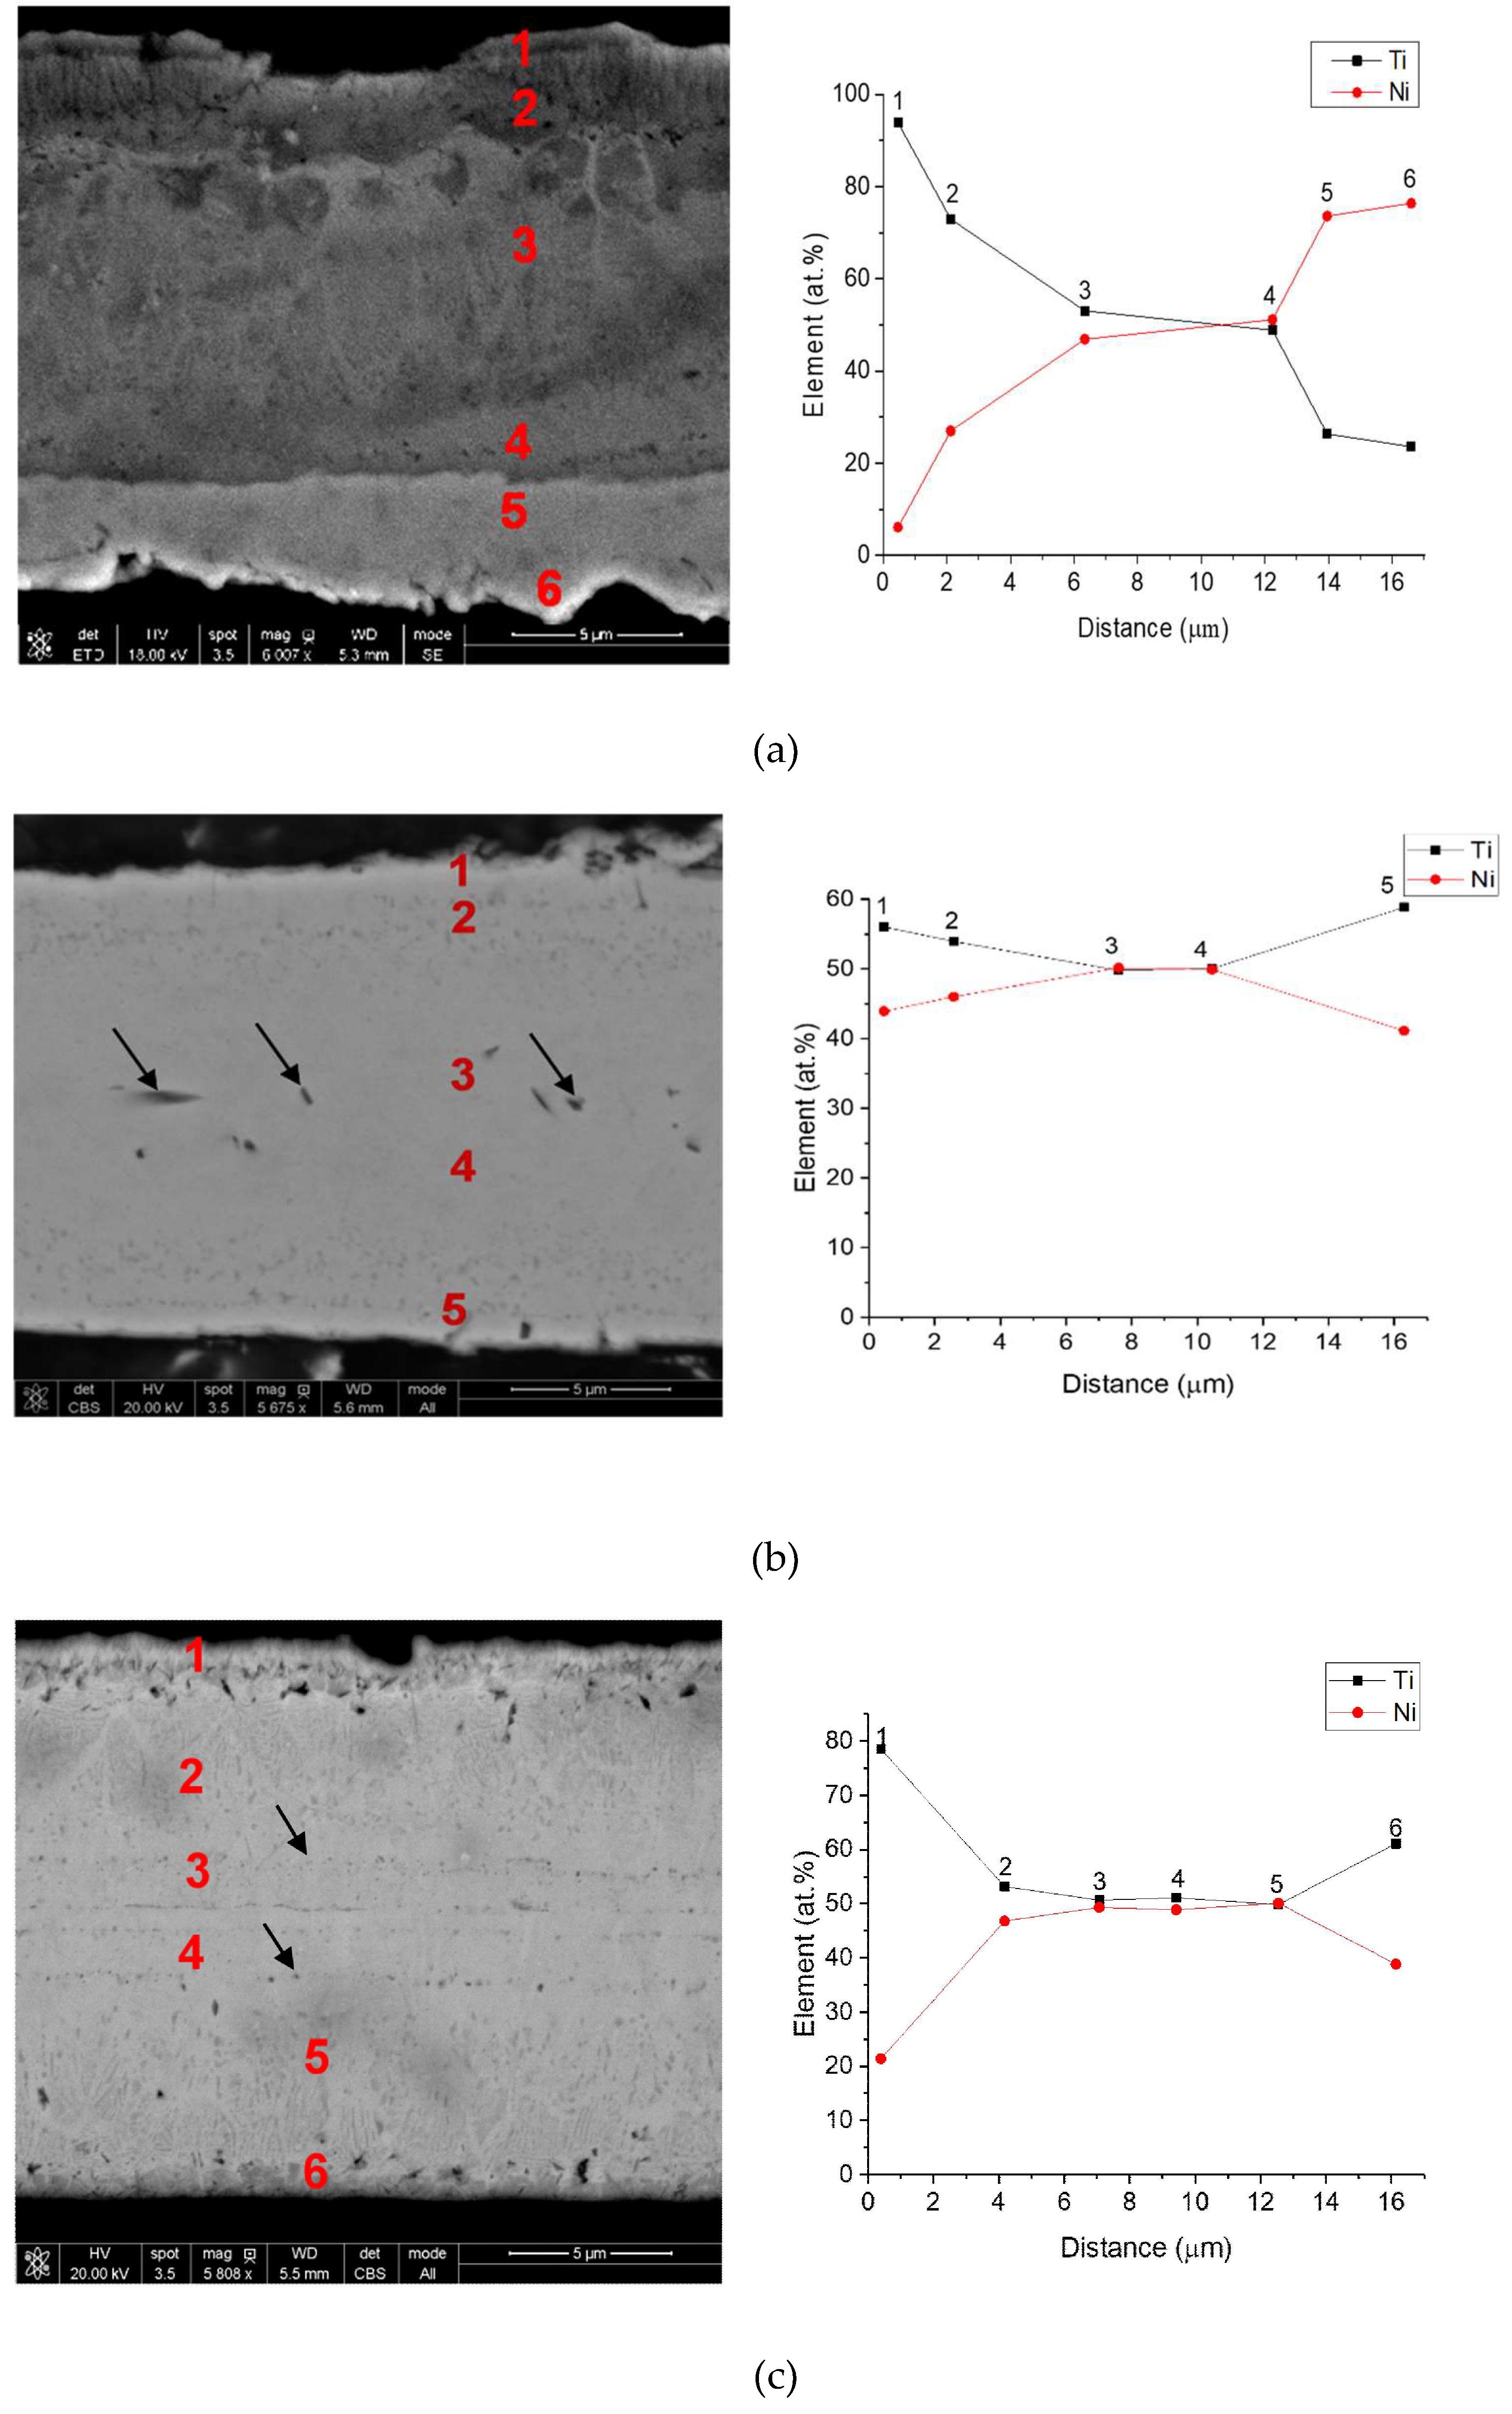
  • A single-step pulsed-current synthesis procedure was formulated and successfully carried out to obtain a 16 μm thick NiTi homogenous micro-foil.
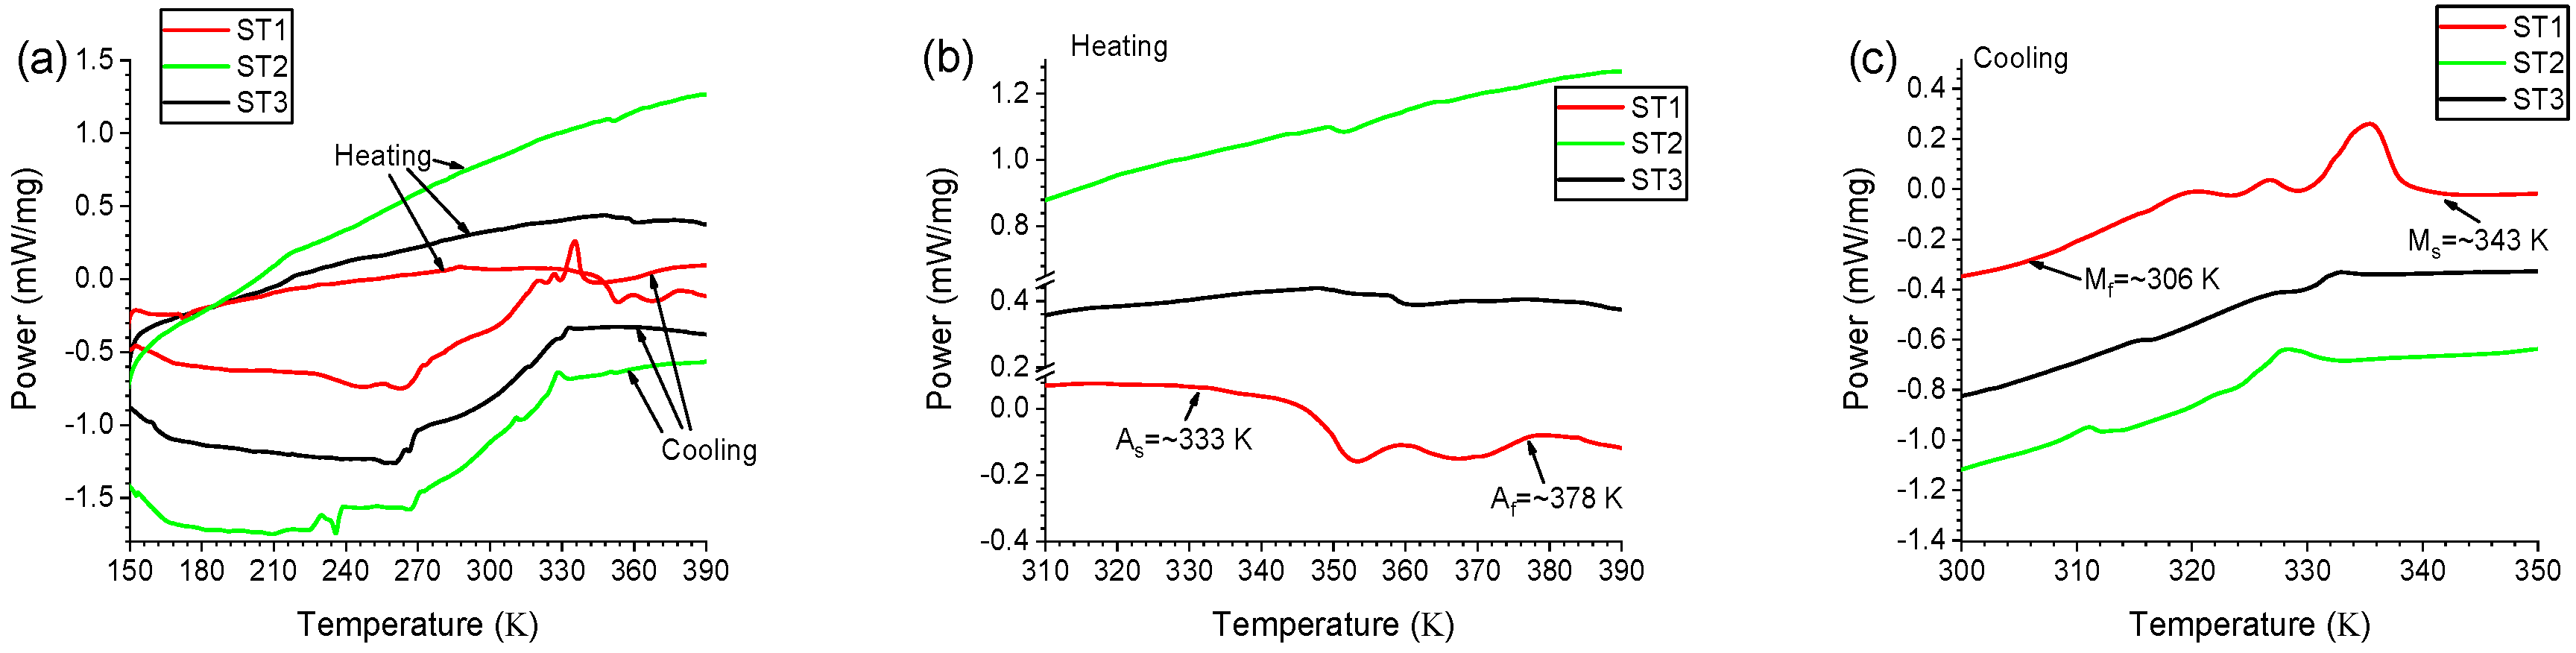
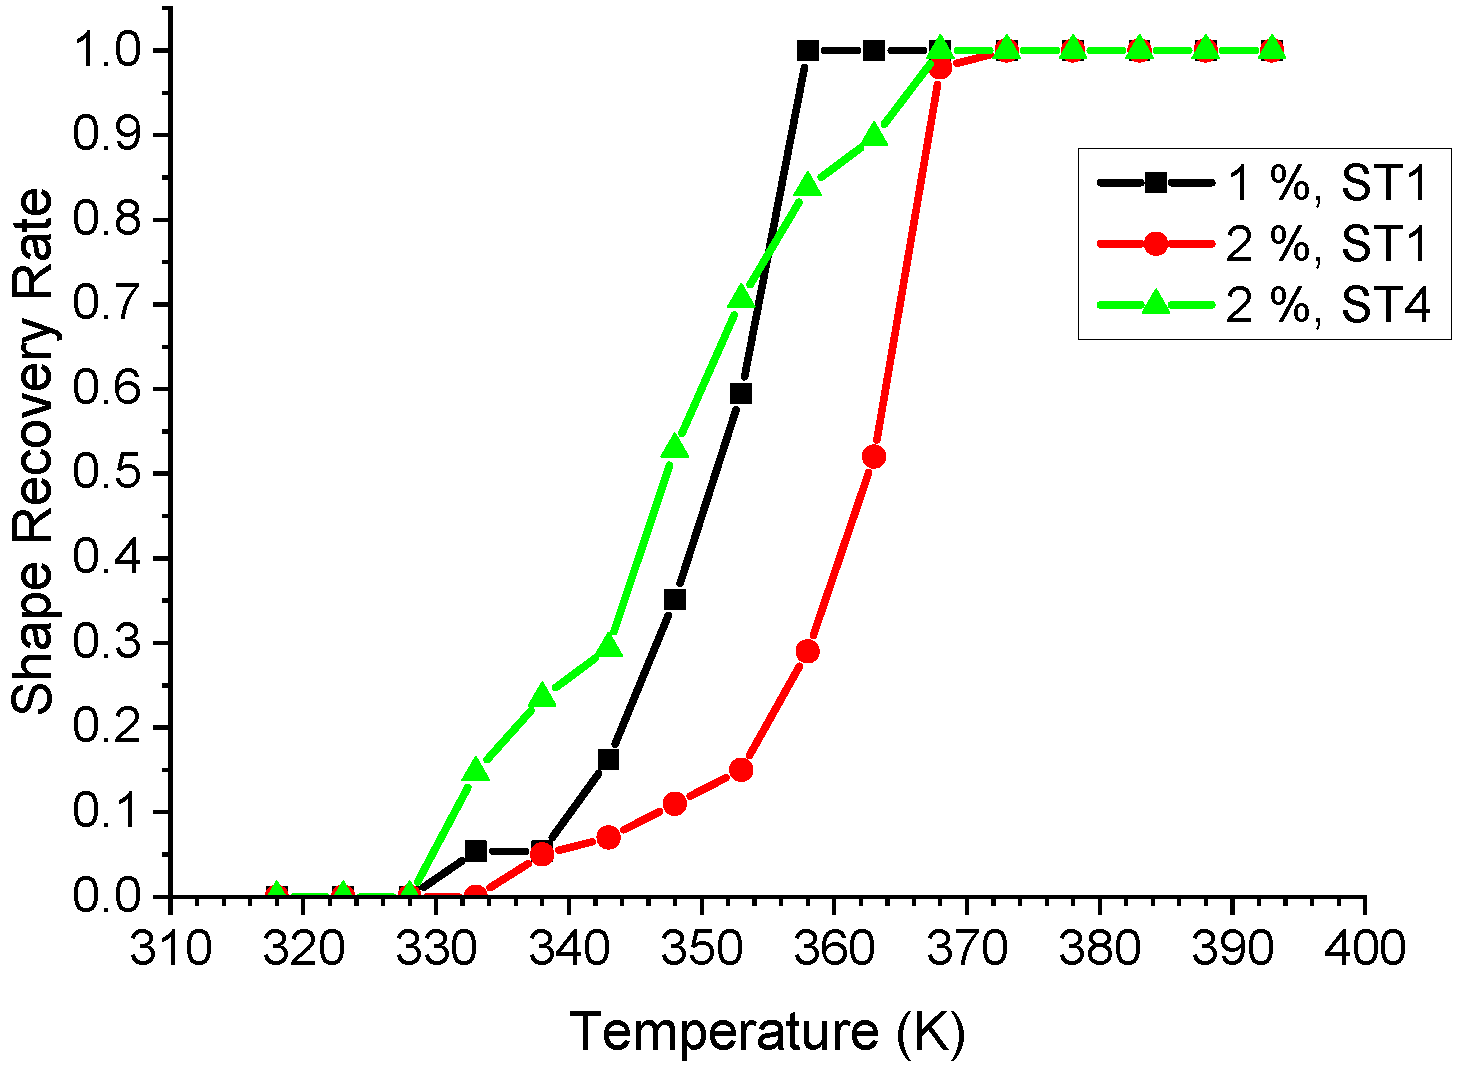
  • For the material obtained from Ni/Ti/Ni configuration, a full (100%) shape recovery was obtained in the temperature ranges between room temperature and 388 K, with recovery completing at lower temperatures for a smaller initial strain.
  • The Ni/Ti/Ni configuration was found to be superior to those of Ni/Ti and Ti/Ni/Ti, as it allowed for faster diffusion and better homogenization. This occurred possibly due to the Joule heating effect, which was much larger for the Ti layer than for the Ni layer, and more effective in this configuration, leading to homogeneous growth of the NiTi phase.
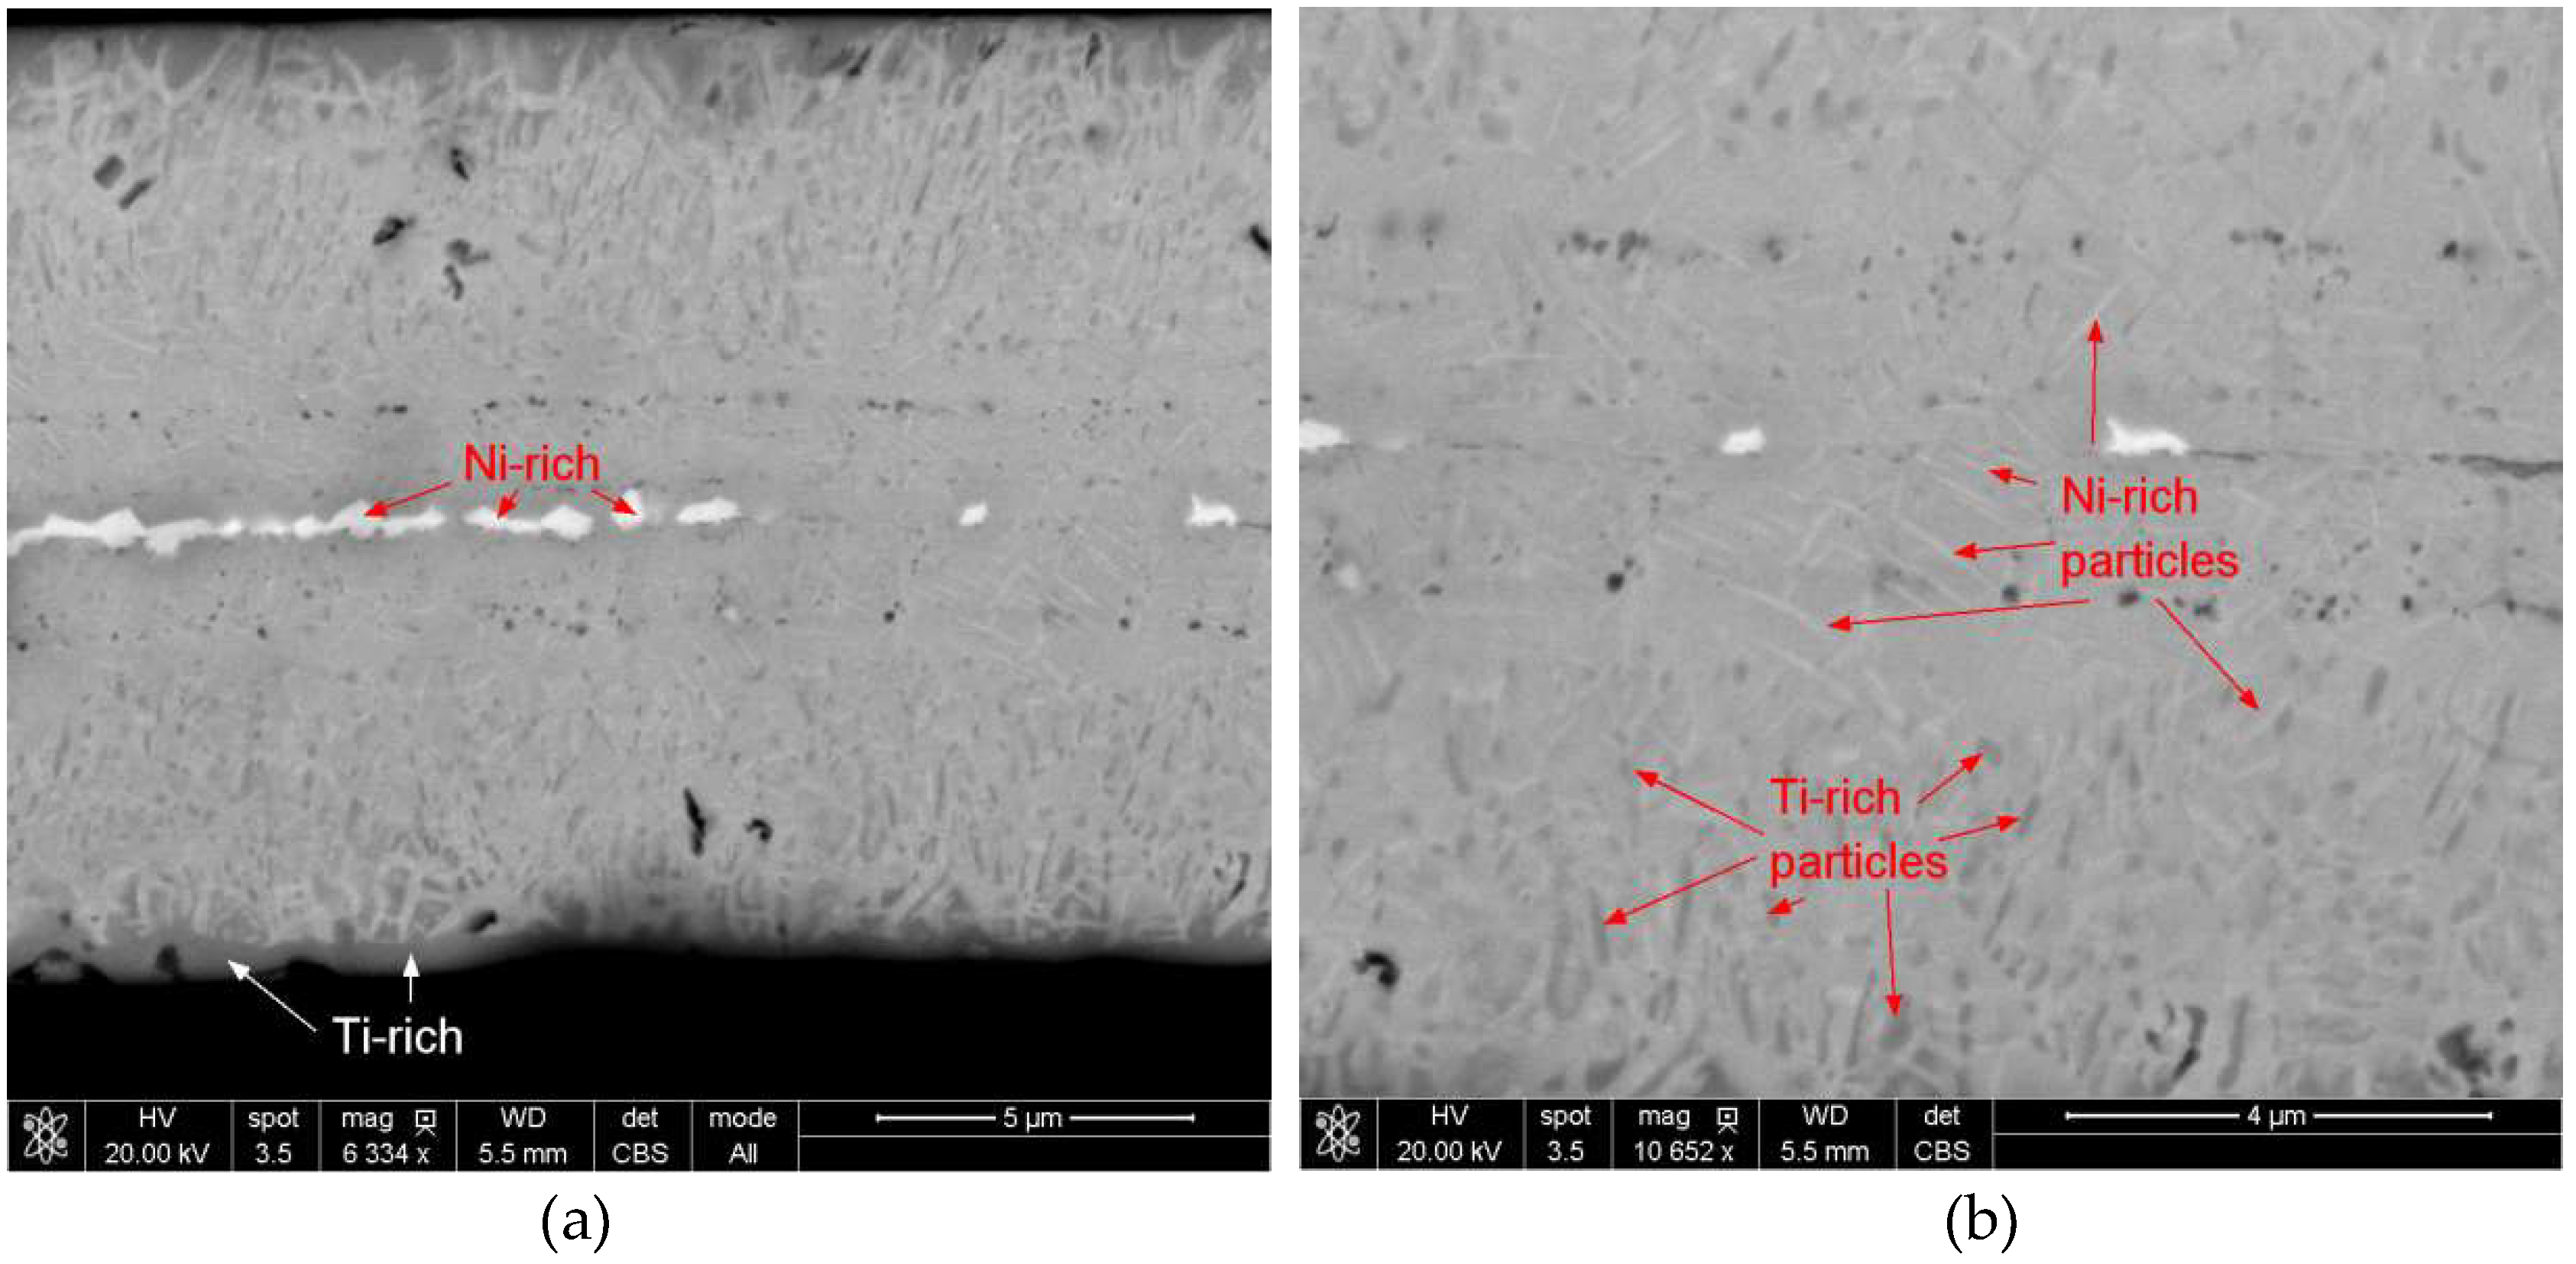
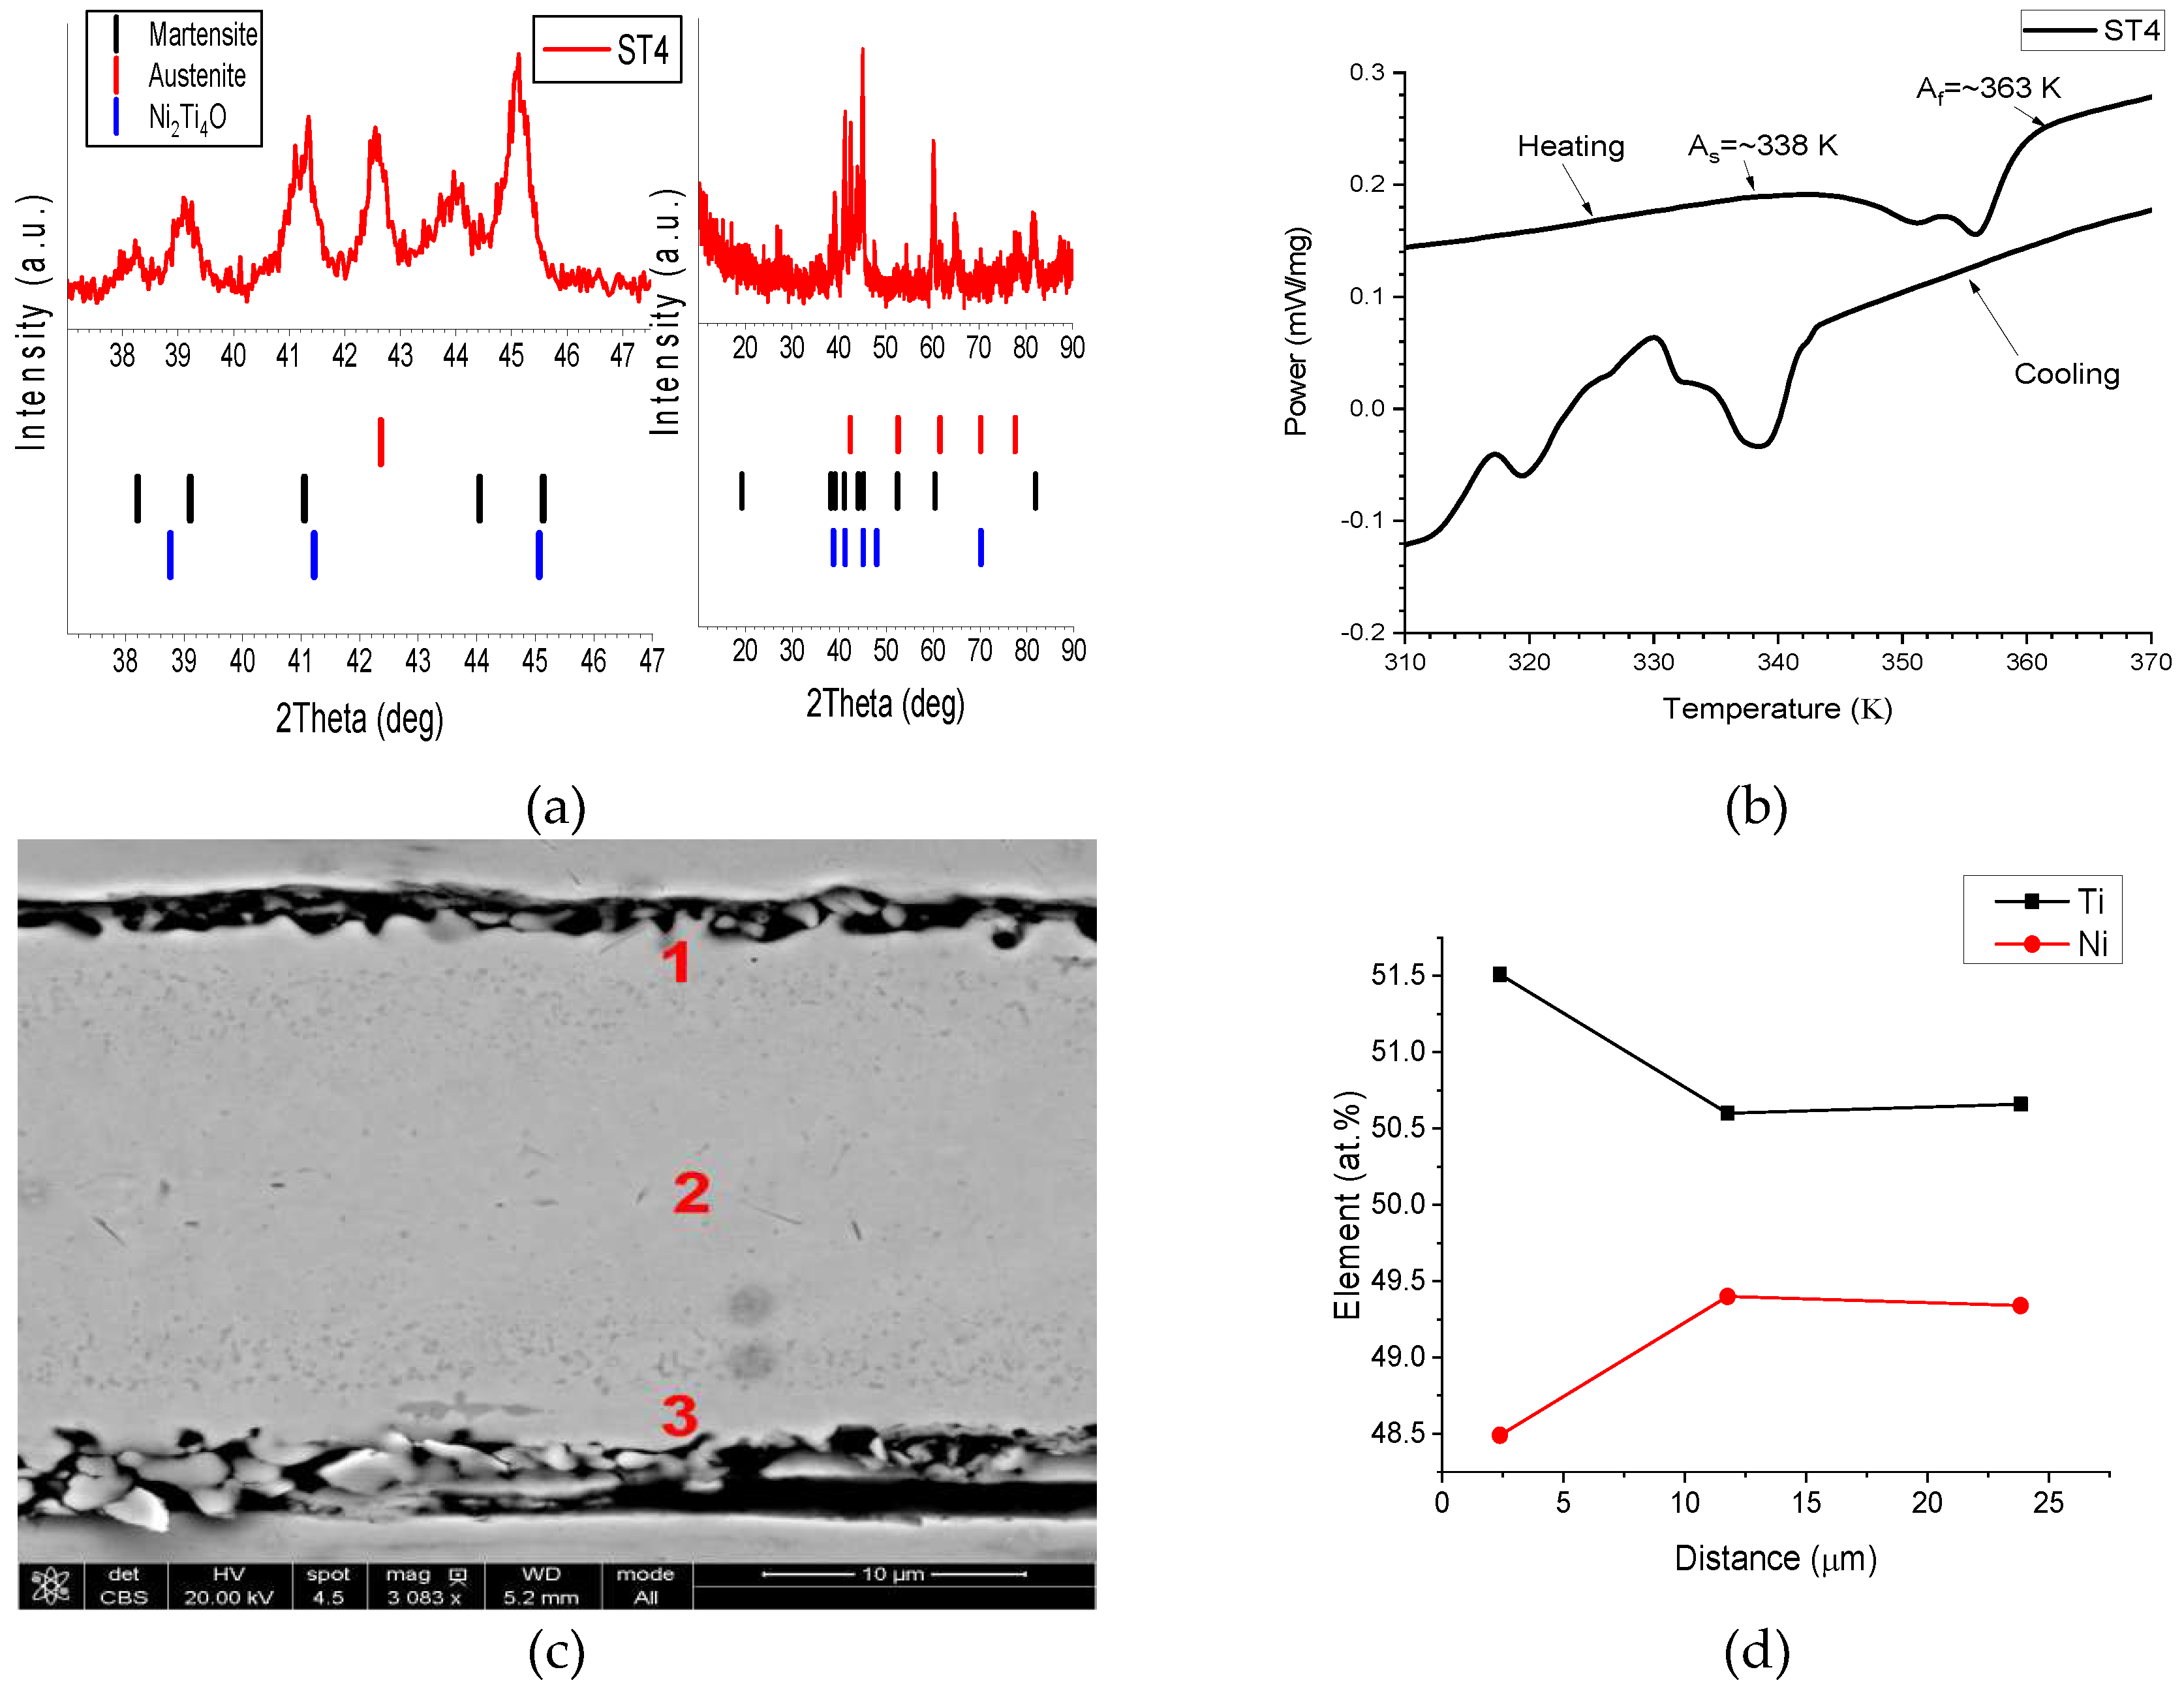
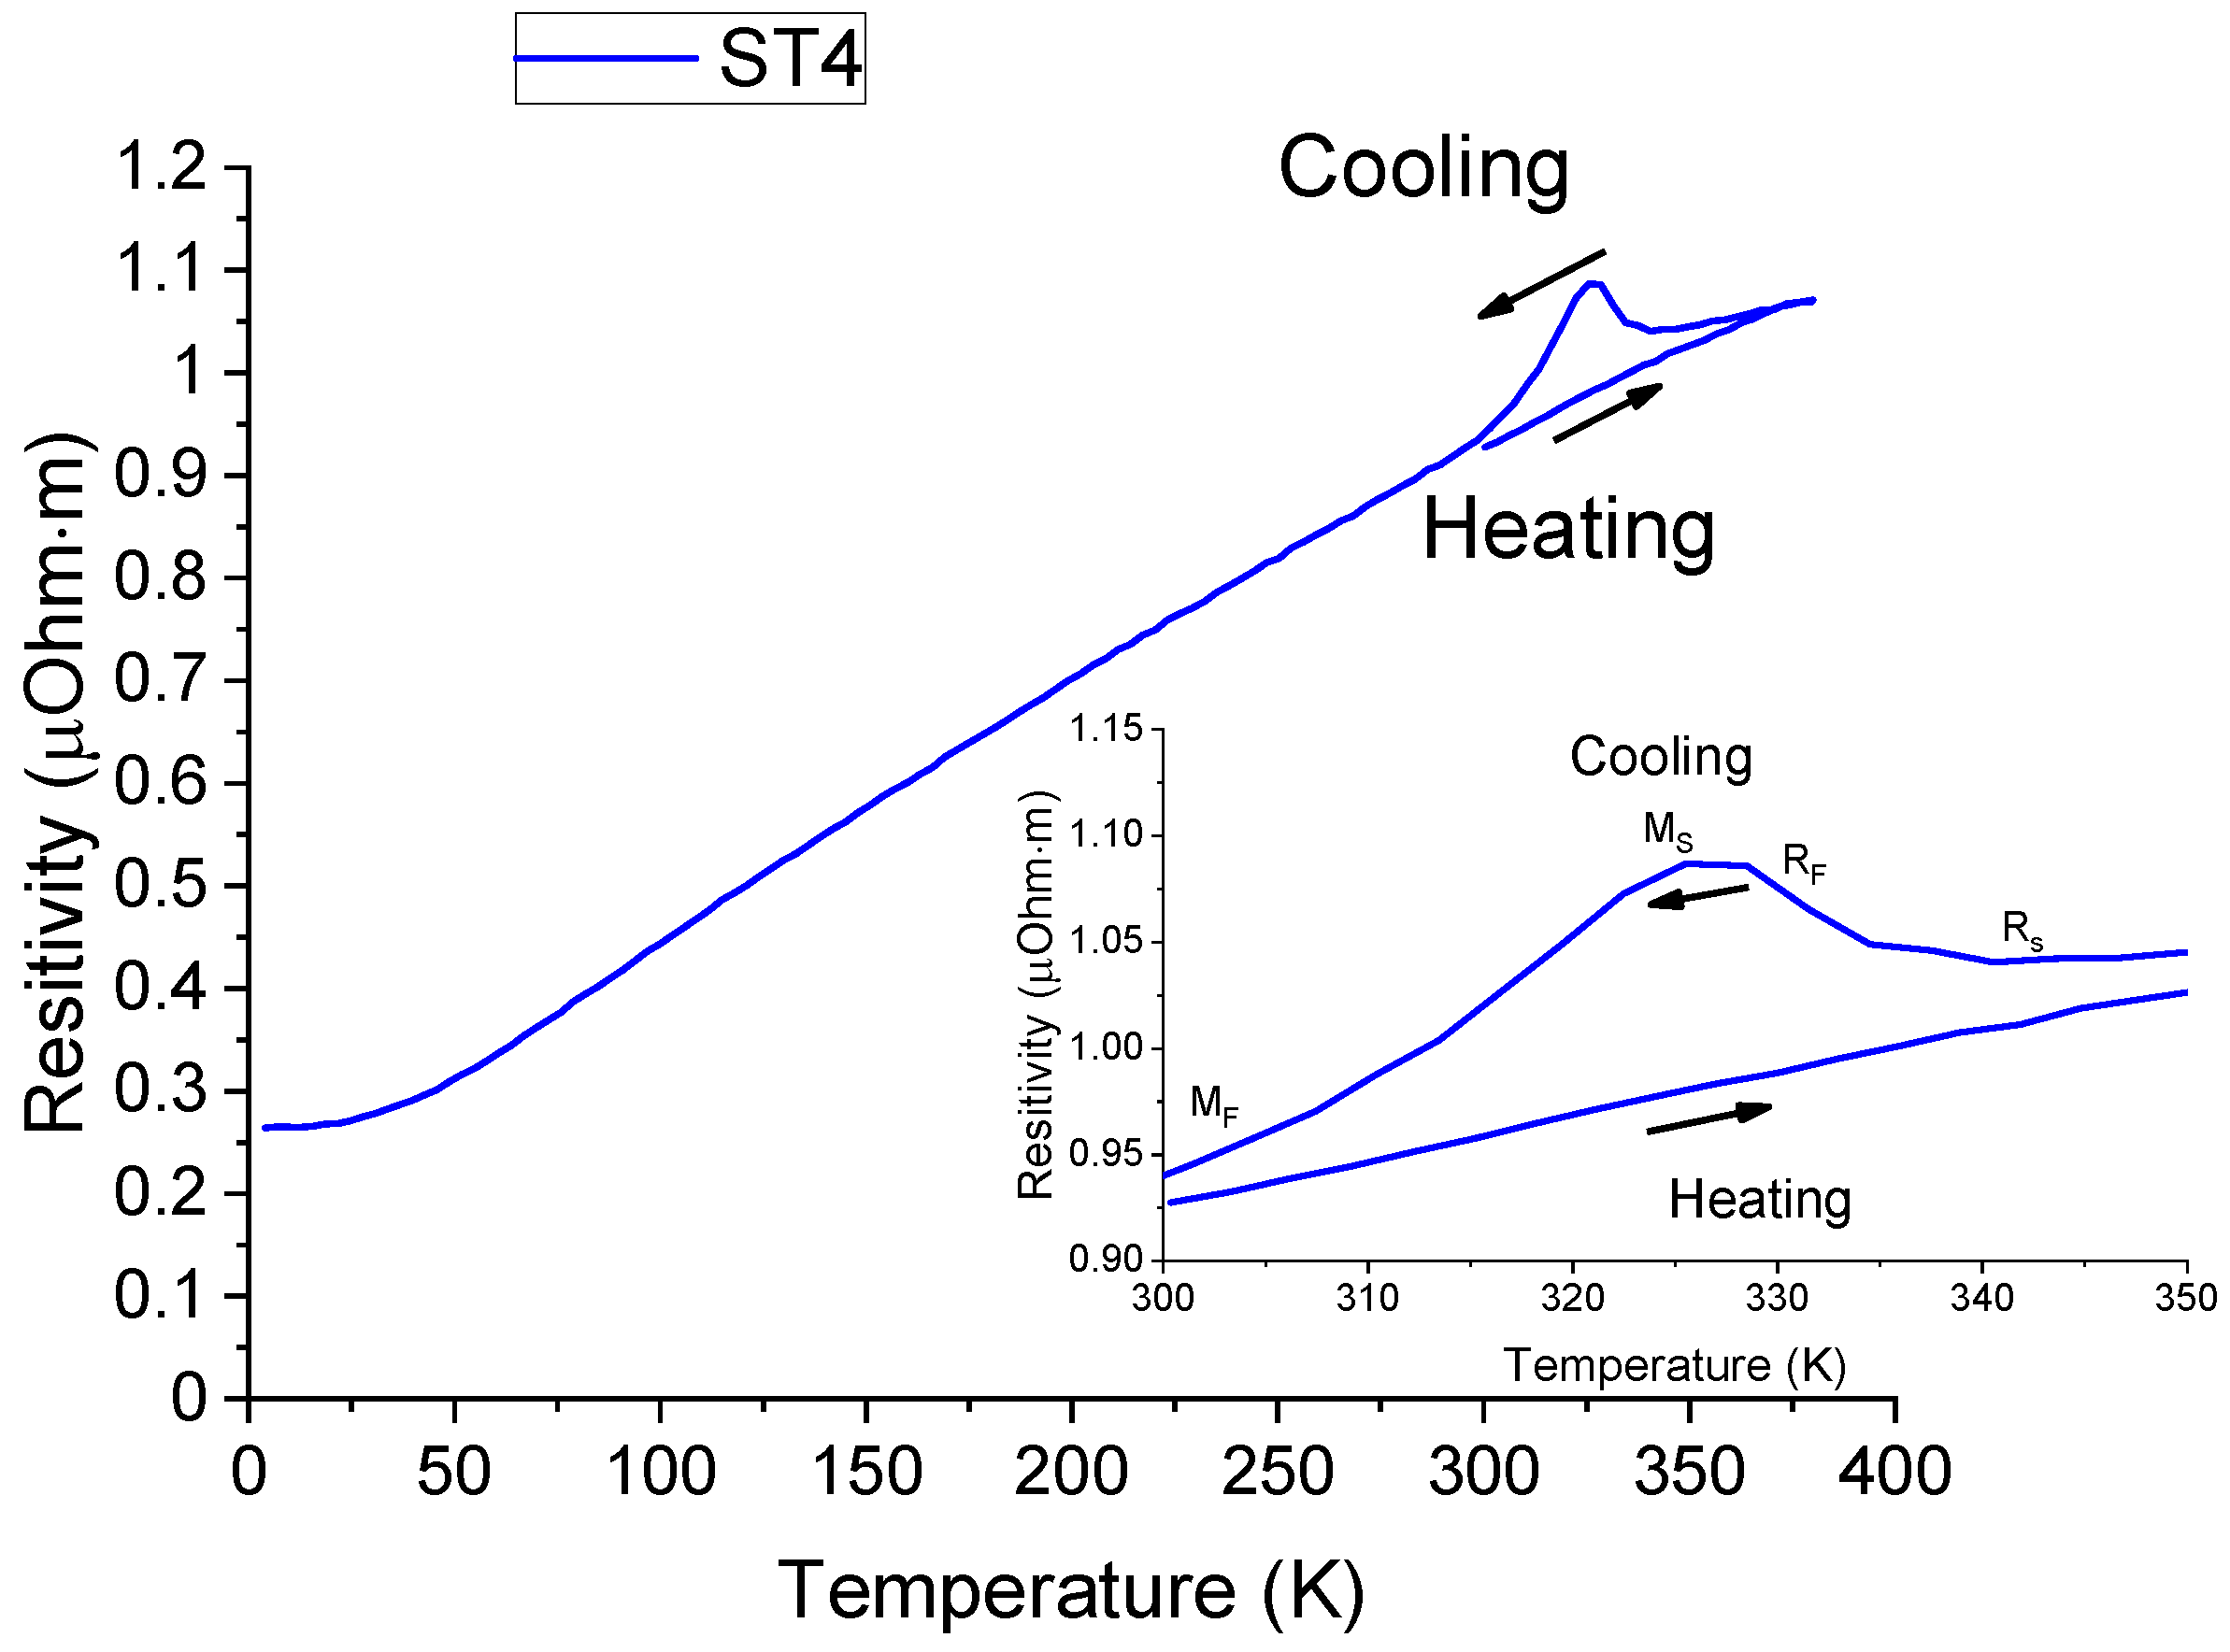
  • R-phase participation in the shape change transformation upon the reverse martensitic transition has been confirmed in the temperature dependence of the electrical resistivity and attributed to the presence of rows of Ti-rich particles forming along the direction towards the foil surfaces of the Ni/Ti/Ni configuration.
The study presented shows promising results for a simple one-step process of micro material manufacturing, in an exemplary application to nickel-titanium shape memory alloy.

Author Contributions

Conceptualization of the paper was made by W.P., K.G., T.S., A.T., and C.K.; W.P., T.S., E.Y., K.G., J.P., A.R., and S.U. performed the experiments and analyzed the data; W.P., K.G., A.T., and C.K. wrote and edited the paper.

Funding

This research was supported by the Ministry of Science and Higher Education (MNiSW), Poland and Shibaura Institute of Technology, Japan. T.S., J.P. and C.K. acknowledge a support of the Faculty of Physics and Applied Computer Science AGH UST statutory tasks No. 11.11.220.01/6 within subsidy of the Ministry of Science and Higher Education, Poland. Partial support by the Ministry of Science and Higher Education of Poland under contract No. 11.11.110.295 is also acknowledged.

Conflicts of Interest

The authors declare no conflict of interest.

References

  1. Petrini, L.; Migliavacca, F. Biomedical Applications of Shape Memory Alloys. J. Metall. 2011, 2011, 501483. [Google Scholar] [CrossRef]
  2. Kahn, A.; Huff, M.A.; Heuer, A.H. The TiNi shape-memory alloy and its applications for MEMS. J. Micromech. Microeng. 1998, 8, 213–221. [Google Scholar] [CrossRef]
  3. Predki, W.; Knopik, A.; Bauer, B. Engineering applications of NiTi shape memory alloys. Mater. Sci. Eng. A 2008, 481–482, 598–601. [Google Scholar] [CrossRef]
  4. Sharifi, E.M.; Kermanpur, A. Superelastic properties of nanocrystalline NiTi shape memory alloy produced by thermomechanical processing. Trans. Nonferrous Met. Soc. China 2018, 28, 515–523. [Google Scholar] [CrossRef]
  5. Ruiz-Larrea, I.; Breczewski, T.; López, G.A.; Nó, M.L.; López-Echarri, A.; Lopez-Ferreño, I.; San Juan, J.M. The Influence of Thermal History on the Multistage Transformation of NiTi Shape-Memory Alloys. Metals 2018, 8, 246. [Google Scholar] [CrossRef]
  6. Carl, M.; Smith, J.D.; Doren, B.V.; Young, M.L. Effect of Ni-Content on the Transformation Temperatures in NiTi-20 at. % Zr High Temperature Shape Memory Alloys. Metals 2017, 7, 511. [Google Scholar] [CrossRef]
  7. Frenzel, J.; George, E.P.; Dlouhy, A.; Somsen, C.; Wagner, M.F.X.; Eggeler, G. Influence of Ni on martensitic phase transformations in NiTi shape memory alloys. Acta Mater. 2010, 5, 3444–3458. [Google Scholar] [CrossRef]
  8. Loger, K.; Engel, A.; Haupt, J.; Li, Q.; Lima de Miranda, R.; Quandt, E.; Lutter, G.; Selhuber-Unkel, C. Cell adhesion on NiTi thin film sputter-deposited meshes. Mater. Sci. Eng. C 2016, 5, 611–616. [Google Scholar] [CrossRef] [PubMed]
  9. Ciabattari, F.; Fuso, F.; Arimondo, E. Pulsed laser deposition of NiTi shape memory effect thin films. Appl. Phys. A 1997, 64, 623–627. [Google Scholar] [CrossRef]
  10. Cha, J.O.; Nam, T.H.; Alghusun, M.; Ahn, J.S. Composition and crystalline properties of TiNi thin films prepared by pulsed laser deposition under vacuum and in ambient Ar gas. Nanoscale Res. Lett. 2012, 7, 37. [Google Scholar] [CrossRef] [Green Version]
  11. Hou, H.; Hamilton, R.F.; Horn, M.W.; Jin, Y. NiTi thin films prepared by biased target ion beam deposition co-sputtering from elemental Ni and Ti targets. Thin Solid Film 2014, 5, 1–6. [Google Scholar] [CrossRef]
  12. Fu, Y.; Huang, W.; Du, H.; Huang, X.; Tan, J.; Gao, X. Characterization of TiNi shape-memory alloy thin films for MEMS applications. Surf. Coat. Technol. 2001, 1, 107–112. [Google Scholar] [CrossRef]
  13. Ho, K.K.; Carman, G.P. Sputter deposition of NiTi thin film shape memory alloy using a heated target. Thin Solid Film 2000, 3, 18–29. [Google Scholar] [CrossRef]
  14. Antonucci, V.; Faiella, G.; Giordano, M.; Mennella, F.; Nicolais, L. Electrical resistivity study and characterization during NiTi phase transformations. Thermochim. Acta 2007, 4, 64–69. [Google Scholar] [CrossRef]
  15. Mohri, M.; Nili-Ahmadabadi, M.; Chakravadhanula, V.S.K. Crystallization study of amorphous sputtered NiTi bi-layer thin film. Mater. Charact. 2015, 1, 75–80. [Google Scholar] [CrossRef]
  16. Tillmann, W.; Momeni, S. Comparison of NiTi thin films sputtered from separate elemental targets and Ti-rich alloy targets. J. Mater. Process. Technol. 2015, 2, 184–190. [Google Scholar] [CrossRef]
  17. Isalgue, A.; Torra, V.; Seguin, J.-L.; Bendahan, M.; Amigo, J.M.; Esteve-Cano, V. Shape memory NiTi thin films deposited at low temperature. Mater. Sci. Eng. A 1999, 2, 717–721. [Google Scholar] [CrossRef]
  18. Ramirez, A.G.; Ni, H.; Lee, H.J. Crystallization of amorphous sputtered NiTi thin films. Mater. Sci. Eng. A 2006, 4, 703–709. [Google Scholar] [CrossRef]
  19. Firstov, G.S.; Vitchev, R.G.; Kumar, H.; Blanpain, B.; van Humbeeck, J. Surface oxidation of NiTi shape memory alloy. Biomaterials 2002, 2, 4863–4871. [Google Scholar] [CrossRef]
  20. Ou, S.-F.; Peng, B.-Y.; Chen, Y.-C.; Tsai, M.-H. Manufacturing and Characterization of NiTi Alloy with Functional Properties by Selective Laser Melting. Metals 2018, 8, 342. [Google Scholar] [CrossRef]
  21. Tomus, D.; Tsuchiya, K.; Inuzuka, M.; Sasaki, M.; Imai, D.; Ohmori, T.; Umemoto, M. Fabrication of shape memory TiNi foils via Ti/Ni ultrafine laminates. Scr. Mater. 2003, 4, 489–494. [Google Scholar] [CrossRef]
  22. Simões, S.; Ramos, A.S.; Viana, F.; Vieira, M.T.; Vieira, M.F. Joining of TiAl to Steel by Diffusion Bonding with Ni/Ti Reactive Multilayers. Metals 2016, 6, 96. [Google Scholar] [CrossRef]
  23. Shao, X.; Guo, X.; Han, Y.; Lu, W.; Qin, J.; Zhang, D. Characterization of the diffusion bonding behavior of pure Ti and Ni with different surface roughness during hot pressing. Mater. Des. 2015, 6, 1001–1010. [Google Scholar] [CrossRef]
  24. Chen, G.; Liss, K.-D.; Cao, P. An in situ Study of NiTi Powder Sintering Using Neutron Diffraction. Metals 2015, 5, 530–546. [Google Scholar] [CrossRef] [Green Version]
  25. Rizvi, S.A.; Khan, T.I. A Novel Fabrication Method for Nitinol Shape Memory Alloys. Key Eng. Mater. 2010, 4, 309–315. [Google Scholar] [CrossRef]
  26. Zhou, Y.; Wang, Q.; Sun, D.L.; Han, X.L. Co-effect of heat and direct current on growth of intermetallic layers at the interface of Ti-Ni diffusion couples. J. Alloys Compd. 2011, 5, 1201–1205. [Google Scholar] [CrossRef]
  27. Hu, L.; Xue, Y.; Shi, F. Intermetallic formation and mechanical properties of Ni-Ti diffusion couples. Mater. Des. 2017, 1, 175–182. [Google Scholar] [CrossRef]
  28. Zhang, Y.; Cheng, X.; Cai, H. Fabrication, characterization and tensile property of a novel Ti2Ni/TiNi micro-laminated composite. Mater. Des. 2016, 9, 486–493. [Google Scholar] [CrossRef]
  29. Garay, J.E.; Anselmi-Tamburini, U.; Munir, Z.A. Enhanced growth of intermetallic phases in the Ni-Ti system by current effects. Acta Mater. 2003, 5, 4487–4495. [Google Scholar] [CrossRef]
  30. Zhu, R.; Jiang, Y.; Guan, L.; Li, H.; Tang, G. Difference in recrystallization between electropulsing-treated and furnace-treated NiTi alloy. J. Alloys Compd. 2016, 6, 548–554. [Google Scholar] [CrossRef]
  31. Shao, X.; Guo, X.; Han, Y.; Lin, Z.; Qin, J.; Lu, W.; Zhang, D. Preparation of TiNi films by diffusion technology and the study of the formation sequence of the intermetallics in Ti-Ni systems. J. Mater. Res. 2014, 760, 2707–2716. [Google Scholar] [CrossRef]
  32. Halani, P.R.; Kaya, I.; Shin, Y.C.; Karaca, H.E. Phase transformation characteristics and mechanical characterization of nitinol synthesized by laser direct deposition. Mater. Sci. Eng. A 2013, 5, 836–843. [Google Scholar] [CrossRef]
  33. Otubo, J.; Rigo, O.D.; Coelho, A.A.; Neto, C.M.; Mei, P.R. The influence of carbon and oxygen content on the martensitic transformation temperatures and enthalpies of NiTi shape memory alloy. Mater. Sci. Eng. A 2008, 4, 639–642. [Google Scholar] [CrossRef]
  34. Jiang, S.; Zhang, Y.; Zhao, Y.; Liu, S.; Hu, L.; Zhao, C. Influence of Ni4Ti3 precipitates on phase transformation of NiTi shape memory alloy. Trans. Nonferrous Met. Soc. China 2015, 2, 4063–4071. [Google Scholar] [CrossRef]
  35. Liu, Y.; Blanc, M.; Tan, G.; Kim, J.I.; Miyazaki, S. Effect of ageing on the transformation behaviour of Ti-49.5 at.% Ni. Mater. Sci. Eng. A 2006, 4, 617–621. [Google Scholar] [CrossRef]
  36. Gyobu, A.; Kawamura, Y.; Horikawa, H.; Saburi, T. Martensitic Transformations in Sputter-Deposited Shape Memory Ti-Ni Films. Mater. Trans. 1996, 3, 697–702. [Google Scholar] [CrossRef]
  37. Topolski, K.; Wieciński, P.; Szulc, Z.; Gałka, A.; Garbacz, H. Progress in the characterization of explosively joined Ti/Ni bimetals. Mater. Des. 2014, 6, 479–487. [Google Scholar] [CrossRef]
  38. Bartel, T.; Hackl, K. Multiscale modeling of martensitic phase transformations: On the numerical determination of heterogeneous mesostructures within shape-memory alloys induced by precipitates. Tech. Mech. 2010, 30, 324–342. [Google Scholar]
  39. Hornbuckle, B.C.; Yu, X.X.; Noebe, R.D.; Martens, R.; Weaver, M.L.; Thompson, G.B. Hardening behavior and phase decomposition in very Ni-rich Nitinol alloys. Mater. Sci. Eng. A 2015, 6, 336–344. [Google Scholar] [CrossRef]
  40. Maso’od, M.; Ismail, M.H.; Razali, R.; Subuki, I. Effect of sintering temperatures on microstructural changes and phase transformation of nearly equiatomic microporous NiTi alloy produced by metal injection moulding. J. Mech. Eng. 2018, 5, 115–126. [Google Scholar]
  41. Ke, C.B.; Cao, S.S.; Ma, X.; Zhang, X.P. Modeling of Ni4Ti3 precipitation during stress-free and stress-assisted aging of bi-crystalline NiTi shape memory alloys. Trans. Nonferrous Met. Soc. China 2012, 2, 2578–2585. [Google Scholar] [CrossRef]
  42. Mokgalaka, M.N.; Pityana, S.L.; Popoola, P.A.I.; Mathebula, T. NiTi intermetallic surface coatings by laser metal deposition for improving wear properties of Ti-6Al-4V substrates. Adv. Mater. Sci. Eng. 2014, 2014, 363917. [Google Scholar] [CrossRef]
  43. Airoldi, G.; Ranucci, T.; Riva, G. Mechanical and Electrical Properties of A NiTi Shape Memory Alloy. J. Phys. IV 1991, 1, 439–444. [Google Scholar] [CrossRef]
  44. Kovalev, A.I.; Logunov, A.V.; Petrushin, N.V.; Egorova, L.S. Thermal conductivity and electrical resistivity of NiTi in the temperature interval 90–450 K. J. Eng. Phys. 1977, 3, 183–185. [Google Scholar] [CrossRef]
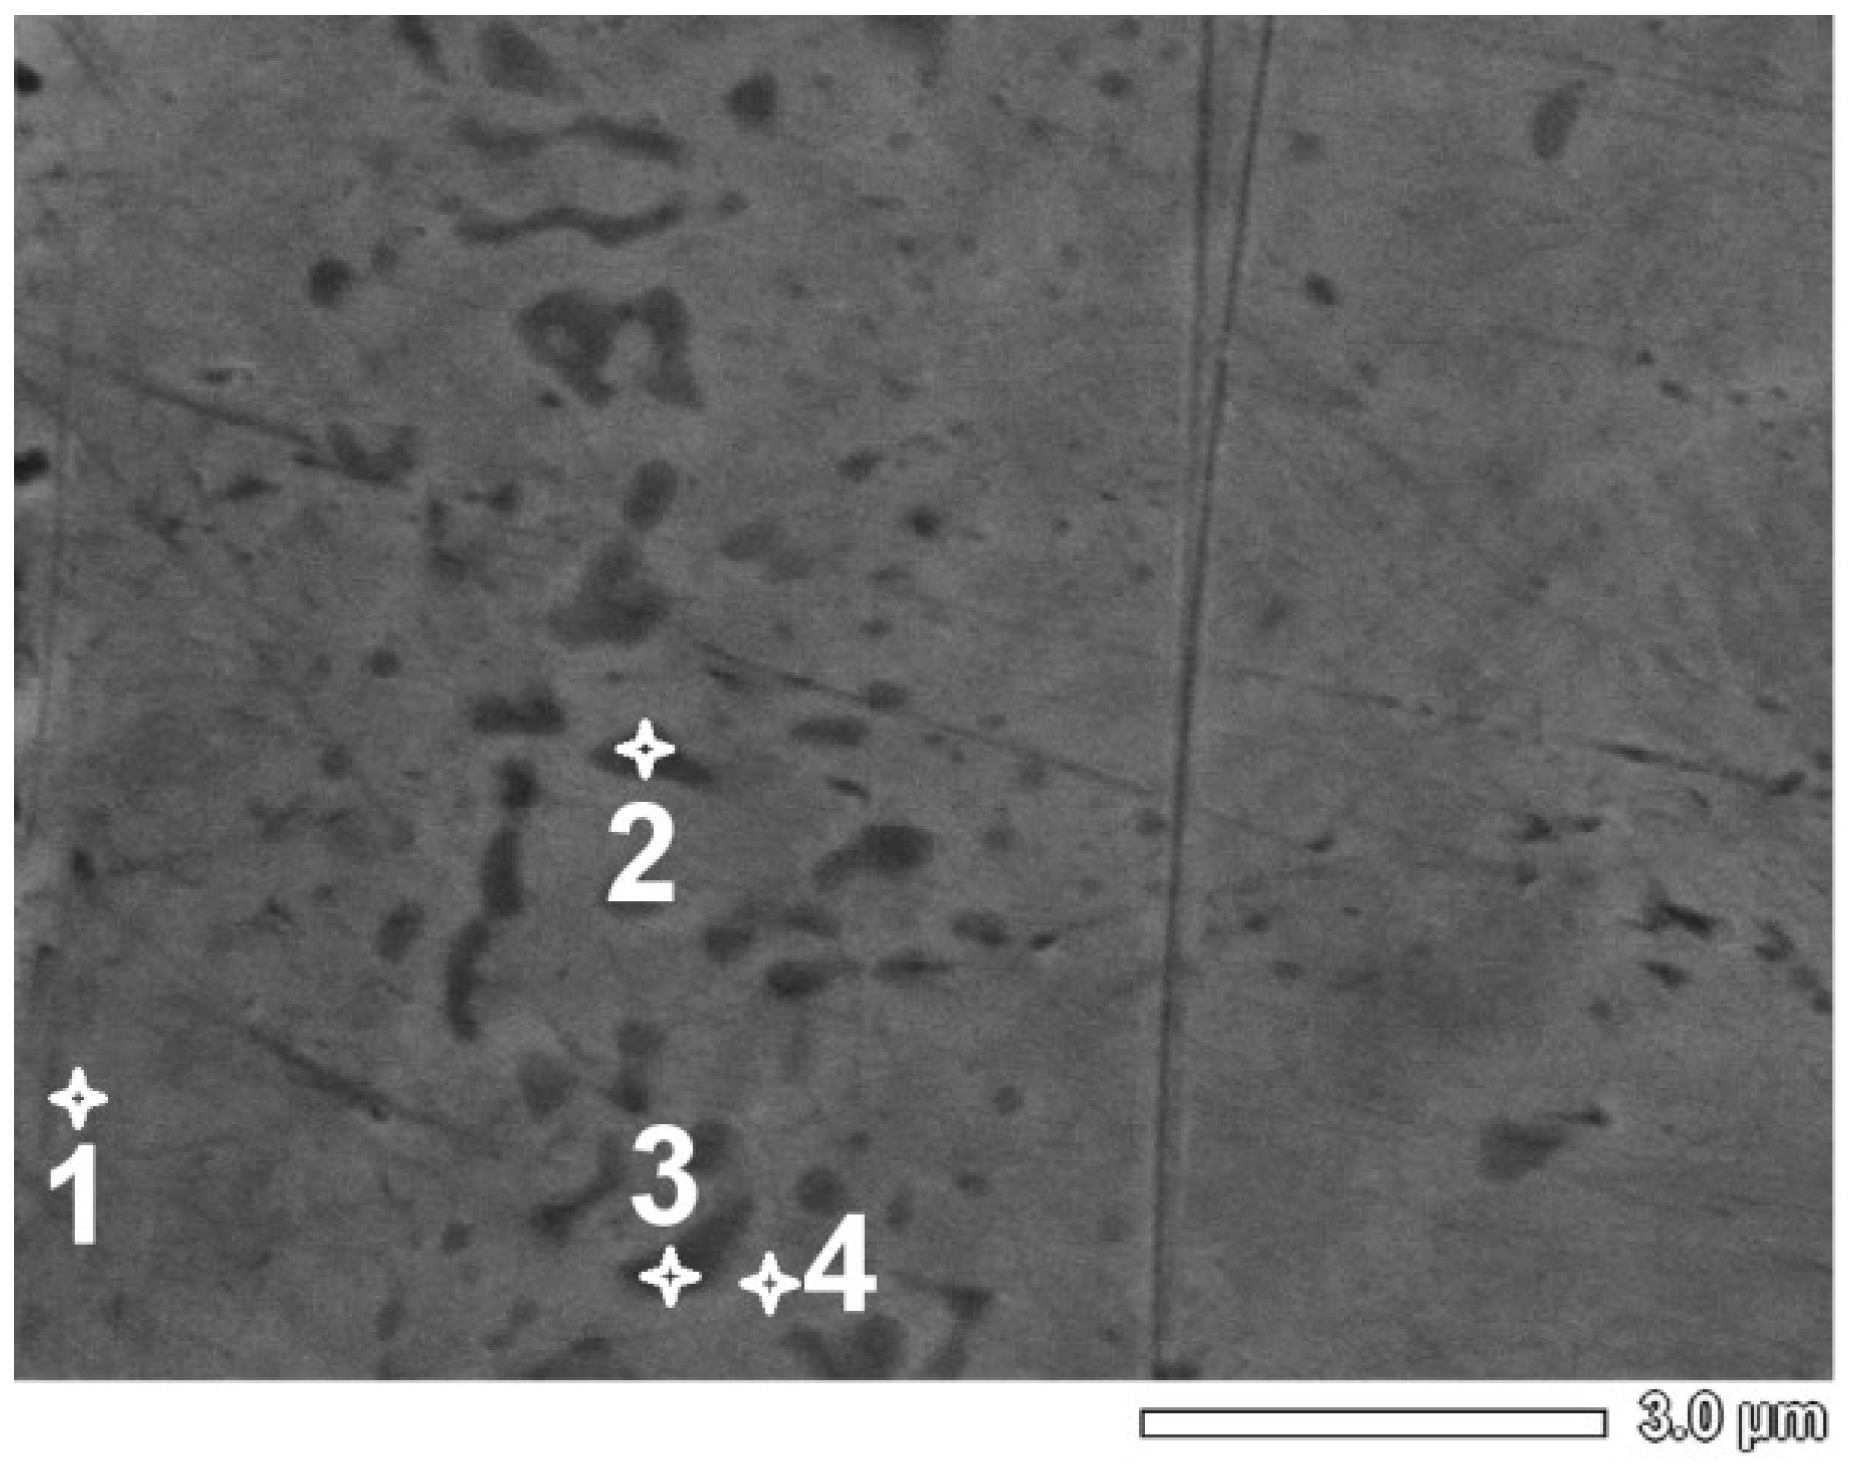
Figure 1. X-ray diffraction patterns at ambient temperature for the sample: ST2, ST3, and ST1. Phases’ structural peaks are respectively marked.
Metals 09 00323 g001
Figure 2. X-ray diffraction patterns (a) at various temperatures for the sample ST1: red, blue, and green corresponds to 300, 333, and 393 K. (b) Patterns at 300 K: before and after heating to 373 K. Structural peaks of the phases present are marked, respectively.
Metals 09 00323 g002
Figure 3. Results of differential scanning calorimetry measurements on the Ni-Ti alloy micro-foils (a) in the whole temperature range, (b) during heating, and (c) cooling. Transition temperatures are respectively marked.
Metals 09 00323 g003
Figure 4. Back scattering electron-images (left) and energy dispersive X-ray spectroscopy results (right) for the cross-sections of: (a) ST2, (b) ST1, and (c) ST3 samples. Measured nickel/titanium contents correspond to the points on going from the top surface of the sample in the SEM image on the left side. The uncertainty is of order of the marked measurement point size. The arrows show the location of Kirkendall voids (Figure 4b,c).
Metals 09 00323 g004
Figure 5. Back scattering electron-image results for the cross-sections of sample ST3: (a) whole cross-section and (b) zoomed area. Images taken at different parts of the micro-foil cross-sections.
Metals 09 00323 g005
Figure 6. Experimental results for the sample ST4: (a) X-ray diffraction pattern, (b) differential scanning calorimetry results, (c) back scattering image of the cross-section, and (d) energy dispersive X-ray spectroscopy point measurements.
Metals 09 00323 g006
Figure 7. Back scattering electron-image for the cross-sections of the sample ST4. Points with nickel/titanium contents (see Table 1) correspond to the marked points in the SEM image.
Metals 09 00323 g007
Figure 8. Temperature dependence of the electrical resistivity for the ST4 sample. The inset shows magnification of the high temperature region with marked transition points as: RS–R phase start, RF–R phase finish, MS Martensite start and MF–Martensite finish.
Metals 09 00323 g008
Figure 9. Temperature dependence of the shape recovery rate for the ST1 and ST4 samples.
Metals 09 00323 g009
Table 1. Results of the Energy dispersive X-ray spectroscopy measurements for the cross-sections of the sample ST4 corresponding to the points marked in the SEM image, Figure 7.
Point NumberNi (atom %)Ti (atom %)
14951
24258
34060
44753

