Article

Fatigue Life Prediction of Steam Generator Tubes by Tube Specimens with Circular Holes

1
Institute of Process Equipment and Control Engineering, Zhejiang University of Technology, Hangzhou 310032, China
2
Engineering Research Center of Process Equipment and Remanufacturing, Ministry of Education, Hangzhou 310032, China
*
Author to whom correspondence should be addressed.
Metals 2019, 9(3), 322; https://doi.org/10.3390/met9030322
Submission received: 30 January 2019 / Revised: 28 February 2019 / Accepted: 10 March 2019 / Published: 12 March 2019
(This article belongs to the Special Issue Fracture, Fatigue and Structural Integrity of Metallic Materials)

Abstract

:
Heat exchangers manufactured from Inconel 690 tubes are widely used for steam generators in nuclear power plants. Inconel 690 tubes have suffered failures of fatigue fracture due to flow induced vibration. It is difficult to obtain the fatigue life of the tube directly since the conventional fatigue test would potentially cause end fatigue failure due to the stress concentration at the clamp end. In this study, a thin-walled Inconel 690 tube with circular hole is designed to deduce the fatigue life of smooth tube based on the notch fatigue life prediction technology. Firstly, the local stress and strain distributions around the hole based on the finite element analysis are discussed. Local stress-strain is calculated and compared with Neuber’s ruler. Meanwhile, fatigue life tests using tube specimens with circular holes are carried out. Finally, based on the best-fitted fatigue life curve of Inconel 690 alloy, the fatigue life of tube specimen is estimated from the local strain according to Neuber’s ruler. The results show that the local stress and strain estimated by Neuber’s ruler are basically consistent with those obtained by finite element analysis. Compared with the average fatigue life of nickel-based alloy, the new predicted equivalent fatigue life of heat Inconel 690 transfer tube with a hole is higher. The Inconel 690 heat transfer tube has better fatigue performance.

1. Introduction

Inconel 690 heat transfer tubes, with excellent heat transfer performance, have been widely used in nuclear steam generators, ultra-supercritical boilers, and other important equipment in nuclear power plants. Under the action of fluid excitation, these heat exchange devices are prone to cause vibration of the heat transfer tube, resulting in the fatigue fracture failure of heat transfer tubes [1,2]. Moreover, the heat transfer tube is subject to many degradation mechanisms, e.g., corrosion, wear, and fatigue. A large number of studies focused on the corrosion behaviour of tube materials with service conditions, i.e., high temperature and high pressure water. It should be noted that fatigue failure of tubes must be considered during the design and operation of steam generators. Fatigue design curve is necessary to conduct the fatigue design of tubes, which is usually derived from large tests of similar materials under atmospheric environment. To consider the effect of corrosion degeneration, a correction factor is usually adopted to revise the fatigue life under atmospheric [3,4]. Therefore, it is necessary to perform fatigue tests for tubes.
The Inconel 690 heat transfer tube for nuclear steam generators is a uniform thin-walled tube structure with a diameter of Ø17.48 mm and a wall thickness of only 1 mm. If the fatigue test is performed directly with the actual thinned wall tube, the stress concentration will easily occur in the clamping ends leading to fatigue failure [5]. Thus, the obtained fatigue life is not the actual fatigue life of the heat transfer tube. To resolve this issue, we tried several tube specimens to carry out fatigue tests. In this work, an attempt by tube specimens with holes was made to deduce fatigue life for tube based on the notch fatigue life prediction technology.
Some prediction models for the notch effect on fatigue live had been proposed to evaluate the fatigue life of components with notches. Generally, an effective parameter is introduced to link the fatigue lives between the notch and smooth specimens, such as the local stress-strain method [6,7,8,9,10], the critical distance method [11,12], and stress field strength method [13,14,15]. One of the most popular methods to analyse notch fatigue problems was formulated by Neuber, who stated that the geometric mean value of both the stress and strain concentration factors is constant at any load state, and equals the elastic stress concentration factor [16]. This method has not only been successfully applied to a wide range of engineering problems (e.g., [17,18,19]) but among the fatigue life assessment methods recommended by the International Institute of Welding [9].
In this study, a notched specimen of Inconel 690 heat transfer tube was designed and tested under cyclic loading. Based on the finite element analysis, the local stress and strain distributions around the notch are obtained and compared with Neuber’s ruler. The fatigue life curve of Inconel 690 material is used to estimate the fatigue life of tubular specimens with hole based on local strain according to Neuber’s ruler. The fatigue life is verified by the test results. In our experiments, the fatigue life prediction method for heat transfer tubes provides a basis for engineering design assessment.

2. Experimental Procedure and Results

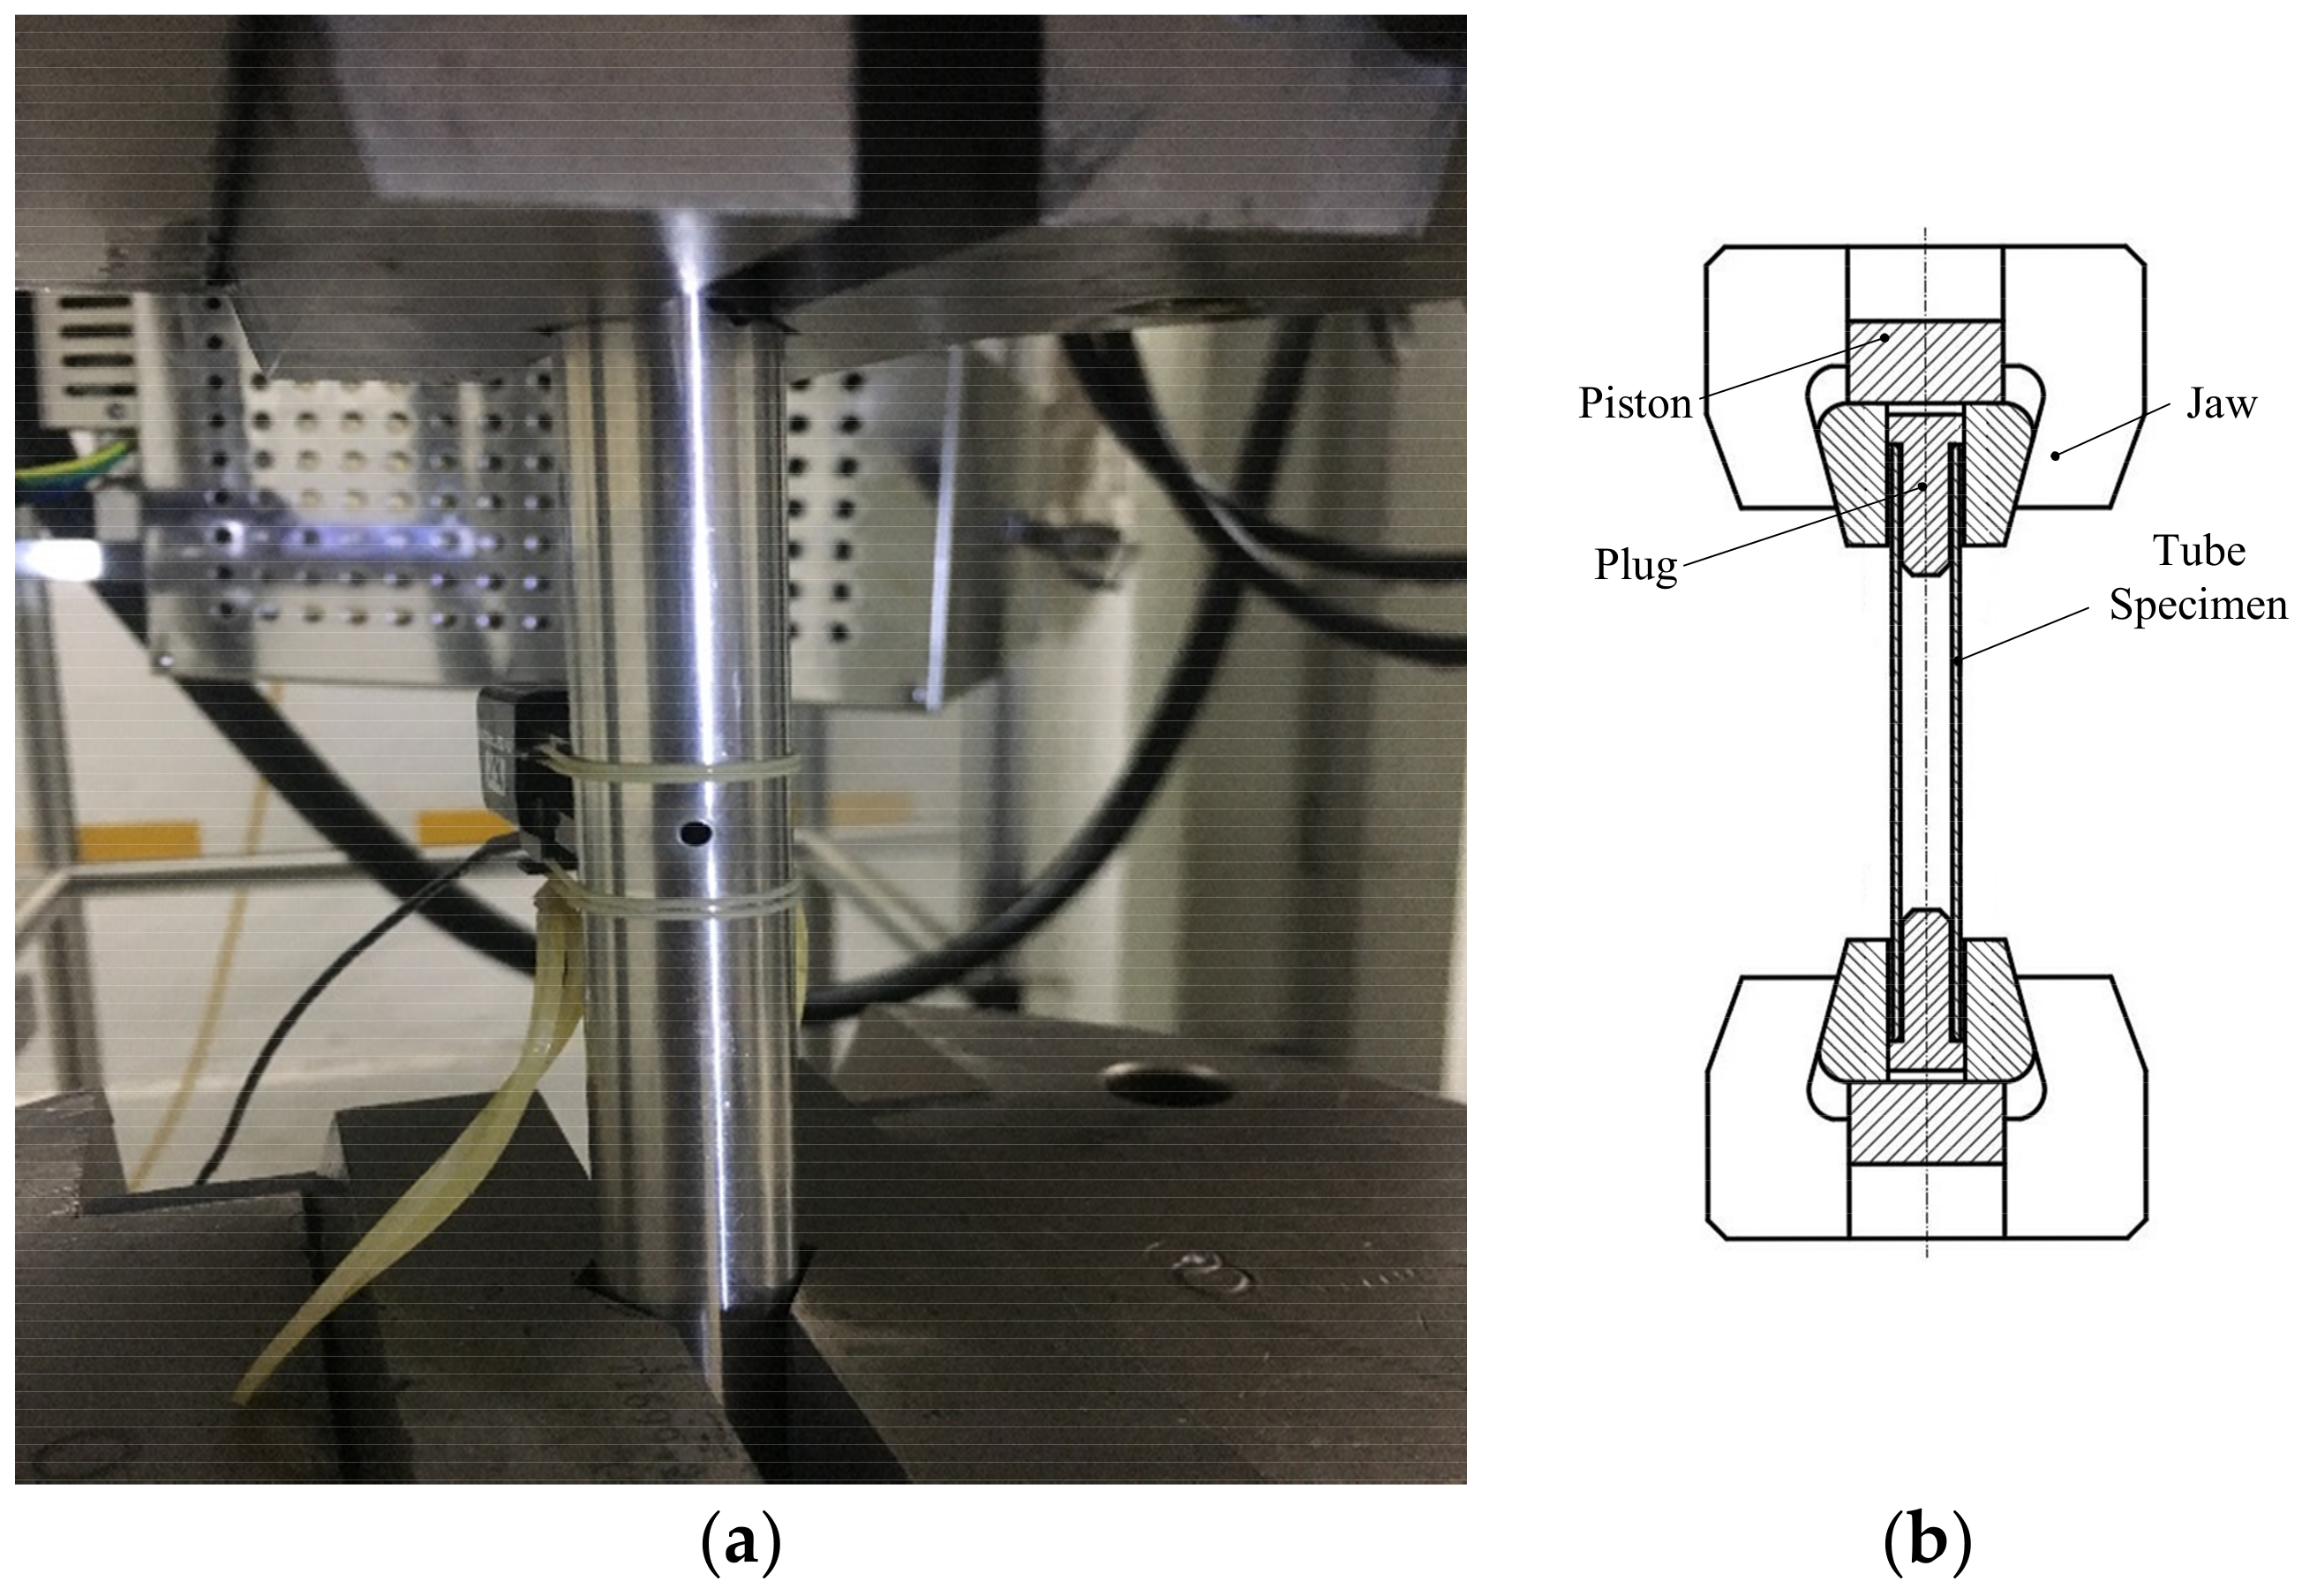
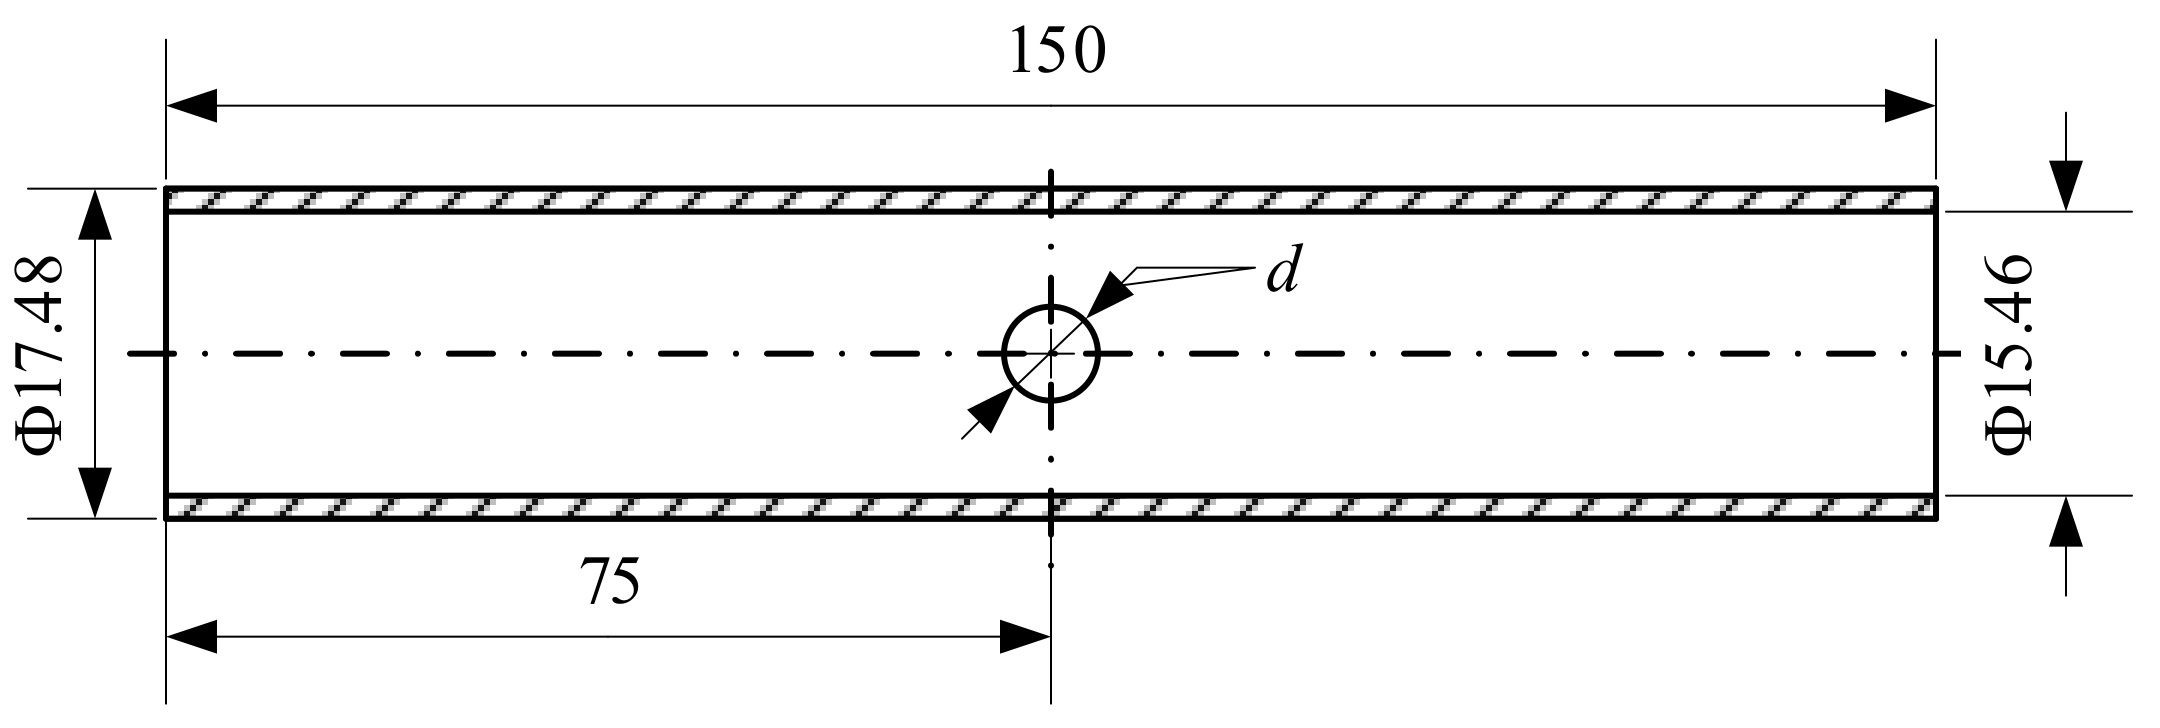
2.1. Experimental Procedure

The chemical composition of Inconel 690 alloy thin-walled tube commonly used in nuclear power steam generators is shown in Table 1, and the mechanical properties are given in Table 2.
The specimen was directly taken from the straight tube section of the steam generator tube with the outer diameter of 17.48 mm and a wall thickness of only 1.01 mm. The detailed specifications of the sample are shown in Figure 1. The length of the specimen is 150 mm, a through hole with different diameters (d = 2 mm and 4 mm) in the middle of tube were made, as shown in Figure 1.
The tests were carried out on the Intsron 8802 hydraulic servo fatigue testing machine (Illinois Tool Works Inc., Norwood, MA, USA) under the stress control mode and strain control mode respectively. The test rig is shown in Figure 2a. To avoid the deformation due to the clamping, a plug is designed and inserted the tube, as shown in Figure 2b. In both stress control and strain control, symmetrical loading is adopted, that is, the stress ratio is −1.

2.2. Results and Analysis

The test results for the tube specimens with holes under different cyclic loadings are shown in Table 3. For the strain control test, the fatigue life is the number of cycles when the load decreases by 5%, while the fatigue life for the stress control test is the number of cycles corresponding to a 5% increase in displacement.
For a hole in tubular specimens, the fatigue cracks initiate on the hole edge and extend perpendicular to the axial direction. In the thickness direction, the crack surface exhibits different angles with the crack growth, as shown in Figure 3. Figure 3a gives a macroscopic view of the crack which is perpendicular to the loading direction. Figure 3b shows the fracture appearance near the hole and a diagrammatic sketch is drawn in Figure 3c. It can be observed that the crack initiates on the plane of maximum shear stress and is at an angle to the diameter of the hole. The crack initiation is on the plane of maximum shear stress and is at a certain angle to the radial direction of the hole. As the crack propagates, the effect of the hole is weaker and the crack tip tends to be in a planar stress state. Therefore, in the region far from the hole, a sharp oblique fracture is exhibited. Thus, the fracture can be divided into three regions. The first region, from the edge of the notch to the blue line, corresponds to crack formation on maximum shear plane where slip occurs. The fracture surface in the first region presents a plane with normal at 45° to the specimen axial. As the crack propagates, the effect of the notch is weaker and the stress state is changed. The normal of crack face is switching with the stress state, as shown in the section region between the blue line and green line. When the crack continues propagating, a third region is displayed with slant appearance. In this region, notch effect can be ignored, which is similar with smooth specimen. In addition, a microscopic morphology appears fatigue striations, as shown in Figure 3d.

3. Evaluation of Stress and Strain near the Hole

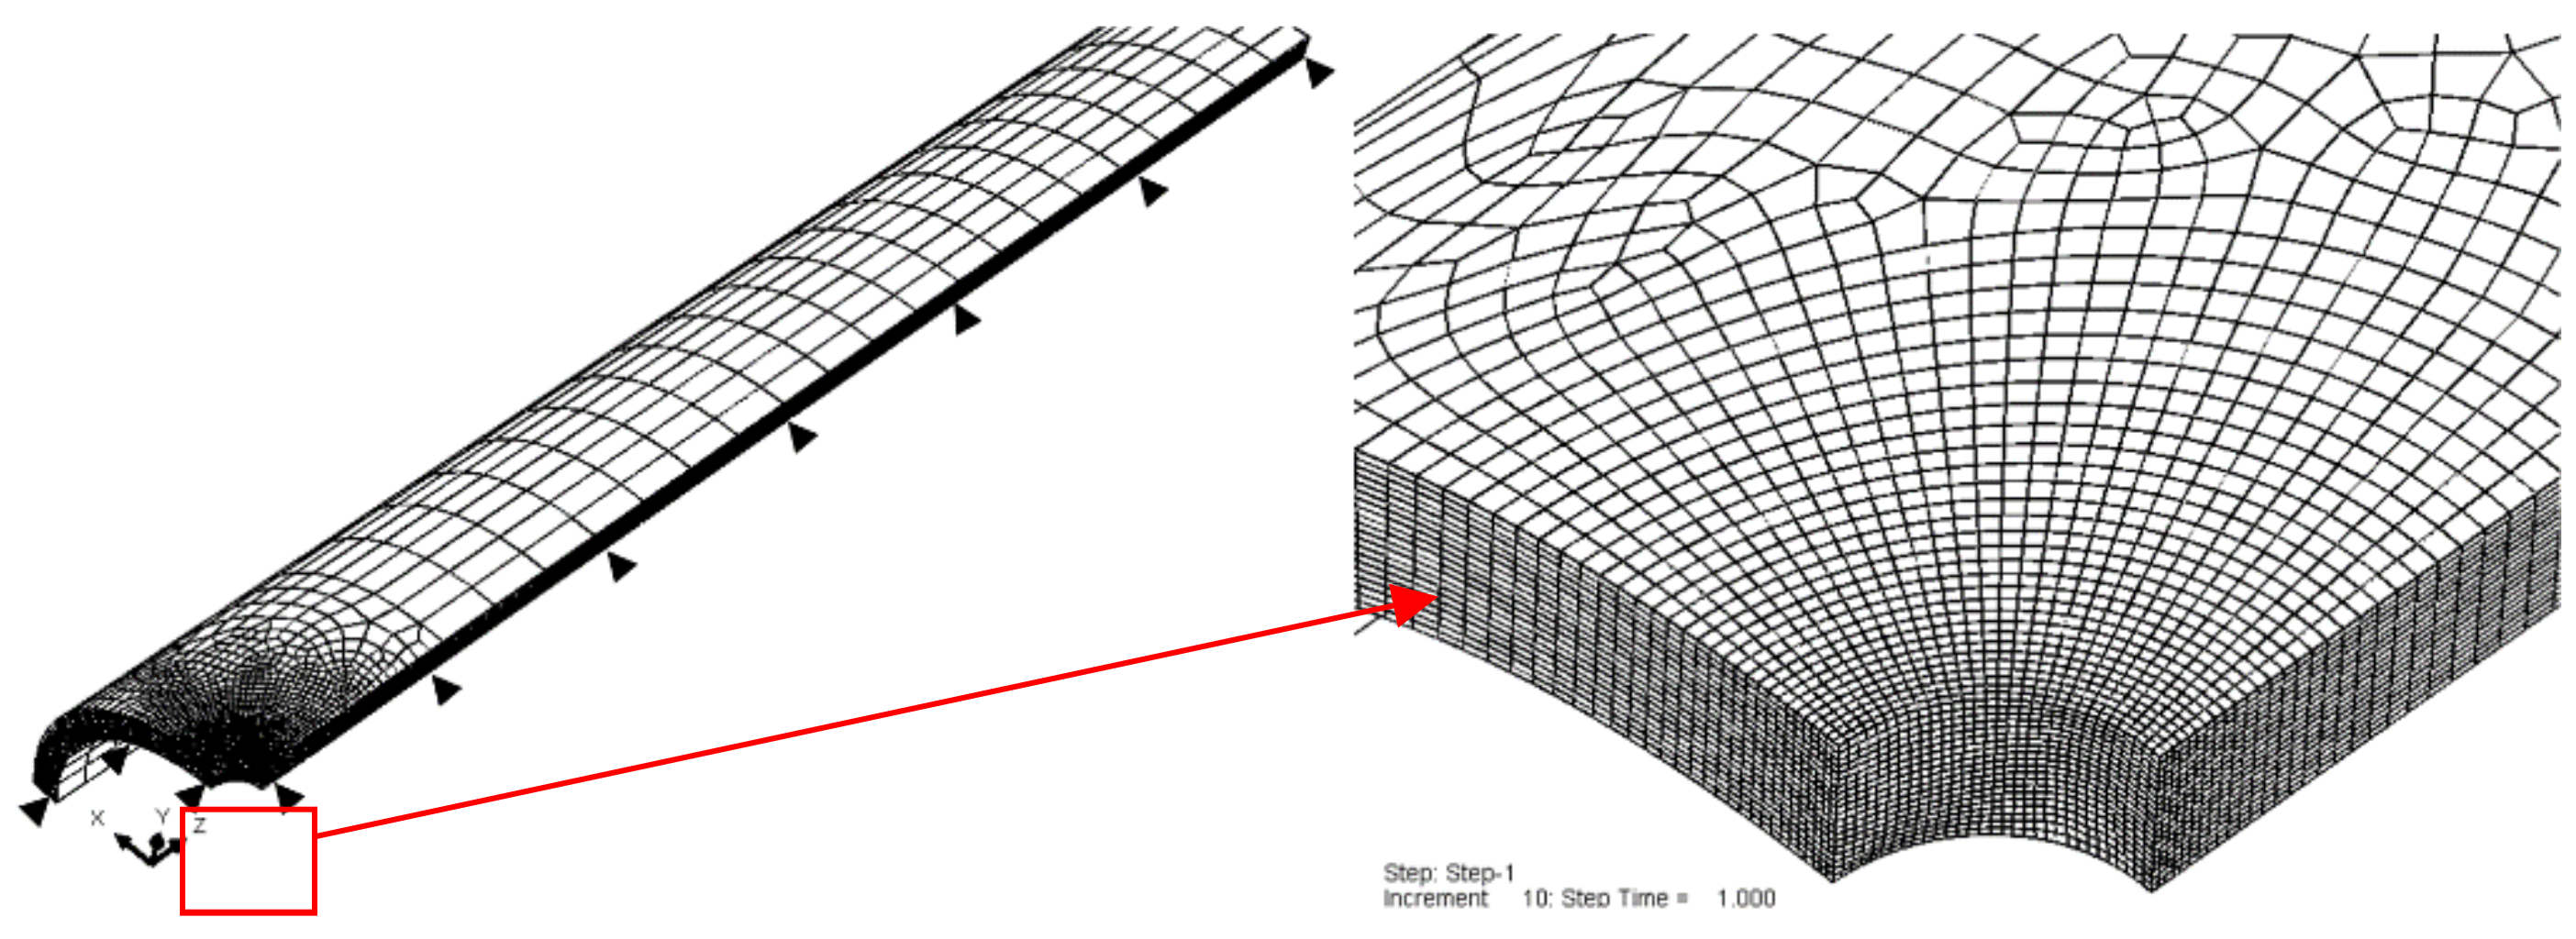
3.1. Finite Element Model

According to the symmetry, a 1/8 model of the notched specimen was constructed using finite element software ABAQUS (Dassault Systèmes, version 6.12, Vélizy-Villacoublay Cedex, France). 20-node hexahedral element C3D20R was selected. Consider the stress concentration at the root of the notch, local refinement of the area near the notch was conducted, as shown in Figure 4. The element size along the notch is about 0.04 mm × 0.05 mm × 0.05 mm. Symmetric boundaries are applied to the three symmetric planes of the model, and pressure load is applied to one end of the tube.
In order to obtain the local stress-strain state around the notch, elastic analysis and elastoplastic analysis were carried out respectively. Meanwhile, the cyclic stress-strain relation of material for elastoplastic analysis is described by Ramberg-Osgood model [20]:
Δ ε 2 = Δ σ 2 E + Δ σ 2 K 1 / n
where the cyclic strength coefficient K’ = 424.92 MPa, the cyclic strain-hardening exponent n’ = 0.129.

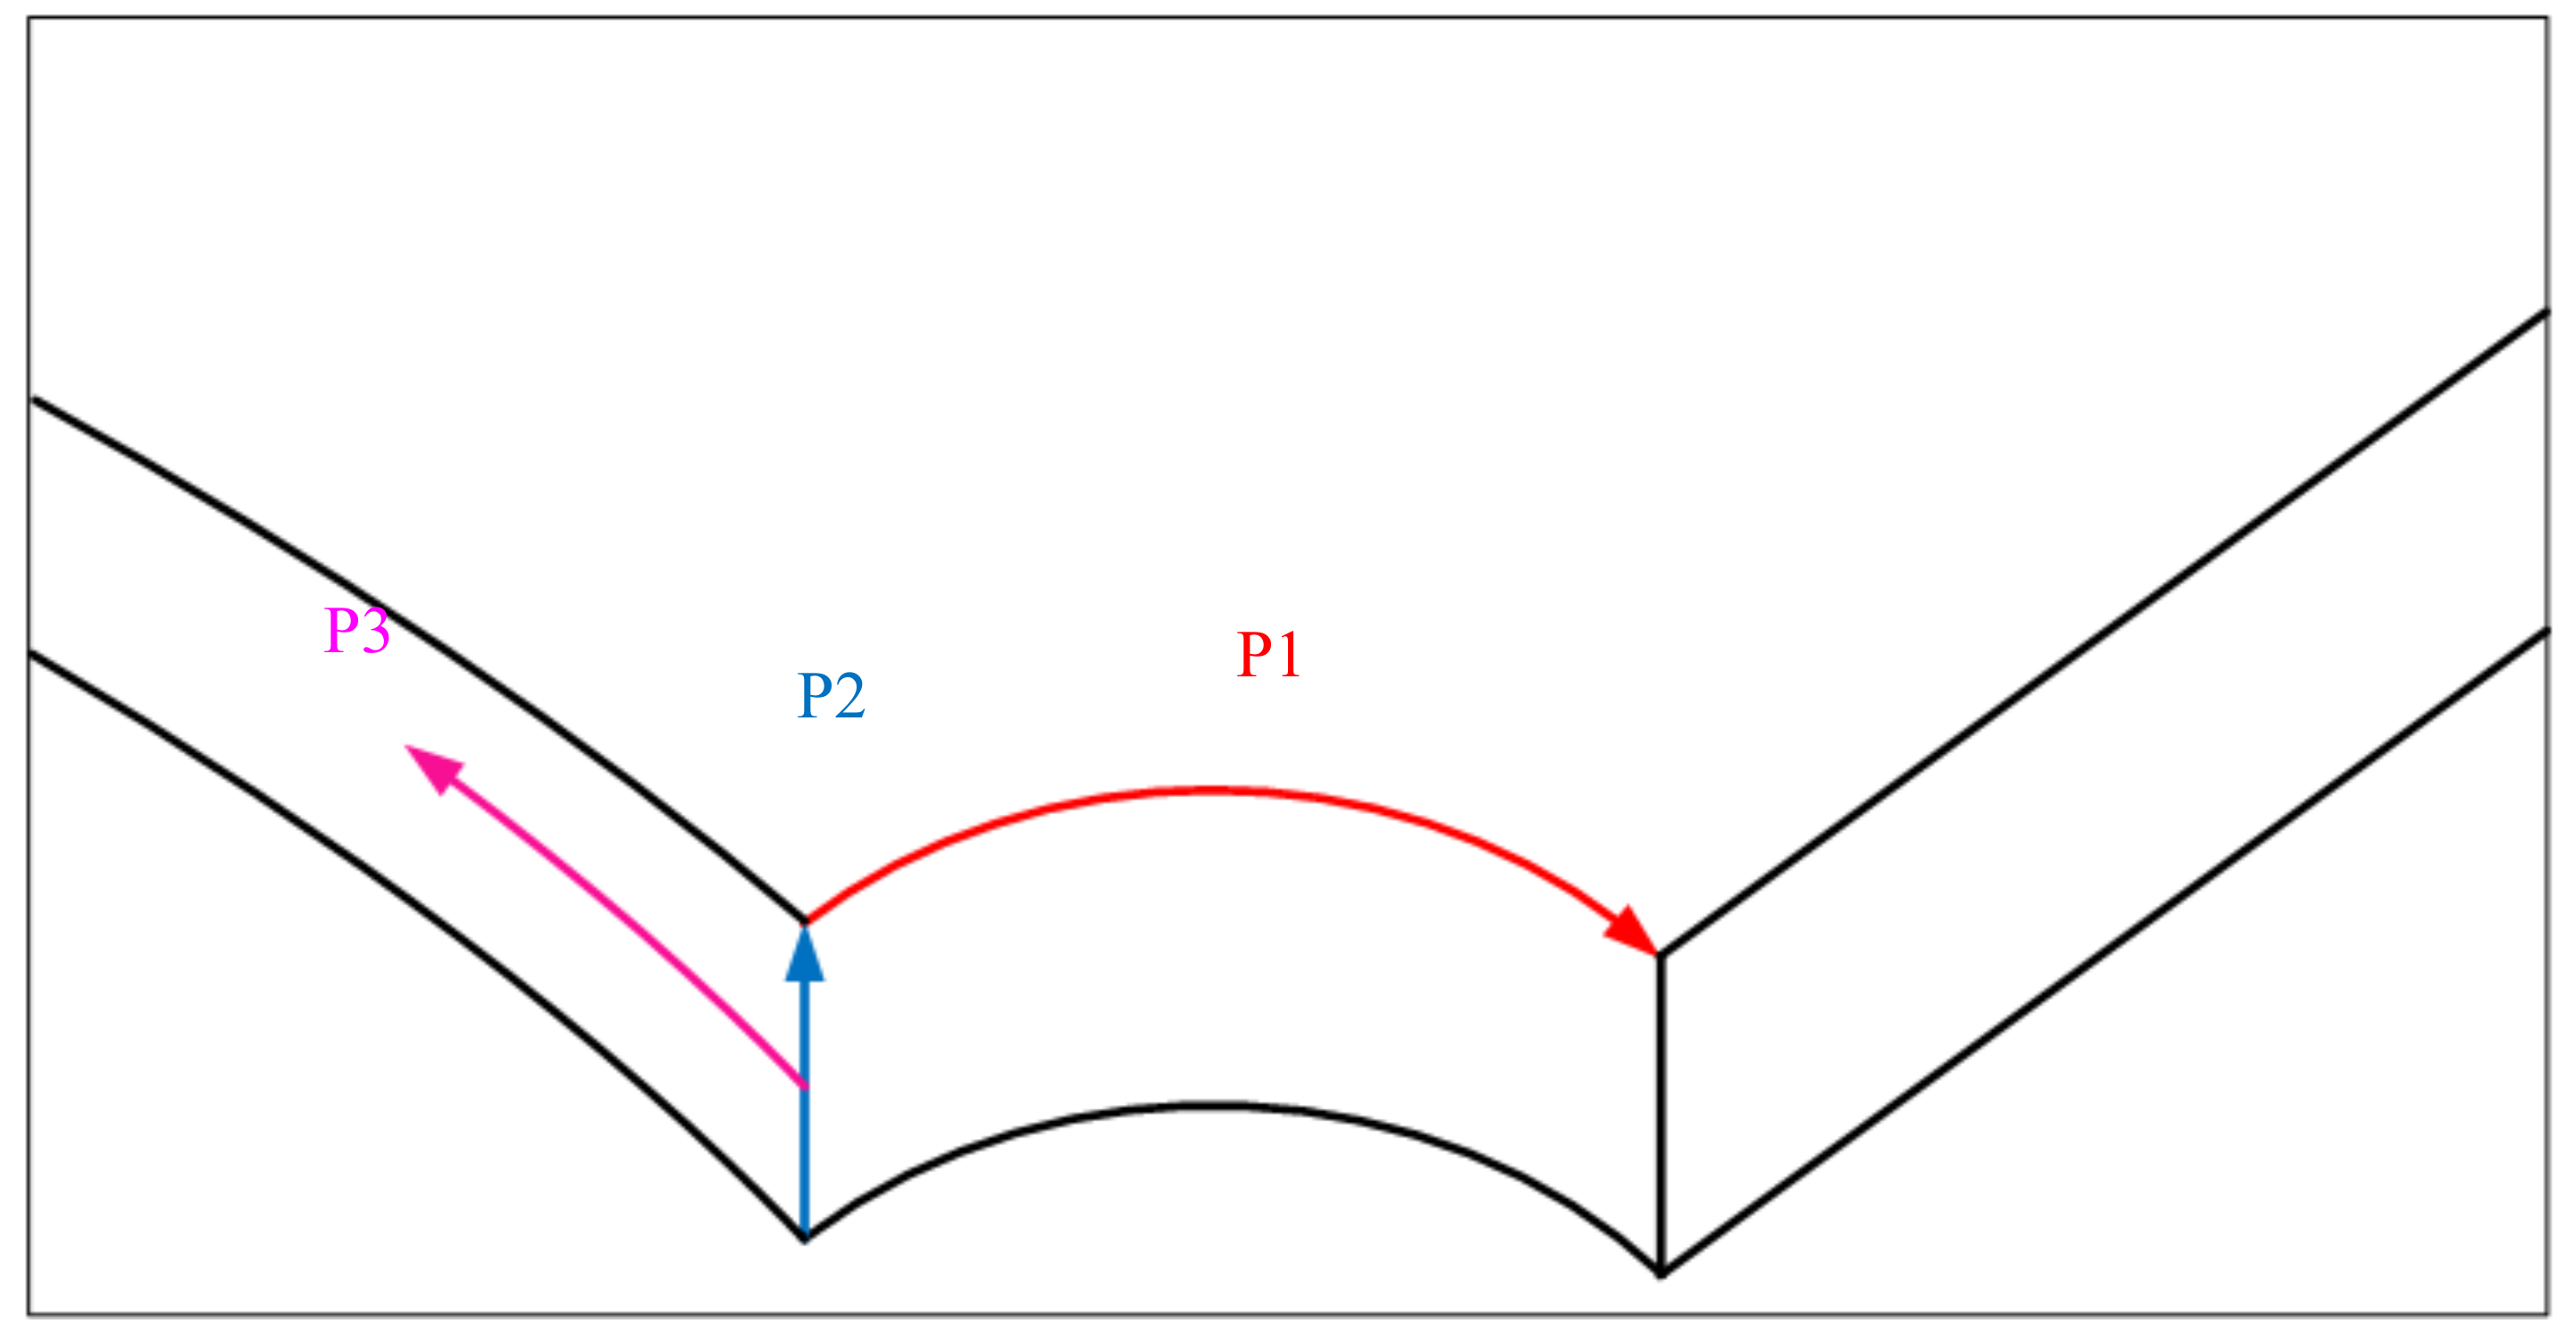
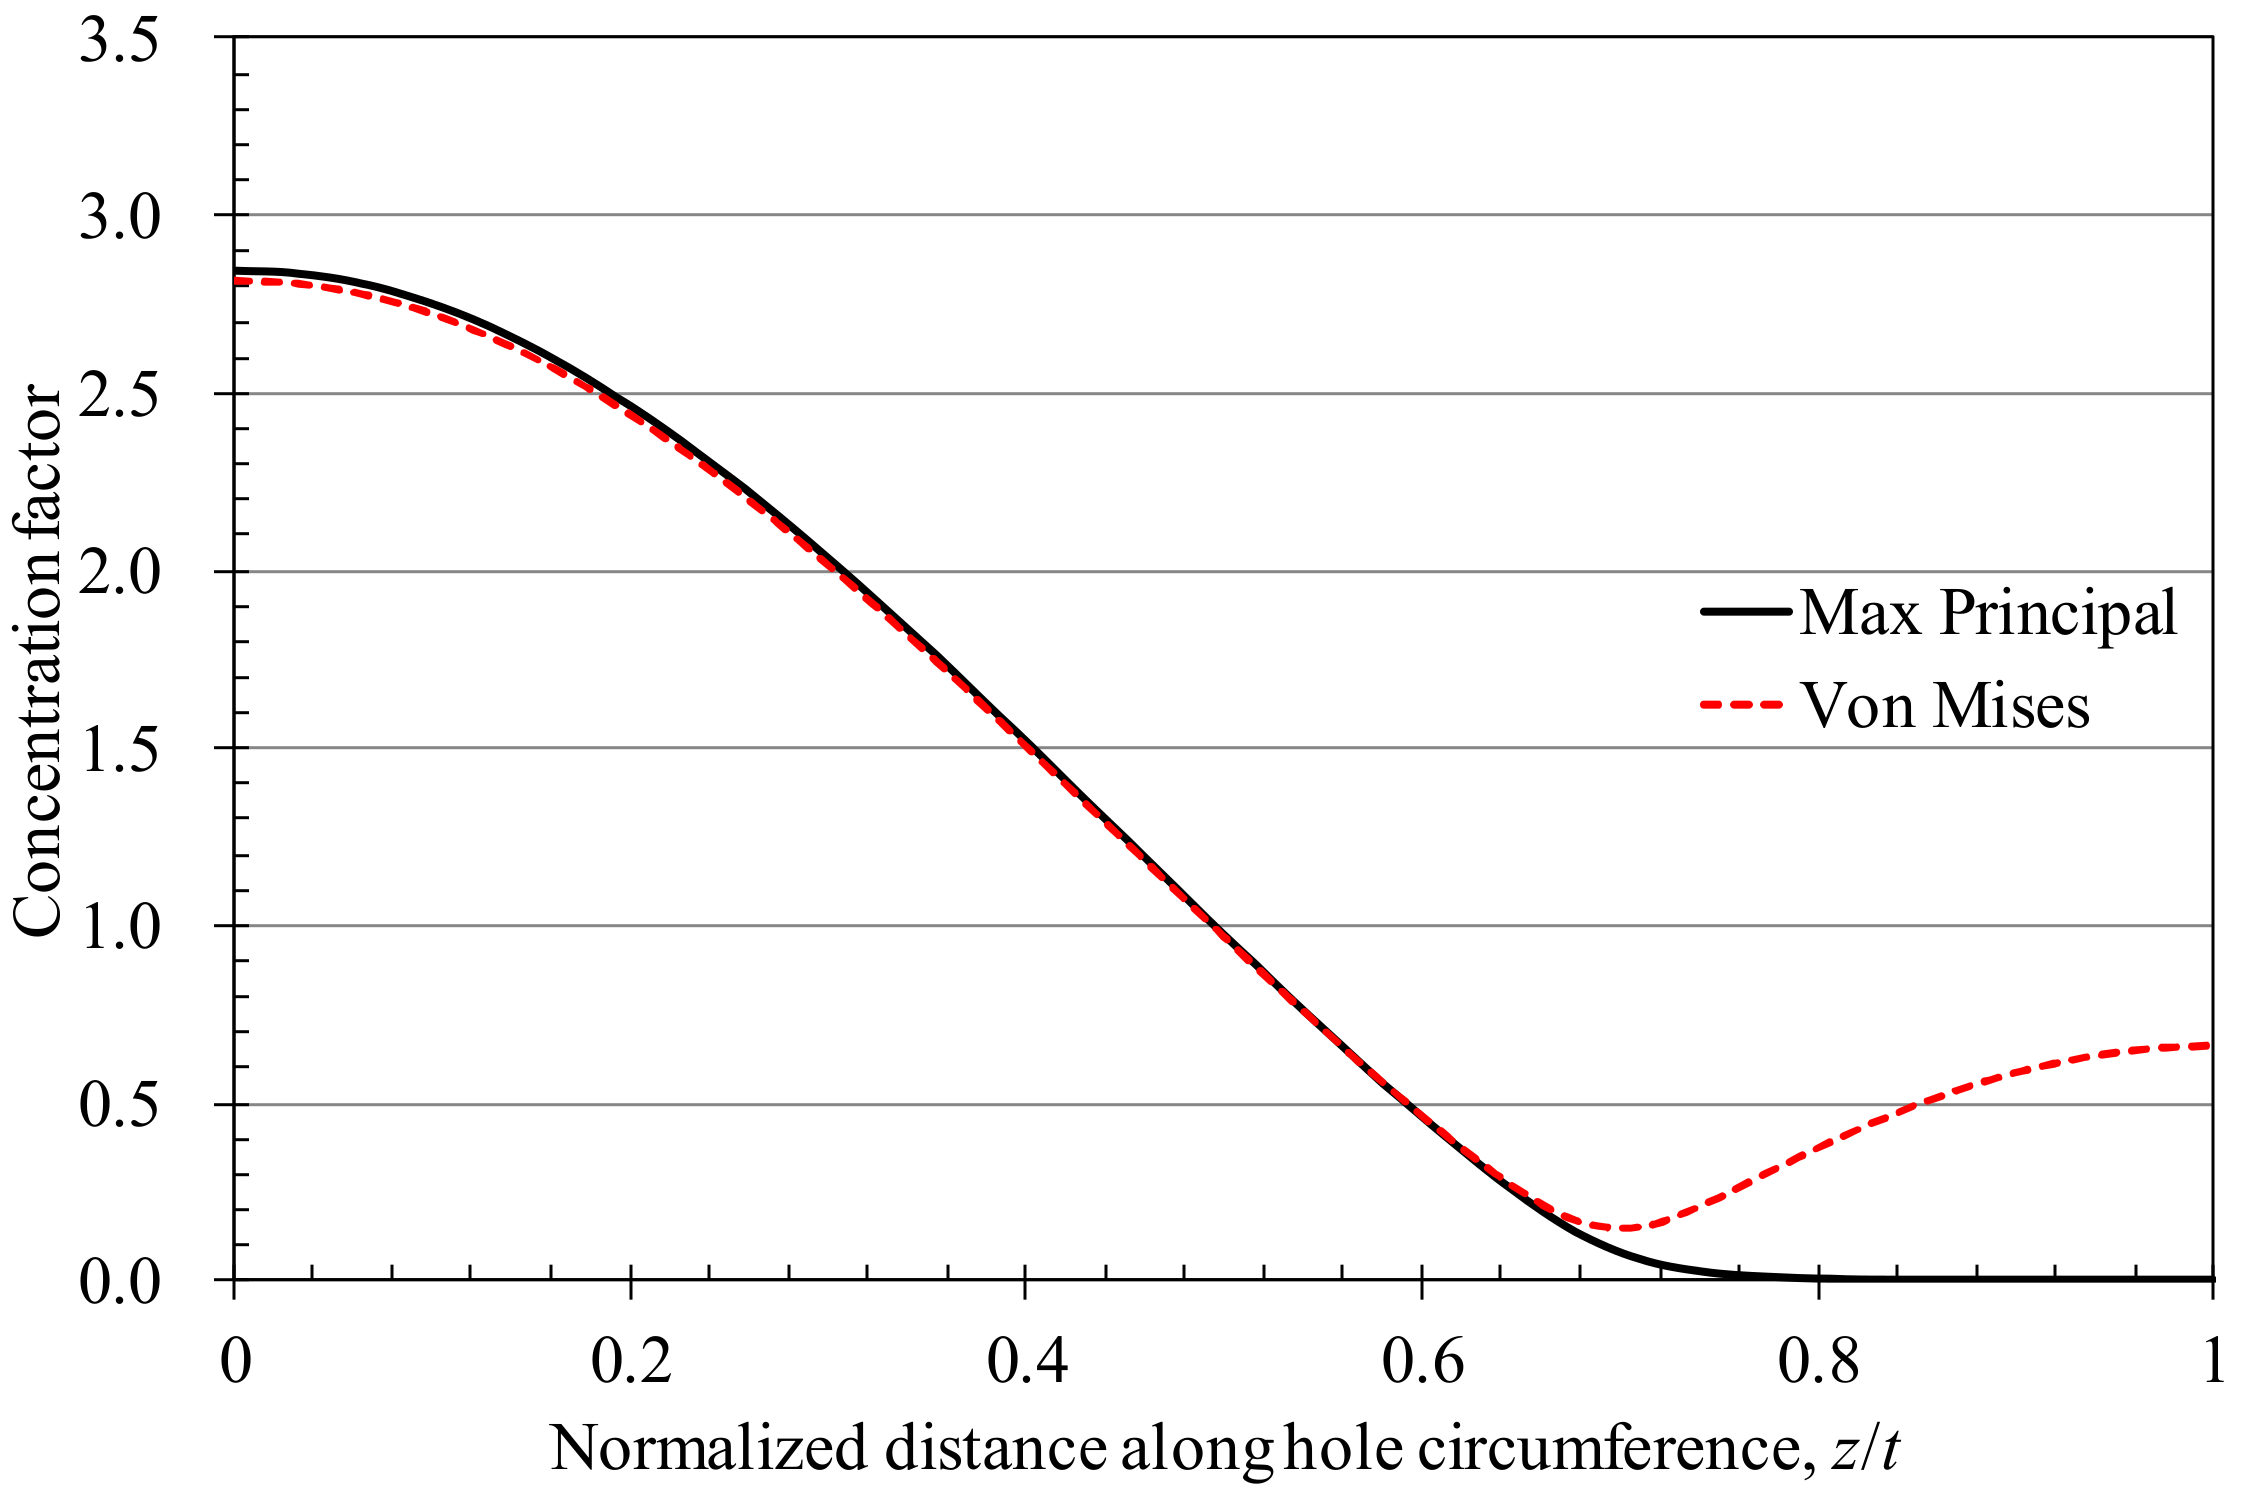
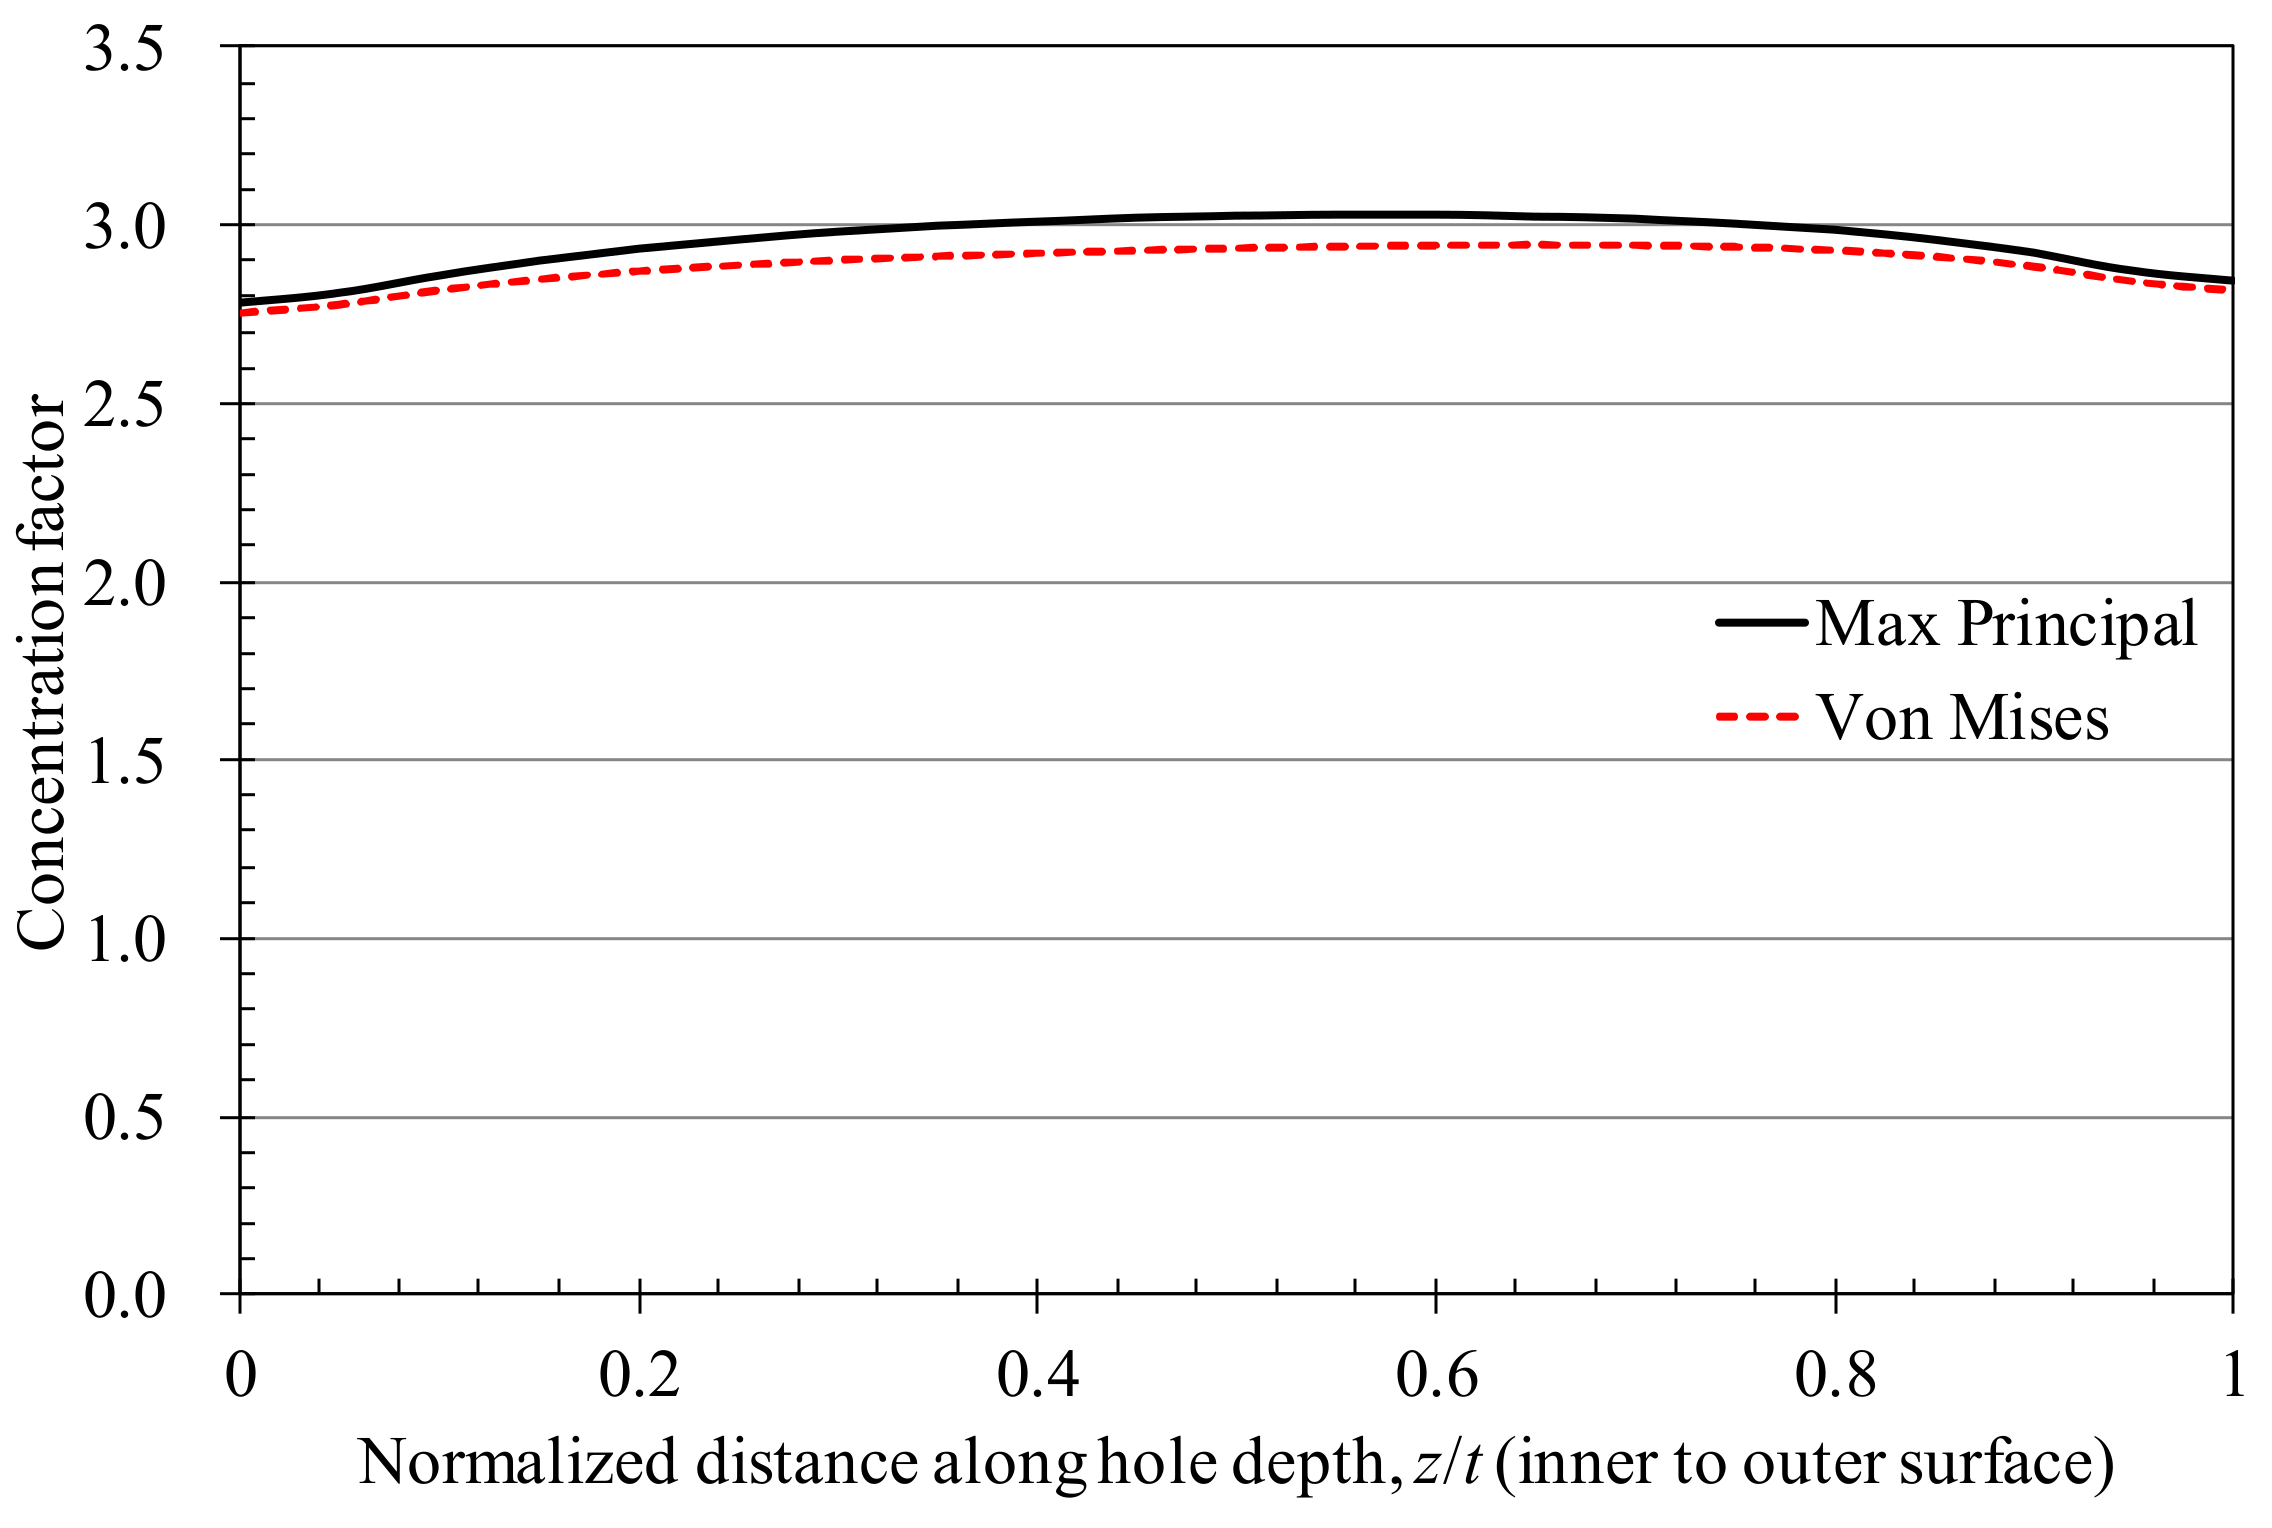
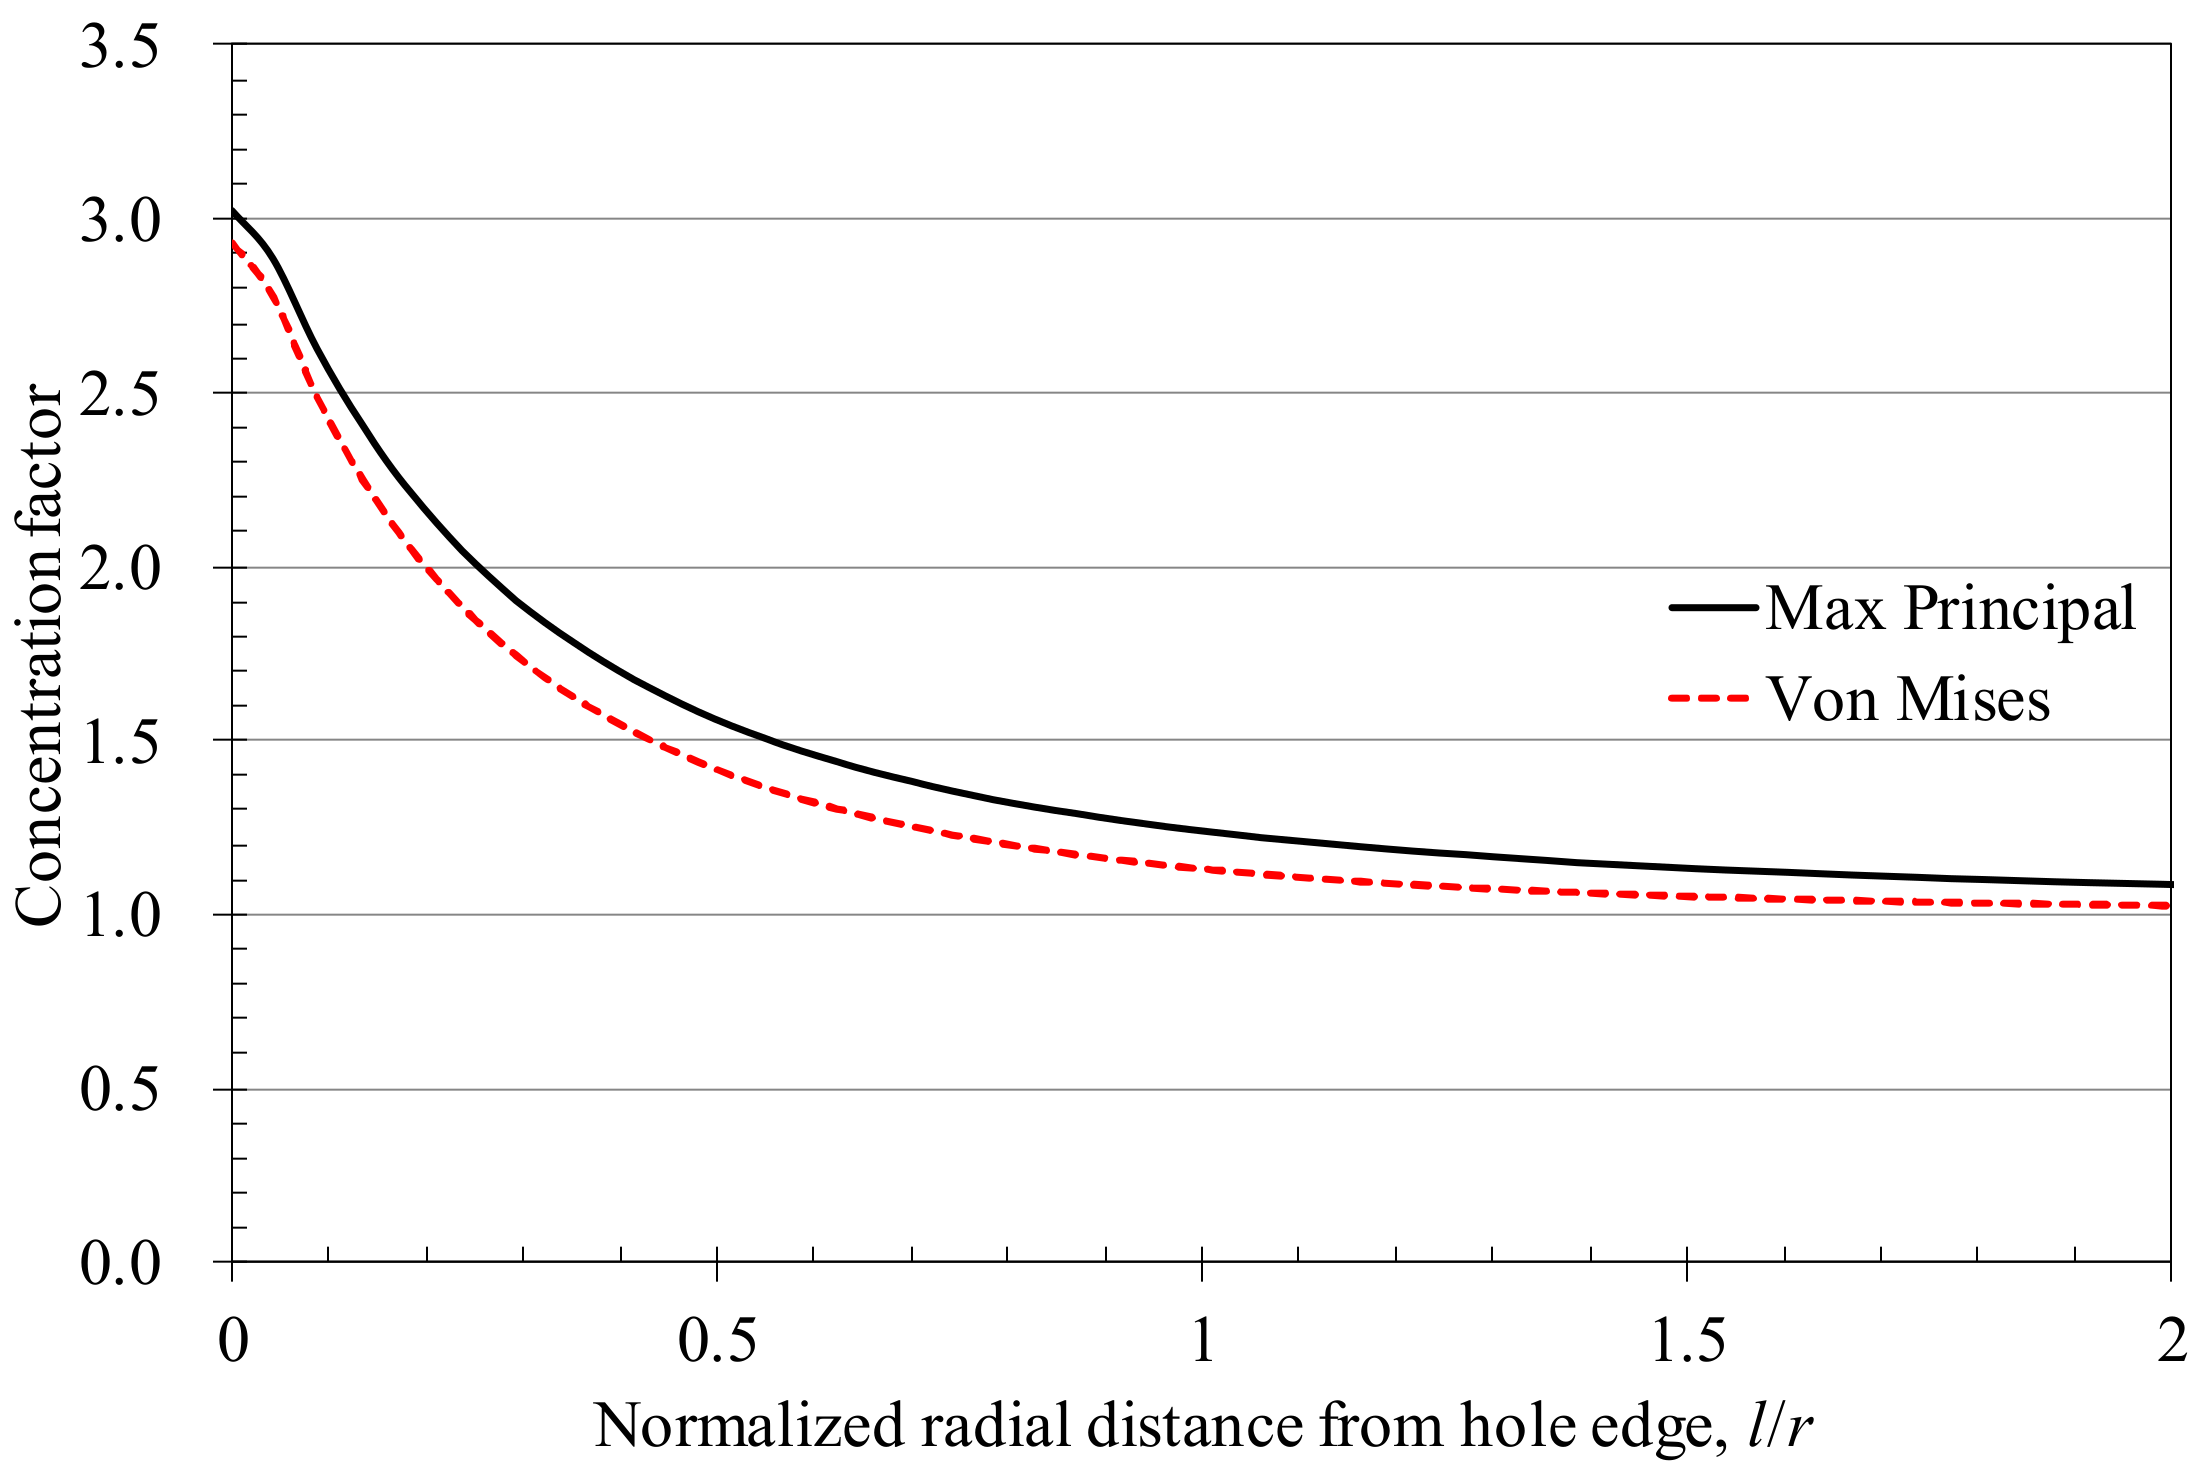
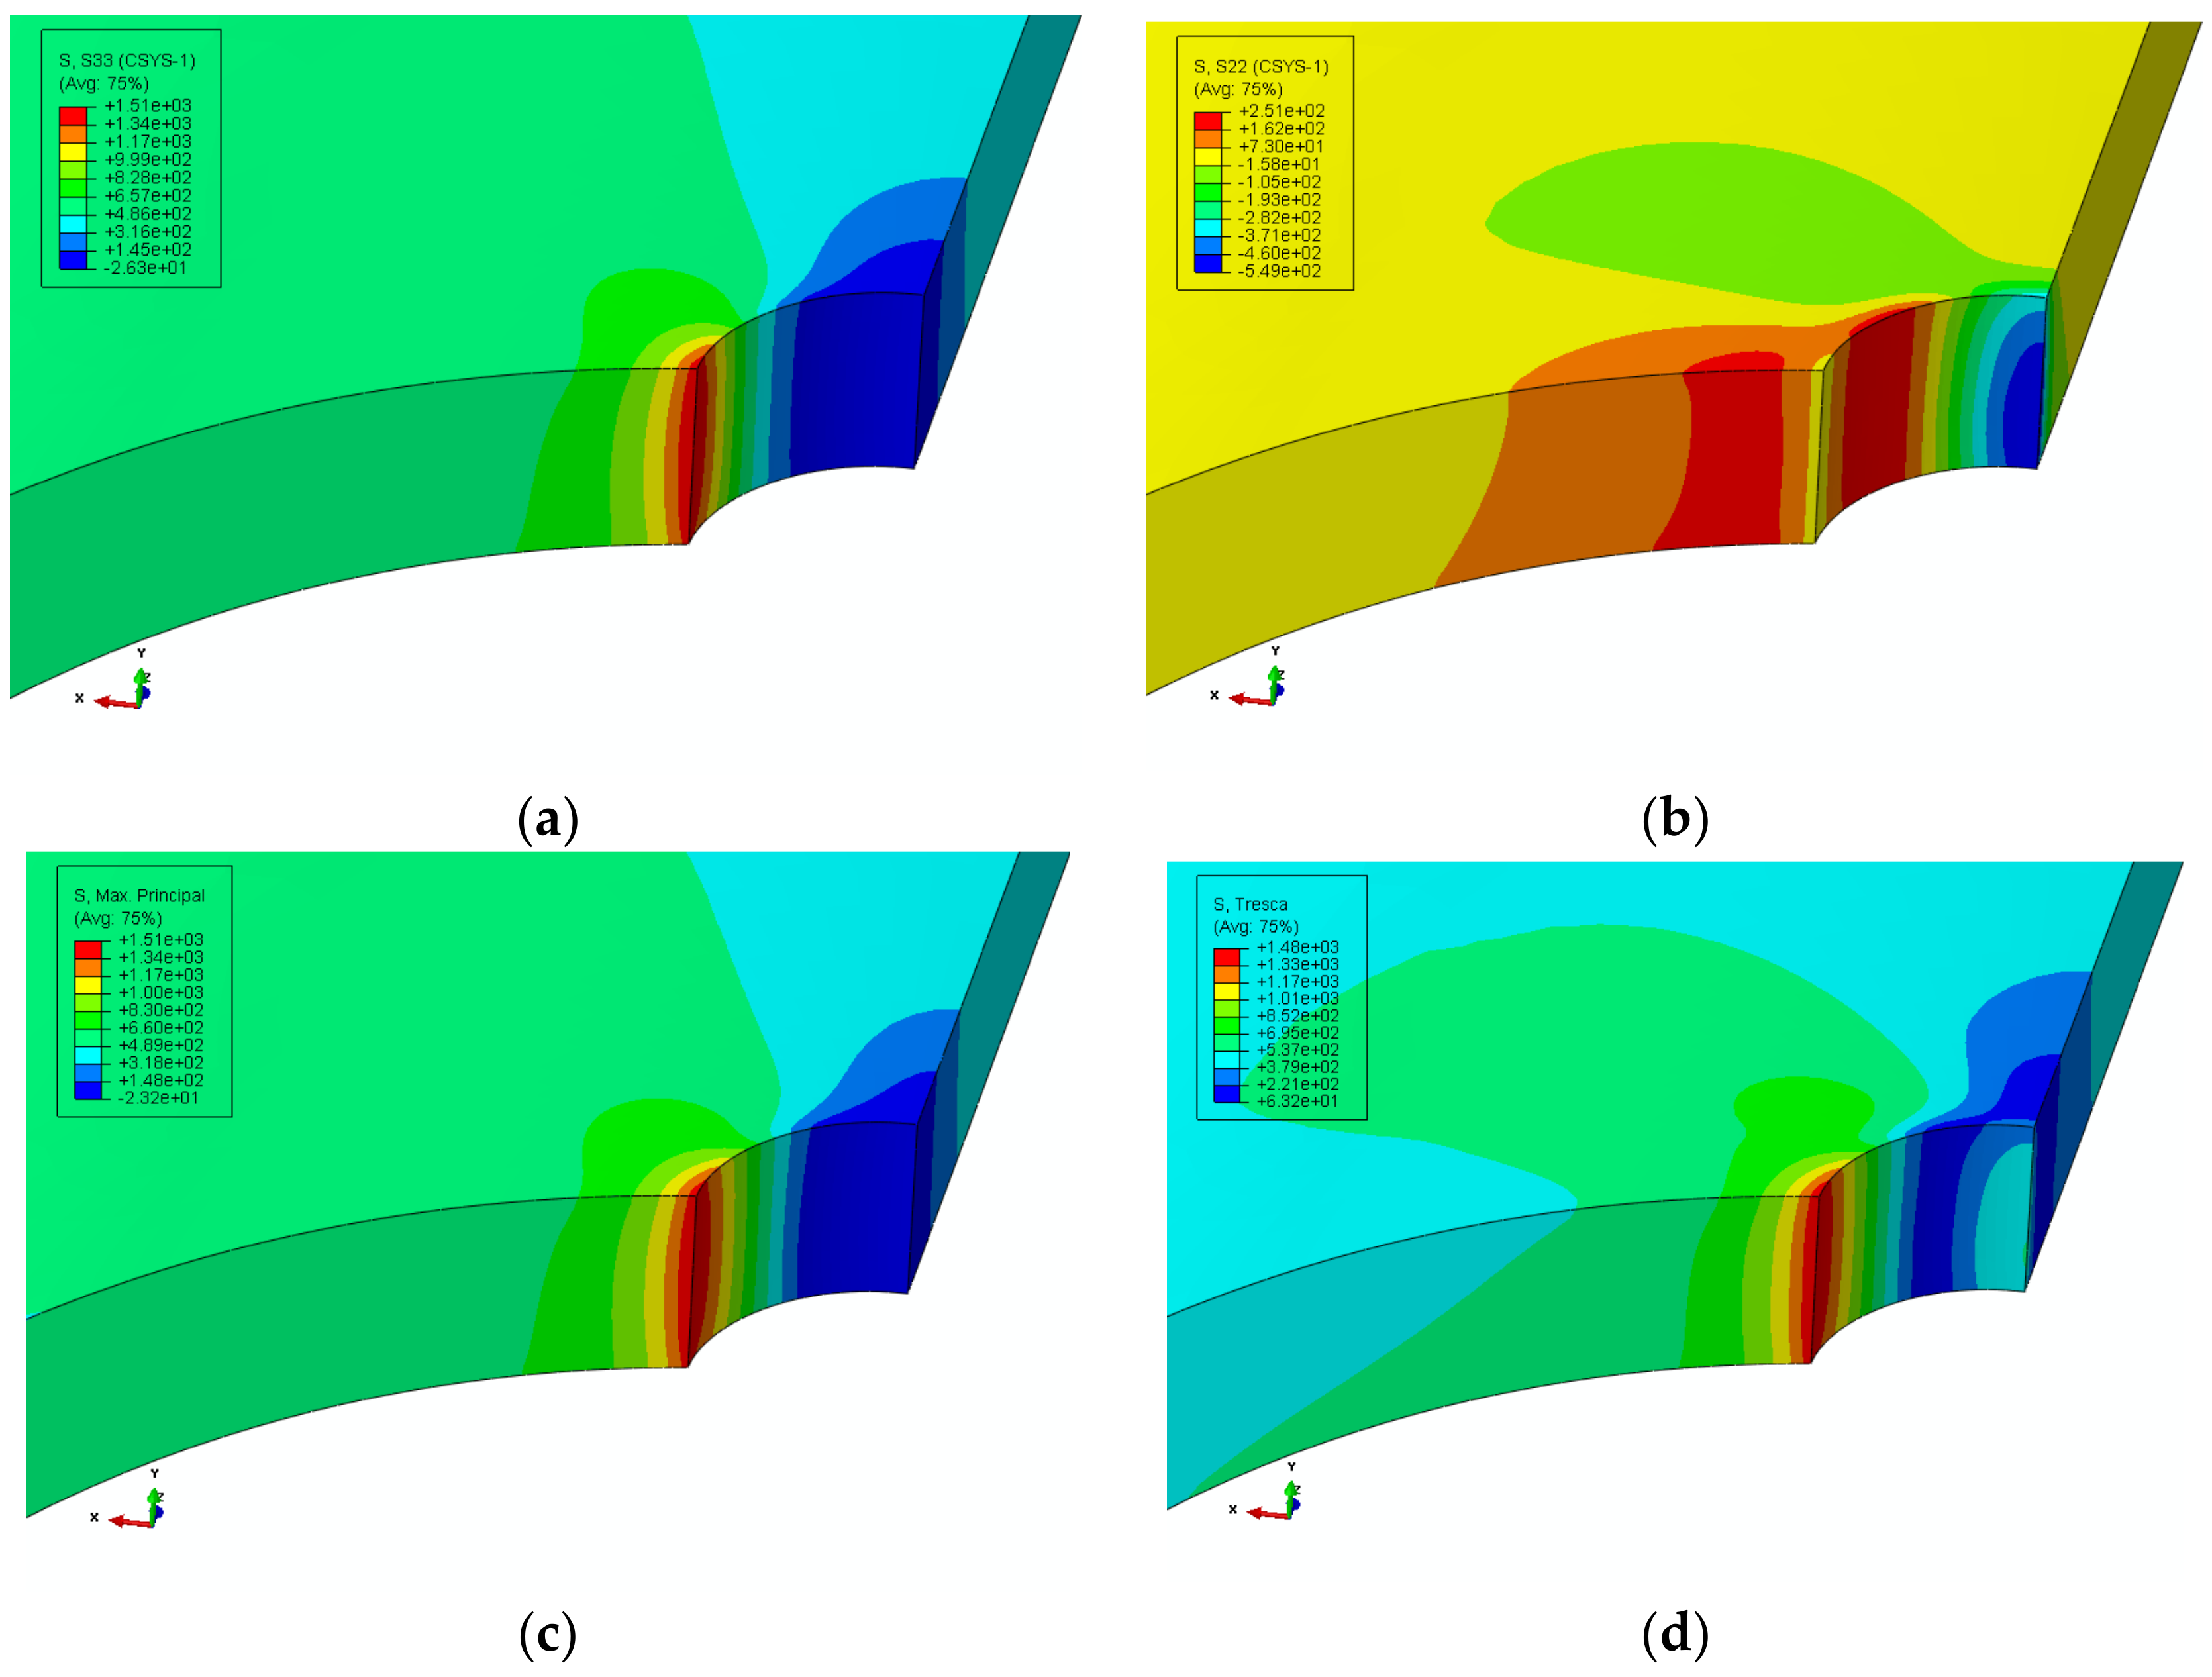
3.2. Elastic Analysis

The elastic stress concentration factor is one of the important parameters in the local stress-strain method to estimate the fatigue life of notched specimens. Therefore, the elastic finite element analysis of the thin-walled tube with hole is carried out. To investigate the local stress-strain, three paths are defined as shown in Figure 5. Path P1 locates at the external surface along the circumference of the hole, while P2 locates at the hole edge along the wall and P3 on the mid-thickness wall along the radial path of the hole. The stress distributions on different paths are obtained. In the analysis, the stress concentration factor, which is the ratio of stress level to applied stress, is used to describe the stress field.
The equivalent stress and maximum principal stress distribution along the outer circumference on the tube wall (P1 path in Figure 5) are shown in Figure 6. As shown in Figure 6, the stress concentration is perpendicular to the load direction, i.e., the 0° position in the figure. At this position, the stress distribution in the wall thickness direction (P2 path in Figure 5) is shown in Figure 7. Due to the constraint effect [21], the maximum stress appears in the middle of the thickness, which is more than about 7% above the surface stress. At this stage, the fatigue damage in the middle portion of the wall thickness is the highest. From the fracture results of the specimen, it can be found that the crack initiation source of most of the specimens is in the middle of the thickness of the hole edge.
Figure 8 shows the stress distribution along the radial path of the hole (P3 path in Figure 3). In the figure, r is the radius of the hole. The stress decreases with the radial distance from the hole edge. However, the stress tends to be stable beyond a certain length. The difference between the Mises stress and the maximum principal stress shows a trend of increasing initially then decreasing. The greater the difference between the two, the more obvious the stress triaxiality. When the two are equal, the structure is in a uniaxial stress state. For a thin-walled tube, if the stress in the thickness direction is ignored, it would be in a plane stress state.
In the cylindrical coordinate system, the stress state at a point of the tube can be simplified as two-dimensions plane stress with axial stress, hoop stress and shear stress. Under axial loading, the maximum principal stress closely approximates the axial stress, which usually independents with the tube thickness, as shown in Figure 9. However, the hoop stress presents much more correlatively with thickness than the two other component stresses. Further, the directions of maximum shear stress change with the hoop stress component. The values of maximum shear stress near the inner surface are higher than the external surface. This phenomenon results in a more serious fatigue damage to the region of inner surface, initiating a crack easily. For the region away from notch, the stress state tends to be uniaxial. Therefore, there is a transition region for the maximum shear stress. This is consistent with the formation mechanism of the three-region-fracture from the stress state of the hole.

3.3. Elastoplastic Analysis

In the notched fatigue analysis, the precise local stress-strain field is the key to predicting the fatigue life of the notch. For materials, stress concentration is likely to occur near the notch which may exceed the yield strength of the material. Therefore, the elastoplastic analysis can describe local stress-strain field more accurately.
In the analysis, the Neuber’s formula is also used to calculate the local stress-strain of the notch and predict the fatigue life of the notched component. The Neuber’s formula [22,23] can be expressed as:
ε q σ q = K tq 2 S 2 E E e * S *
where σq and εq are local equivalent stresses and strains, Ktq is the equivalent elastic stress concentration factor, S* and e* are plastically corrected nominal stresses and nominal strains, E is the elastic modulus, and S is the elastic nominal stress. The asterisked nominal stress and strain are corrected for nominally inelastic loadings, which are not considered in this work as the nominally applied stress is lower than the yield strength. Figure 10 compares the local equivalent strain as functions of nominal stress estimated with elastoplastic finite element analysis and Neuber’s formula. As shown in Figure 10, the estimation is basically consistent with the finite element calculation result with an error less than 6%. In this work, the Neuber’s method is also used to analyse the local stress-strain of the notch to estimate the fatigue life.

4. Fatigue Life Analysis

Based on the cyclic stress and strain curve of materials, local equivalent strain of structure is calculated by elastoplastic finite element analysis and estimation method. The fatigue life of structure is estimated by strain fatigue life curve. Based on the results of finite element analysis, Neuber’s method can be used to predict the local strain in the linear elastic range. Therefore, Neuber’s formula is used to estimate the equivalent strain of the notch structure. In order to interpret notch effect on fatigue life, the elastic stress concentration coefficient is revised to the fatigue notch coefficient Kf:
K f = 1 + K t 1 1 + ρ / r
where Kt is the elastic stress concentration factor, r is the notch radius, and ρ is the material characteristic length. The material characteristic length can be estimated on the ultimate tensile strength σu of alloy by the following empirical relation [24,25]:
log ρ = σ u 134 586
According to the tension properties of the tube, one can obtain ρ = 0.11 mm. The elastic stress concentration factor is obtained by elastic finite element analysis as described in Section 3.2, where Kt = 2.94 for d = 2 mm and Kt = 3.54 for d = 4 mm. Combining Equations (1) and (2), the local equivalent strain near the hole can be obtained by replacing equivalent elastic stress concentration factor Ktq with fatigue notch coefficient Kf. Then, the equivalent strain amplitude εa of the smooth tube can be calculated.
Figure 11 shows the equivalent strain amplitude for the test samples. Moreover, the strain fatigue life curve of nickel-base alloy materials is also plotted. The strain fatigue life curve is described with Langer equation [26]:
ε a = 14.967 N f 0 . 4053 + 0.0805
which is usually used in the codes and standards for fatigue assessment of components containing pressure [27]. As shown in Figure 11, the equivalent fatigue life based on the notched specimen is consistent with the material fatigue life trend. Further, the equivalent fatigue life based on the notched specimen is mostly higher than the fatigue life of the material. Figure 12 shows the difference between the life prediction values and experimental values based on the material life curve. At higher load levels, these are more consistent, that is, the low-cycle life zone based on Neuber’s method can predict the fatigue life of the heat transfer tube more accurately. However, as the fatigue life increases, the deviation between them increases. Moreover, the test value may fall outside the dispersion band of the double predicted life.
This difference may be attributed to two reasons: fatigue life prediction model itself and material fatigue life curve. (1) When the prediction method is concerned, the fatigue life prediction model based on local stress-strain is expected to conservatively predict the low-cycle fatigue behaviour of the structure. However, there are still limitation in the prediction of high-cycle fatigue. (2) The fatigue life curve of the materials used in the paper is derived from the fatigue life test results of many nickel-based alloys. It can represent the mean fatigue life of nickel-based alloy materials which may differ from the smooth tube fatigue properties referred. Actually, the predicted result of this method is conservative, i.e., the fatigue life of the smooth tube involved in this paper should be higher than the average fatigue life of the nickel-based alloy material. This also indicates that the heat transfer tubes mentioned in this work should have better fatigue properties.

5. Conclusions

Aiming at the fatigue life of Inconel 690 heat transfer tube, a thin-walled tube specimen was used and tested for fatigue life. The fatigue life of heat transfer tube was predicted and analysed based on the local stress-strain field around the hole. The conclusions are as follows:
(1)
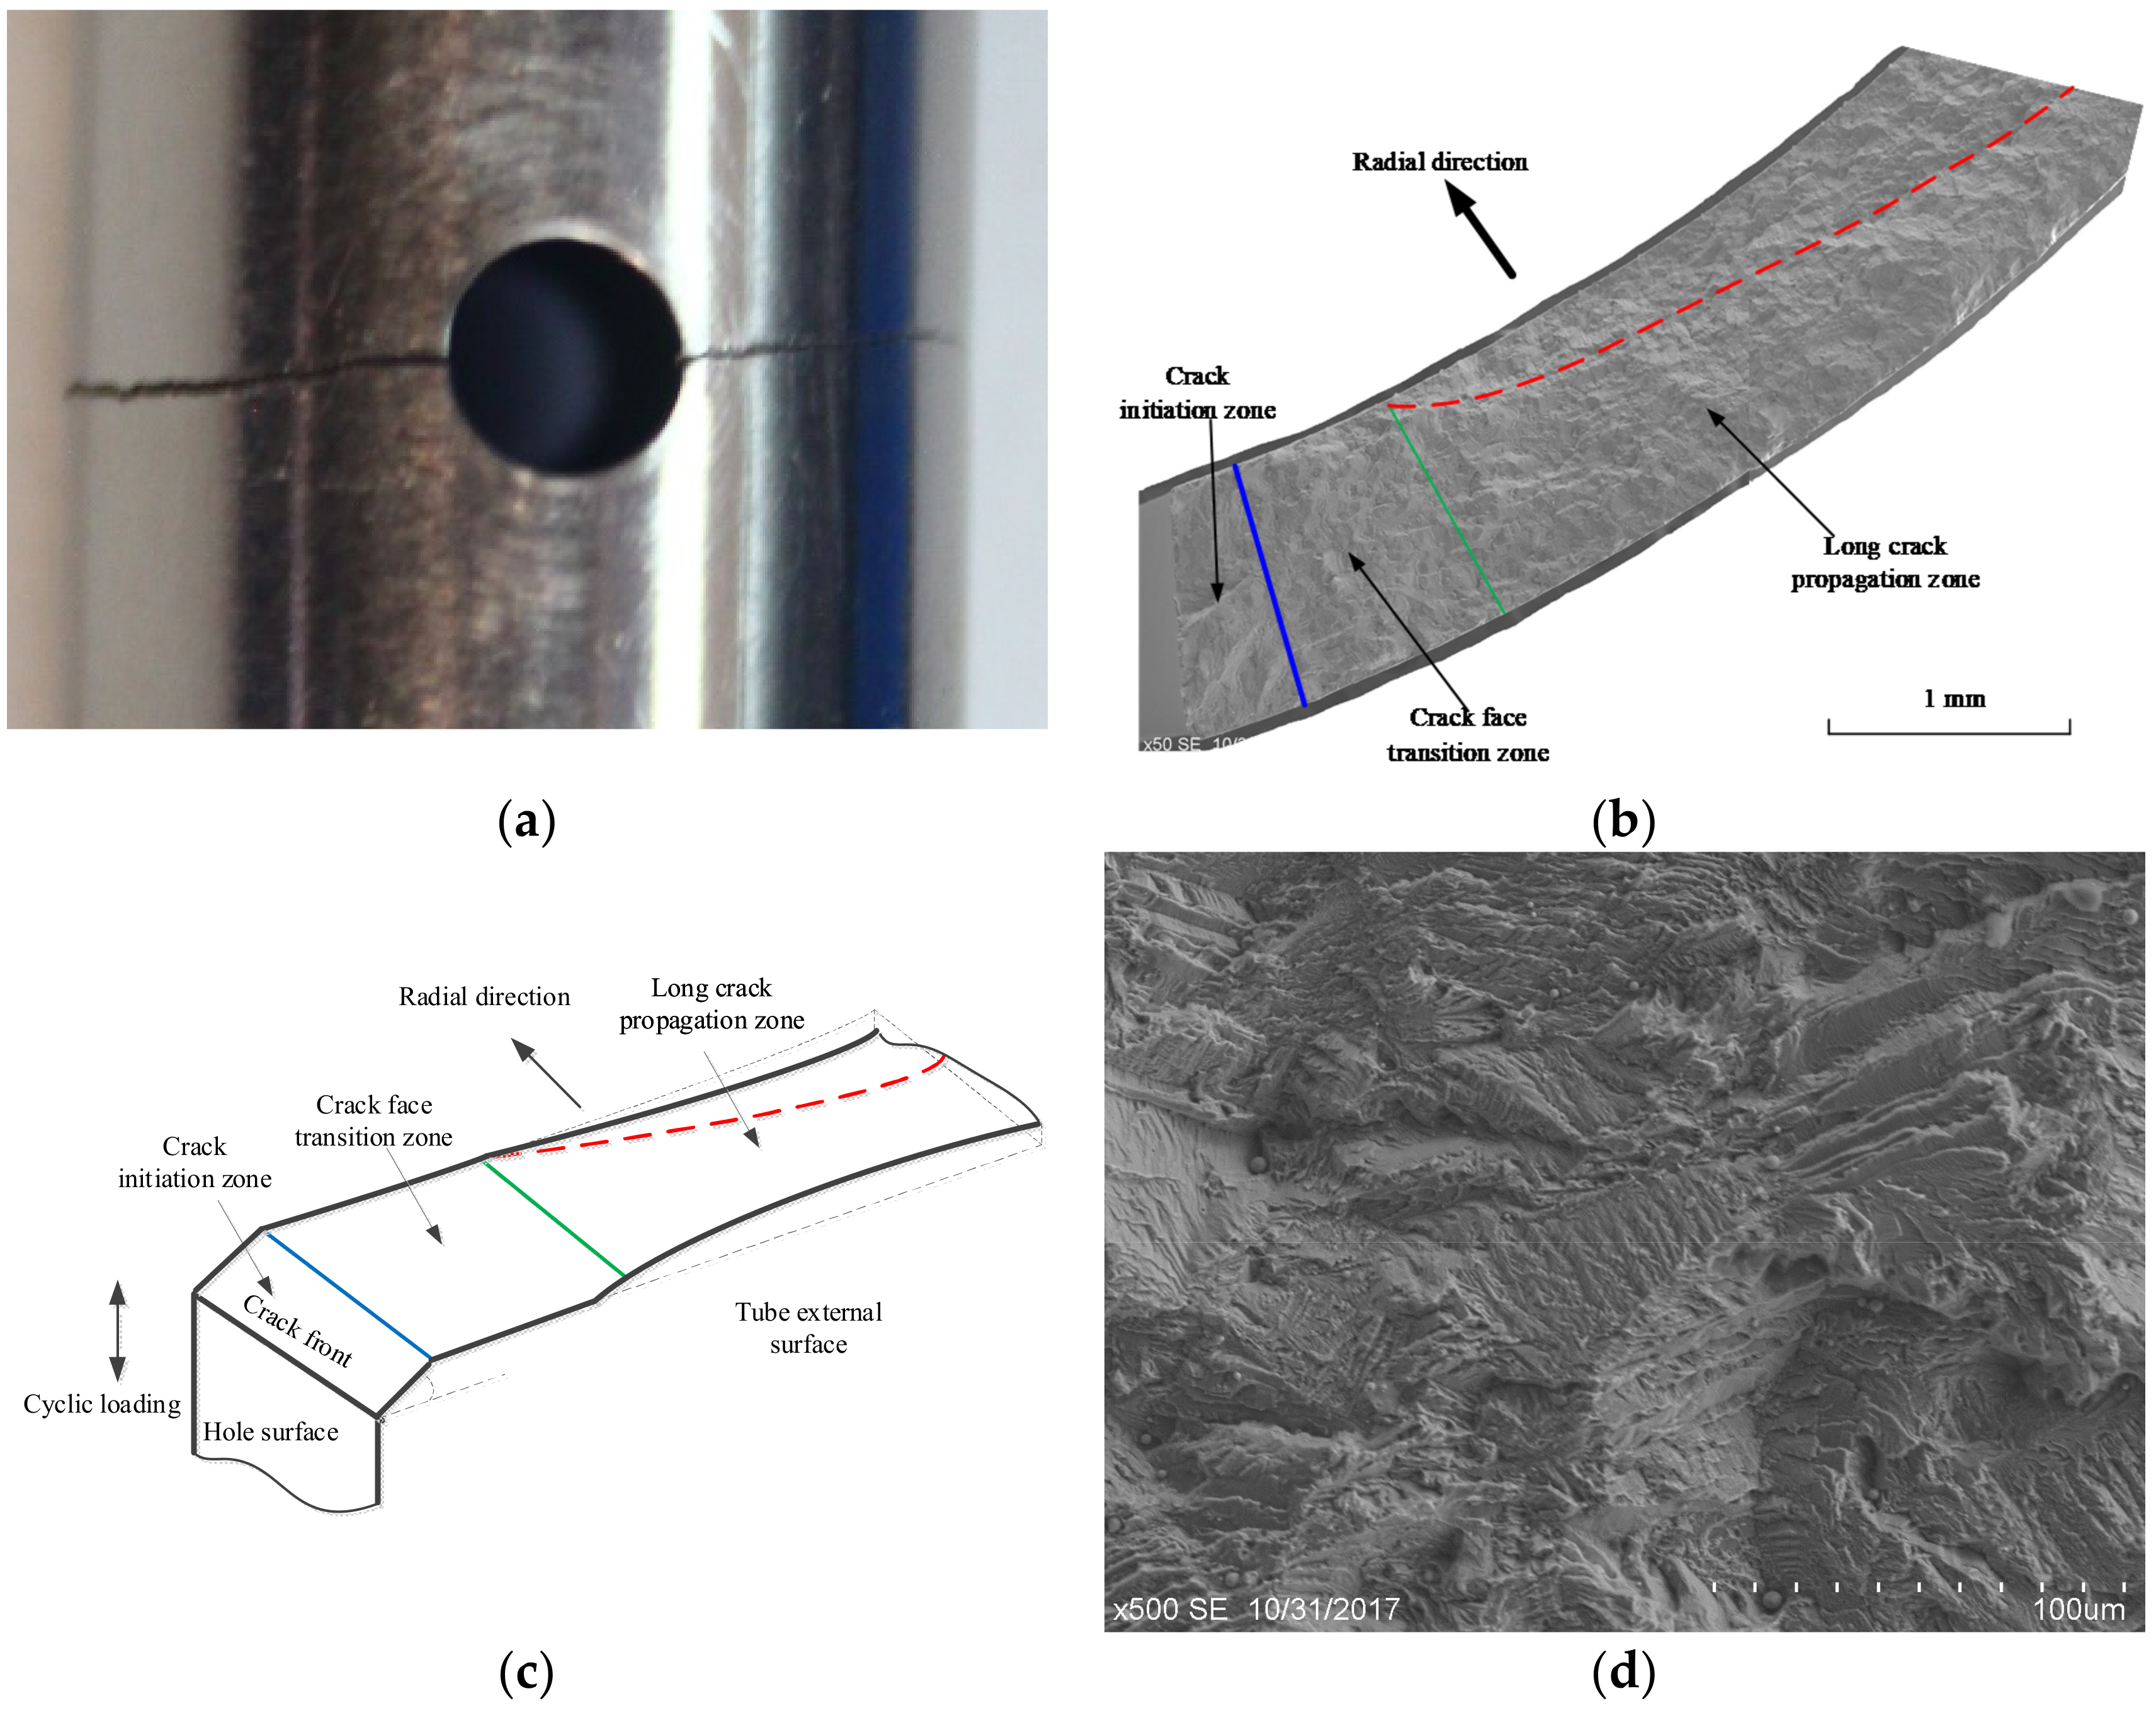
Under the axial cyclic loading, the fatigue crack initiates on the boundary of the hole and propagates perpendicular to the axial of the tube. The fracture of the sample can be divided into three areas: the crack initiation zone, the fracture zone transition zone, and the long crack extension zone. In the thickness direction, the crack face exhibits different angles as the crack propagates.
(2)
The elastic stress concentration factor of the tube specimen with a hole is obtained by elastic finite element analysis. Also, the stress distribution is discussed in this paper. The fatigue damage in the middle of the wall thickness is the highest, which is consistent with the test fracture analysis.
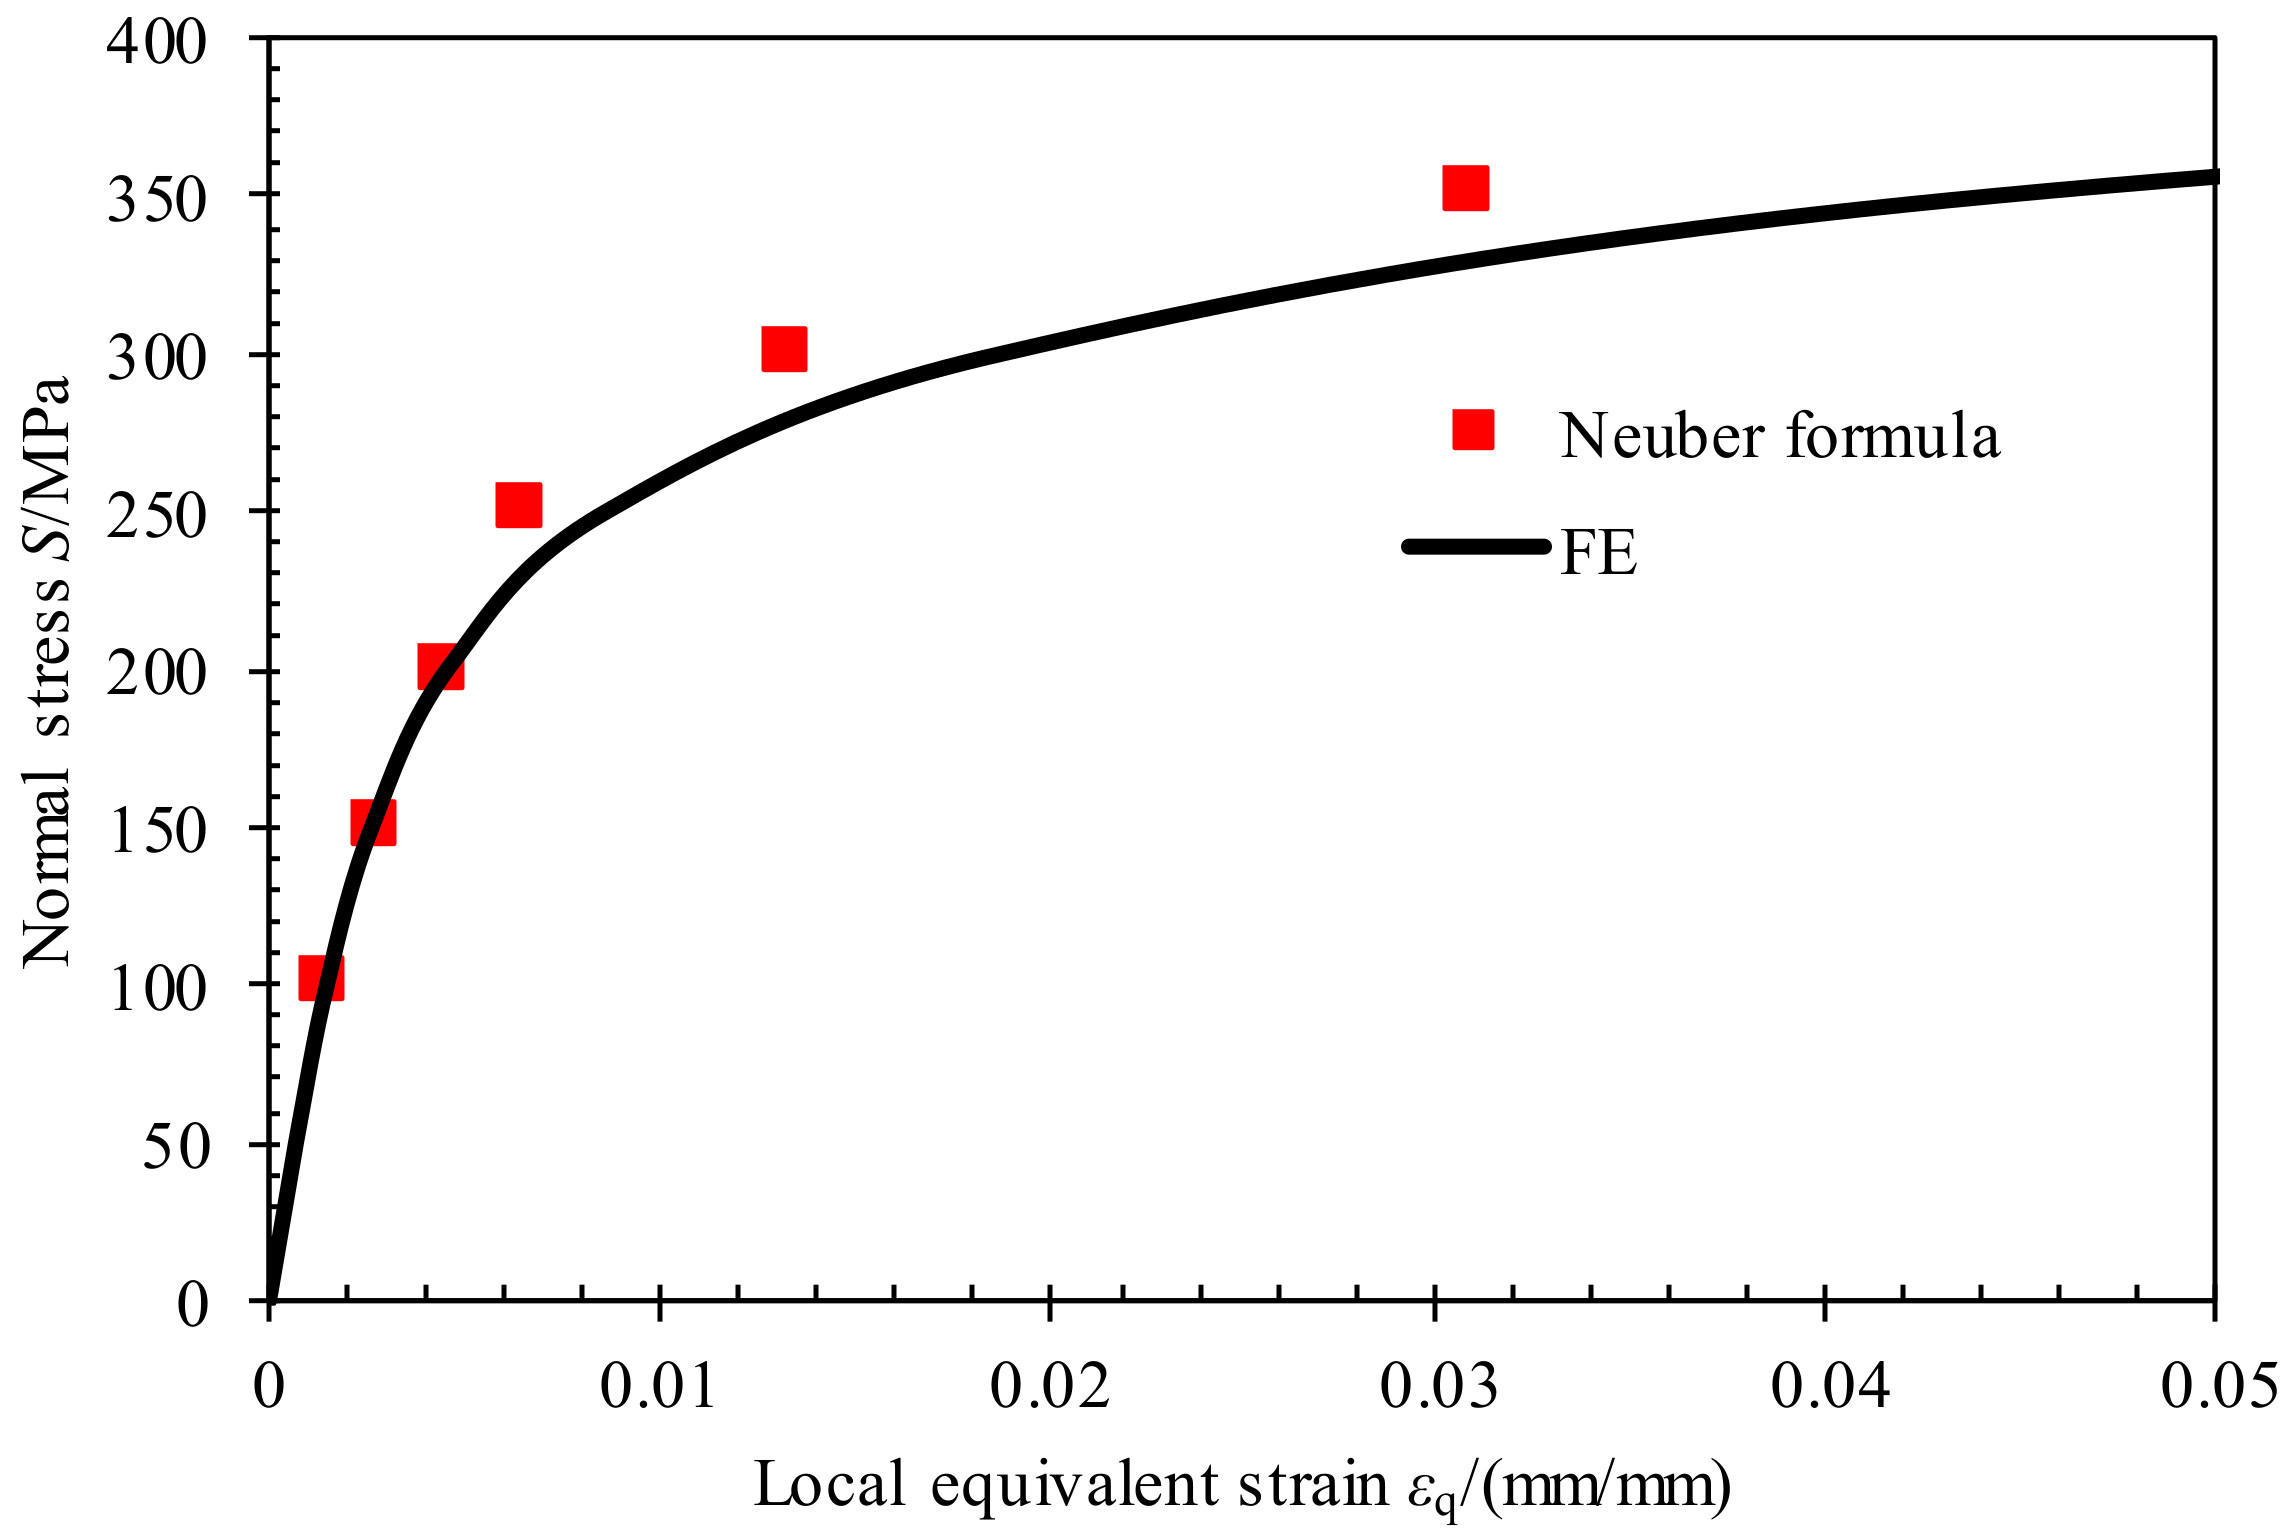
(3)
The local stress-strain field of the tube specimen with a hole is obtained by elastoplastic finite element analysis. Compared with the Neuber’s formula estimation results, the error between them is less than 6%. The Neuber’s method can be used to estimate the local stress-strain of the notch.
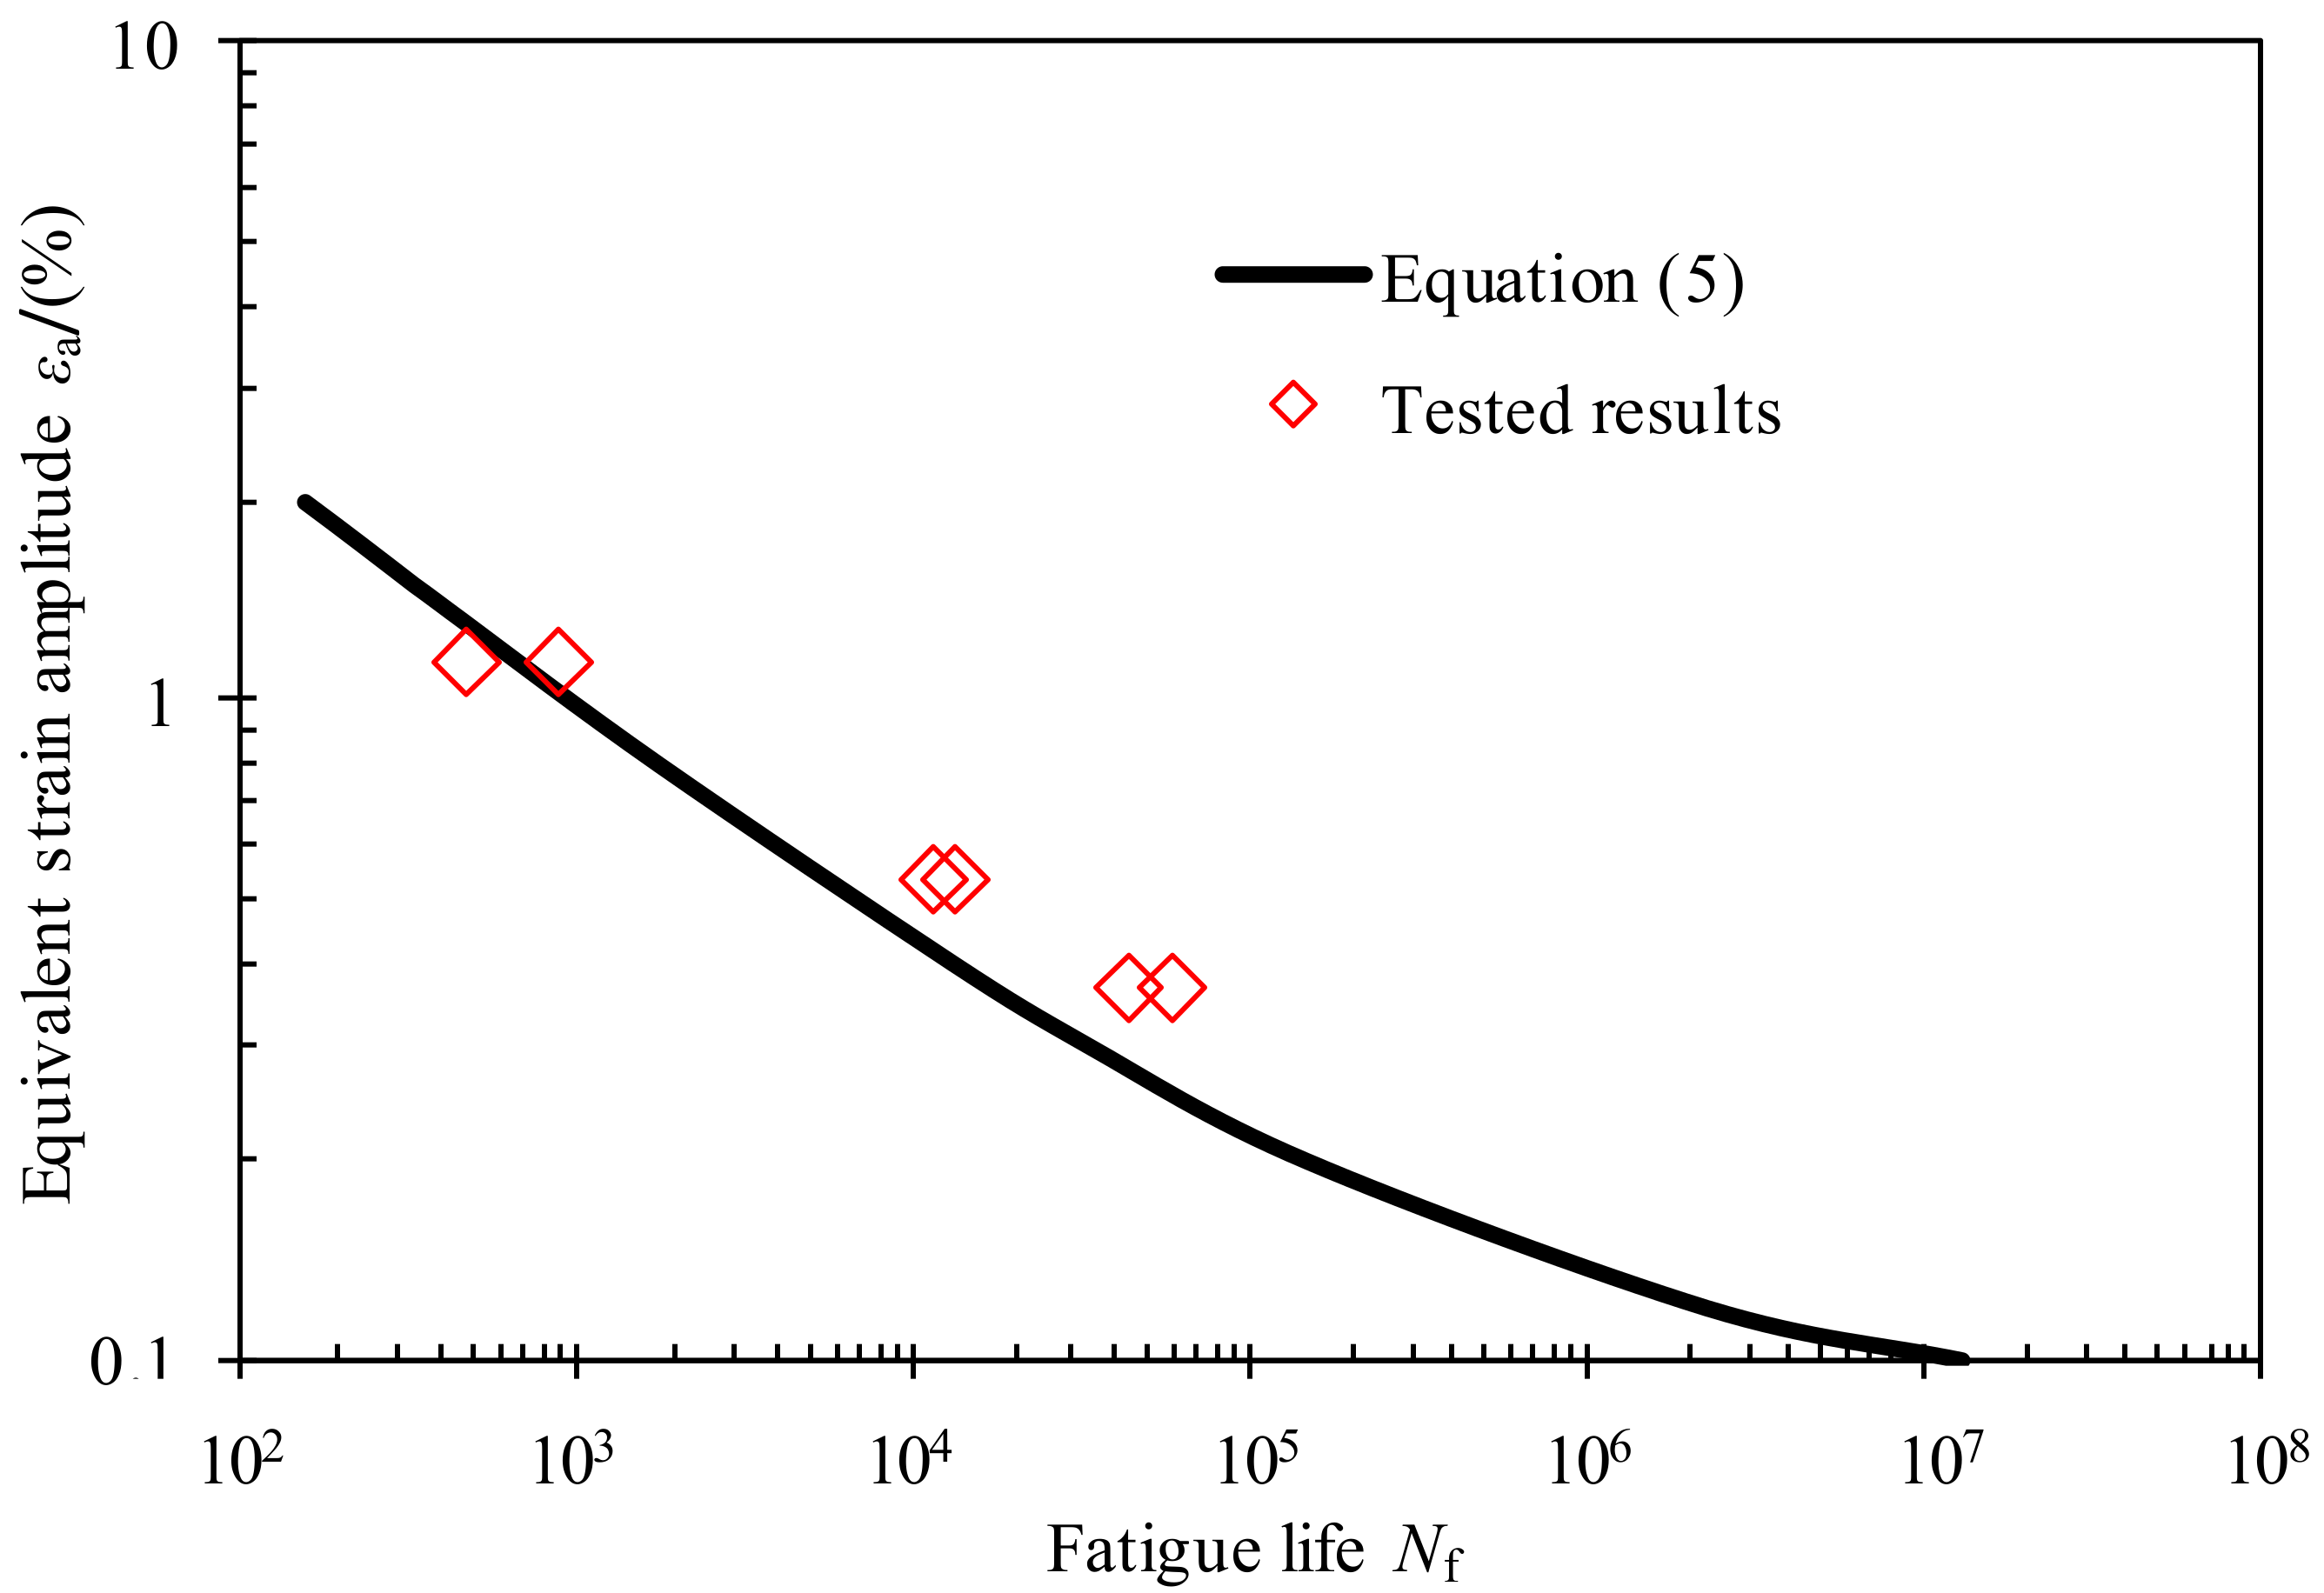
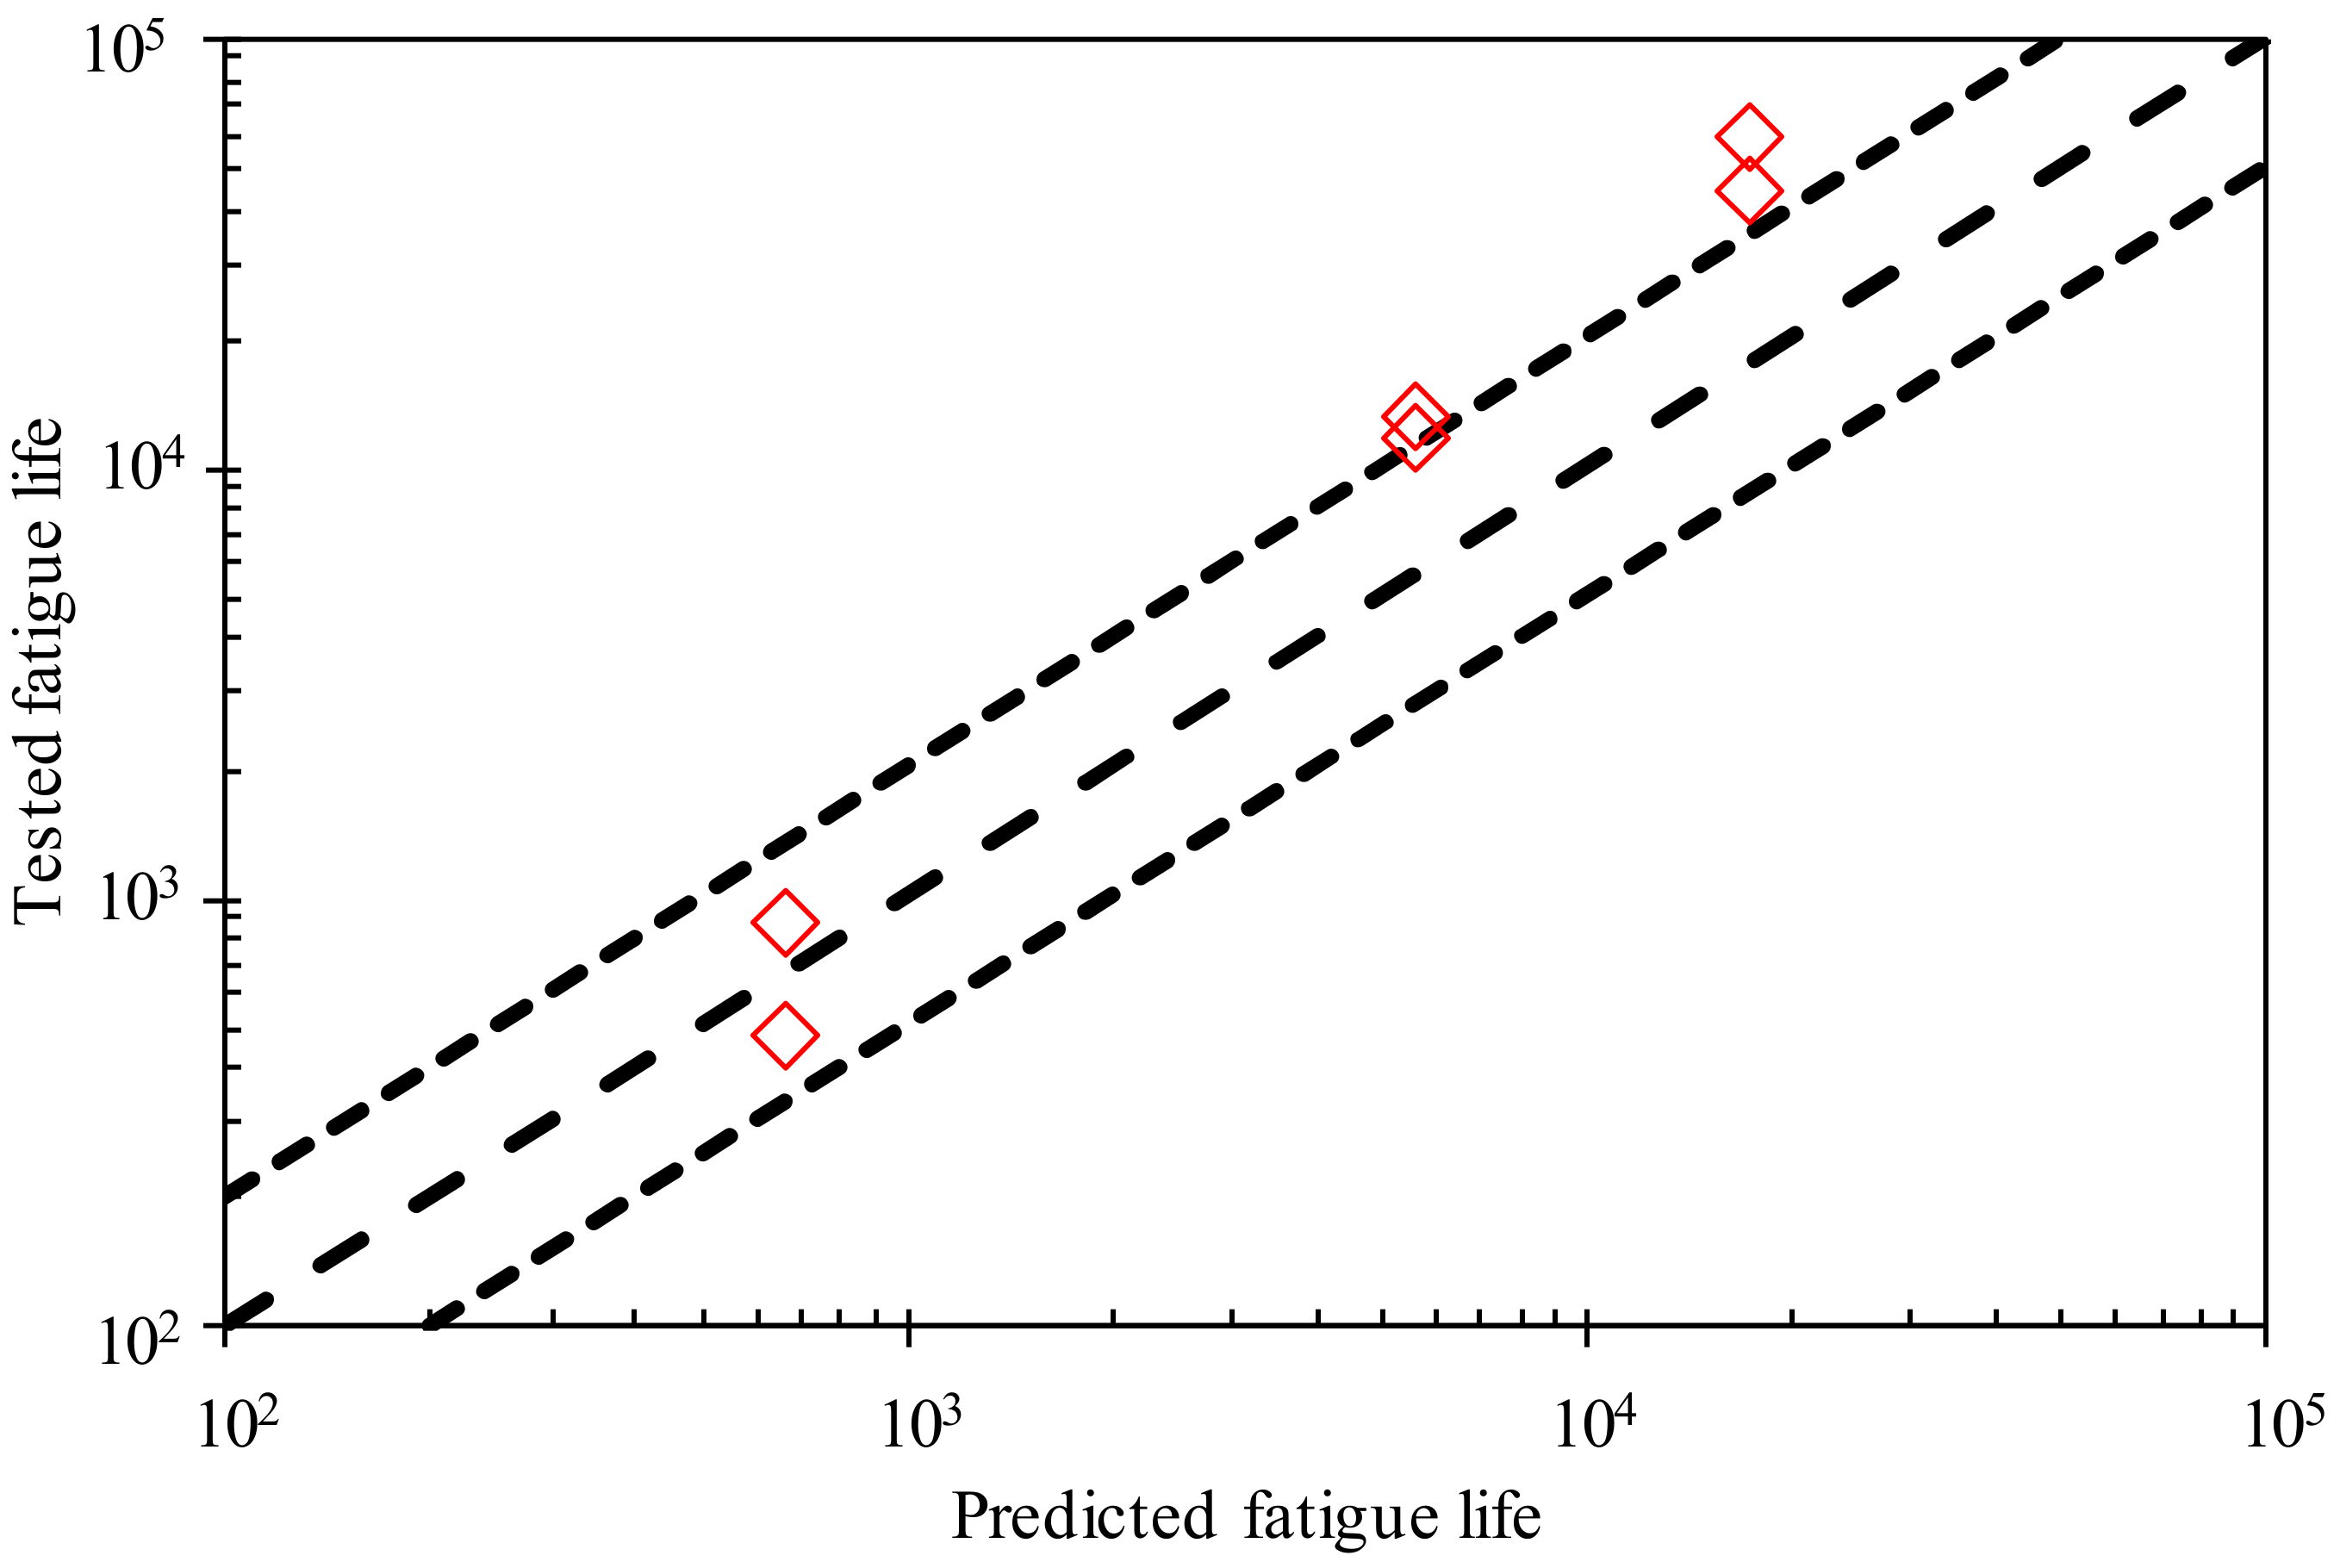
(4)
Based on the local stress-strain field of the tube specimen with a hole, the equivalent fatigue life of the smooth heat transfer tube was obtained and compared with the fatigue life of the raw material. Compared with the mean fatigue life of nickel-based alloy materials, the equivalent fatigue life of smooth heat transfer tubes is higher. Further, the heat transfer tubes involved should have a better fatigue performance.

Author Contributions

Conceptualization: Y.L.; formal analysis: J.C.; funding acquisition: Y.L.; investigation: Q.W., J.C., and X.C.; methodology: Z.G.; supervision: Z.G.; writing—original draft: Q.W.; writing—review and editing: Y.L.

Funding

This research was funded by National Key R&D Program of China, grant number 2018YFC0808800, and National Natural Science Foundation of China, grant number 51605435.

Conflicts of Interest

The authors declare no conflict of interest.

References

  1. Auvinen, A.; Jokiniemi, J.K.; Laehde, A.; Lähde, A.; Routamo, T.; Lundström, P.; Tuomisto, H.; Dienstbier, J.; Güntay, S.; Suckow, D.; et al. Steam generator tube rupture (SGTR) scenarios. Nucl. Eng. Des. 2005, 235, 457–472. [Google Scholar] [CrossRef]
  2. Diercks, D.R.; Shack, W.J.; Muscara, J. Overview of steam generator tube degradation and integrity issues. Nucl. Eng. Des. 1999, 194, 19–30. [Google Scholar] [CrossRef]
  3. Japan Nuclear Energy Safety Organization Nuclear Energy System Safety Division. Environmental Fatigue Evaluation Method for Nuclear Power Plants, JNES-SS-1005; Japan Nuclear Energy Safety Organization: Tokyo, Japan, 2011. [Google Scholar]
  4. Higuchi, M.; Sakaguchi, K.; Hirano, A.; Nomura, Y. Revised and new proposal of environmental fatigue life correction factor (Fen) for carbon and low-alloy steels and nickel base alloys in LWR water environments. In Proceedings of the PVP2006-ICPVT-11, ASME Pressure Vessels and Piping Division Conference, Vancoucer, BC, Canada, 23–27 July 2006. [Google Scholar]
  5. Arora, P.; Gupta, S.K.; Bhasin, V.; Singh, R.K.; Sivaprasad, S.; Tarafder, S. Testing and assessment of fatigue life prediction models for Indian PHWRs piping material under multi-axial load cycling. Int. J. Fatigue 2016, 85, 98–113. [Google Scholar] [CrossRef]
  6. Neuber, H. Theory of stress concentration for shear strained prismatical bodies with arbitrary non-linear stress-strain law. J. Appl. Mech. 1961, 28, 544–550. [Google Scholar] [CrossRef]
  7. Zhang, C.C.; Yao, W.X. Typical fatigue life analysis approaches for notched components. J. Aerosp. Power 2013, 28, 1223–1230. [Google Scholar]
  8. Ellyin, F.; Kujawski, D. Generalization of notch analysis and its extension to cyclic loading. Eng. Fract. Mech. 1989, 32, 819–826. [Google Scholar] [CrossRef]
  9. Karakaş, Ö. Application of Neuber’s effective stress method for the evaluation of the fatigue behaviour of magnesium welds. Int. J. Fatigue 2017, 101, 115–126. [Google Scholar] [CrossRef]
  10. Bentachfine, S.; Pluvinage, G.; Gilgert, J.; Azari, Z.; Bouami, D. Notch effect in low cycle fatigue. Int. J. Fatigue 1999, 21, 421–430. [Google Scholar] [CrossRef]
  11. Taylor, D. Geometrical effects in fatigue: A unifying theoretical model. Int. J. Fatigue 1999, 21, 413–420. [Google Scholar] [CrossRef]
  12. Sun, D.; Hu, Z.D. Research of the size factor of fatigue strength base on TCD theory. Chin. Quart. Mech. 2015, 36, 288–295. [Google Scholar]
  13. Adib-Ramezani, H.; Jeong, J. Advanced volumetric method for fatigue life prediction using stress gradient effects at notch roots. Comp. Mater. Sci. 2007, 39, 649–663. [Google Scholar] [CrossRef]
  14. Yao, W.X. Stress field intensity approach for predicting fatigue life. Int. J. Fatigue 1993, 15, 243–246. [Google Scholar]
  15. Shen, J.B.; Tang, D.L. Predicting method for fatigue life with stress gradient. Chin. Mech. Eng. 2017, 28, 40–44. [Google Scholar]
  16. Branco, R.; Costa, J.; Berto, F.; Antunes, F.V. Fatigue life assessment of notched round bars under multiaxial loading based on the total strain energy density approach. Thoret. Appl. Fract. Mech. 2018, 97, 340–348. [Google Scholar] [CrossRef]
  17. Sonsino, C.M.; Bruder, T.; Baumgartner, J. S-N Lines for welded thin joints—Suggested slopes and FAT values for applying the notch stress concept with various reference radii. Weld World 2010, 54, 375–392. [Google Scholar] [CrossRef]
  18. Sonsino, C.M.; Fricke, W.; De Bruyne, F.; Hoppe, A.; Ahmadi, A.; Zhang, G. Notch stress concepts for the fatigue assessment of welded joints—Background and applications. Int. J. Fatigue 2012, 34, 2–16. [Google Scholar] [CrossRef]
  19. Bertini, L.; Frendo, F.; Marulo, G. Fatigue life assessment of welded joints by two local stress approaches: The notch stress approach and the peak stress method. Int. J. Fatigue 2018, 110, 246–253. [Google Scholar] [CrossRef]
  20. He, X.; Chen, J.; Tian, W.; Li, Y.; Jin, W. Low cycle fatigue behavior of steam generator tubes under axial loading. Materials 2018, 11, 1944. [Google Scholar] [CrossRef]
  21. Guo, W. Three-dimensional analyses of plastic constraint for through-thickness cracked bodies. Eng. Fract. Mech. 1999, 62, 383–407. [Google Scholar] [CrossRef]
  22. Seeger, T.; Heuler, P. Generalized application of Neuber’s rule. J. Test. Eval. 1980, 8, 199–204. [Google Scholar]
  23. Gates, N.; Fatemi, A. Notched fatigue behavior and stress analysis under multiaxial states of stress. Int. J. Fatigue 2014, 67, 2–14. [Google Scholar] [CrossRef]
  24. Kuhn, P.; Hardrath, H.F. An Engineering Method for Estimating Notch-Size Effect in Fatigue Tests on Steel; NACA Technical Note; NACA: Langley Field, VA, USA, 1952. [Google Scholar]
  25. Gates, N.; Fatemi, A. Notch deformation and stress gradient effects in multiaxial fatigue. Theor. Appl. Fract. Mech. 2016, 84, 3–25. [Google Scholar] [CrossRef]
  26. Langer, B.F. Design of pressure vessels for low-cycle fatigue. Trans. ASME J. Basic Eng. 1962, 84, 389–399. [Google Scholar] [CrossRef]
  27. Chopra, O.; Stevens, G. Effect of LWR Coolant Environments on the Fatigue Life of Reactor Materials; NUREG/CR-6909, ANL-12/60; U.S. Nuclear Regulatory Commission: Washington, DC, USA, 2014. [Google Scholar]
Figure 1. Test specimen for thin wall tube with holes. Unit: mm.
Metals 09 00322 g001
Figure 2. Picture of the test device: (a) Test rig, and (b) diagrammatic sketch of clamping technique.
Metals 09 00322 g002
Figure 3. Fracture appearance for tube with holes: (a) Macroscopic view of the crack, (b) fracture appearance, (c) diagrammatic sketch, and (d) microscopic morphology.
Metals 09 00322 g003
Figure 4. Finite element model.
Metals 09 00322 g004
Figure 5. Path diagrammatic sketch.
Metals 09 00322 g005
Figure 6. Distribution of Mises stress and max principal stress around the hole circumference (path P1).
Metals 09 00322 g006
Figure 7. Distribution of Mises stress and max principal stress along the hole depth (path P2).
Metals 09 00322 g007
Figure 8. Distribution of Mises stress and max principal stress radically away from hole edge on specimen outer surface (path P3).
Metals 09 00322 g008
Figure 9. Stress contours from elastic finite element analysis: (a) Axial stress, (b) hoop stress, (c) maximum principal stress, and (d) maximum shear stress.
Metals 09 00322 g009
Figure 10. Neuber’s rule estimations compared to finite element results for nominal stress vs. local equivalent strain.
Metals 09 00322 g010
Figure 11. Fatigue life curve of tube with holes and material.
Metals 09 00322 g011
Figure 12. Comparison test result with predicted result of fatigue life of tube with holes.
Metals 09 00322 g012
Table 1. Chemical compositions of Inconel 690 (wt%).
NiCrFeCMnSiCuS
58.0 min.27.0–31.07.0–11.00.05 max.0.50 max.0.50 max.0.5 max.0.015 max.
Table 2. Tensile properties of Inconel 690 tube.
ItemYoung’s Modulus (MPa)Yield Strength (MPa)Tensile Strength (MPa)
Experimental results2.12 × 105286702
Standard requirement-240586
Table 3. Fatigue lives of tubes with holes under different loading with stress/strain control mode.
Diameter of HolesControl MethodLoad LevelTest Life
4 mmStrain control±0.2%478, 886
2 mmStress control±250 MPa11,722, 13,300
2 mmStress control±200 MPa44,200, 58,800

