Influence of Aerospace Standard Surface Pretreatment on the Intermetallic Phases and CeCC of 2024-T3 Al-Cu Alloy

 ,
,  , ,
, , 
Abstract
:
1. Introduction
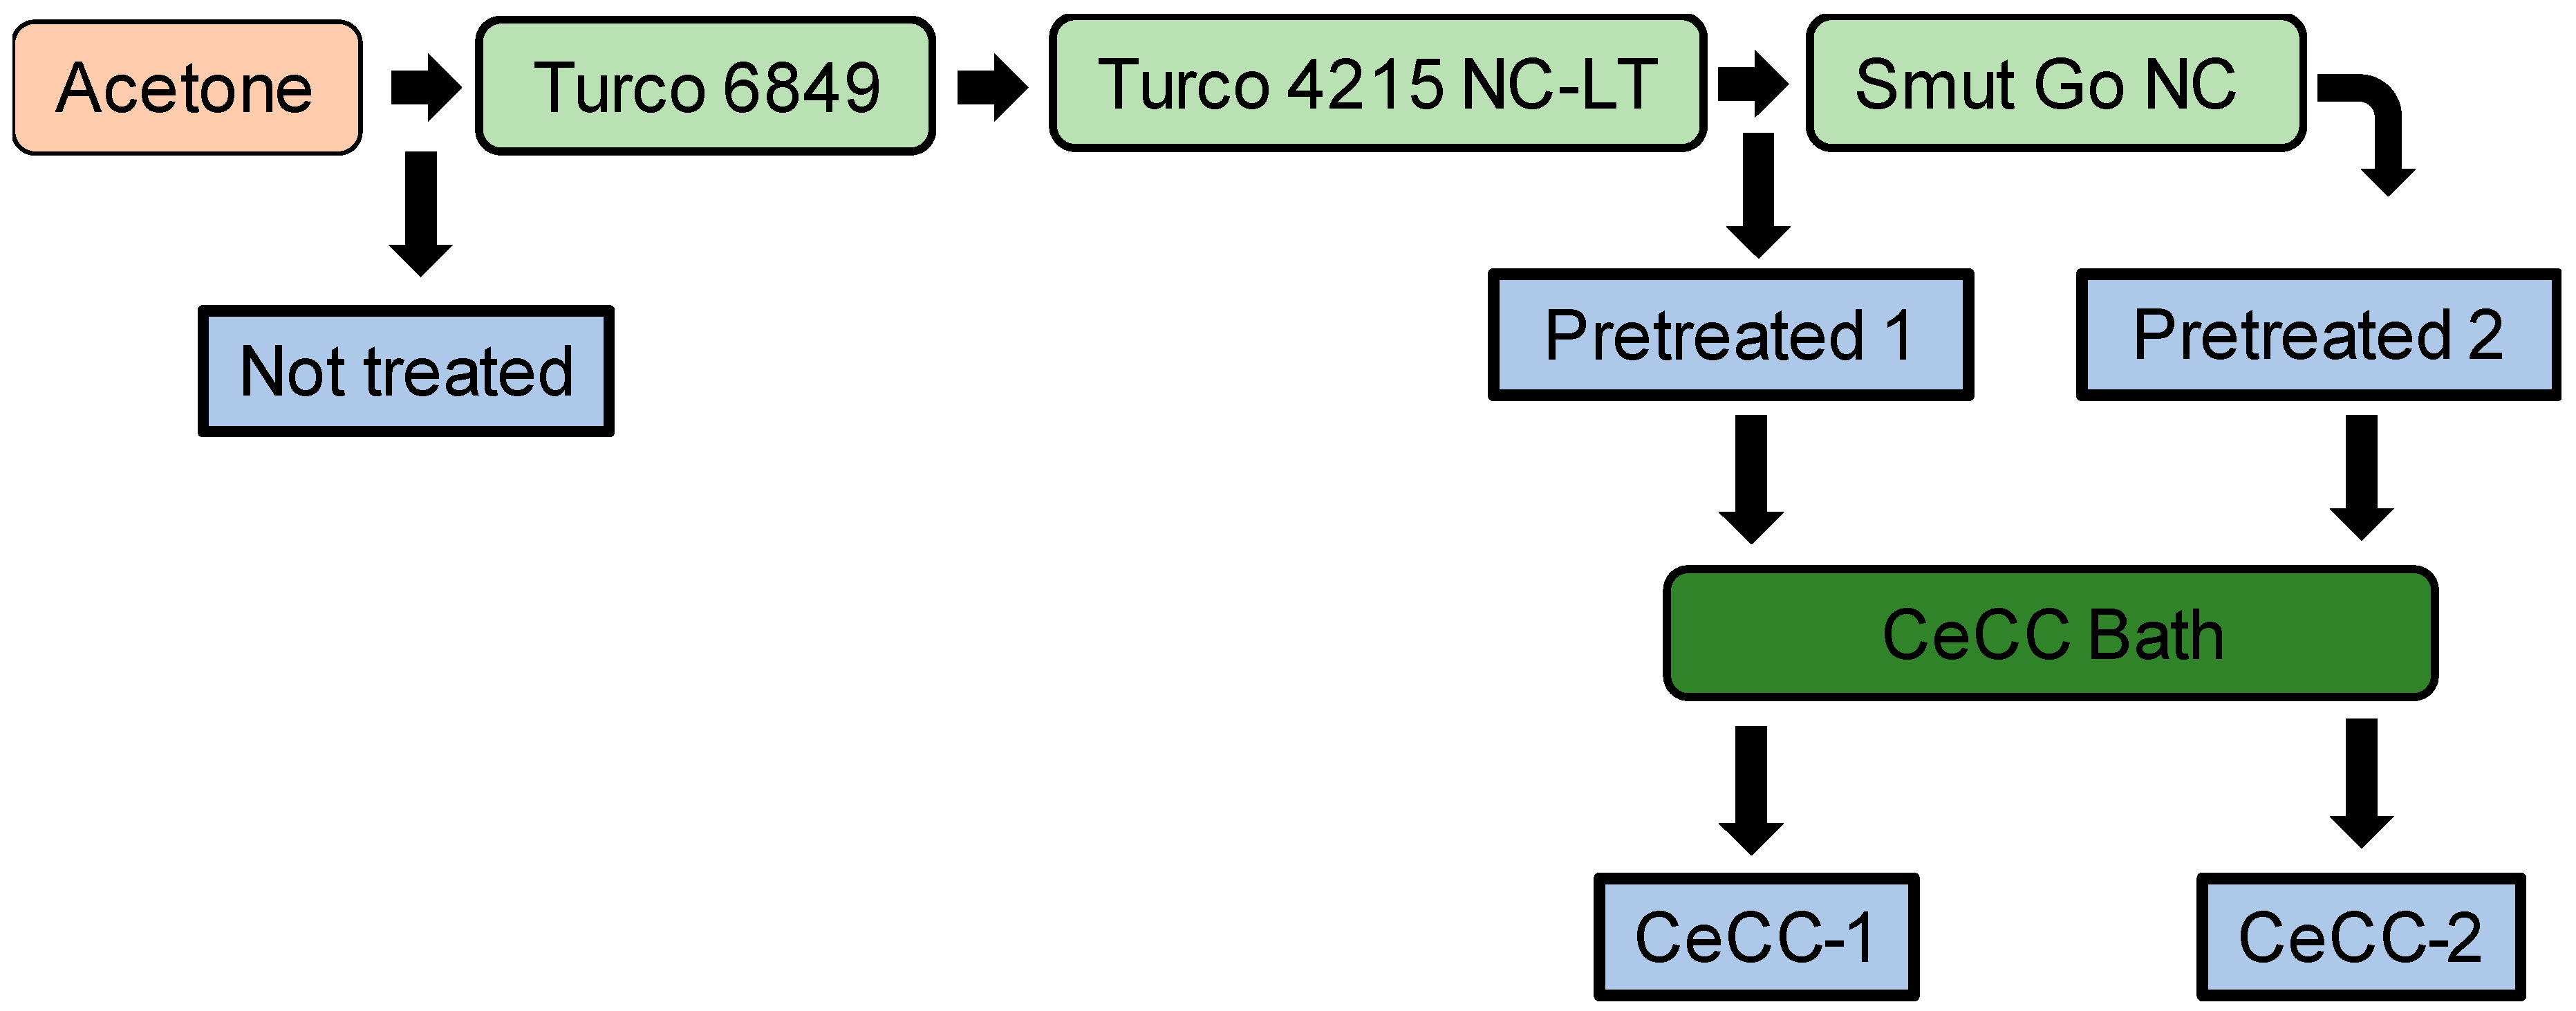
- Turco 6849: a silicate-containing alkaline degreaser, formulated to remove shop soils, marking inks, cosmoline, grease and lube oils from ferrous and non-ferrous alloys. According to the standard, this treatment is used only to avoid contaminating the following two baths.
- Turco 4215 NC-LT: a free of chromate and silicate alkaline etching, developed for cleaning ferrous and nonferrous alloys by spray, immersion and ultrasonic methods at low temperatures.
- Turco Smut Go NC: an oxidising acid pickling, formulated to deoxidize and to desmut aluminium alloys by immersion in order to obtain a low surface resistance prior to anodising or conversion coatings.
2. Materials and Methods
3. Results
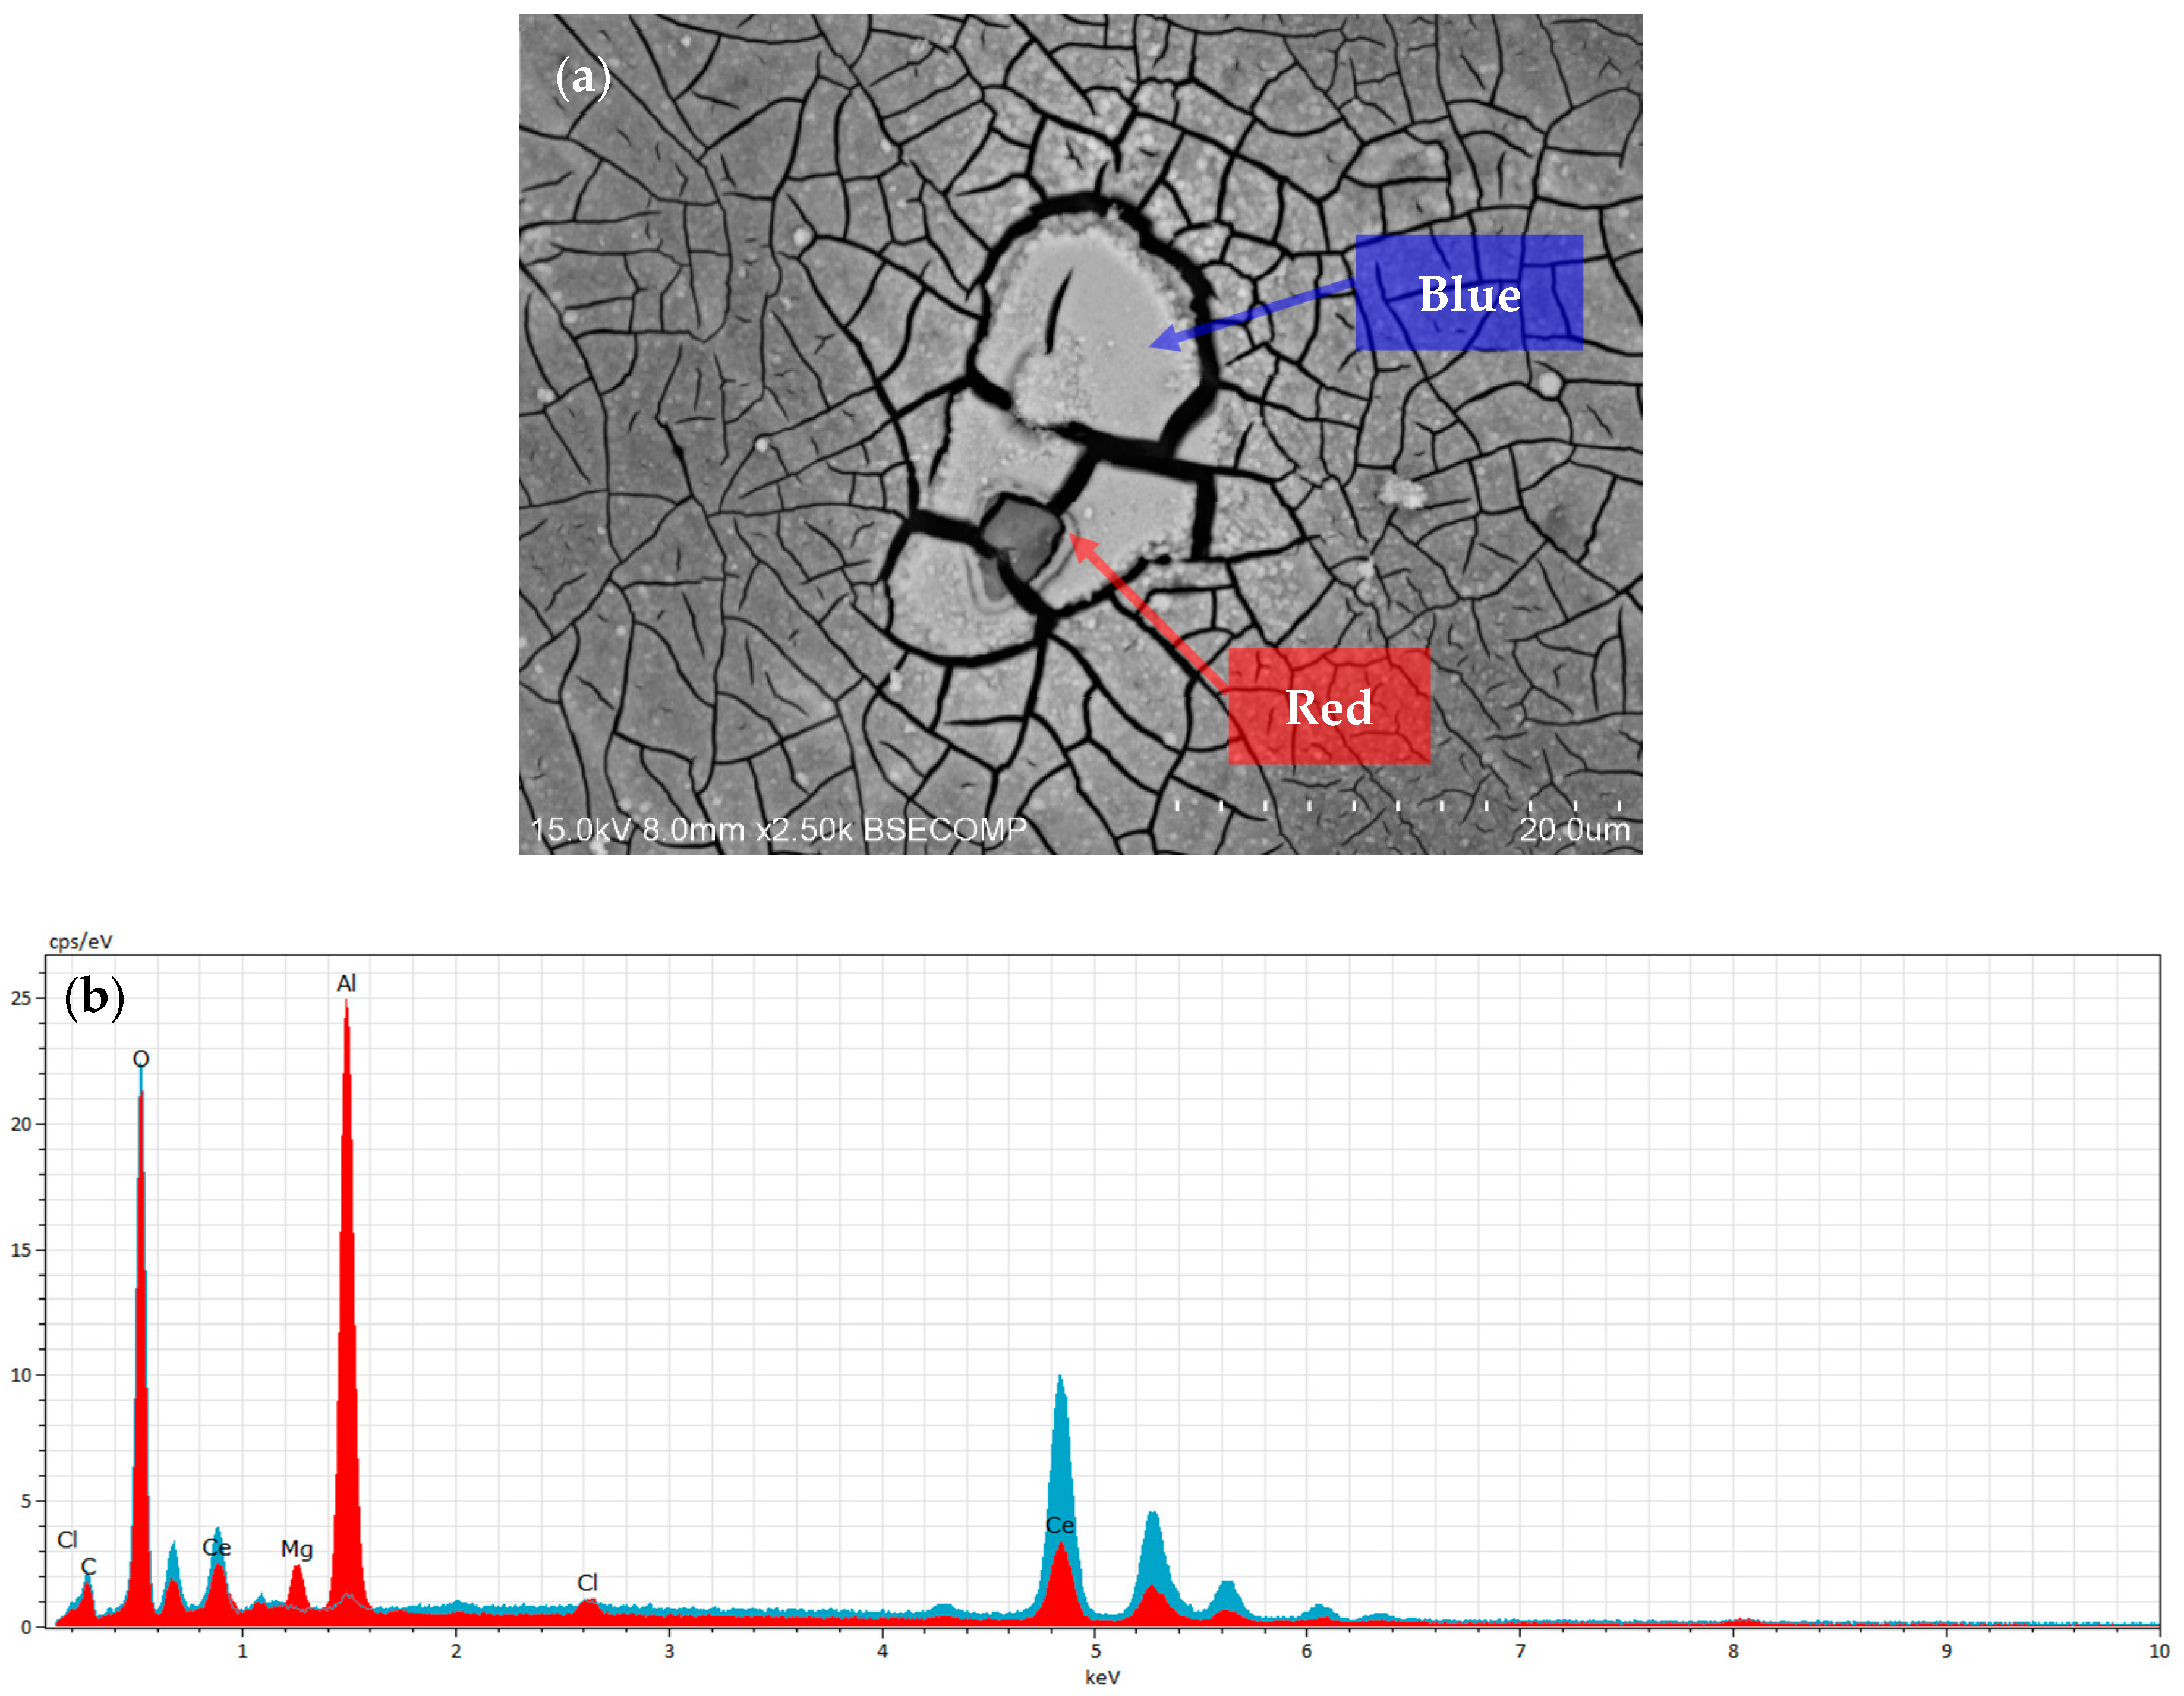
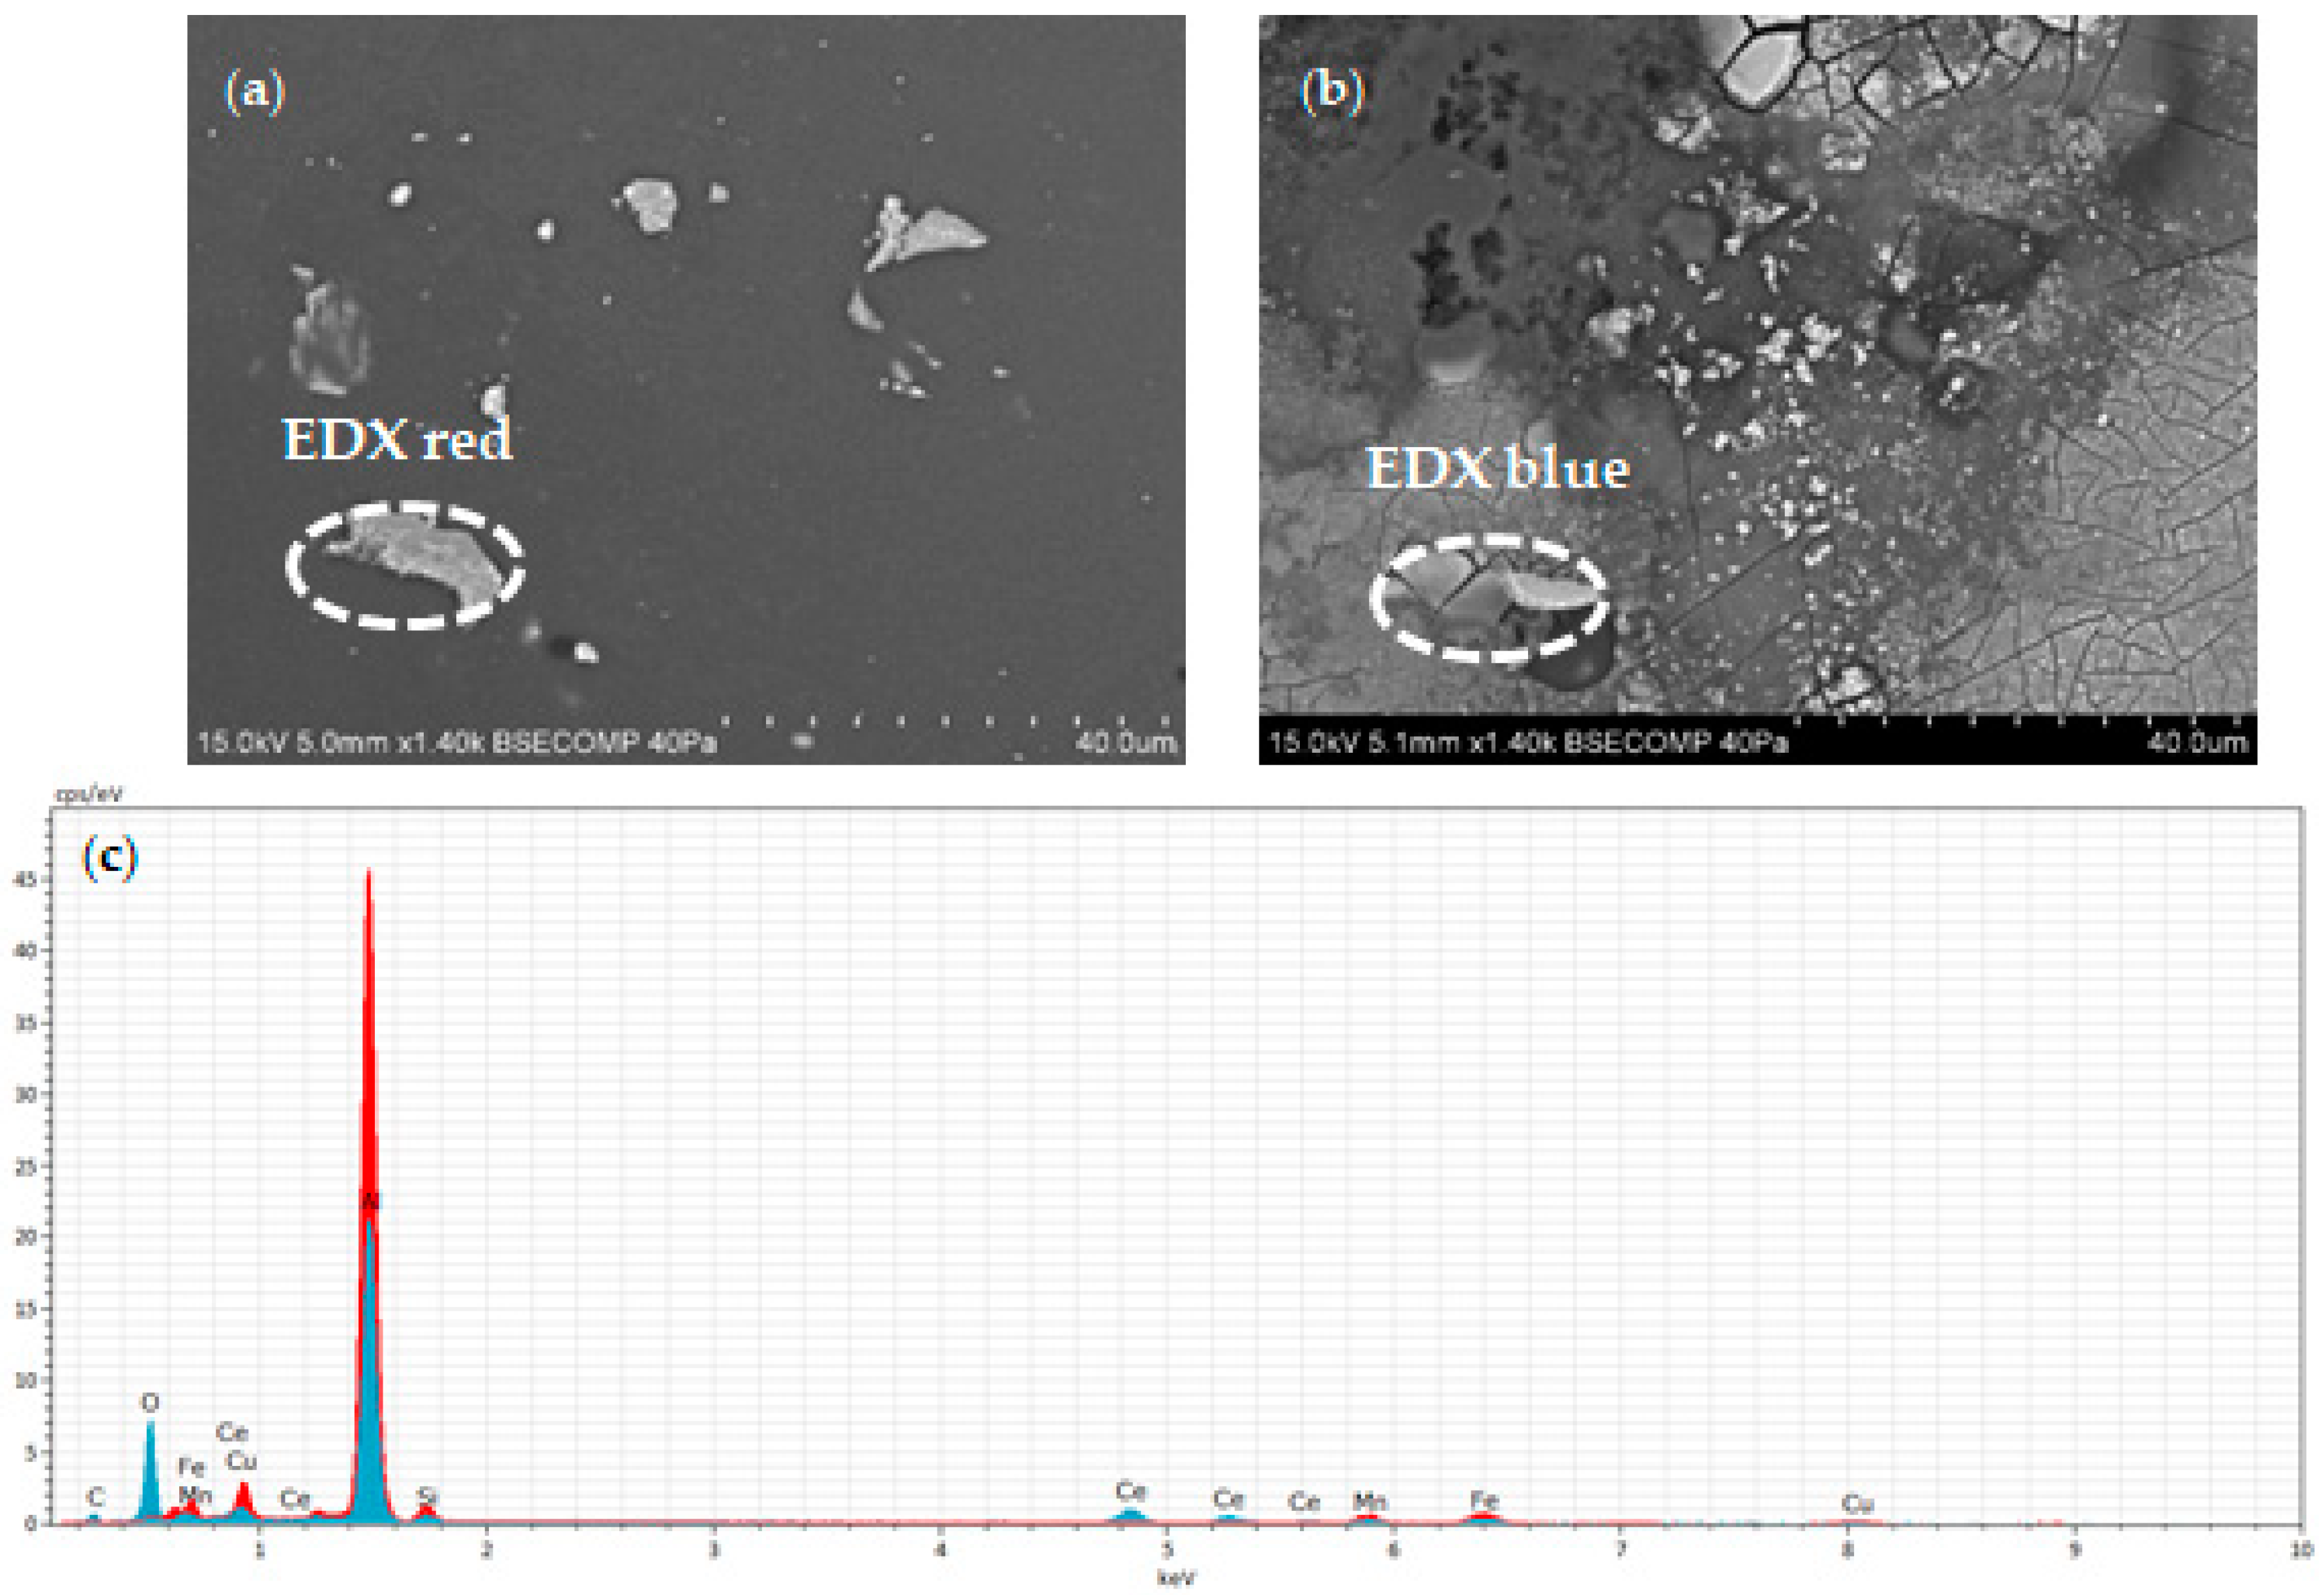
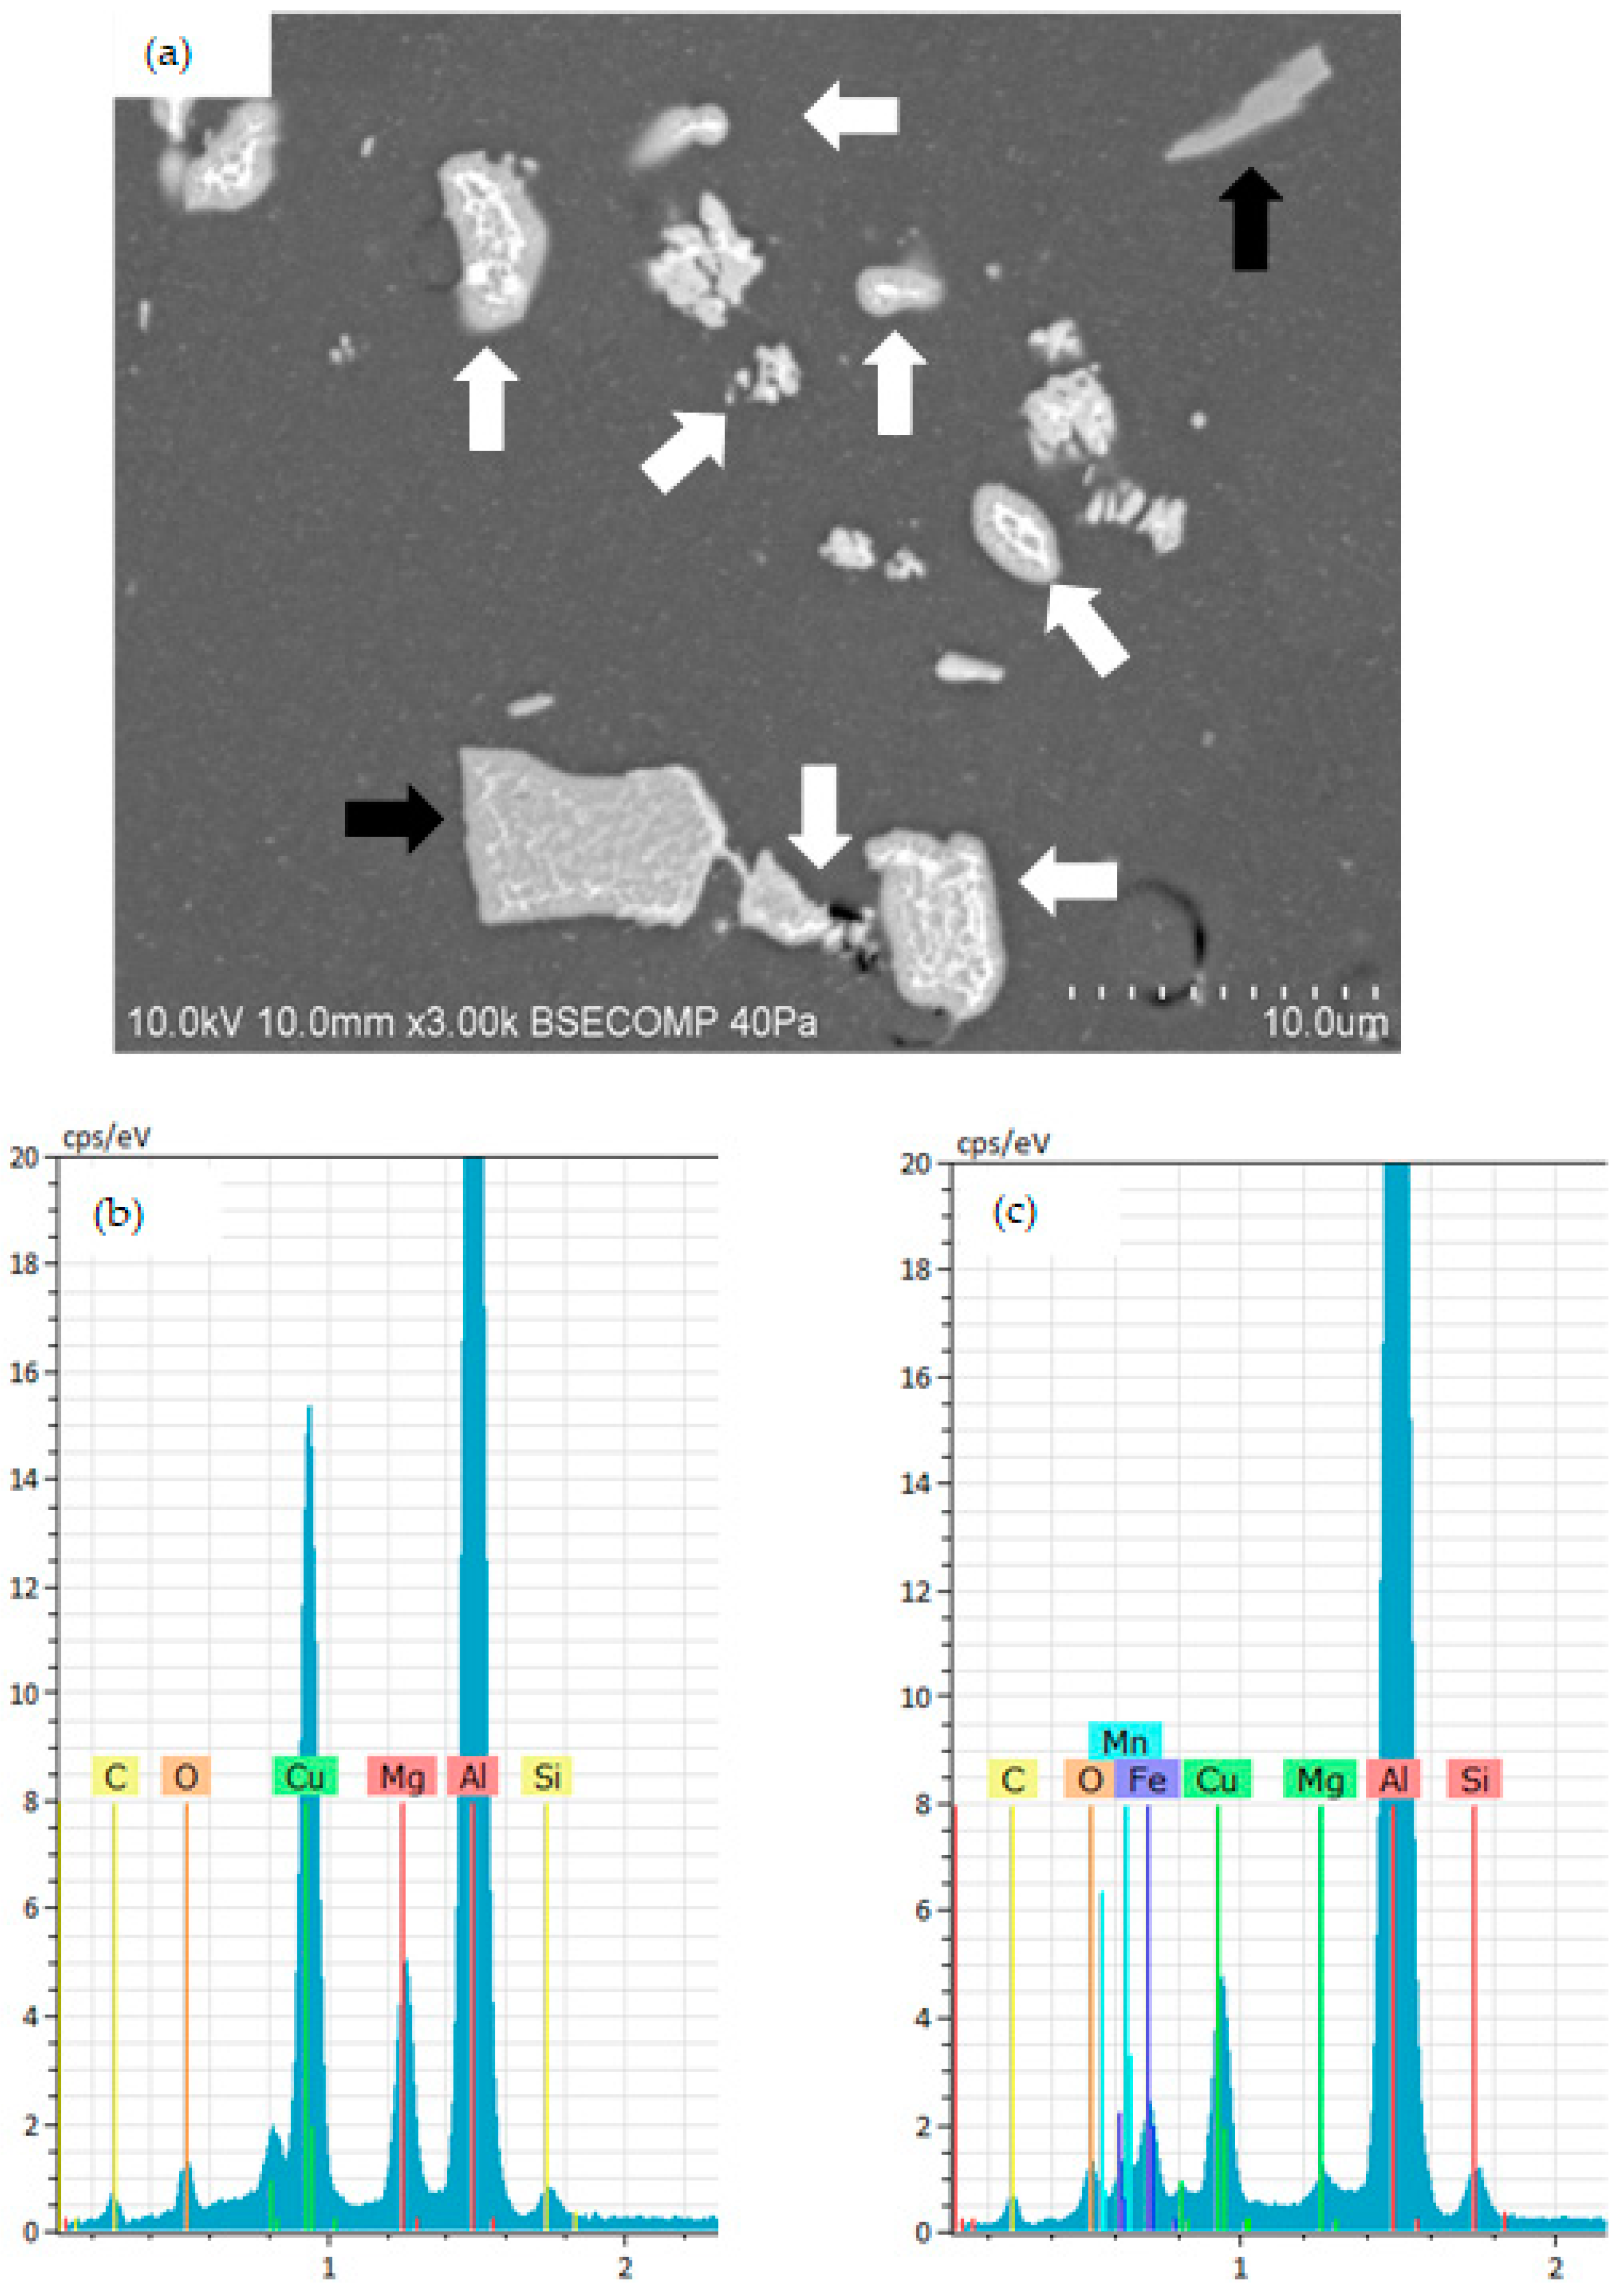
3.1. Surface Morphology and Microstructure of Uncoated Samples
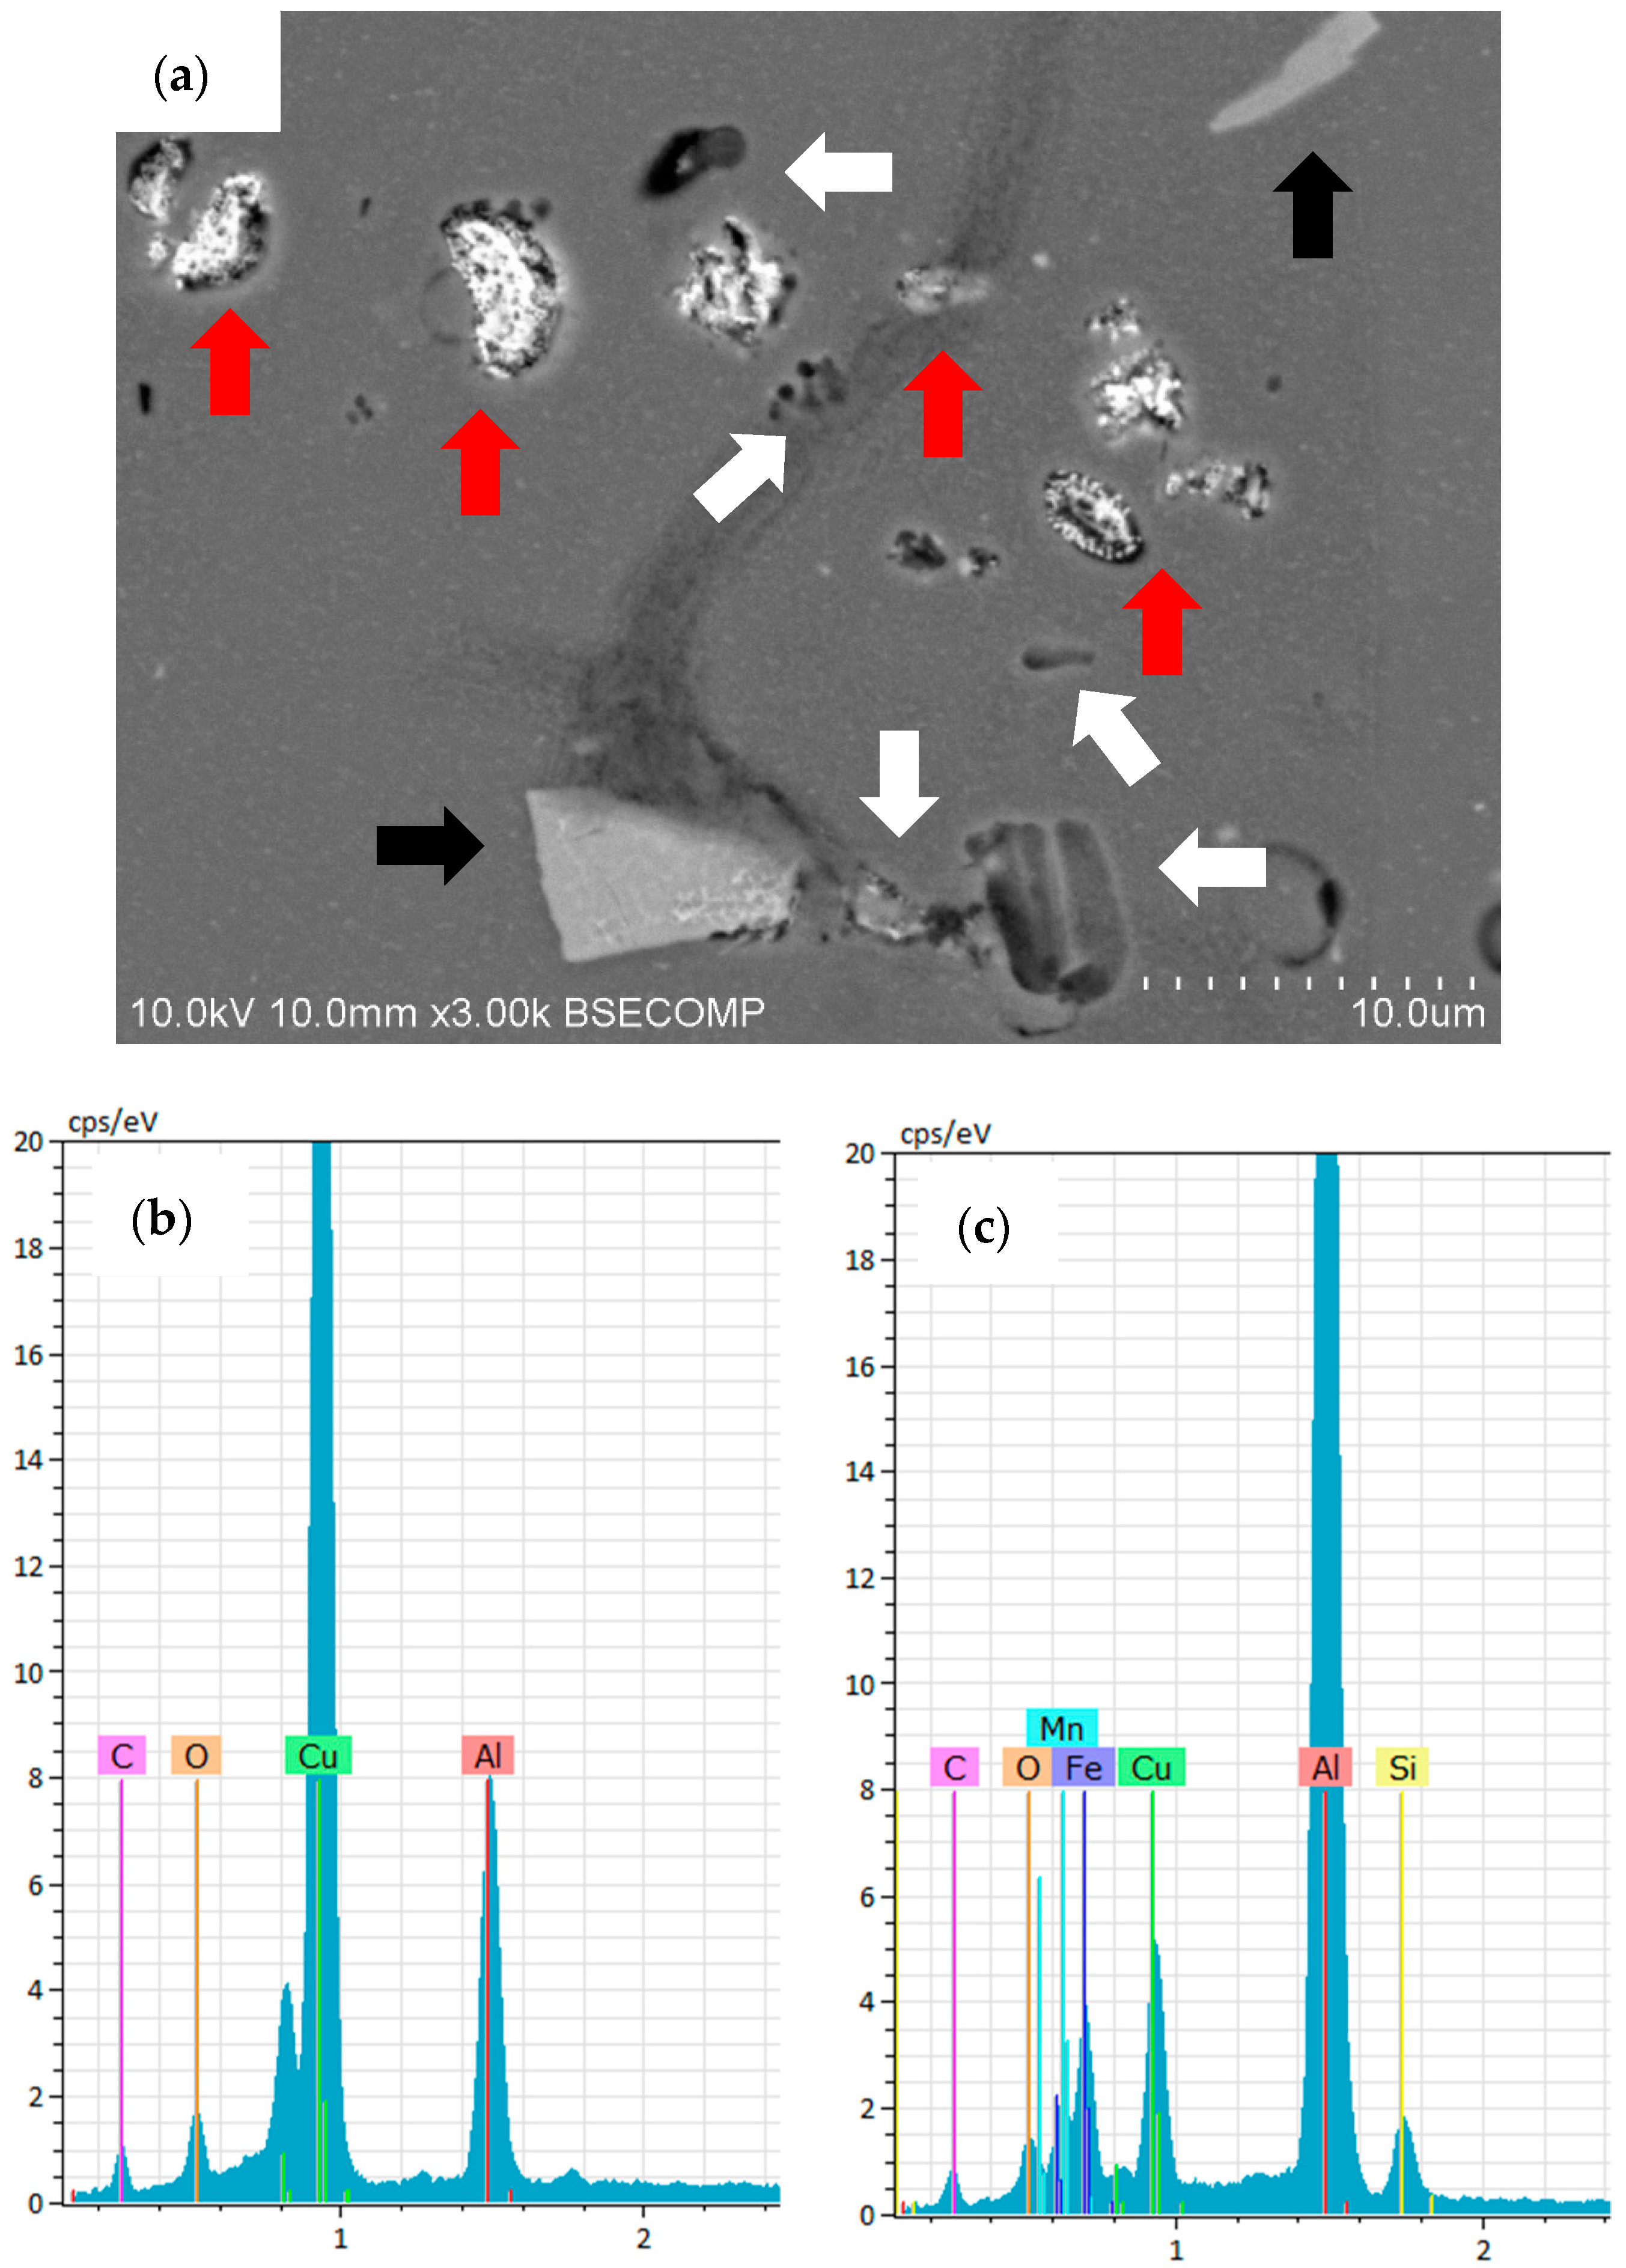
3.2. Surface Morphology and Microstructure of Coated Samples
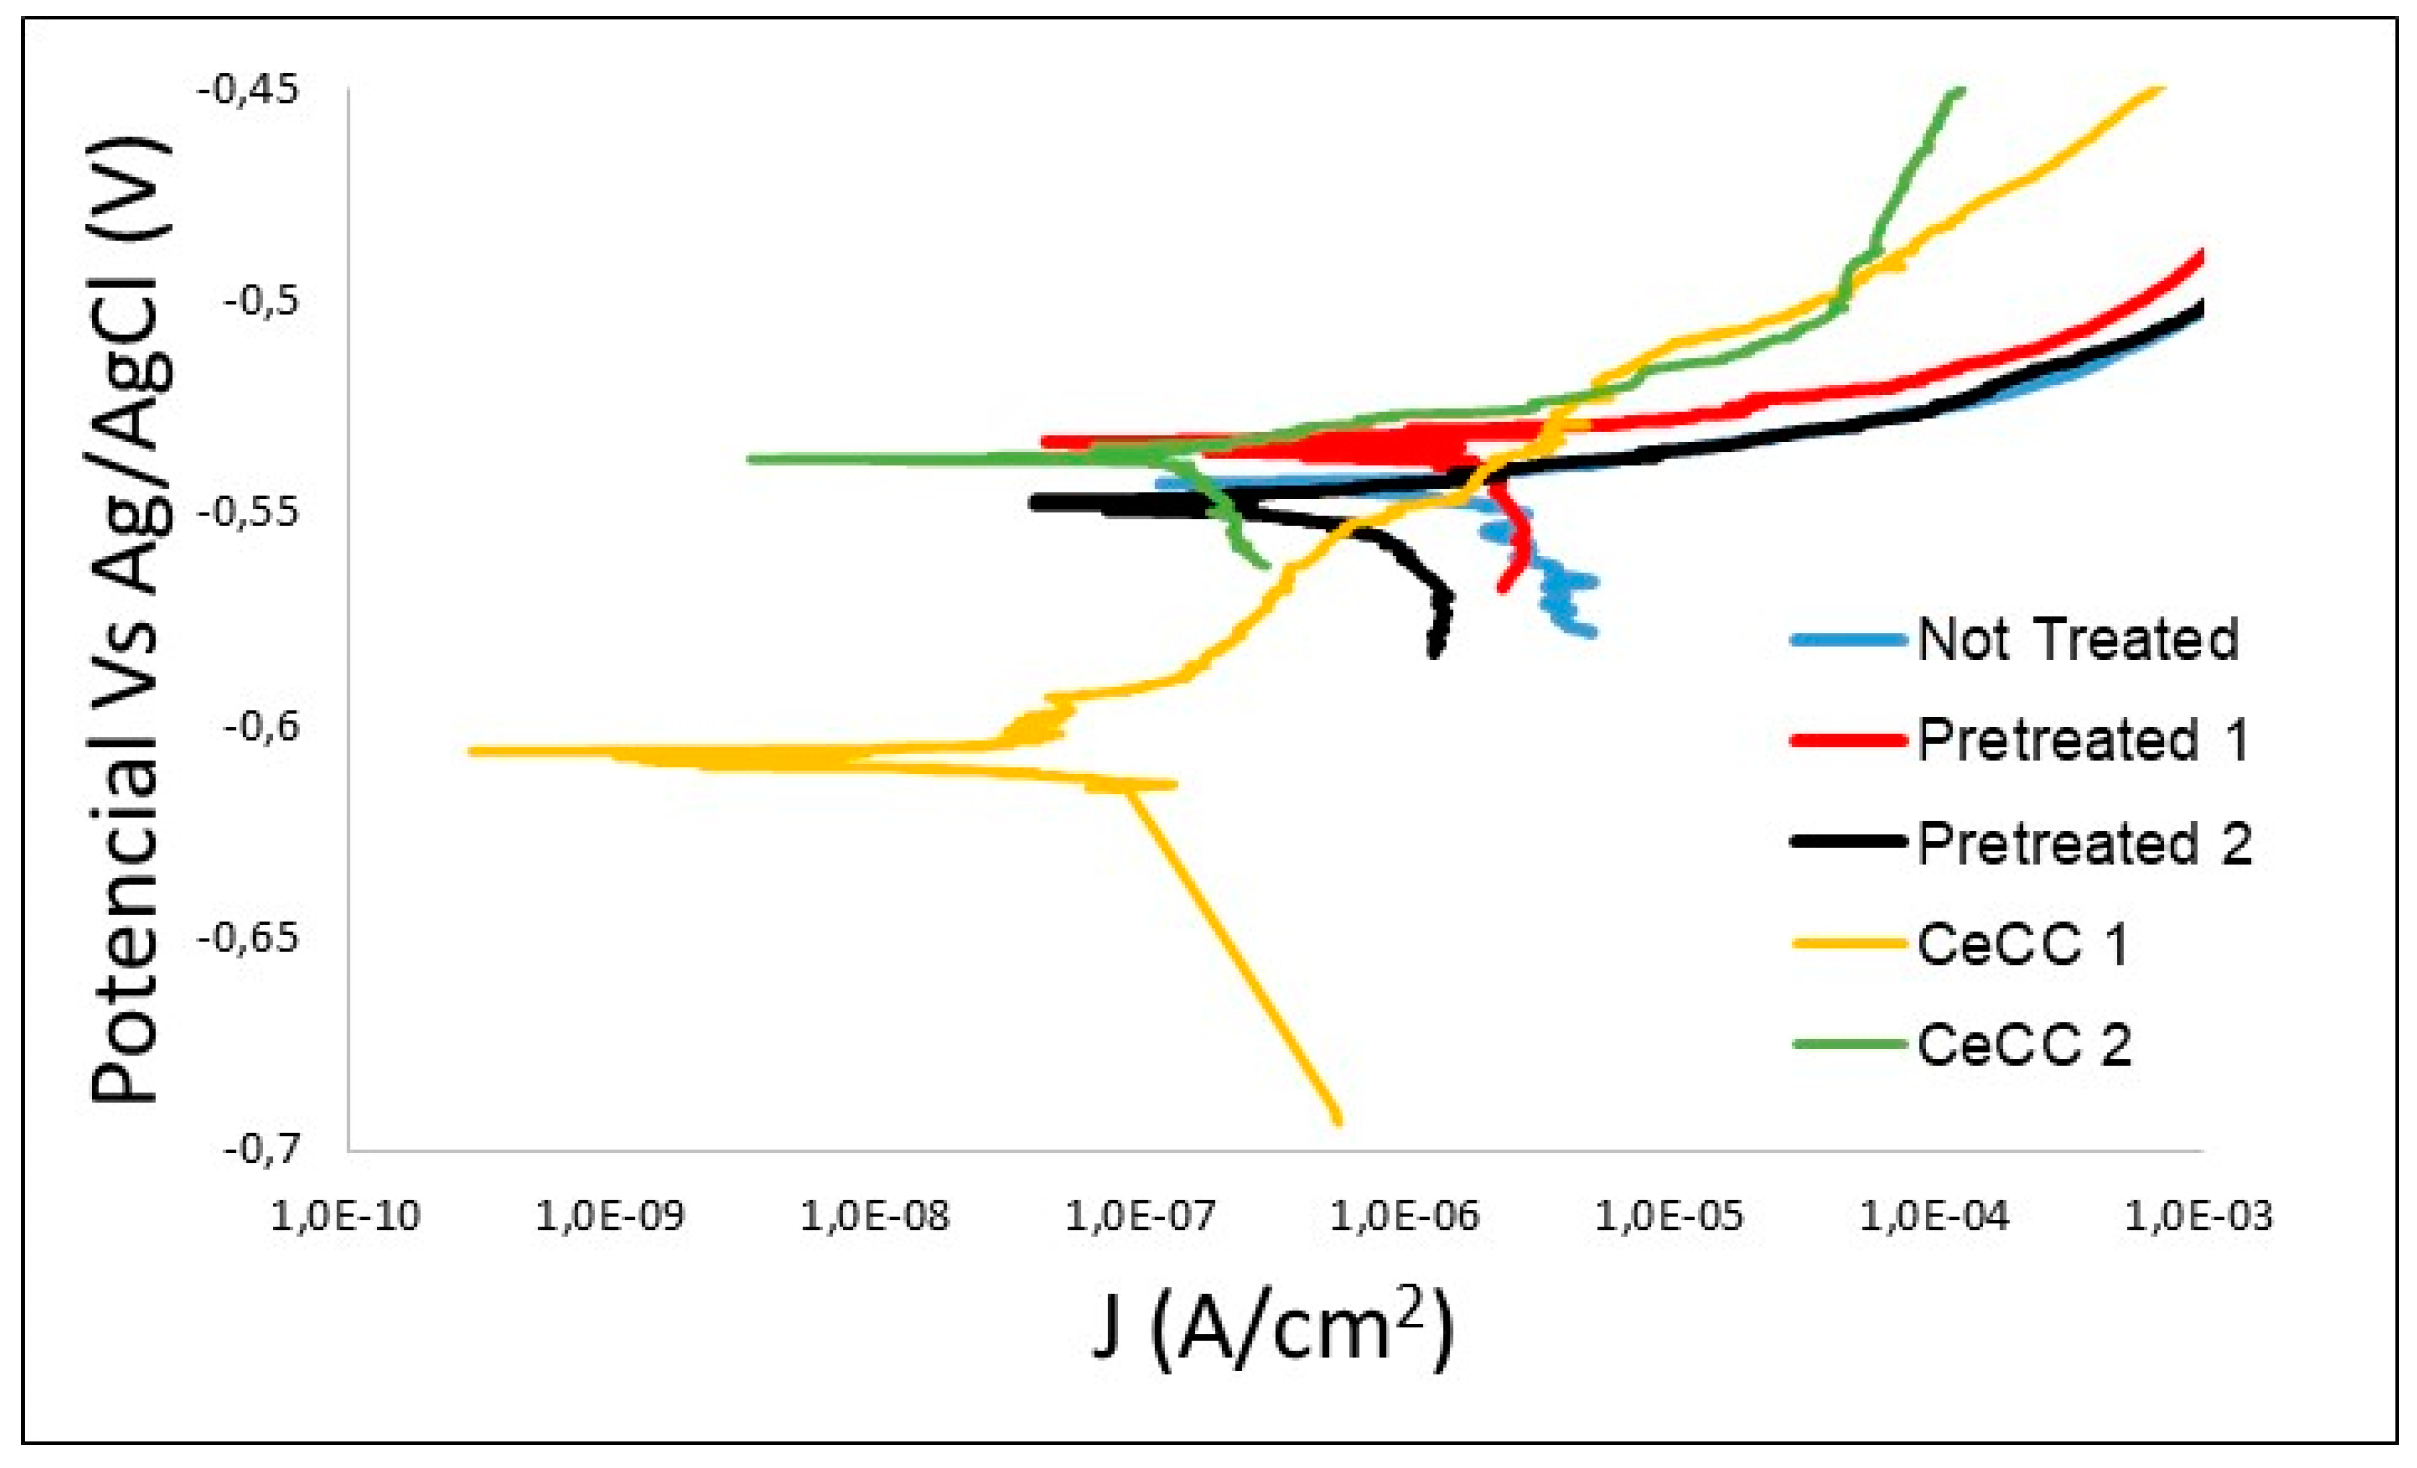
3.3. Electrochemical Characterisation by LP of Uncoated and Coated Samples
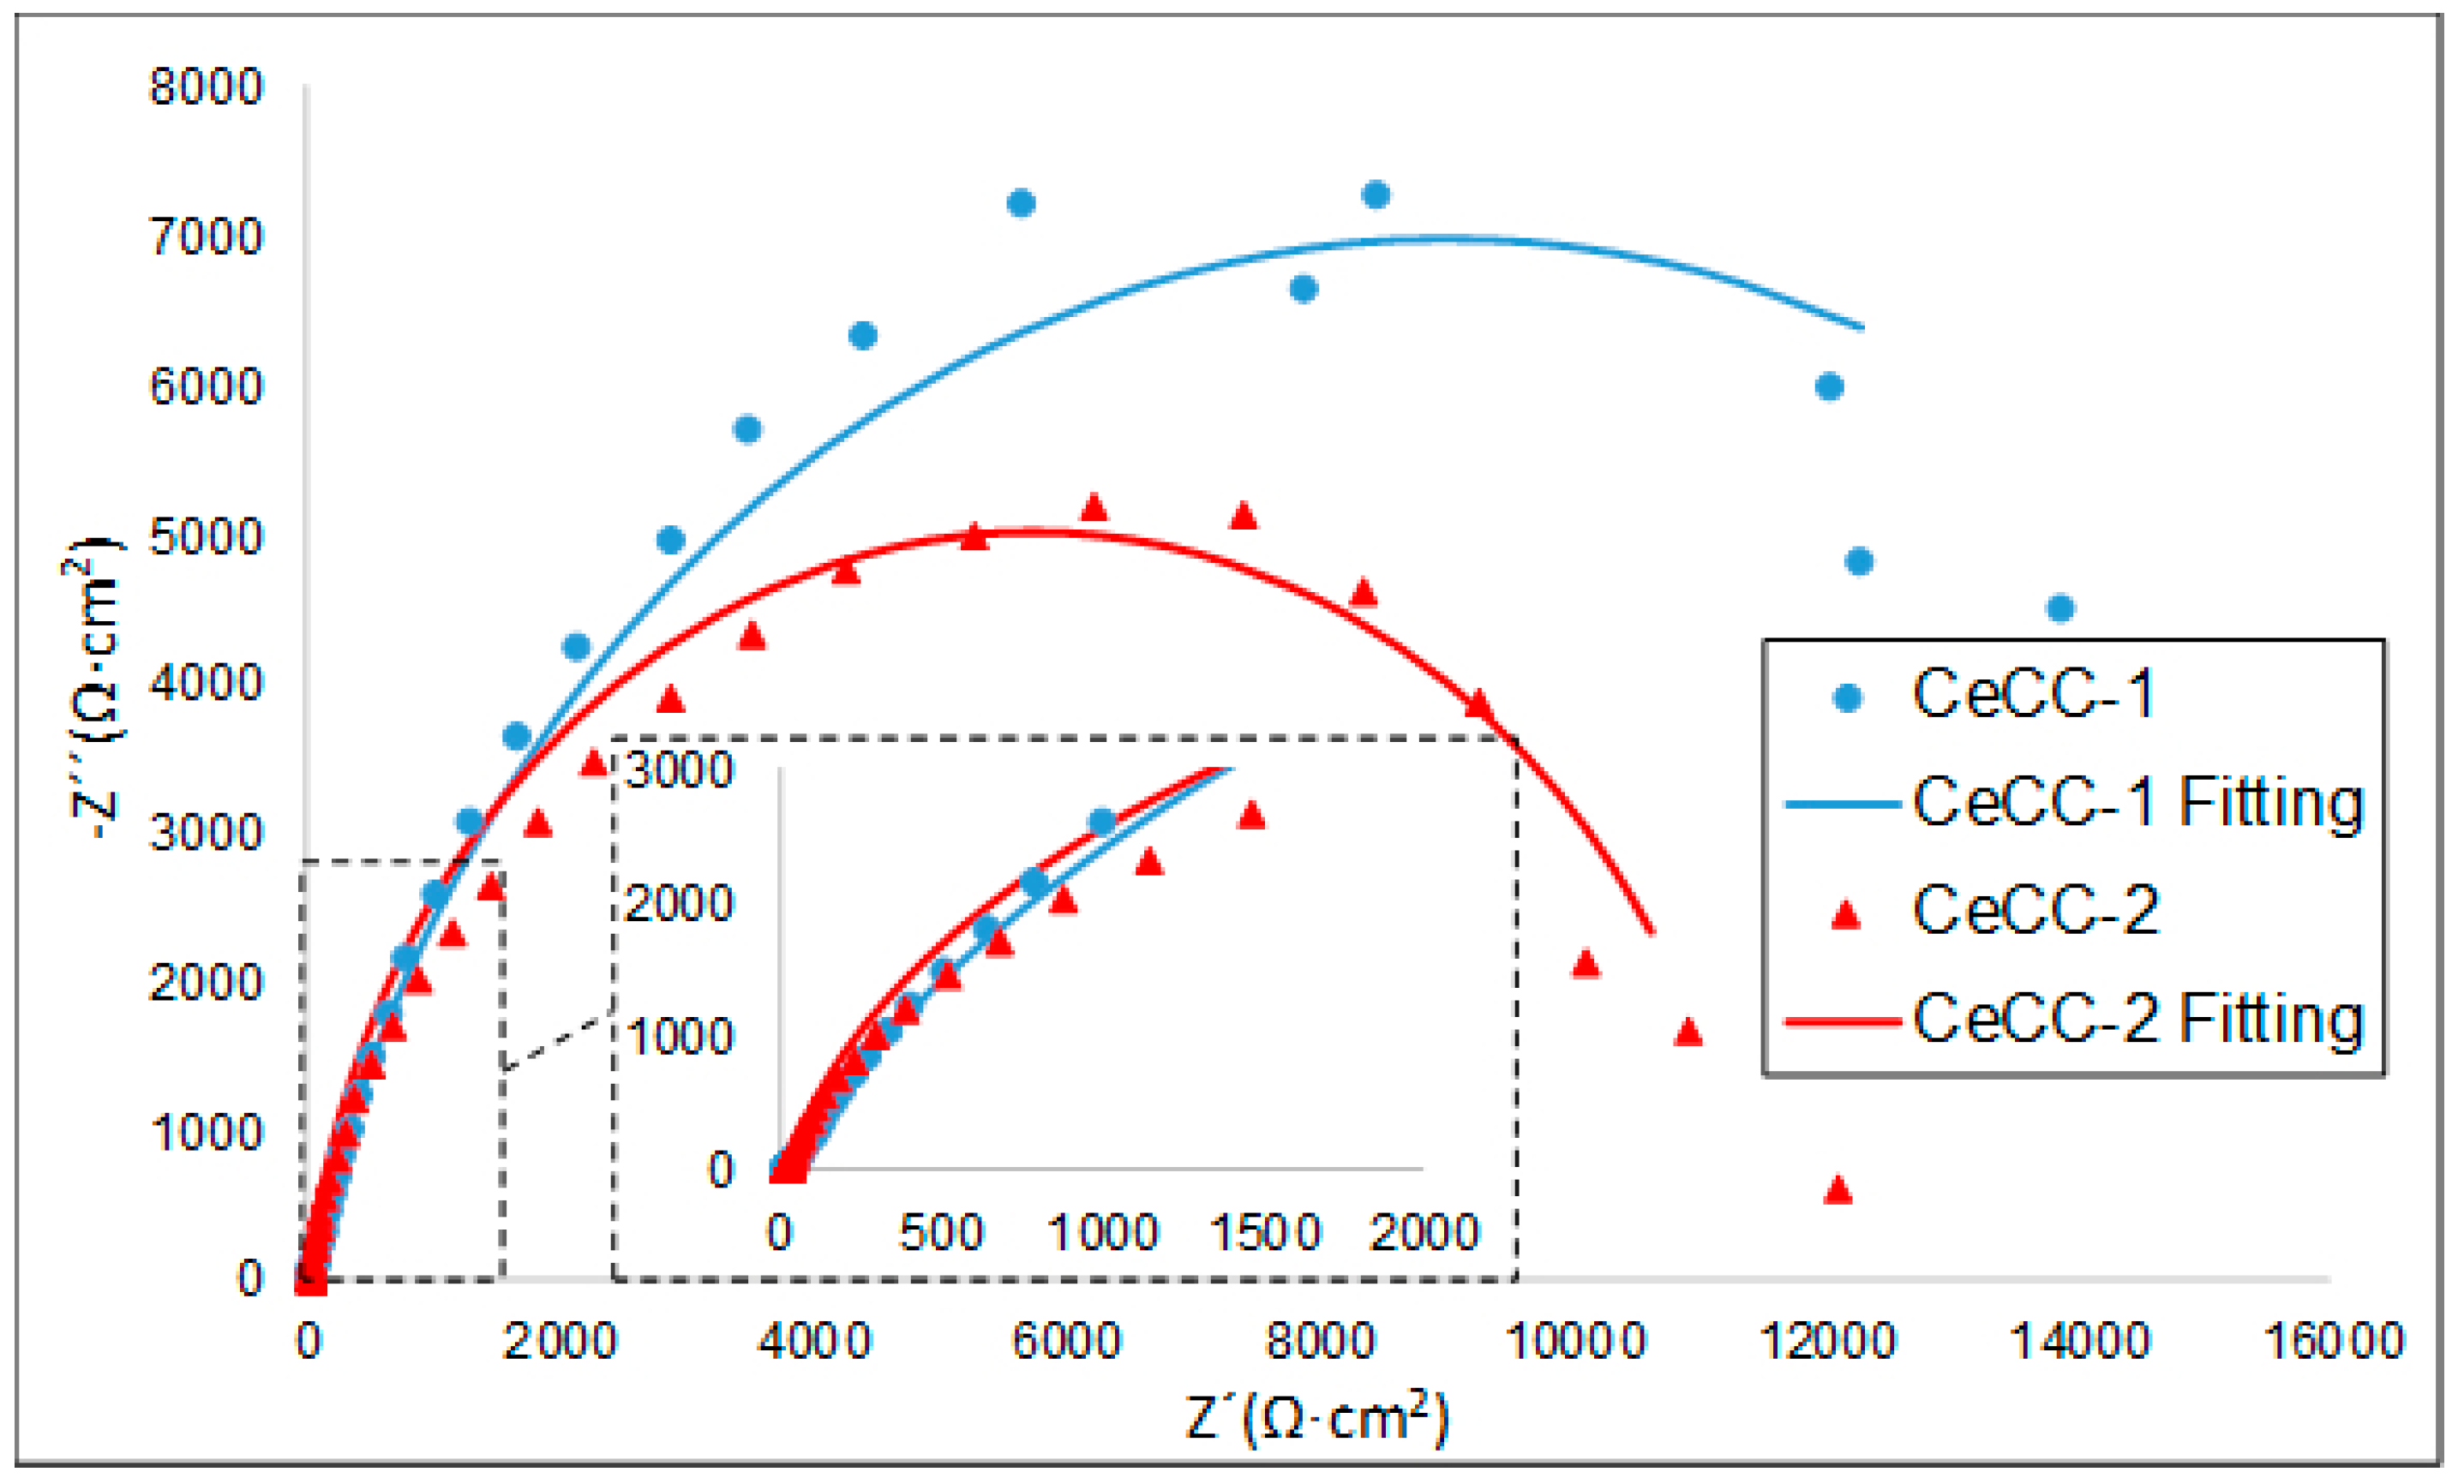
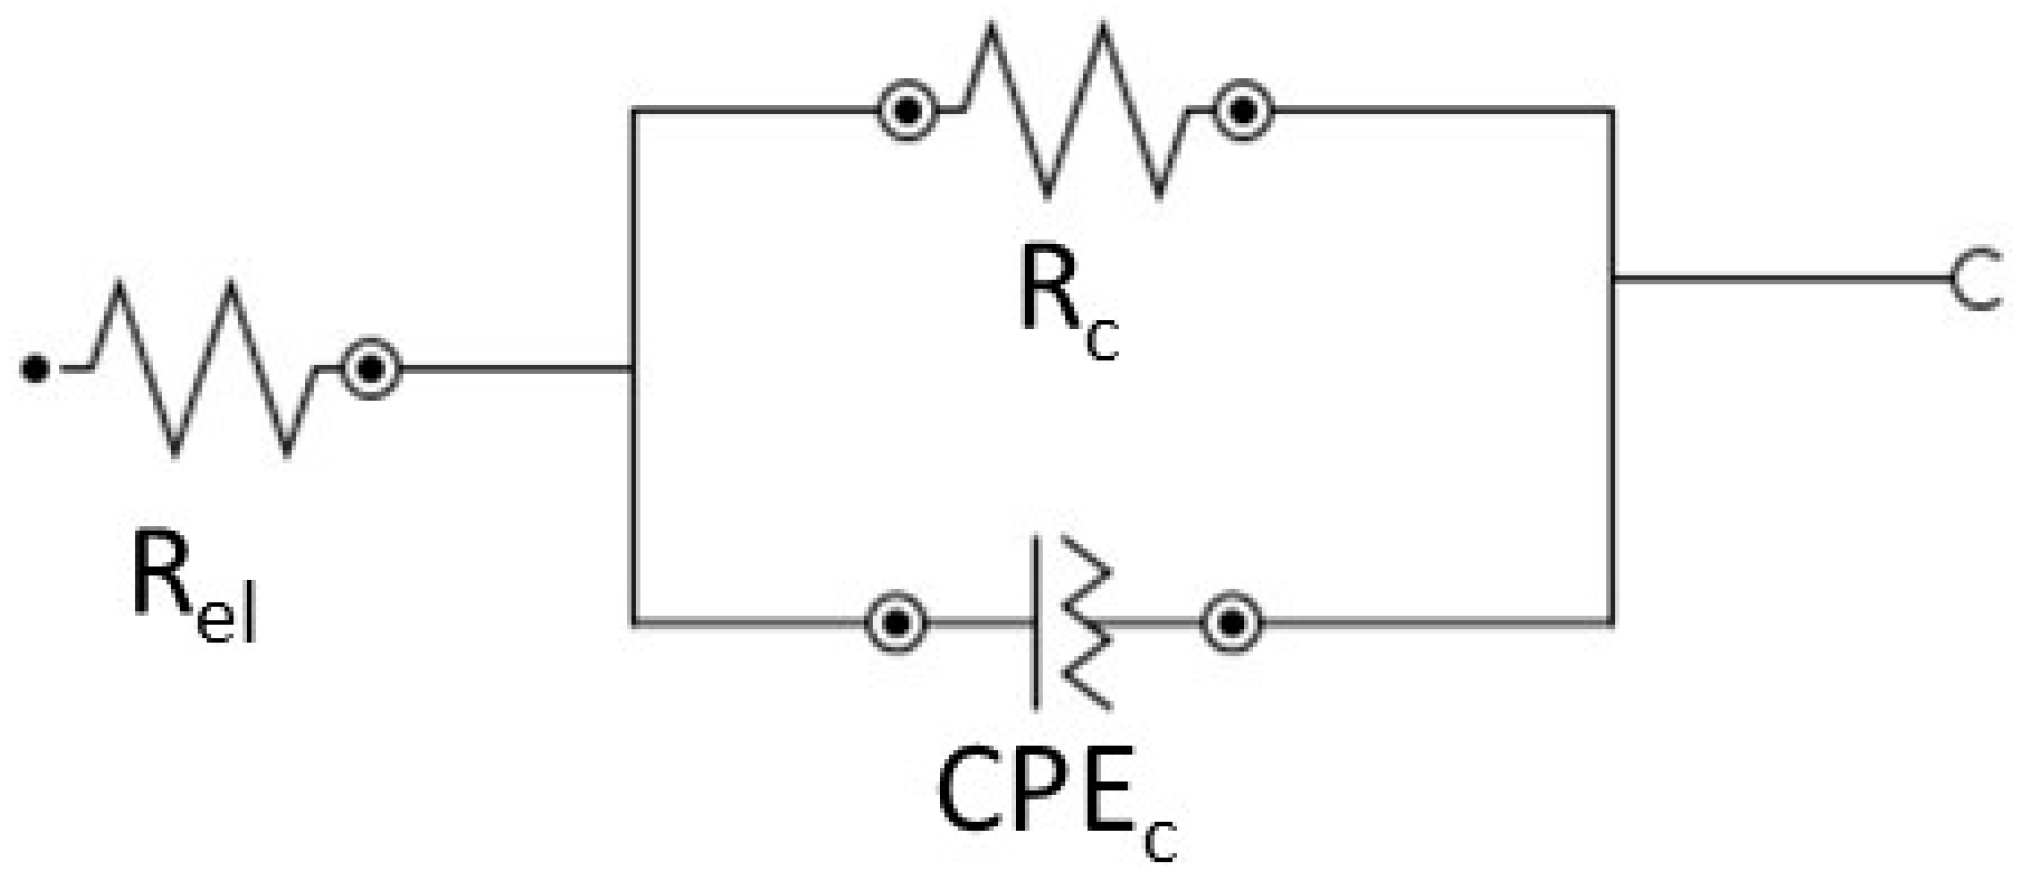
3.4. Electrochemical Characterisation by EIS of Coated Samples
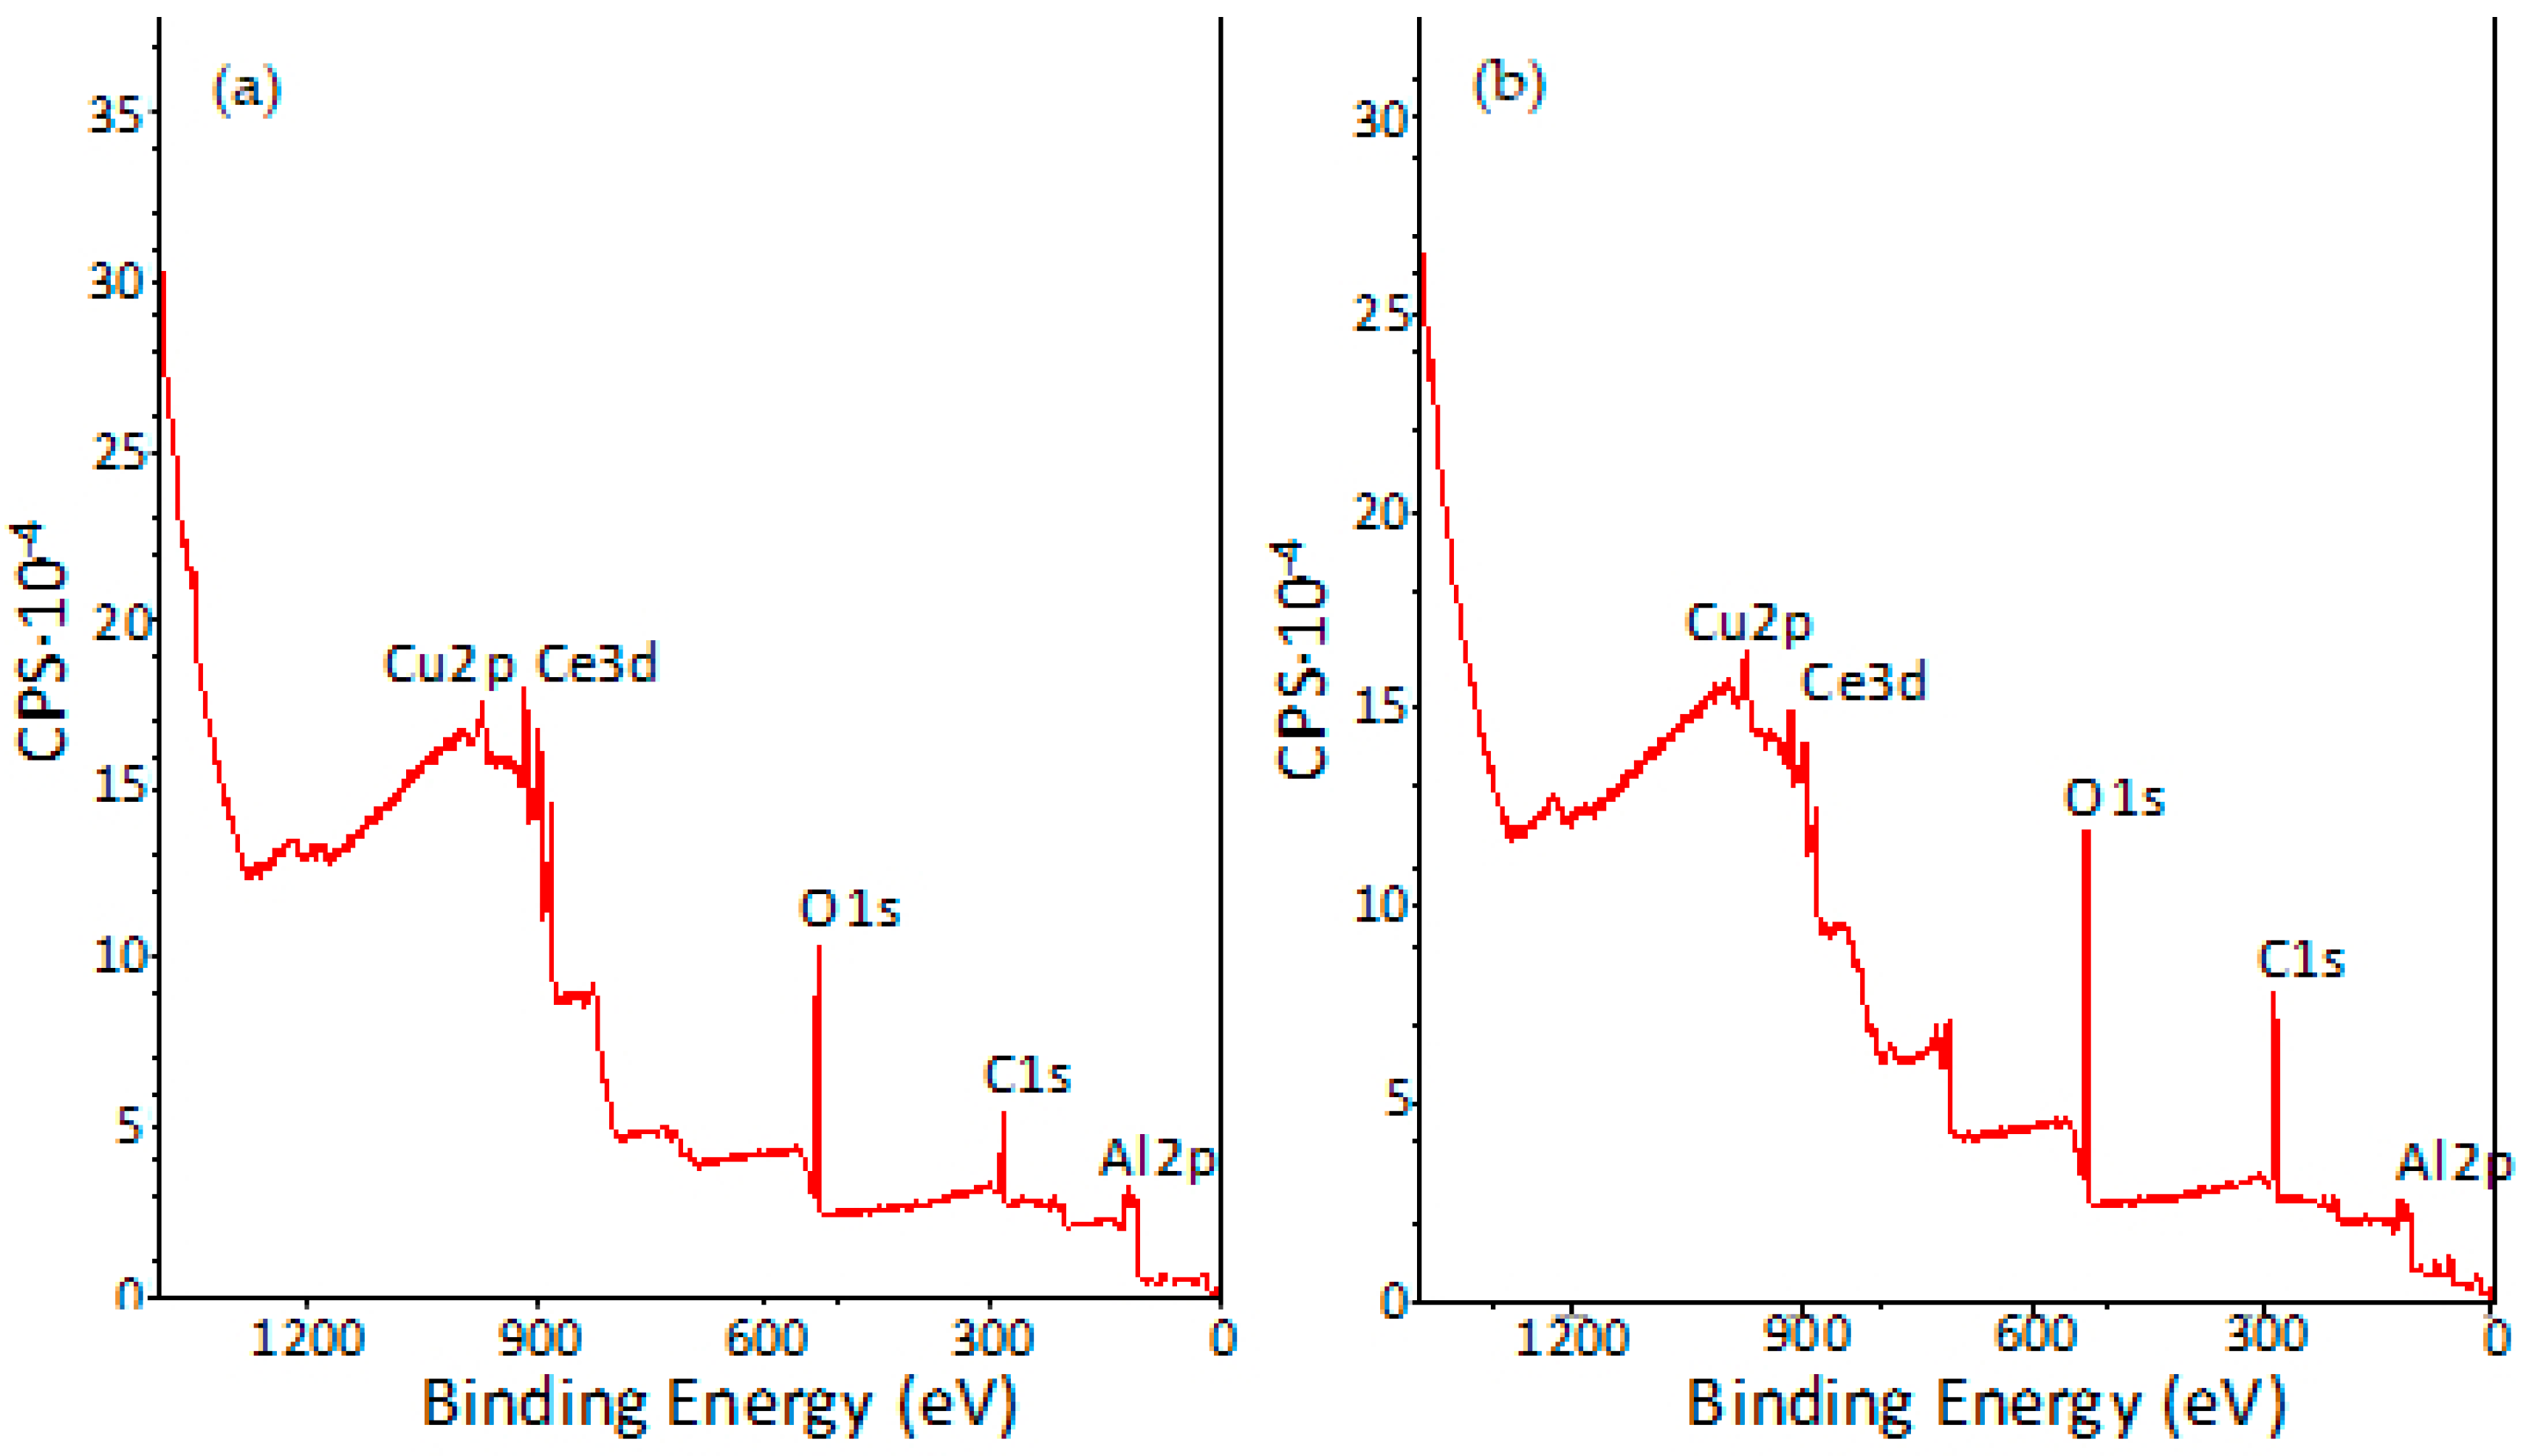
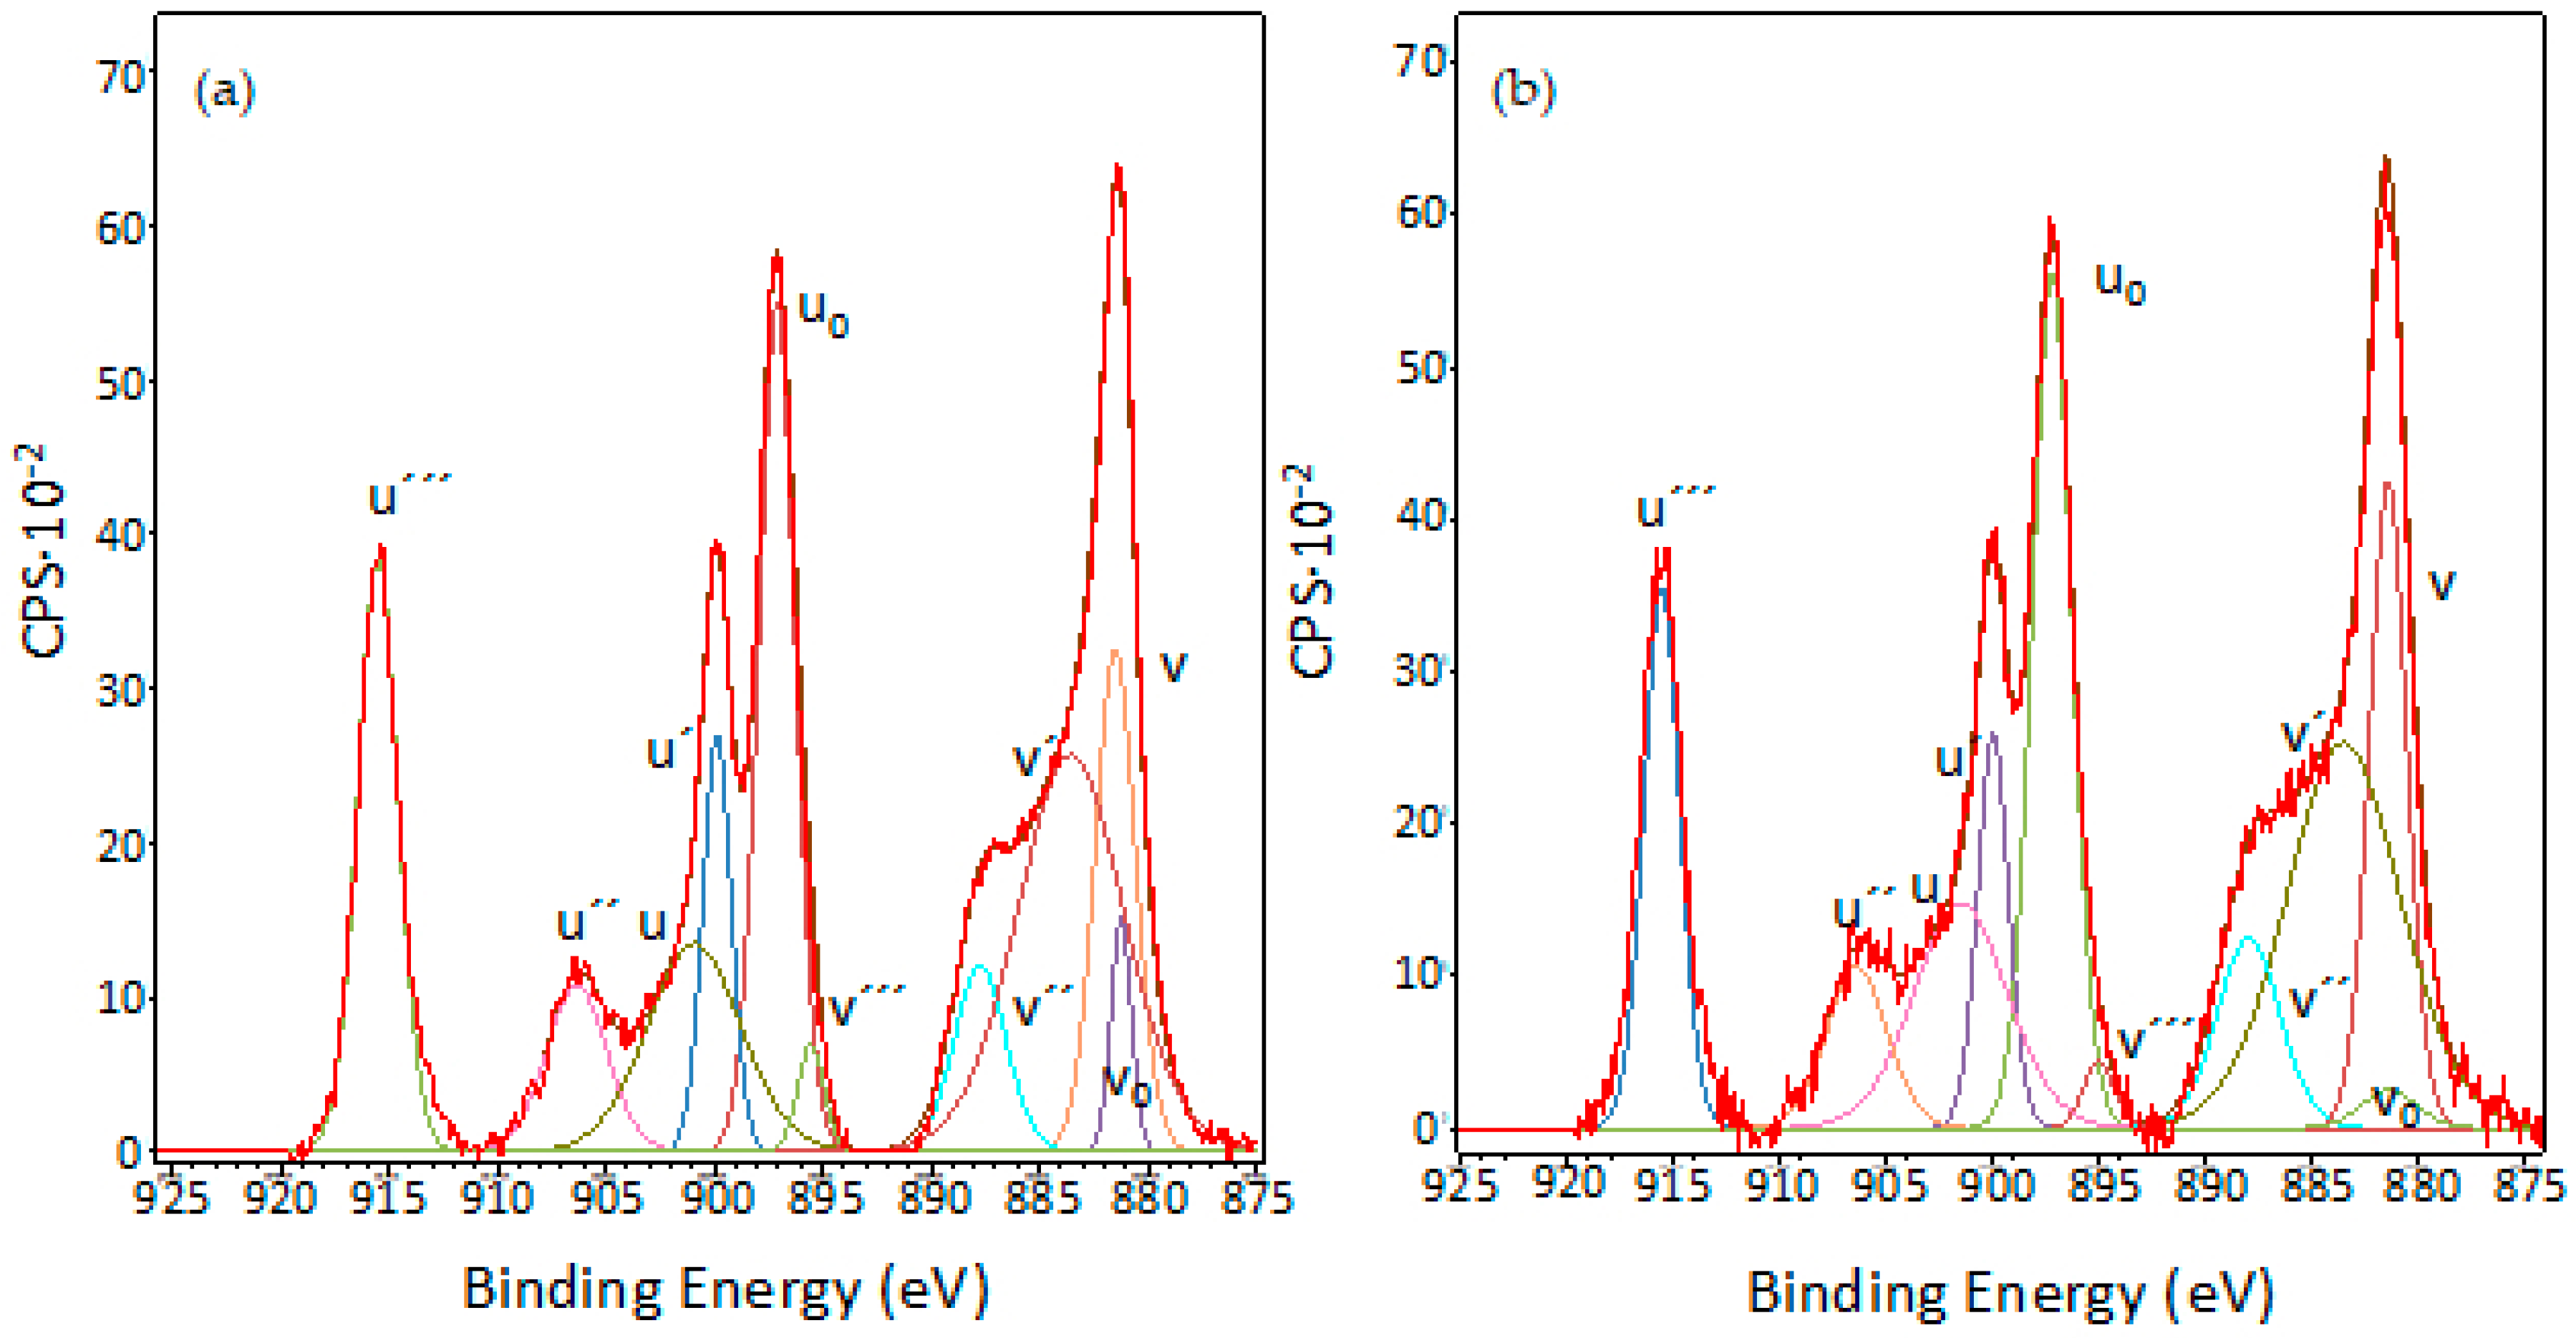
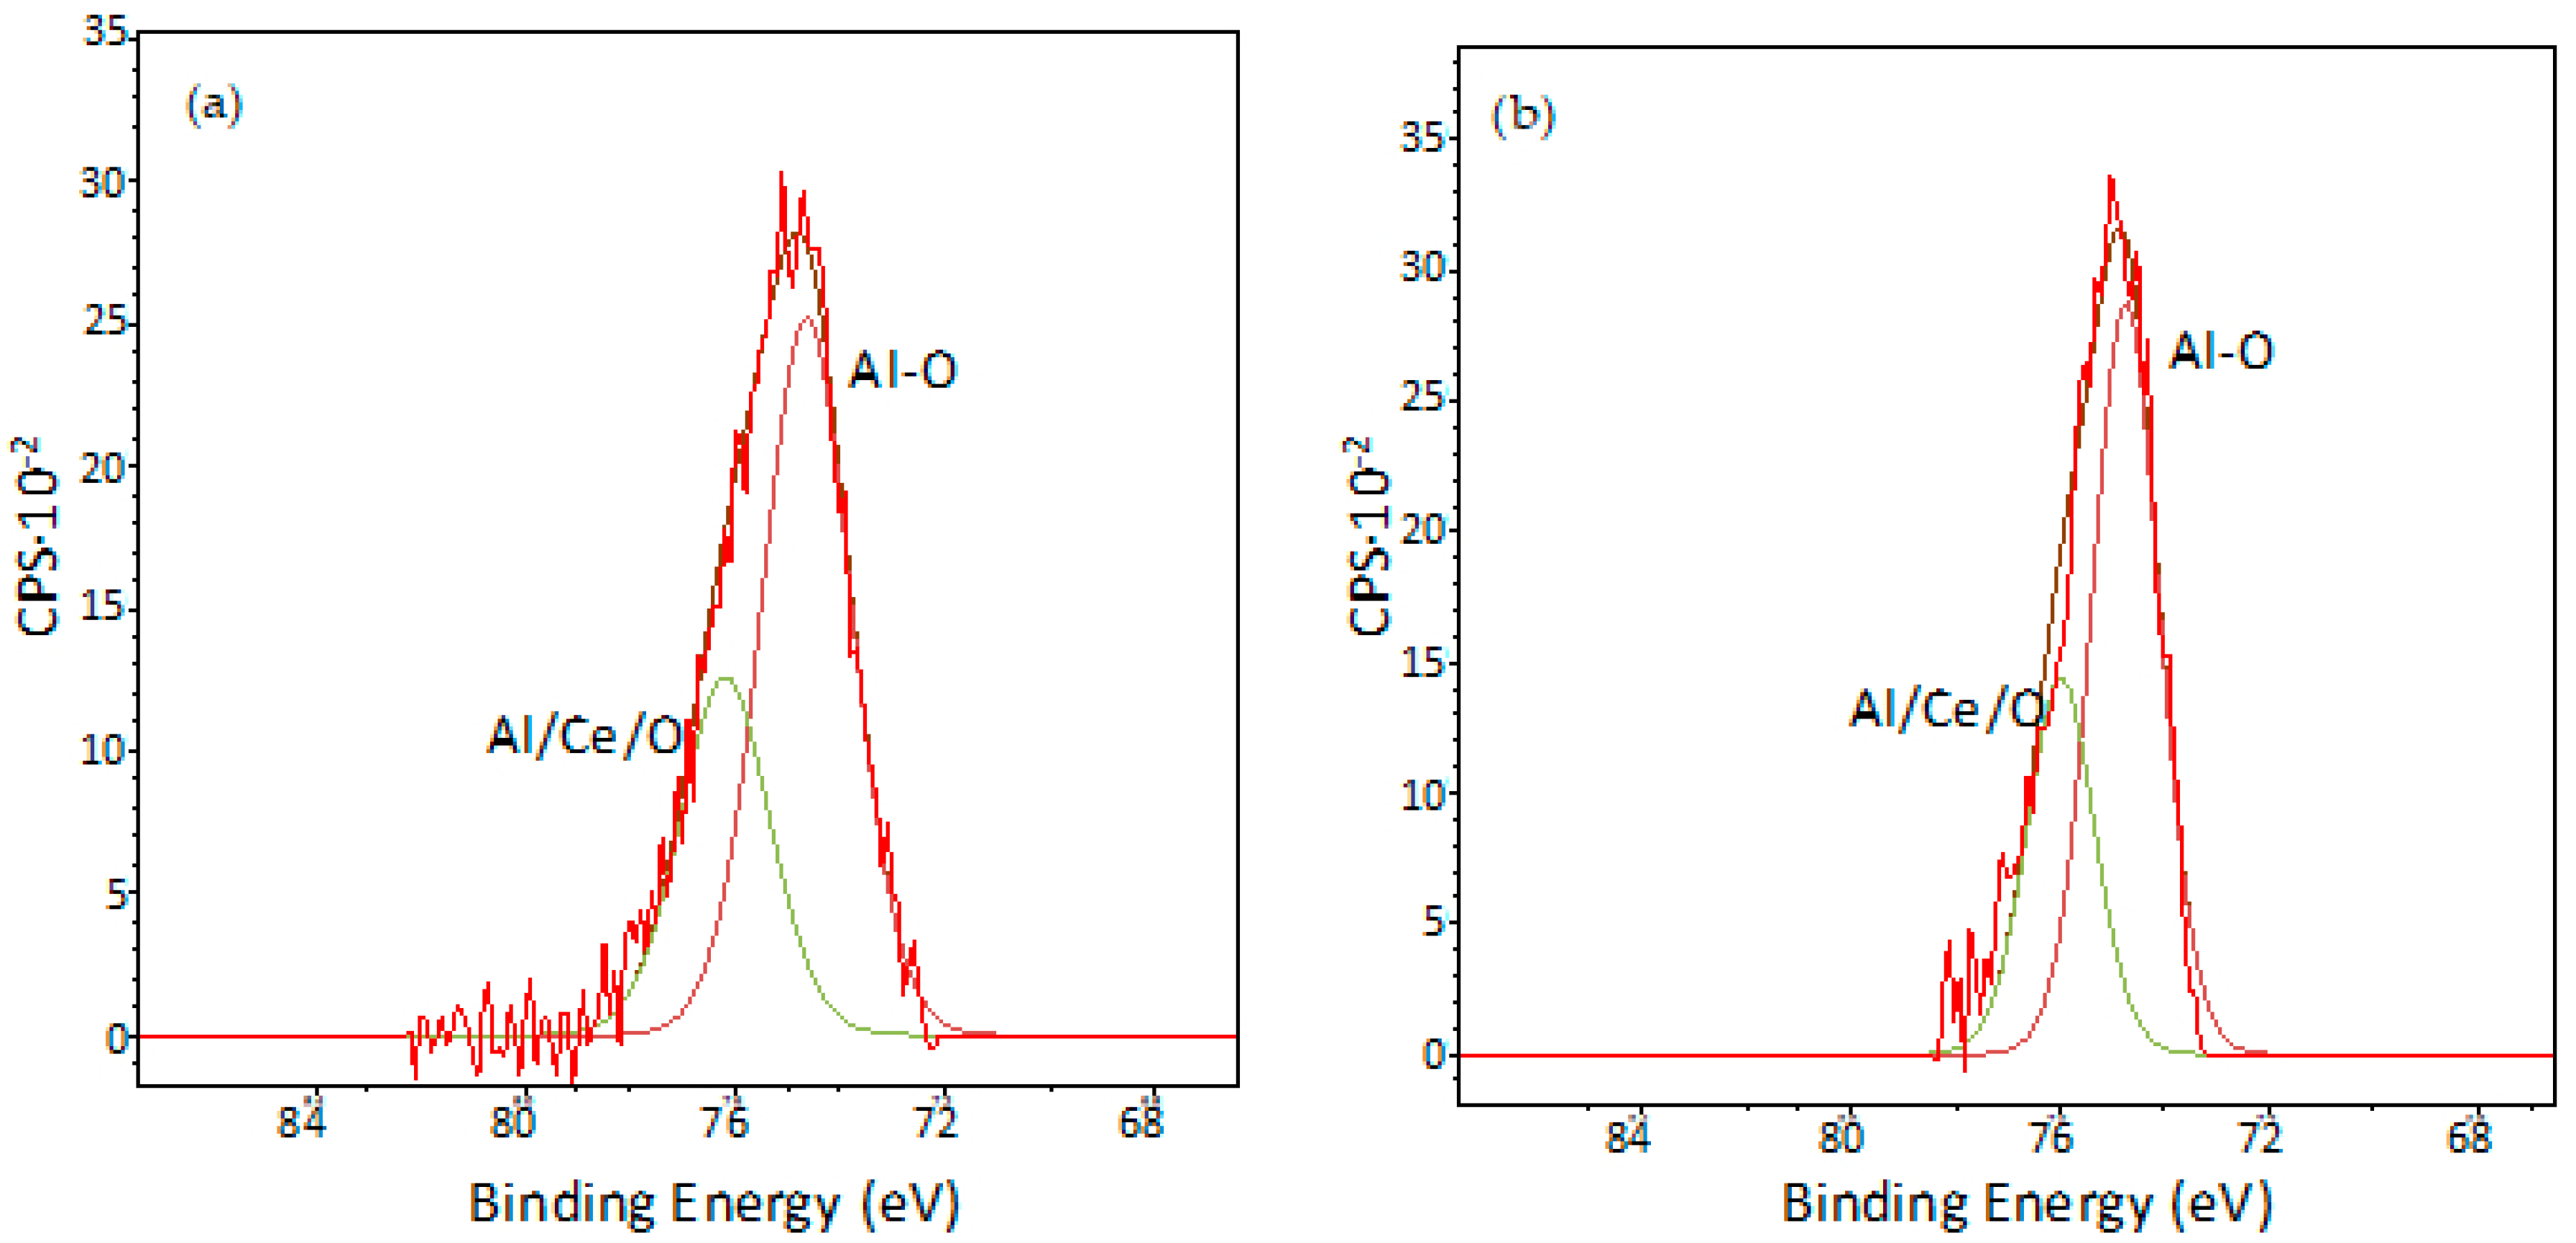
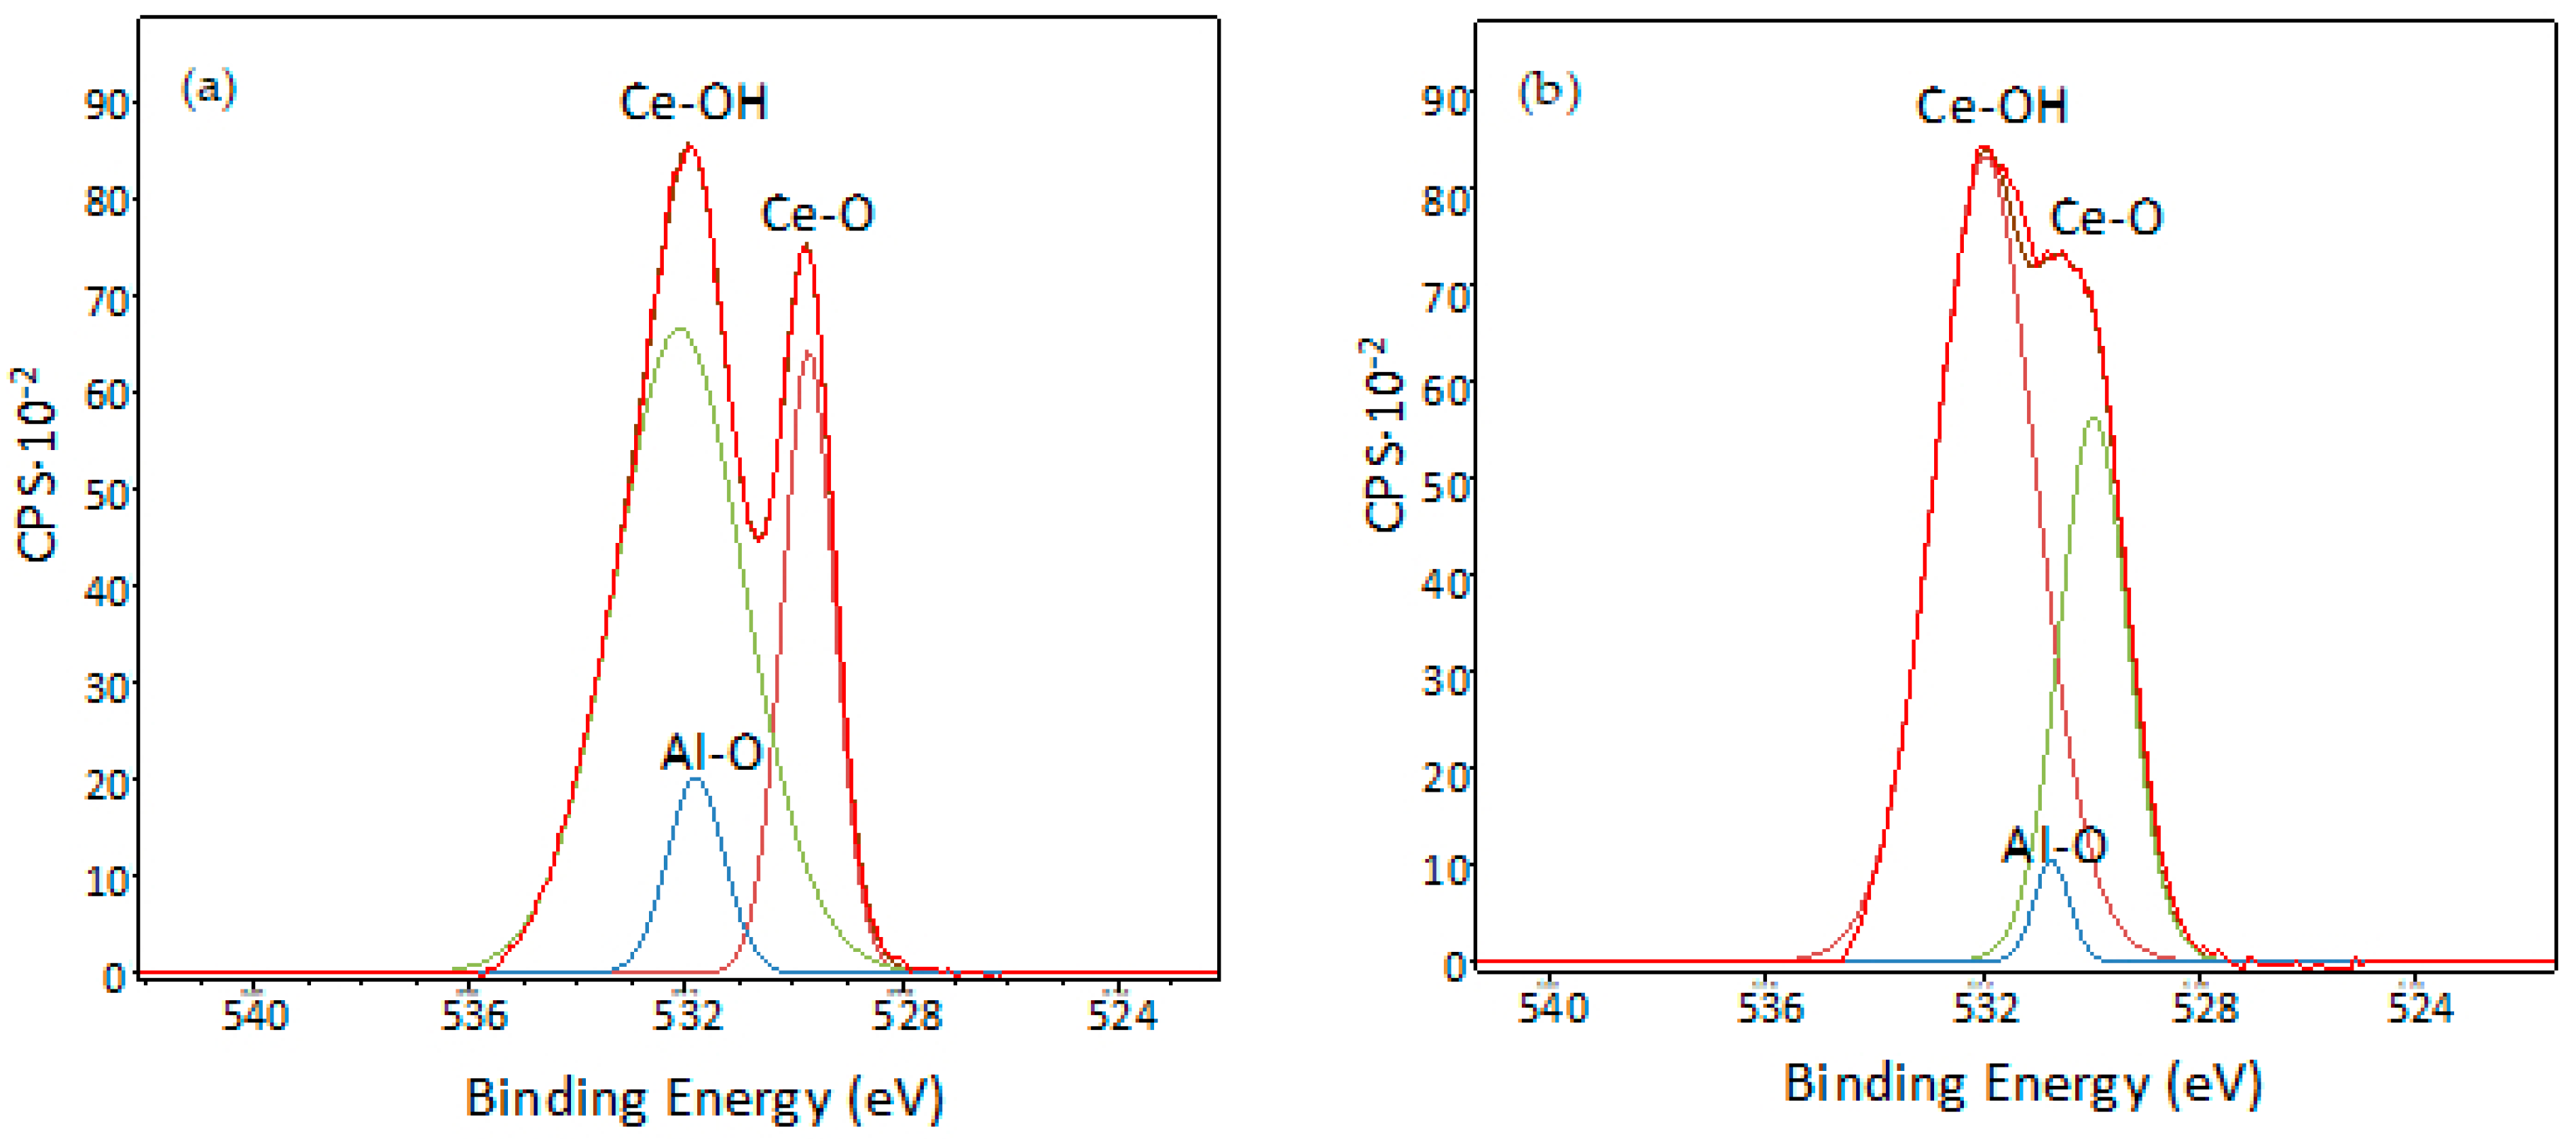
3.5. XPS Characterisation of Coated Samples
4. Discussion
5. Conclusions
Author Contributions
Funding
Acknowledgments
Conflicts of Interest
References and Note
- Guillaumin, V.; Mankowski, G. Localized corrosion of 2024 T351 aluminium alloy in chloride media. Corros. Sci. 1998, 41, 421–438. [Google Scholar] [CrossRef]
- Jones, M.J.; Heurtier, P.; Desrayaud, C.; Montheillet, F.; Allehaux, D.; Driver, J.H. Correlation between microstructure and microhardness in a friction stir welded 2024 aluminium alloy. Scr. Mater. 2005, 52, 693–697. [Google Scholar] [CrossRef]
- Hughes, A.E.; Glenn, A.M.; Wilson, N.; Moffatt, A.; Morton, A.J.; Buchheit, R.G. A consistent description of intermetallic particle composition: An analysis of ten batches of AA2024-T3. Surf. Interface Anal. 2013, 45, 1558–1563. [Google Scholar] [CrossRef]
- Hughes, A.E.; Parvizi, R.; Forsyth, M. Microstructure and corrosion of AA2024. Corros. Rev. 2015, 33, 1–30. [Google Scholar] [CrossRef]
- Zhang, F.; Levine, L.E.; Allen, A.J.; Campbell, C.E.; Creuziger, A.A.; Kazantseva, N.; Ilavsky, J. In situ structural characterization of ageing kinetics in aluminum alloy 2024 across angstrom-to-micrometer length scales. Acta Mater. 2016, 111, 385–398. [Google Scholar] [CrossRef] [PubMed]
- Boag, A.; Hughes, A.E.; Wilson, N.C.; Torpy, A.; MacRae, C.M.; Glenn, A.M.; Muster, T.H. How complex is the microstructure of AA2024-T3? Corros. Sci. 2009, 51, 1565–1568. [Google Scholar] [CrossRef]
- De Rose, J.A.; Suter, T.; Balkowiec, A.; Michalski, J.; Kurzydlowski, K.J.; Schmutz, P. Localised corrosion initiation and microstructural characterization of an Al 2024 alloy with a higher Cu to Mg ratio. Corros. Sci. 2012, 55, 313–325. [Google Scholar] [CrossRef]
- Eichinger, E.; Osborne, J.; Van Cleave, T. Hexavalent chromium elimination: An aerospace industry progress report. Metal Finish. 1997, 95, 36–41. [Google Scholar] [CrossRef]
- Qi, J.; Gao, L.; Li, Y.; Wang, Z.; Thompson, G.E.; Skeldon, P. An optimized trivalent chromium conversion coating process for AA2024-T351 alloy. J. Electrochem. Soc. 2017, 164, 390–395. [Google Scholar] [CrossRef]
- Kendig, M.W.; Buchheit, R.G. Corrosion inhibition of aluminum and aluminum alloys by soluble chromates, chromate coatings, and chromate-free coatings. Corrosion 2003, 59, 379–400. [Google Scholar] [CrossRef]
- Wu, J.; Peng, D.; He, Y.; Du, X.; Zhang, Z.; Zhang, B.; Li, X.; Huang, Y. In situ formation of decavanadate-intercalated layered double hydroxide films on AA2024 and their anti-corrosive properties when combined with hybrid sol gel films. Materials 2017, 10, 426. [Google Scholar] [CrossRef] [PubMed]
- Montemor, M.F. Functional and smart coatings for corrosion protection: A review of recent advances. Surf. Coat. Technol. 2014, 258, 17–37. [Google Scholar] [CrossRef]
- Momtemor, F. Fostering green inhibitors for corrosion prevention. In Active Protective Coatings New-Generation Coatings for Metals, 1st ed.; Hughes, A.E., Mol, J.M.C., Eds.; Springer Netherlands: Dordrecht, The Netherlands, 2016; Volume 233, pp. 107–137. [Google Scholar]
- Bethencourt, M.; Botana, F.J.; Calvino, J.; Marcos, M.; Rodríguez-Chacón, M.A. Anthanide compounds as environmentally-friendly corrosion inhibitors of aluminium alloys: A review. Corros. Sci. 1998, 40, 1803–1919. [Google Scholar] [CrossRef]
- Harvey, T.G. Cerium-based conversion coatings on aluminium alloys: A process review. Corros. Eng. Sci. 2013, 48, 248–264. [Google Scholar] [CrossRef]
- Campestrini, P.; Terryn, H.; Hovestad, A.; de Wit, J.H.W. Formation of a cerium-based conversion coating on AA2024: Relationship with the microstructure. Surf. Coat. Technol. 2003, 176, 365–391. [Google Scholar] [CrossRef]
- Palomino, L.E.M.; Aoki, I.V.; de Melo, H.G. Microstructural and electrochemical characterization of Ce conversion layers formed on Al alloy 2024-T3 covered with Cu-rich smut. Electrochim. Acta 2006, 51, 5943–5953. [Google Scholar] [CrossRef]
- Buchheit, R.G.; Mamidipally, S.B.; Schmutz, P.; Guan, H. Active corrosion protection in Ce-modified hydrotalcite conversion coatings. Corrosion 2002, 58, 3–14. [Google Scholar] [CrossRef]
- Edington, J.; Padwal, A.; Williams, A.; O’Keefe, J.; O’Keefe, T.J. Metal surface preparation tips. Metal. Finish. 2005, 103, 38–41. [Google Scholar] [CrossRef]
- De Frutos, A.; Arenas, M.A.; Liub, Y.; Skeldon, P.; Thompson, G.E.; de Damborenea, J.; Conde, A. Influence of pre-treatments in cerium conversion treatment of AA2024-T3 and 7075-T6 alloys. Surf. Coat. Technol. 2008, 202, 3797–3807. [Google Scholar] [CrossRef]
- Airbus Operation S.L. Specification I+D-P-072: Limpieza y decapado del aluminio y sus aleaciones. Last revision: 17 July 2017. (In Spainish)
- Liangliang, L.; Desouza, A.L.; Swain, G.M. Effect of deoxidation pretreatment on the corrosion inhibition provided by a trivalent chromium process (TCP) conversion coating on AA2024-T3. J. Electrochem. Soc. 2014, 161, 246–253. [Google Scholar]
- Guo, Y.; Frankel, G.S. Characterization of trivalent chromium process coating on AA2024-T3. Surf. Coat. Technol. 2012, 206, 3895–3902. [Google Scholar] [CrossRef]
- Viroulaud, R.; Swiatowska, J.; Seyeux, A.; Zanna, S.; Tardelli, J.; Marcus, P. Influence of surface pretreatments on the quality of trivalent chromium process coatings on aluminum alloy. Appl. Surf. Sci. 2017, 423, 927–938. [Google Scholar] [CrossRef]
- Pinc, W.; Geng, S.; O’Keefe, M.; Fahrenholtz, W.; O’Keefe, T. Effects of acid and alkaline based surface preparations on spray deposited cerium based conversion coatings on Al 2024-T3. Appl. Surf. Sci. 2009, 255, 4061–4065. [Google Scholar] [CrossRef]
- Stern, M.; Geary, A.L. Electrochemical polarization: I. A theoretical analysis of the shape of polarization curves. J. Electrochem. Soc. 1957, 104, 56–63. [Google Scholar] [CrossRef]
- Matter, E.A.; Kozhukharov, S.; MacHkova, M.; Kozhukharov, V. Electrochemical studies on the corrosion inhibition of AA2024 aluminium alloy by rare earth ammonium nitrates in 3.5% NaCl solutions. Mater. Corros. 2013, 64, 408–414. [Google Scholar] [CrossRef]
- Campestrini, P.; Van Westing, E.P.M.; Van Rooijen, H.W.; de Wit, J.H.W. Relation between microstructural aspects of AA2024 and its corrosion behaviour investigated using AFM scanning potential technique. Corros. Sci. 2000, 42, 1853–1861. [Google Scholar] [CrossRef]
- Hughes, A.E.; Harvey, T.G.; Nikpour, T.; Muster, T.H.; Hardin, S.G. Non-chromate deoxidation of AA2024-T3 using Fe(III)–HF–HNO3. Surf. Interface Anal. 2004, 36, 15–23. [Google Scholar] [CrossRef]
- Glenn, A.M.; Hughes, A.E.; Muster, T.H.; Lau, D.; Wilson, N.C.; Torpy, A.; MacRae, C.M.; Ward, J. Investigation into the influence of carbon contamination on the corrosion behavior of Aluminum microelectrodes and AA2024-T3. J. Electrochem. Soc. 2013, 160, 119–127. [Google Scholar] [CrossRef]
- Lau, D.; Glenn, A.M.; Hughes, A.E.; Scholes, F.H.; Muster, T.H.; Hardin, S.G. Factors influencing the deposition of Ce-based conversion coatings, Part II: The role of localised reactions. Surf. Coat. Technol. 2009, 203, 2937–2945. [Google Scholar] [CrossRef]
- Hughes, A.E.; Scholes, F.H.; Glenn, A.M.; Lau, D.; Muster, T.H.; Hardin, S.G. Factors influencing the deposition of Ce-based conversion coatings, part I: The role of Al3+ ions. Surf. Coat. Technol. 2009, 203, 2927–2936. [Google Scholar] [CrossRef]
- Dabalà, M.; Ramous, E.; Magrini, M. Corrosion resistance of cerium-based chemical conversion coatings on AA5083 aluminium alloy. Mater. Corros. 2004, 55, 381–386. [Google Scholar] [CrossRef]
- Sánchez-Amaya, J.M.; Blanco, G.; García-García, F.J.; Bethencourt, M.; Botana, F.J. XPS and AES analyses of cerium conversion coatings generated on AA5083 by thermal activation. Surf. Coat. Technol. 2012, 213, 105–116. [Google Scholar] [CrossRef]
- Uhart, A.; Ledeuil, J.B.; Gonbeau, D.; Dupin, J.V.; Bonino, J.P.; Ansart, F.; Esteban, J. An auger and XPS survey of cerium active corrosion protection forAA2024-T3 aluminum alloy. Appl. Surf. Sci. 2016, 390, 751–759. [Google Scholar] [CrossRef]
- Shyu, J.Z.; Otto, K.; Watkins, W.L.H.; Graham, G.W. Characterization of Pd/γ-alumina catalysts containing ceria. J. Catal. 1988, 114, 23–33. [Google Scholar] [CrossRef]
- Heller, D.K.; Fahreholtz, W.G.; O’Keefe, M.J. The effect of post-treatment time and temperature on cerium-based conversion coatings on Al 2024-T3. Corros. Sci. 2010, 52, 360–368. [Google Scholar] [CrossRef]
- Yu, X.; Li, G. XPS study of cerium conversion coating on the anodized 2024 aluminum alloy. J. Alloys Compd. 2004, 364, 193–198. [Google Scholar] [CrossRef]
- Lacroix, L.; Ressier, L.; Blanc, C.; Mankowski, G. Statistical study of the corrosion behaviour of Al2CuMg intermetallics in AA2024-T351 by SKPFM. J. Electrochem. Soc. 2008, 155, 8–15. [Google Scholar] [CrossRef]
- Lacroix, L.; Ressier, L.; Blanc, C.; Mankowski, G. Combination of AFM, SKPMF and SIMD to study the corrosion behaviour of S-phase particles in AA2024-T351. J. Electrochem. Soc. 2008, 155, 131–137. [Google Scholar] [CrossRef]
- Li, J.; Dang, J. A summary of corrosion properties of Al-rich solid solution and secondary phases particles in Al alloys. Metals 2017, 7, 84. [Google Scholar] [CrossRef]
- Aballe, A.; Bethencourt, M.; Botana, F.J.; Marcoa, M.; Sánchez-Amaya, J.M. Influence of the degree of polishing of alloy AA 5083 on its behaviour against localised alkaline corrosion. Corros. Sci. 2004, 46, 1909–1920. [Google Scholar] [CrossRef]
- Mishra, A.K.; Balasubramaniam, R. Corrosion inhibition of aluminium by rare earth chloride. Mater. Chem. Phys. 2007, 103, 385–393. [Google Scholar] [CrossRef]
- Bethencourt, M.; Botana, F.J.; Cano, M.J.; González-Rovira, L.; Marcos, M.; Sánchez-Amaya, J.M. Protection by thermal and chemical activation with cerium salts of the alloy AA2017 in aqueous solutions of NaCl. Metall. Mater. Trans. A 2012, 43, 182–194. [Google Scholar] [CrossRef]
- Hughes, A.E.; Gorman, J.D.; Miller, P.R.; Sexton, B.A.; Paterson, P.J.K.; Taylor, R.J. Development of cerium-based conversion coatings on 2024-T3 Al alloy after rare-earth desmutting. Surf. Interface Anal. 2004, 36, 290–303. [Google Scholar] [CrossRef]
- Dabalà, M.; Armelao, L.; Buchberger, A.; Calliari, I. Cerium-based conversion layers on aluminum alloys. Appl. Surf. Sci. 2001, 172, 312–322. [Google Scholar] [CrossRef]
- Decroly, A.; Petijean, J.P. Study of the deposition of cerium oxide by conversion on to aluminium alloy. Surf. Coat. Technol. 2005, 194, 1–9. [Google Scholar] [CrossRef]
- Scholes, F.H.; Soste, C.; Hughes, A.E.; Hardin, S.G.; Curtis, P.R. The role of hydrogen peroxide in the deposition of cerium-based conversion coatings. Appl. Surf. Sci. 2006, 253, 1770–1780. [Google Scholar] [CrossRef]
- Hughes, A.E.; Gorman, J.D.; Paterson, P.J.K. The characterisation of Ce-Mo-based conversion coatings on Al-alloys: Part, I. Corros. Sci. 1996, 38, 1957–1976. [Google Scholar] [CrossRef]


| Si | Fe | Cu | Mn | Mg | Cr | Zn | Ti | Al |
|---|---|---|---|---|---|---|---|---|
| 0.07 | 0.20 | 4.44 | 0.58 | 1.80 | 0.10 | 0.25 | 0.026 | 93.00 |
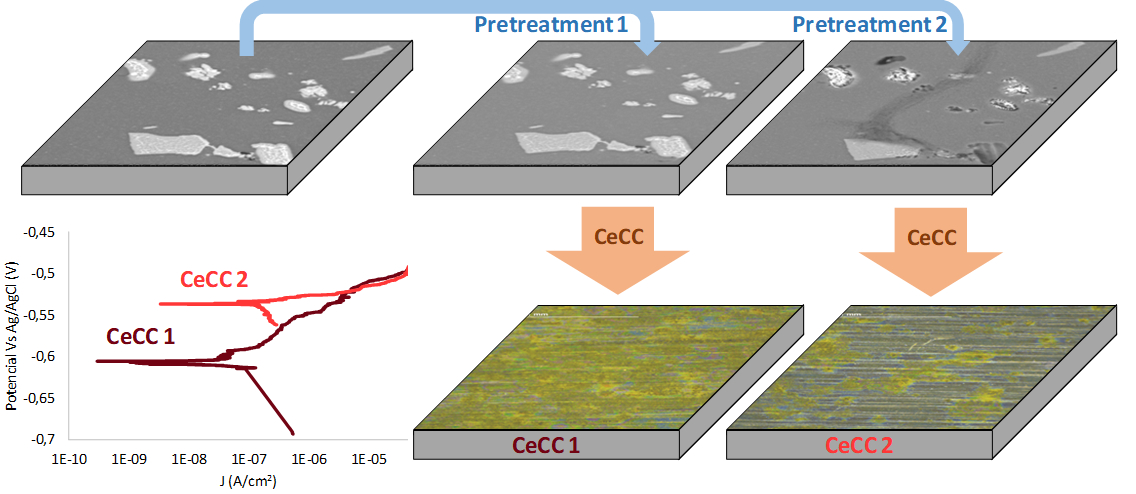
| Electrochemical Parameters | Not Treated | Pretreated 1 | Pretreated 2 | CeCC-1 | CeCC-2 |
|---|---|---|---|---|---|
| Ecorr (V) | −0.543 | −0.535 | −0.549 | −0.609 | −0.537 |
| Enp (V) | −0.543 | −0.535 | −0.549 | −0.520 | −0.520 |
| Jcorr (A·cm−2) | 2.70 × 10⁻⁵ | 2.45 × 10⁻⁵ | 4.07 × 10⁻⁶ | 2.1 × 10⁻⁷ | 1.31 × 10⁻⁶ |
| Rp (Ω·cm2) | 955 | 1068 | 6407 | 1.23 × 10⁵ | 1.99 × 10⁴ |
| R2 | 0.830 | 0.766 | 0.872 | 0.854 | 0.867 |
| Equivalents Circuit Elements | CeCC-1 | CeCC-2 |
|---|---|---|
| Re (Ω·cm2) | 23.5 | 20 |
| Rc (Ω·cm2) | 18,000 | 12,000 |
| CPE (µΩ−1·Sn·cm−2) | 352 | 253 |
| n | 0.840 | 0.861 |
| Signals | CeCC-1 | CeCC-2 |
|---|---|---|
| O1s | 84.22 | 87.76 |
| Al2p | 9.75 | 9.25 |
| Ce3d | 5.98 | 2.79 |
| Cu2p | 0.05 | 0.20 |
| Signals | CeCC-1 | CeCC-2 |
|---|---|---|
| Ce (IV) | ||
| v–u | 881.6–901.3 | 881.4–901.4 |
| v″–u″ | 887.91–906.3 | 887.9–906.6 |
| v‴–u‴ | 895.6–915.6 | 895.3–915.6 |
| Ce(III) | ||
| v0–u0 | 881.1–897.4 | 881.1–897.3 |
| v′–u′ | 883.6–901.0 | 883.5–900.3 |
© 2019 by the authors. Licensee MDPI, Basel, Switzerland. This article is an open access article distributed under the terms and conditions of the Creative Commons Attribution (CC BY) license (http://creativecommons.org/licenses/by/4.0/).
Share and Cite
Alba-Galvín, J.J.; González-Rovira, L.; Bethencourt, M.; Botana, F.J.; Sánchez-Amaya, J.M. Influence of Aerospace Standard Surface Pretreatment on the Intermetallic Phases and CeCC of 2024-T3 Al-Cu Alloy. Metals 2019, 9, 320. https://doi.org/10.3390/met9030320
Alba-Galvín JJ, González-Rovira L, Bethencourt M, Botana FJ, Sánchez-Amaya JM. Influence of Aerospace Standard Surface Pretreatment on the Intermetallic Phases and CeCC of 2024-T3 Al-Cu Alloy. Metals. 2019; 9(3):320. https://doi.org/10.3390/met9030320
Chicago/Turabian StyleAlba-Galvín, Juan Jesús, Leandro González-Rovira, Manuel Bethencourt, Francisco Javier Botana, and José María Sánchez-Amaya. 2019. "Influence of Aerospace Standard Surface Pretreatment on the Intermetallic Phases and CeCC of 2024-T3 Al-Cu Alloy" Metals 9, no. 3: 320. https://doi.org/10.3390/met9030320
APA StyleAlba-Galvín, J. J., González-Rovira, L., Bethencourt, M., Botana, F. J., & Sánchez-Amaya, J. M. (2019). Influence of Aerospace Standard Surface Pretreatment on the Intermetallic Phases and CeCC of 2024-T3 Al-Cu Alloy. Metals, 9(3), 320. https://doi.org/10.3390/met9030320