Article

Microstructure-Based Constitutive Modelling of Low-Alloy Multiphase TRIP Steels

1
Departamento de Tecnologías Industriales, Universidad de Talca, Camino a Los Niches, km. 1, Curicó 3340000, Chile
2
Departamento de Ingeniería Mecánica y Metalúrgica, Centro de Investigación en Nanotecnología y Materiales Avanzados (CIEN-UC), Pontificia Universidad Católica de Chile, Vicuña Mackenna 4860, Macul 7820436, Chile
3
Departamento de Ingeniería Metalúrgica, Universidad de Santiago de Chile, Av. Ecuador 3735, Estación Central 9170124, Chile
*
Author to whom correspondence should be addressed.
Metals 2019, 9(2), 250; https://doi.org/10.3390/met9020250
Submission received: 14 December 2018 / Revised: 11 February 2019 / Accepted: 13 February 2019 / Published: 20 February 2019
(This article belongs to the Special Issue Constitutive Modelling for Metals)

Abstract

:
The microstructure of low-alloy multiphase transformation-induced plasticity (TRIP) steels consists of ferrite, bainite, and metastable retained austenite, which can be transformed into martensite by plastic deformation. In some cases, residual martensite can be present in the initial microstructure. The mechanical behavior of these steels depends on the interaction between the intrinsic characteristics of the existing phases and the austenite stability. Due to these factors, the definition of their true stress-strain flow law is complex. This work presents the mechanical characterization of a phenomenological constitutive stress-strain flow law based on the Bouquerel et al. model, as evaluated for three TRIP steels of the same composition but undergoing different heat treatments. Morphological aspects of the existing phases, austenite stability, and suitable mixture laws between phases are considered. The model is found to accurately reproduce a true stress-strain flow law obtained under tensile uniaxial conditions and provide detailed information on the effective stress strain partition between the existing phases.

1. Introduction

TRansformation Induced Plasticity (TRIP) aided steels belong to the family of Advanced High Strength Steels, which exhibit a characteristically good strength-strain combination [1,2,3], making them attractive for forming processes, especially in the automotive industry [4]. TRIP-aided steels have a complex multiphase microstructure mainly composed of ferrite, bainite, and 5 to 20 vol% of retained austenite [2,3]. Martensite can be present in some cases [2,5]. The enhancement of mechanical properties is due to the TRIP effect, which consists of the transformation of metastable retained austenite into martensite during deformation [3]. The mechanical properties of these steels depend on several factors: (i) austenite stability, which determines the TRIP effect; (ii) the intrinsic characteristics of the present phases (microstructure, morphology, etc.); and (iii) the relative proportion between phases. Austenite stability depends on the chemical composition, grain size and shape, stress state, temperature, and strain rate [5,6,7,8,9,10,11,12,13,14,15,16]. It is well-known that the addition of elements such as Al and Si inhibits the cementite formation, increasing the carbon concentration on austenite during isothermal bainitic heat treatments [5,6,7,8,9,10,11,12,13]. This degree of carbon enrichment of austenite is linked to its stabilization at room temperature; at a higher carbon concentration, a higher retained austenite stability is exhibited. Some studies on TRIP steels [9,10,11,12] have reported that retained austenite stability increases when its grain size decreases. Wang et al. [10] related austenite stabilization to the extra interfacial (austenite/martensite) energy required for fine austenite grains. Some authors [14,15,16] have shown that a temperature increment stabilizes the retained austenite. Hecker et al. [17] found that, for a 304 stainless steel, at high strain rates, the temperature increase resulting from adiabatic heating is sufficient to suppress the austenite transformation.
Although perhaps the main feature of multiphase TRIP steels is the austenite transformation into martensite by strain, their overall response is strongly influenced by the intrinsic features of each constituent, especially ferrite and bainite, due to these phases being present in high proportion. Grajcar et al. [18], for example, obtained noticeable differences in mechanical properties for a medium carbon TRIP aided steel with Nb and Ti microaddition. These differences were mainly attributed to two factors: (i) the nature of the bainitic-ferritic matrix and (ii) differences in austenite stability due to grain size and shape distribution. Some of the intrinsic features that influence the mechanical properties are solute elements, precipitates, phase lattice, dislocation density, and grain size. The influence of the latter feature follows the well-known Hall-Petch relationship [19,20]. Thus, it is easy to see the complexity of developing a phenomenological model for the stress strain flow law that takes into account all of these factors.
Several authors [21,22,23] have described the stress-strain flow law for multiphase TRIP steels based on the Hollomon and/or Ludwik hardening laws. Panich et al. [24] employed the Swift and modified Voce model to describe the hardening response of a multiphase TRIP steel to forming processes. The main advantages of these models are: (i) the use of a small number of parameters makes their calibration relatively easy; and (ii) the n exponent for the Hollomon-Ludwik law is related to the strain at the UTS, providing relevant information about the mechanical behavior. However, one of the most important disadvantages of these models is that there is not a clear relationship between microstructural characteristics and the description of the stress strain flow law. Bouquerel et al. [25] proposed a multiscale phenomenological model. A scheme of this model is shown in Figure 1. Each phase is treated as an isolated constituent, in which its individual stress strain flow law is described by the Mecking-Kocks microstructure-based model [26,27]. The austenite transformation into martensite is described by the Olson and Cohen model [6]. Finally, a suitable stress mixture law between constituents is used.
In the current work, a constitutive flow law based on the Bouquerel’s model is proposed to assess the mechanical response of three TRIP steels made of the same composition, but undergoing different heat treatments. Three TRIP-aided steel sheets of the same composition were manufactured by different heat treatments designed to obtain a similar proportion between phases, but with differences in two factors: austenite stability and microstructural characteristics (mainly grain size). Based on this, the differences in the stress strain flow law can be explained by these two factors.

2. Materials and Experimental Results

A detailed description of the manufacturing and experimental results used in the current work are described in Salinas et al. [28]. The following paragraphs describe the procedures and summarize the main conclusions of these results, which were used as input parameters for the model and were taken into account in the calibration steps.

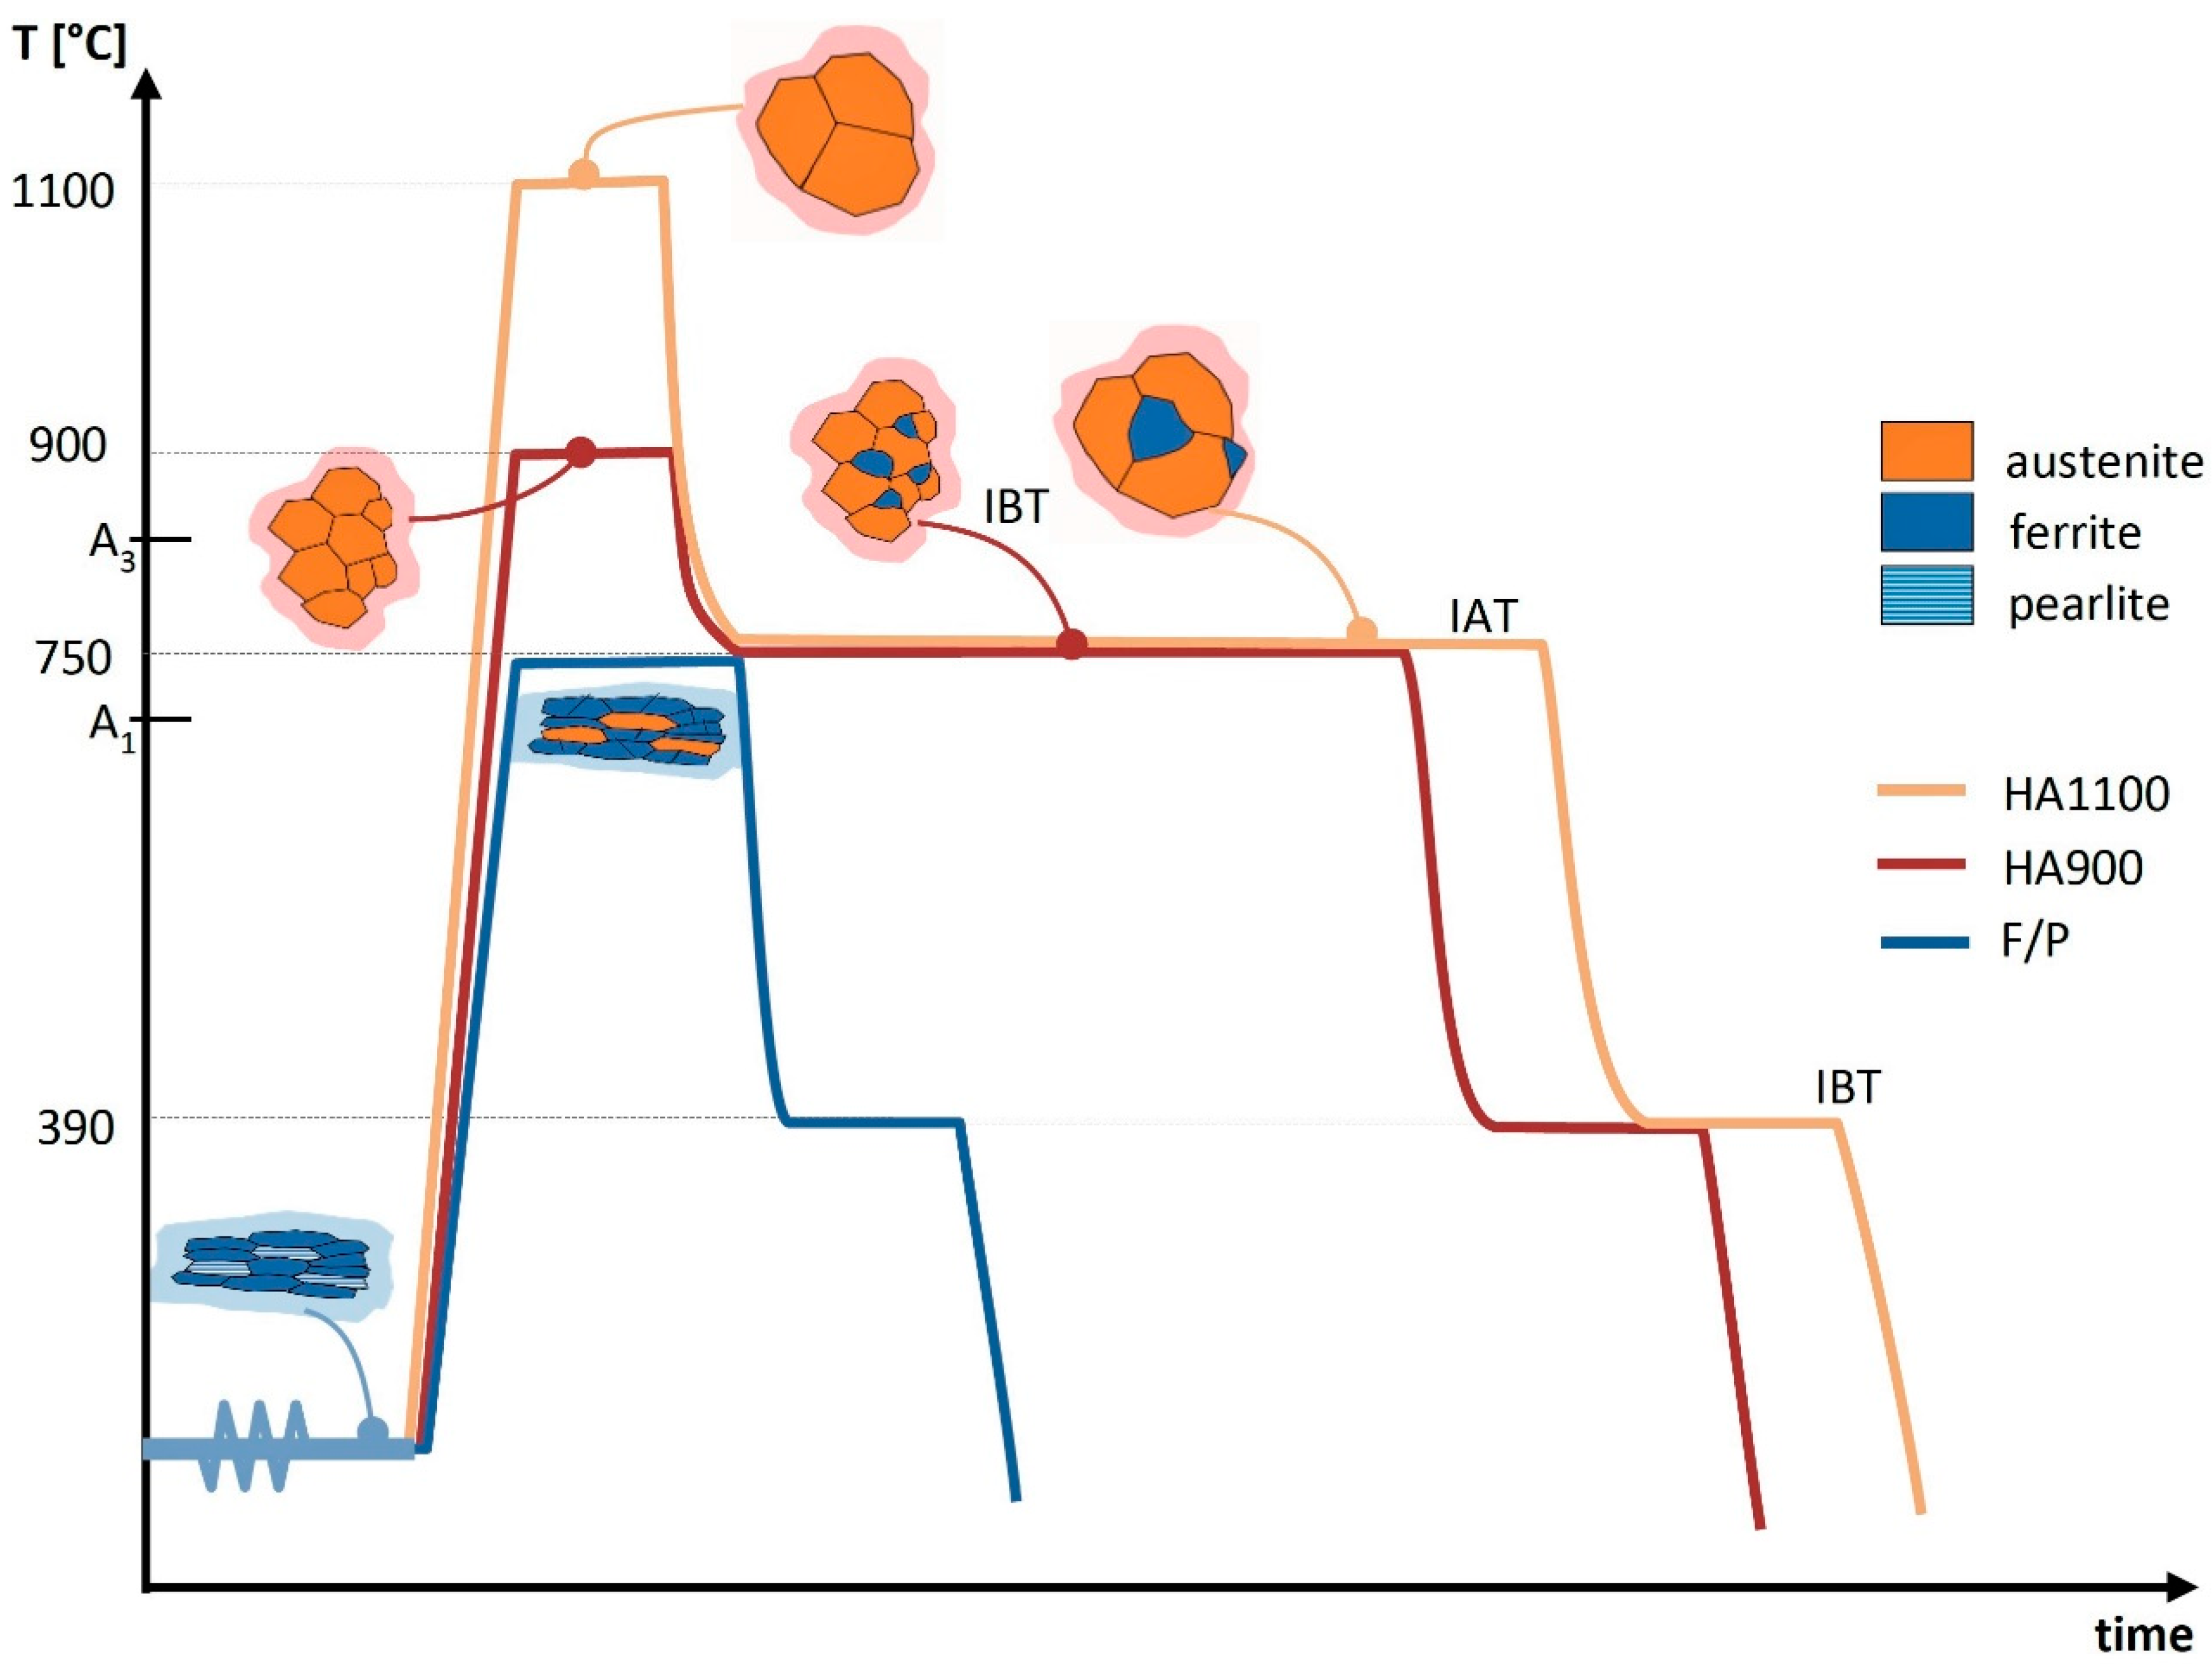
2.1. Steel Manufacturing and Heat Treatments

A steel ingot of 0.20%C, 1.88%Mn, 0.88%Si, and 0.13%Al (all in weight %), with a chemical composition corresponding to a TRIP–aided steel, was cast at the Metallurgical Engineering Department, University of Santiago, Chile (USACH). This ingot was subsequently homogenized, hot rolled, annealed, and cold rolled until it reached a 0.87 mm thickness (42% cold working) ferrite/pearlite strip, which was cut into three pieces that each underwent a different heat treatment cycle in order to obtain three multiphase TRIP steels with the same chemical composition, but different microstructures [28].
As depicted in Figure 2, three different processing paths were used to obtain the 1/1 (ferrite/austenite) microstructure that would allow the TRIP effect after austempering to be sustained. These paths were obtained by (i) heating the samples to two temperatures within the fully austenitic range, followed by an intercritical annealing treatment (IAT) to form equal fractions of ferrite and austenite; and (ii) heating-up directly from room temperature to the intercritical range to transform the microstructure. The intercritical temperature was obtained from a previous work [29]. All three paths were followed by an isothermal bainitic treatment (IBT), also known as austempering: a salt bath and subsequent water quenching. Table 1 shows the temperatures and times employed in these heat treatments. The prior austenite grain size, shown in Table 1, was measured by taking metallographic images after etching with a solution containing H2O 25 mL, picric acid 0.3 g, hydrochloric acid 0.3 mL, and sodium tridecylbenzene sulfonate 2.5 mL as a wetting agent. [28].

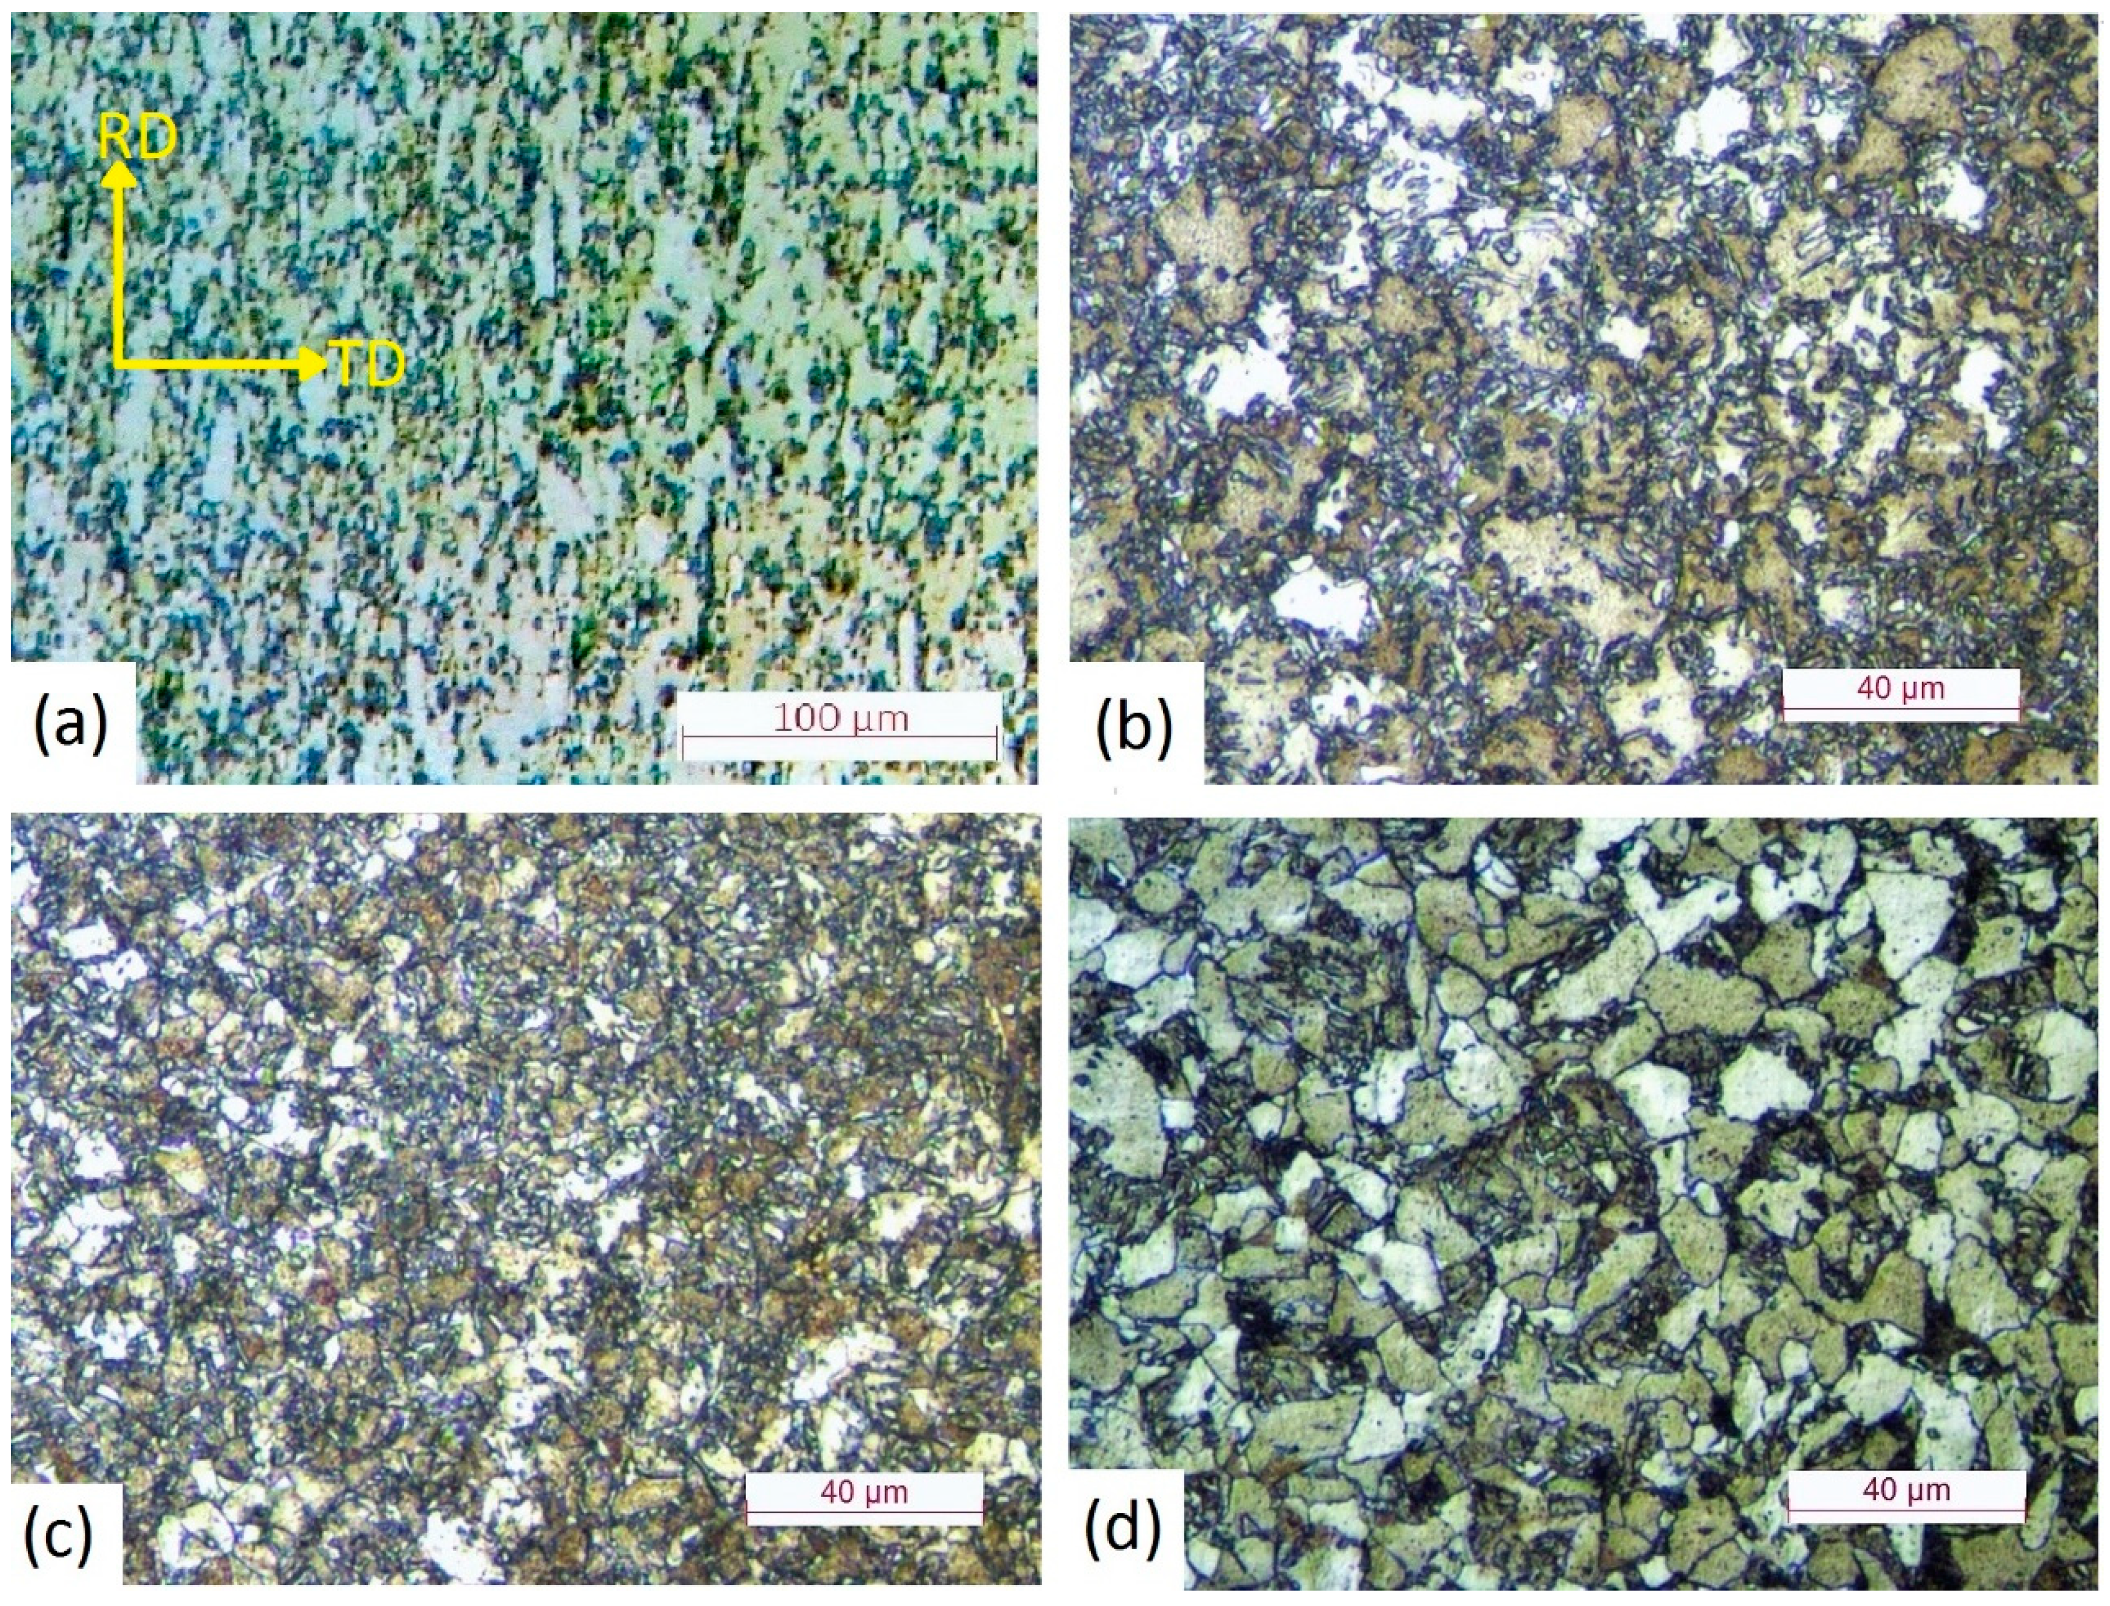
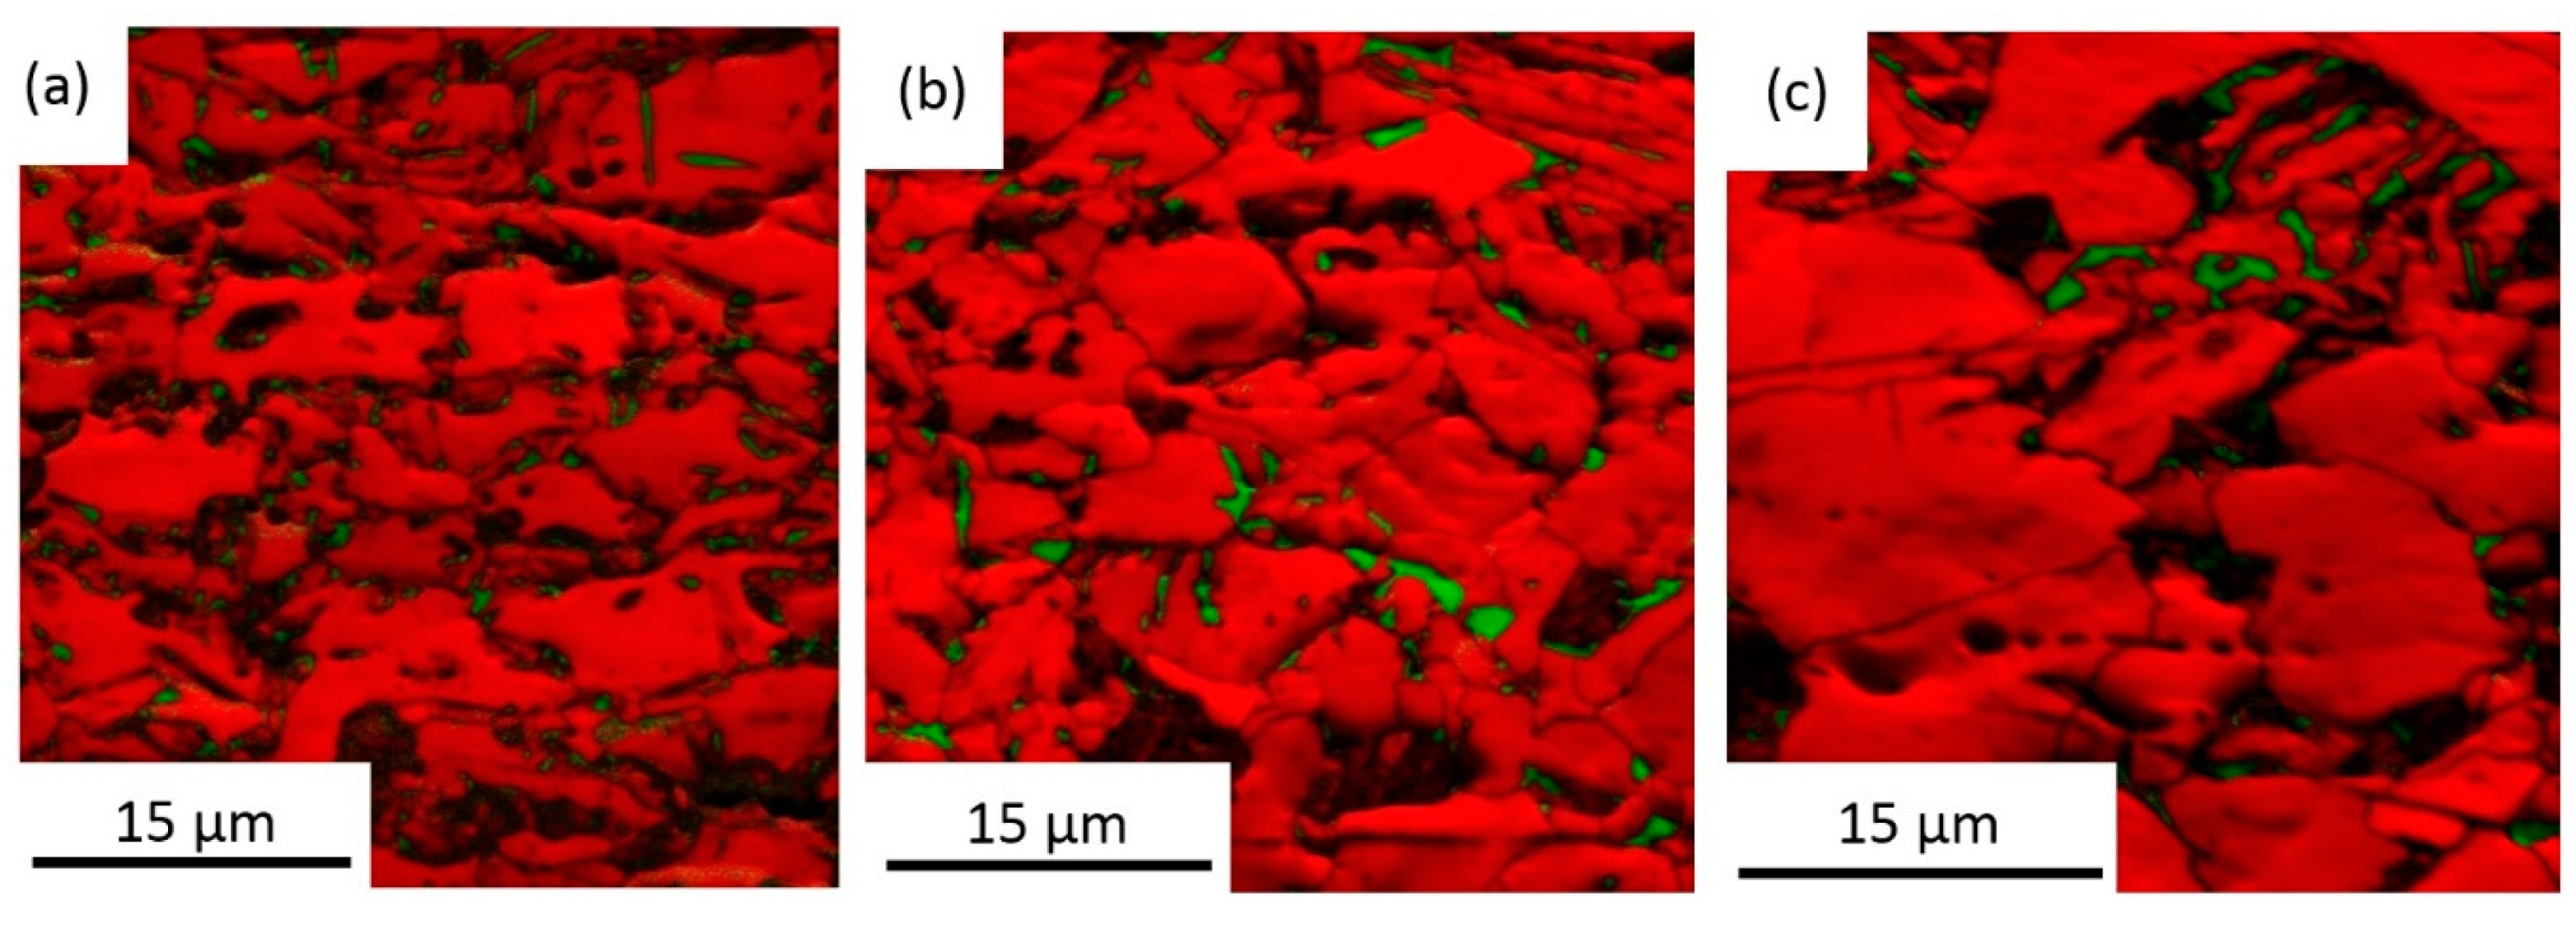
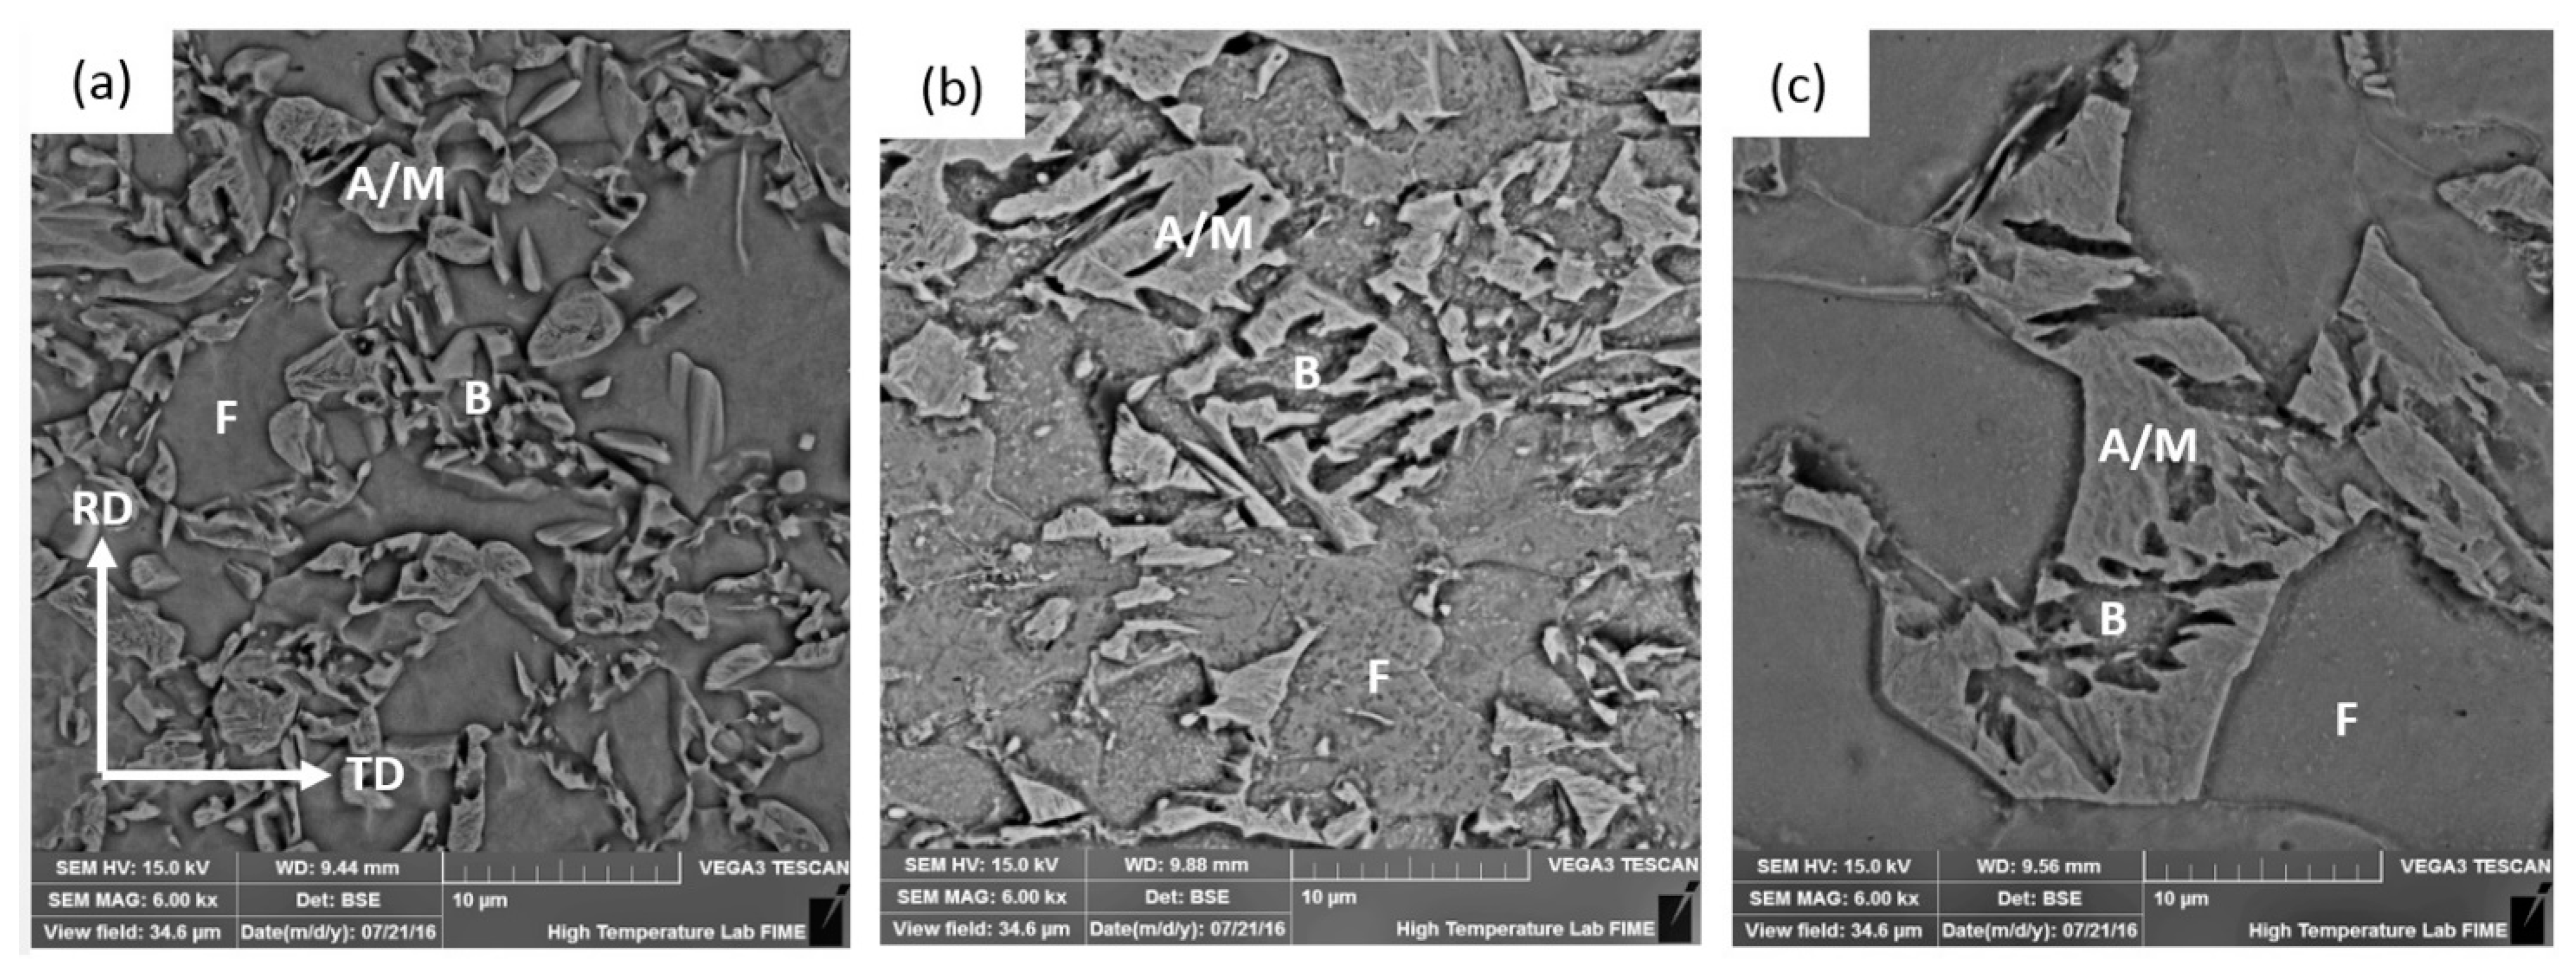
2.2. Microstructural Characterization

The 42% cold rolled ferrite and pearlite microstructure is shown in Figure 3a, and those after the heat treatments for F/P, HA900, and HA1100 steels are shown in Figure 3b–d. LePera etching reveals ferrite as light brown and bainite as dark brown, and austenite/martensite phases appear as small white units [28]. A LEICA metallographic microscope (Model DM LM/P, Leica Microsystems, Wetzlar, Germany) was used to characterize the microstructures. The samples were polished and then chemically etched with a solution of 3% HNO3 in ethanol (Nital, 3%) and LePera etchant (a 4% solution of picric acid in ethanol and a 1% solution of sodium metabisulfite in water, mixed in equal parts just before etching). The ferrite volume fraction was estimated from metallographic images by using the image analysis software ImageJ (version 1.5i, National Institutes of Health, Bethesda, MD, USA). The ferrite grain size was measured directly from metallographic images using the mean linear interception technique.
Figure 4 shows SEM micrographs where the different microstructures can be observed: austenite and/or martensite (A/M), ferrite (F), and bainite (B) that appear near or inside prior austenite blocks [28]. SEM analysis using a TESCAN Vega 3 scanning electron microscope (Tescan, Brno, Czech Republic) with a tungsten filament was performed at 15 kV in the backscattered electron (BSE) mode.
Figure 5 shows IQ + phase maps for each steel obtained by the EBSD technique; retained austenite is easily identified and martensite appears as dark zones [28]. Electron backscattered diffraction (EBSD) analyses were carried out on a plane perpendicular to the transverse direction of samples by means of the EDAX-TSL® system (Ametek, Berwyn, PA, USA). An FEI XL30 ESEM microscope (TSS Microscopy, Boston, MA, USA) with an LaB6 filament was used. The specimens were analyzed on a plane tilted 70° with respect to the incidence beam at a 20 kV acceleration voltage. A step size of 60 nm in a hexagonal scan grid was used for microstructure characterization. EBSD data was postprocessed with OIM (Orientation Imaging Microscopy) Analysis™ software (Ametek, Berwyn, PA, USA). The postprocessing procedure included the elimination of points with low confidence indices (lower than 0.1). Grains were considered with a minimum of six pixels, while grain boundaries were defined when a rotation between pixels was greater than 15°. Austenite identification by EBSD was done directly by indexing FCC structures. Martensite has a high density of defects; therefore, it must have a low average Image Quality (IQ) pattern. Due to this, martensite identification was done based on a low IQ pattern on BCC structures [28].
Table 2 shows the austenite volume fraction obtained by X-Ray before and after the tensile test. X-Ray measurements were carried out on the samples in a PANALYTICAL EMPYREAN diffractometer with a Co tube (Malvern Panalytical Ltd., Malvern, UK), before and after tensile testing. X-Ray diffraction patterns were obtained in the 20–55° 2θ range with a step (Δθ) of 0.0065°. The ASTM E975 method was then employed to determine the austenite volume fraction in the samples. Table 2 also shows the austenite and martensite volume fraction before the tensile test, obtained by EBSD. Experimental error in Table 2 and Table 5 is not shown because only one sample of each steel was measured; however, each measurement was made by both X-Ray and EBSD methods, resulting in a significant correspondence between both results, as can be seen in Table 2. From this table, it is possible to determine the following:
  • The austenite volume fraction before the tensile test obtained by EBSD is similar to the results obtained by X-Ray in all three cases. It confirms that the space analysed for microstructural characterization by EBSD is representative of the material;
  • Characteristical dimensions for austenite and martensite obtained by EBSD analysis are representative of the steels;
  • Another microstructural feature which can be obtained from EBSD is the martensite/austenite volume fraction before the tensile test (Vm/Va). This ratio is linked to austenite stability;
  • Due to the greater representativeness of X-Ray analysis, a better approach of the martensite volume fraction before the tensile test can be obtained as follows: the austenite volume fraction obtained by X-Ray is multiplied with the Vm/Va ratio. The martensite volume fraction was obtained in this way.
Table 3 shows the characteristic dimensions of each constituent for the three steels. Ferrite grain size was obtained by metallographic observation, bainite lath size was measured on SEM images, and austenite and martensite dimensions were directly obtained from EBSD map analysis. Errors reported in Table 3 correspond to the standard deviation of measurements. Table 4 shows the volume fraction for each phase, where ferrite, austenite, martensite, and bainite volume fractions were obtained from metallographic analysis, X-Ray diffaction, EBSD, and mass balance, respectively. Only the experimental error of the ferrite fraction is shown, as the other phases were determined by means of X-Ray and EBSD simultaneously in one sample, finding a correspondence between both values.

2.3. Austenite Stability

Austenite stability may be regarded as chemical or mechanical. Chemical stability is related to the resistance of austenite to transform into martensite by cooling from austempering. Mechanical stability, on the other hand, refers to its resistance to transform into martensite by plastic strain. Table 5 compares the transformation of austenite via both mechanisms among the three steels. The F/P steel exhibits the highest stability of both types. The HA1100 steel shows the lowest chemical stability. Austenite volume fraction prior to cooling from austempering could be obtained by adding the austenite and martensite volume fraction before the tensile test, as shown by the values in Table 3.

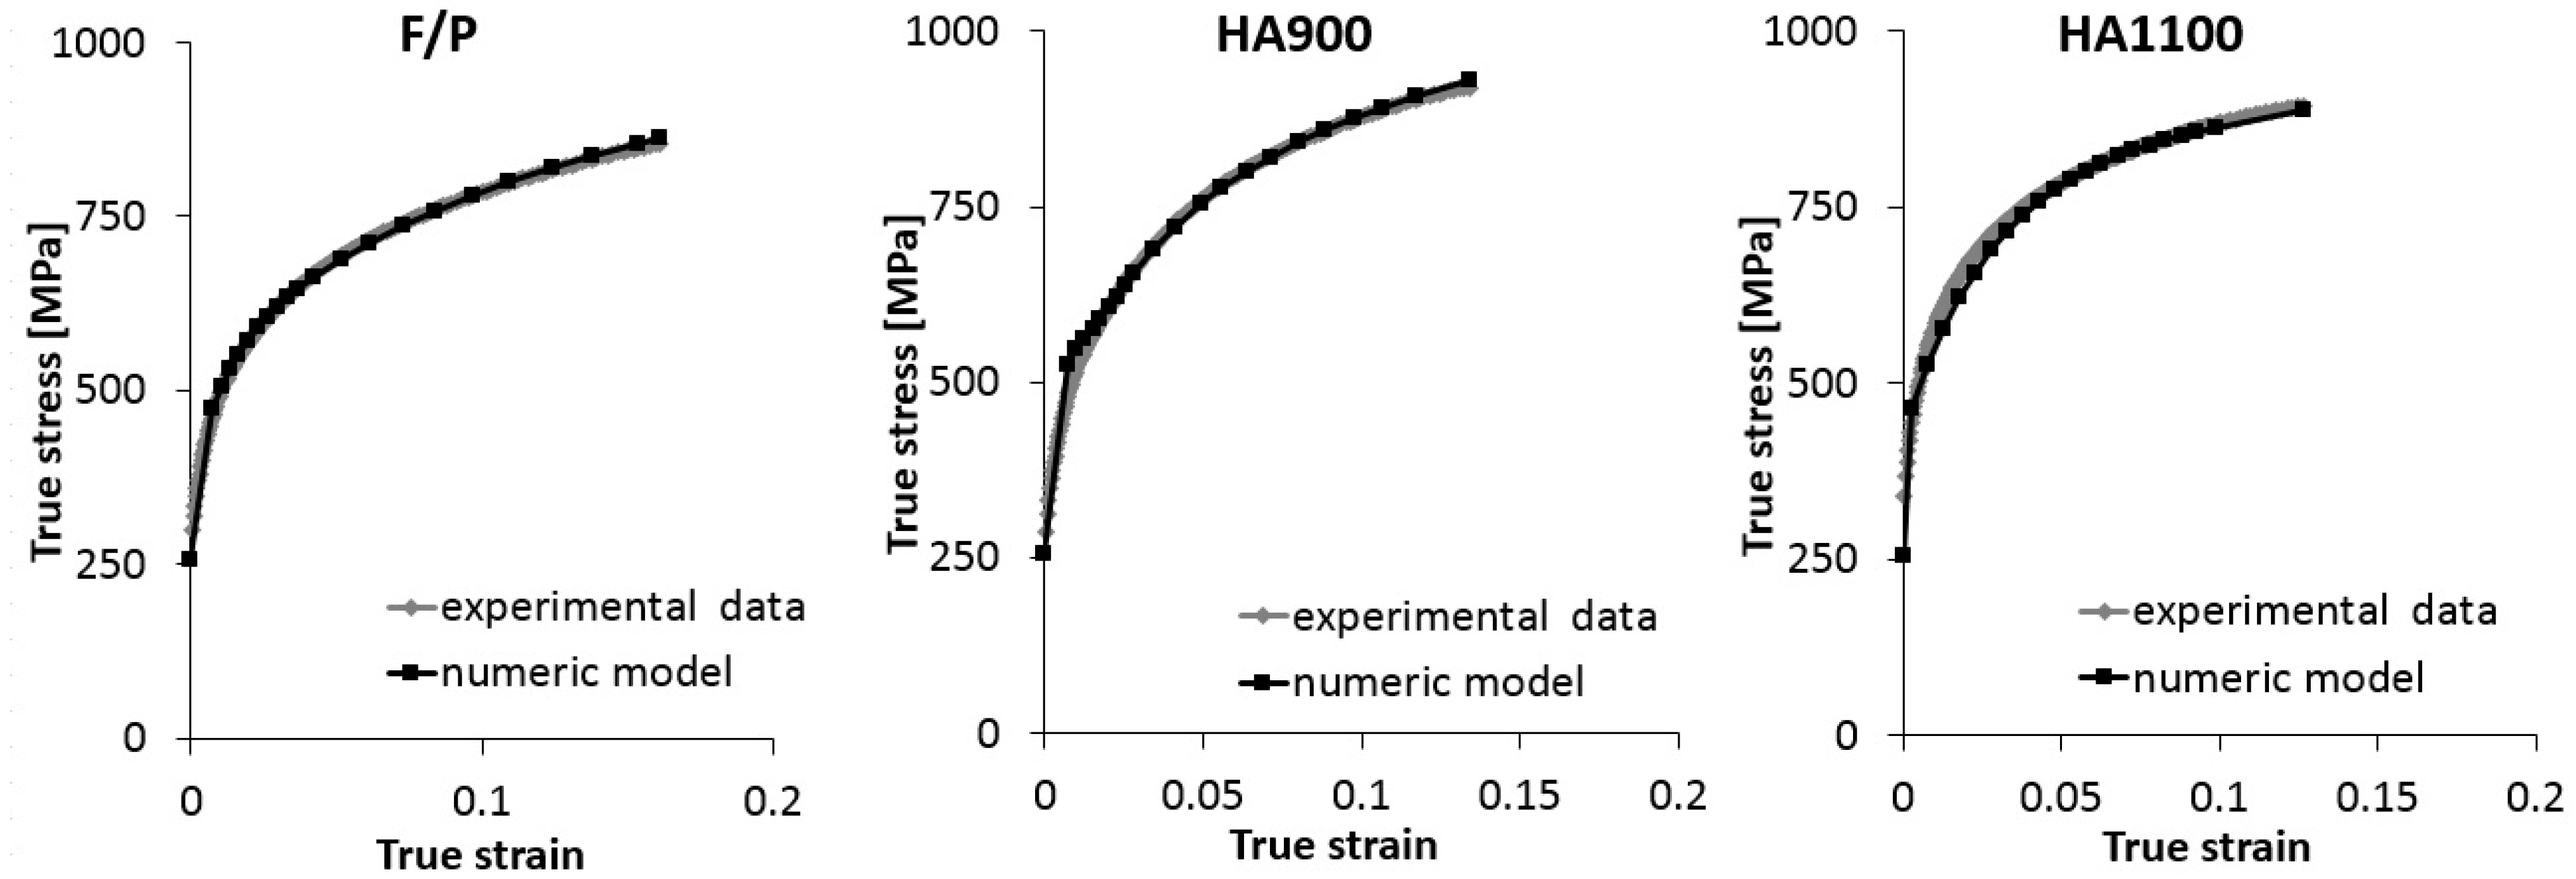
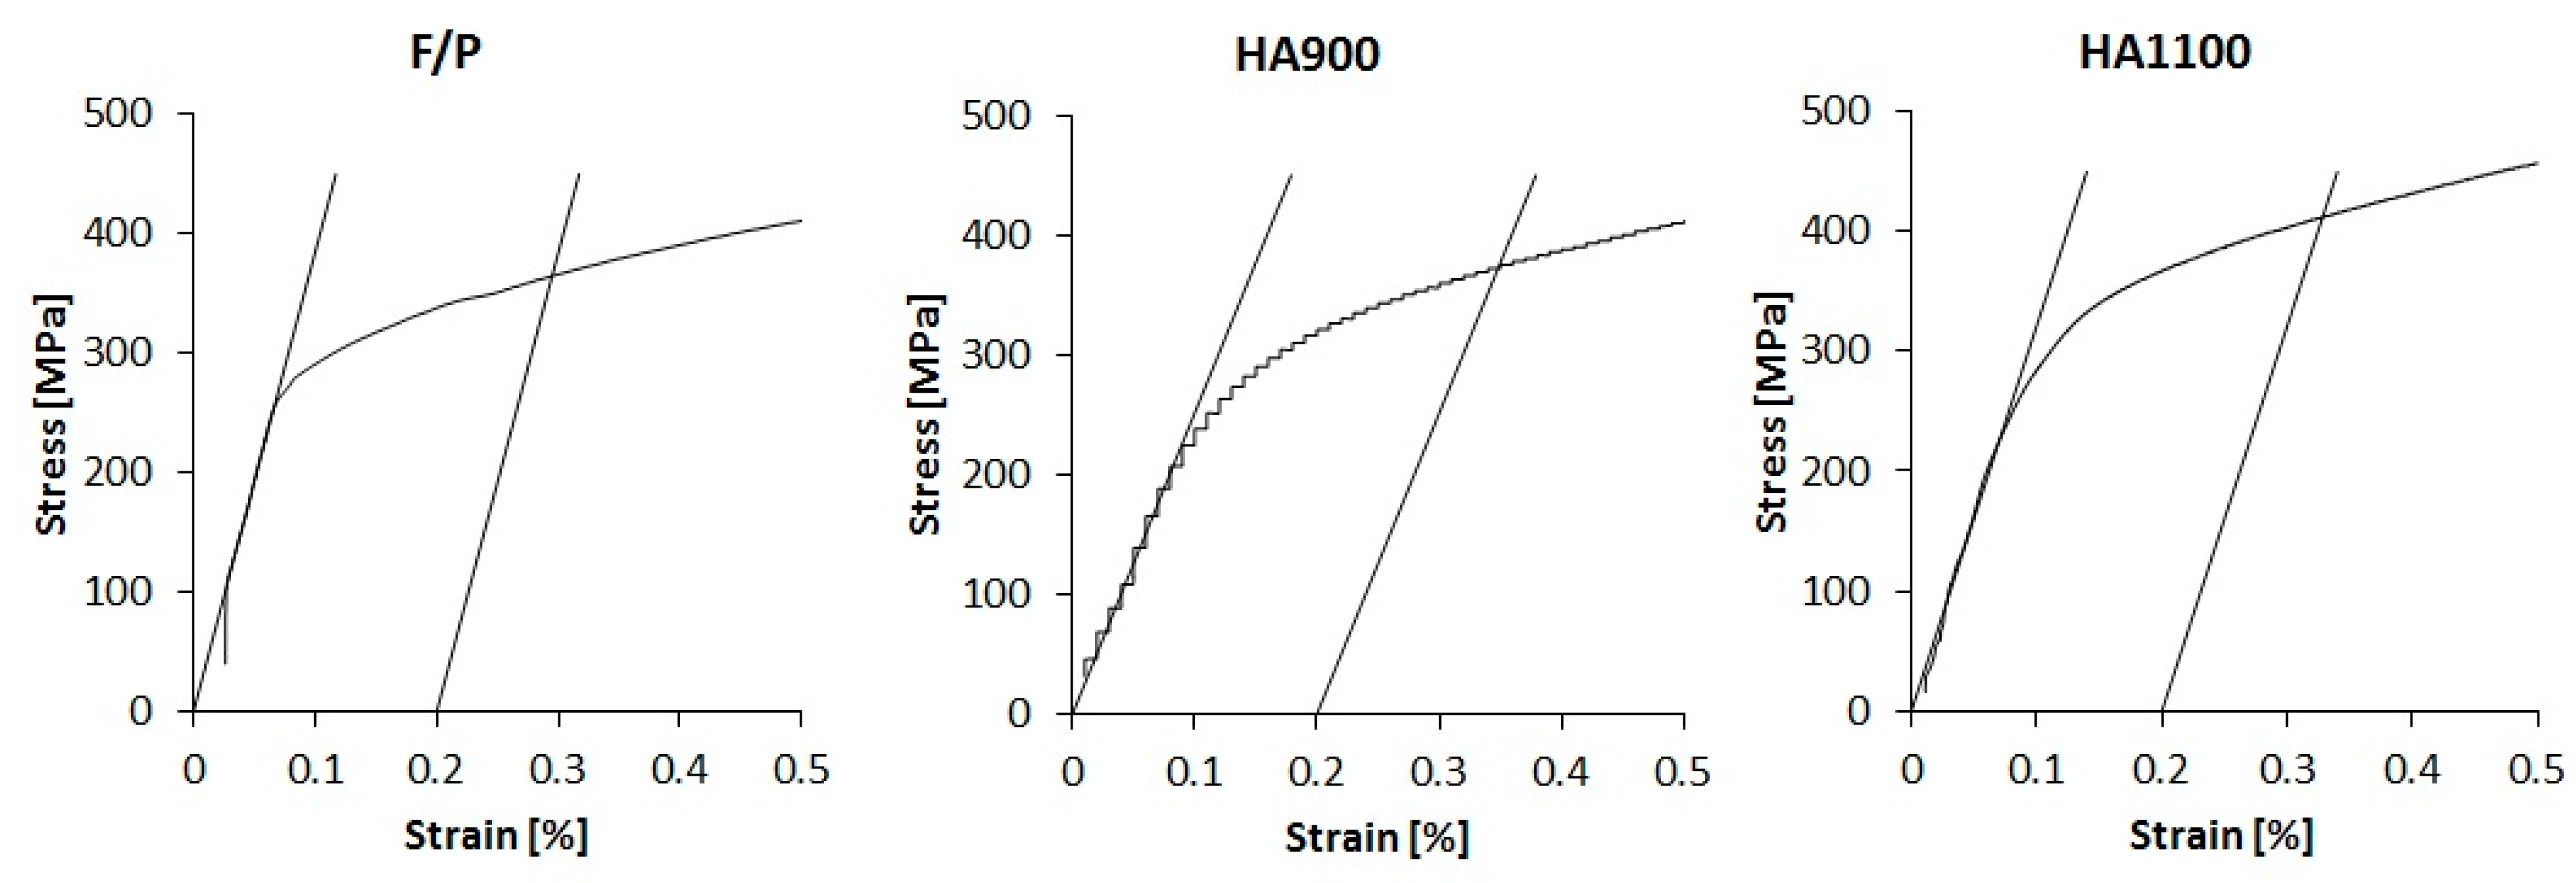
2.4. Stress-Strain Curves

Tensile tests were performed according to ASTM E8M in a servohydraulic Tinius & Olsen universal testing machine (2000 Super L, Willow Grove, PA, USA), under displacement control at 2 mm/min. Three flat specimens of dimensions 0.87 mm and 12.5 mm were tested for each case. A Linear Variable Differential Transformer (Tinius-Olsen, Model LS-50%-1, Willow Grove, PA, USA) with a 50 mm gage length was used to measure displacement. Based on tensile test data, true stress versus true strain curves were obtained for the homogeneous range [28].

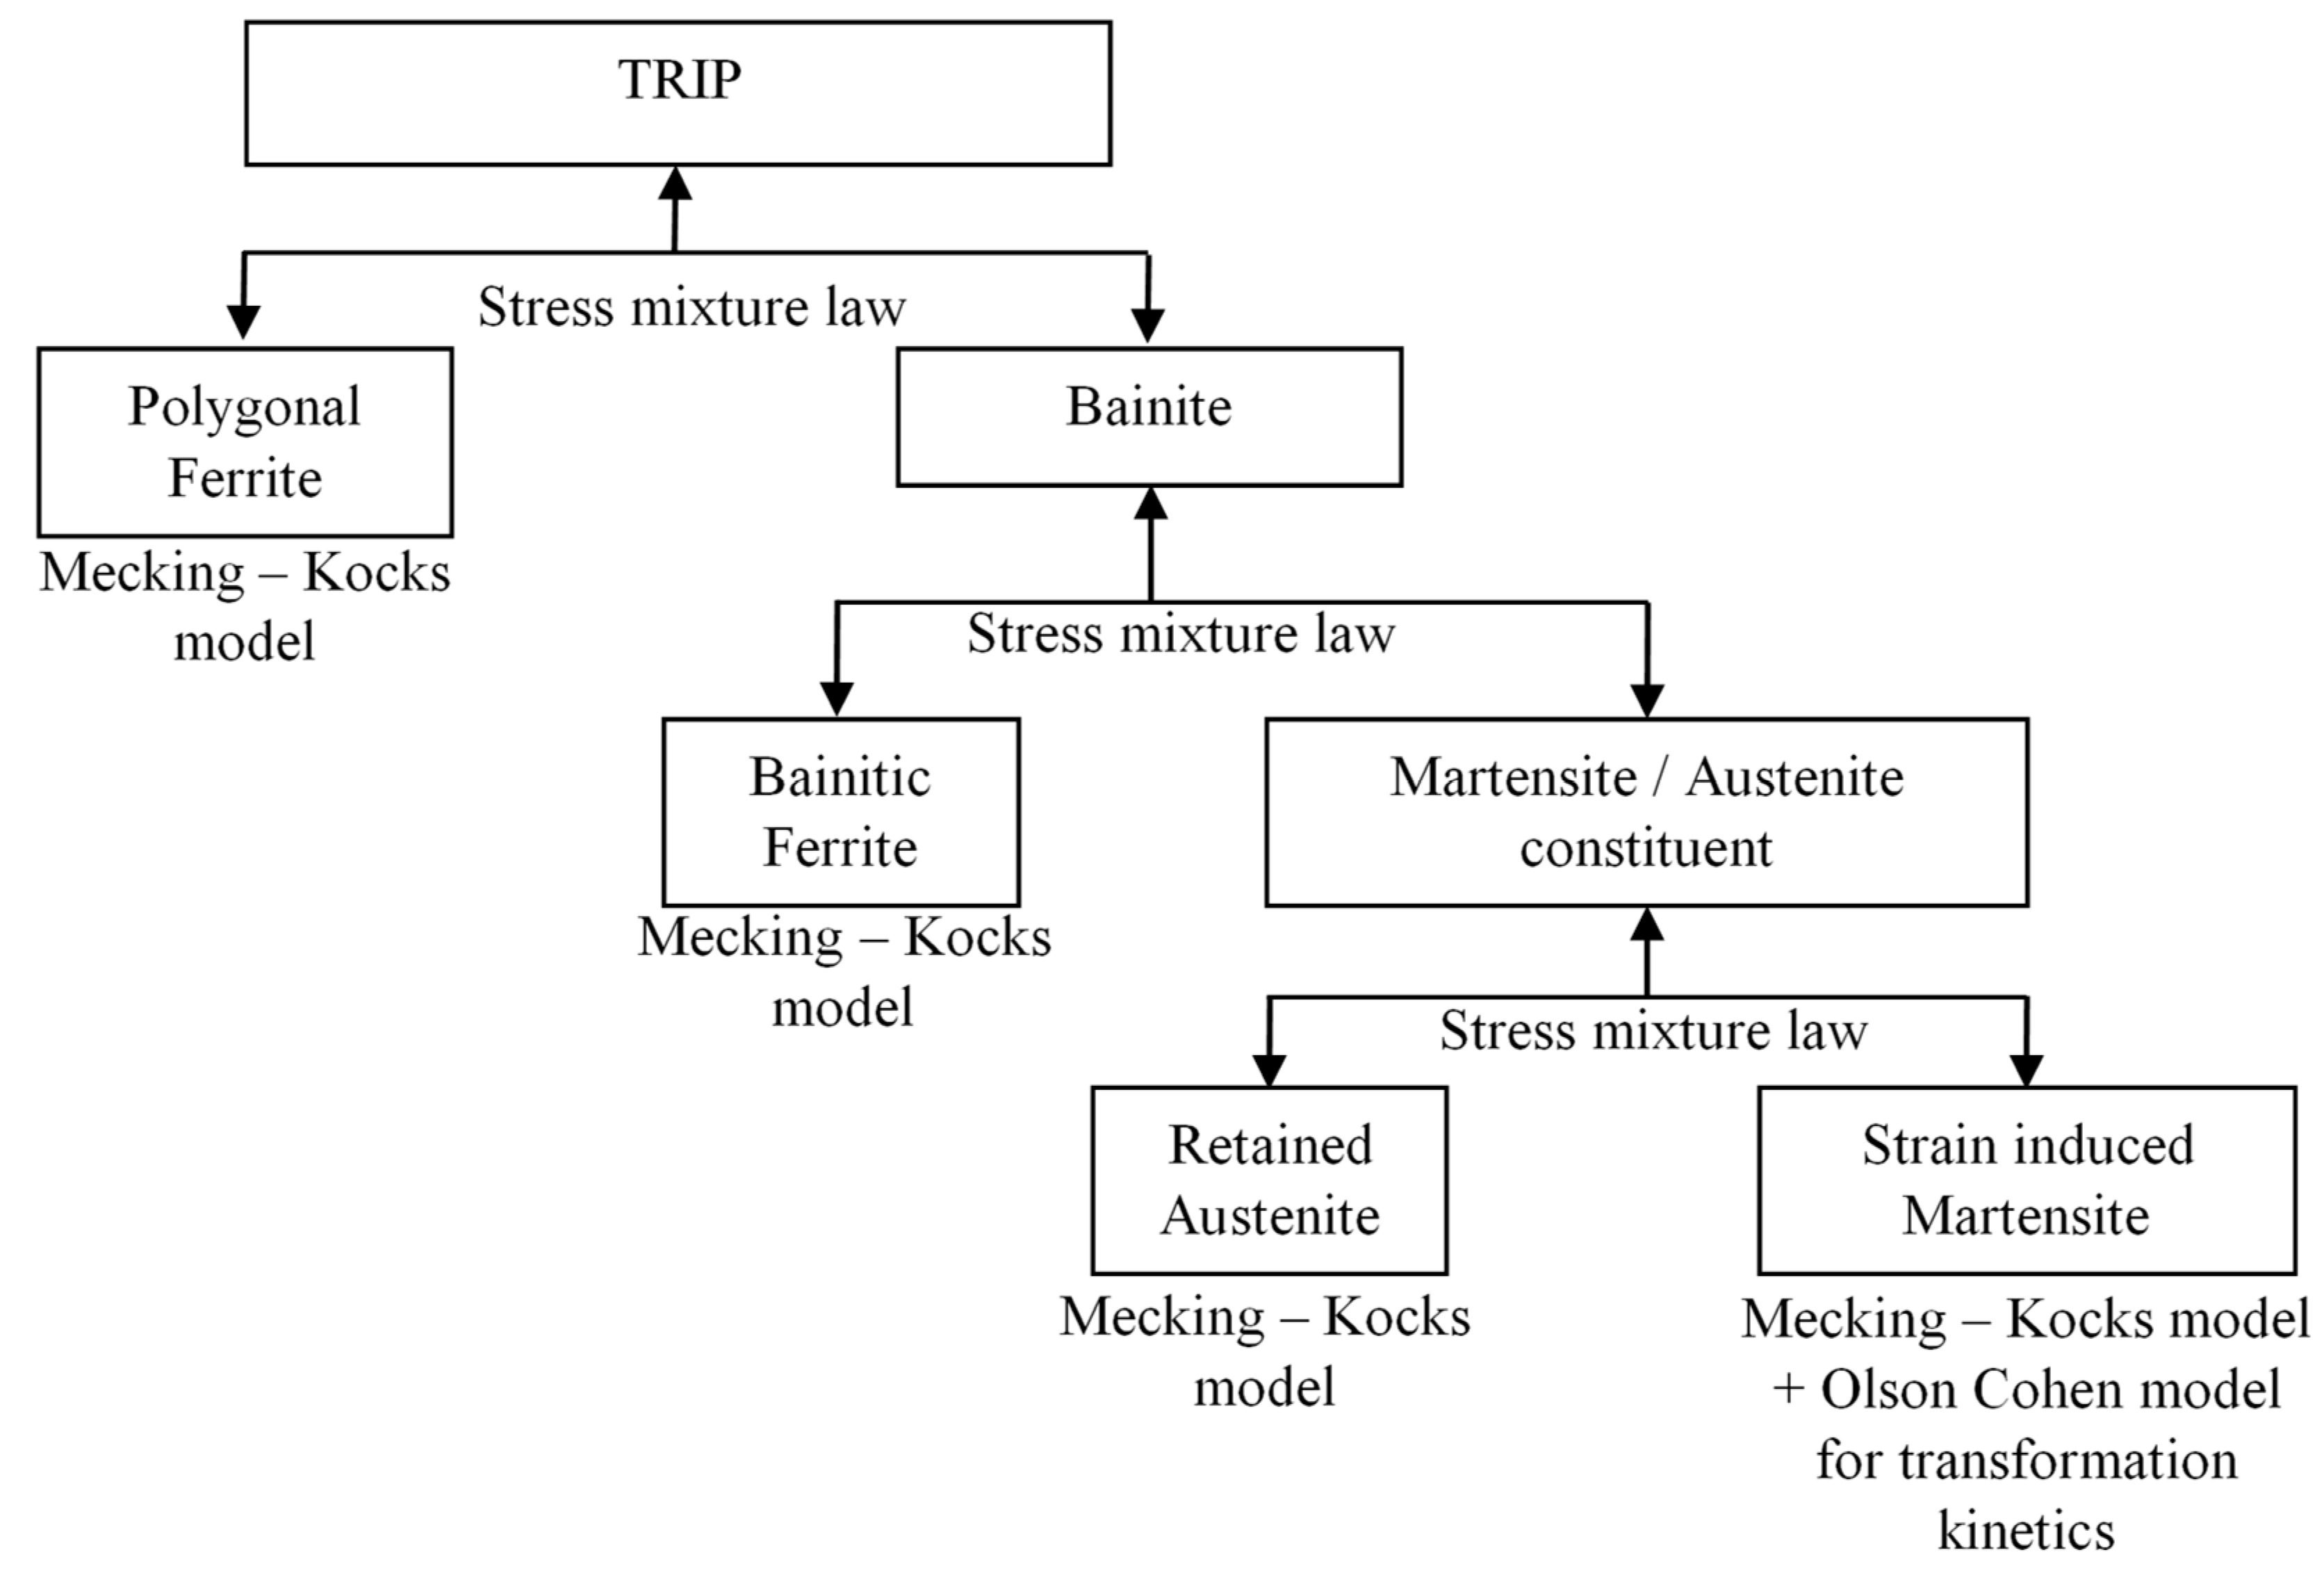
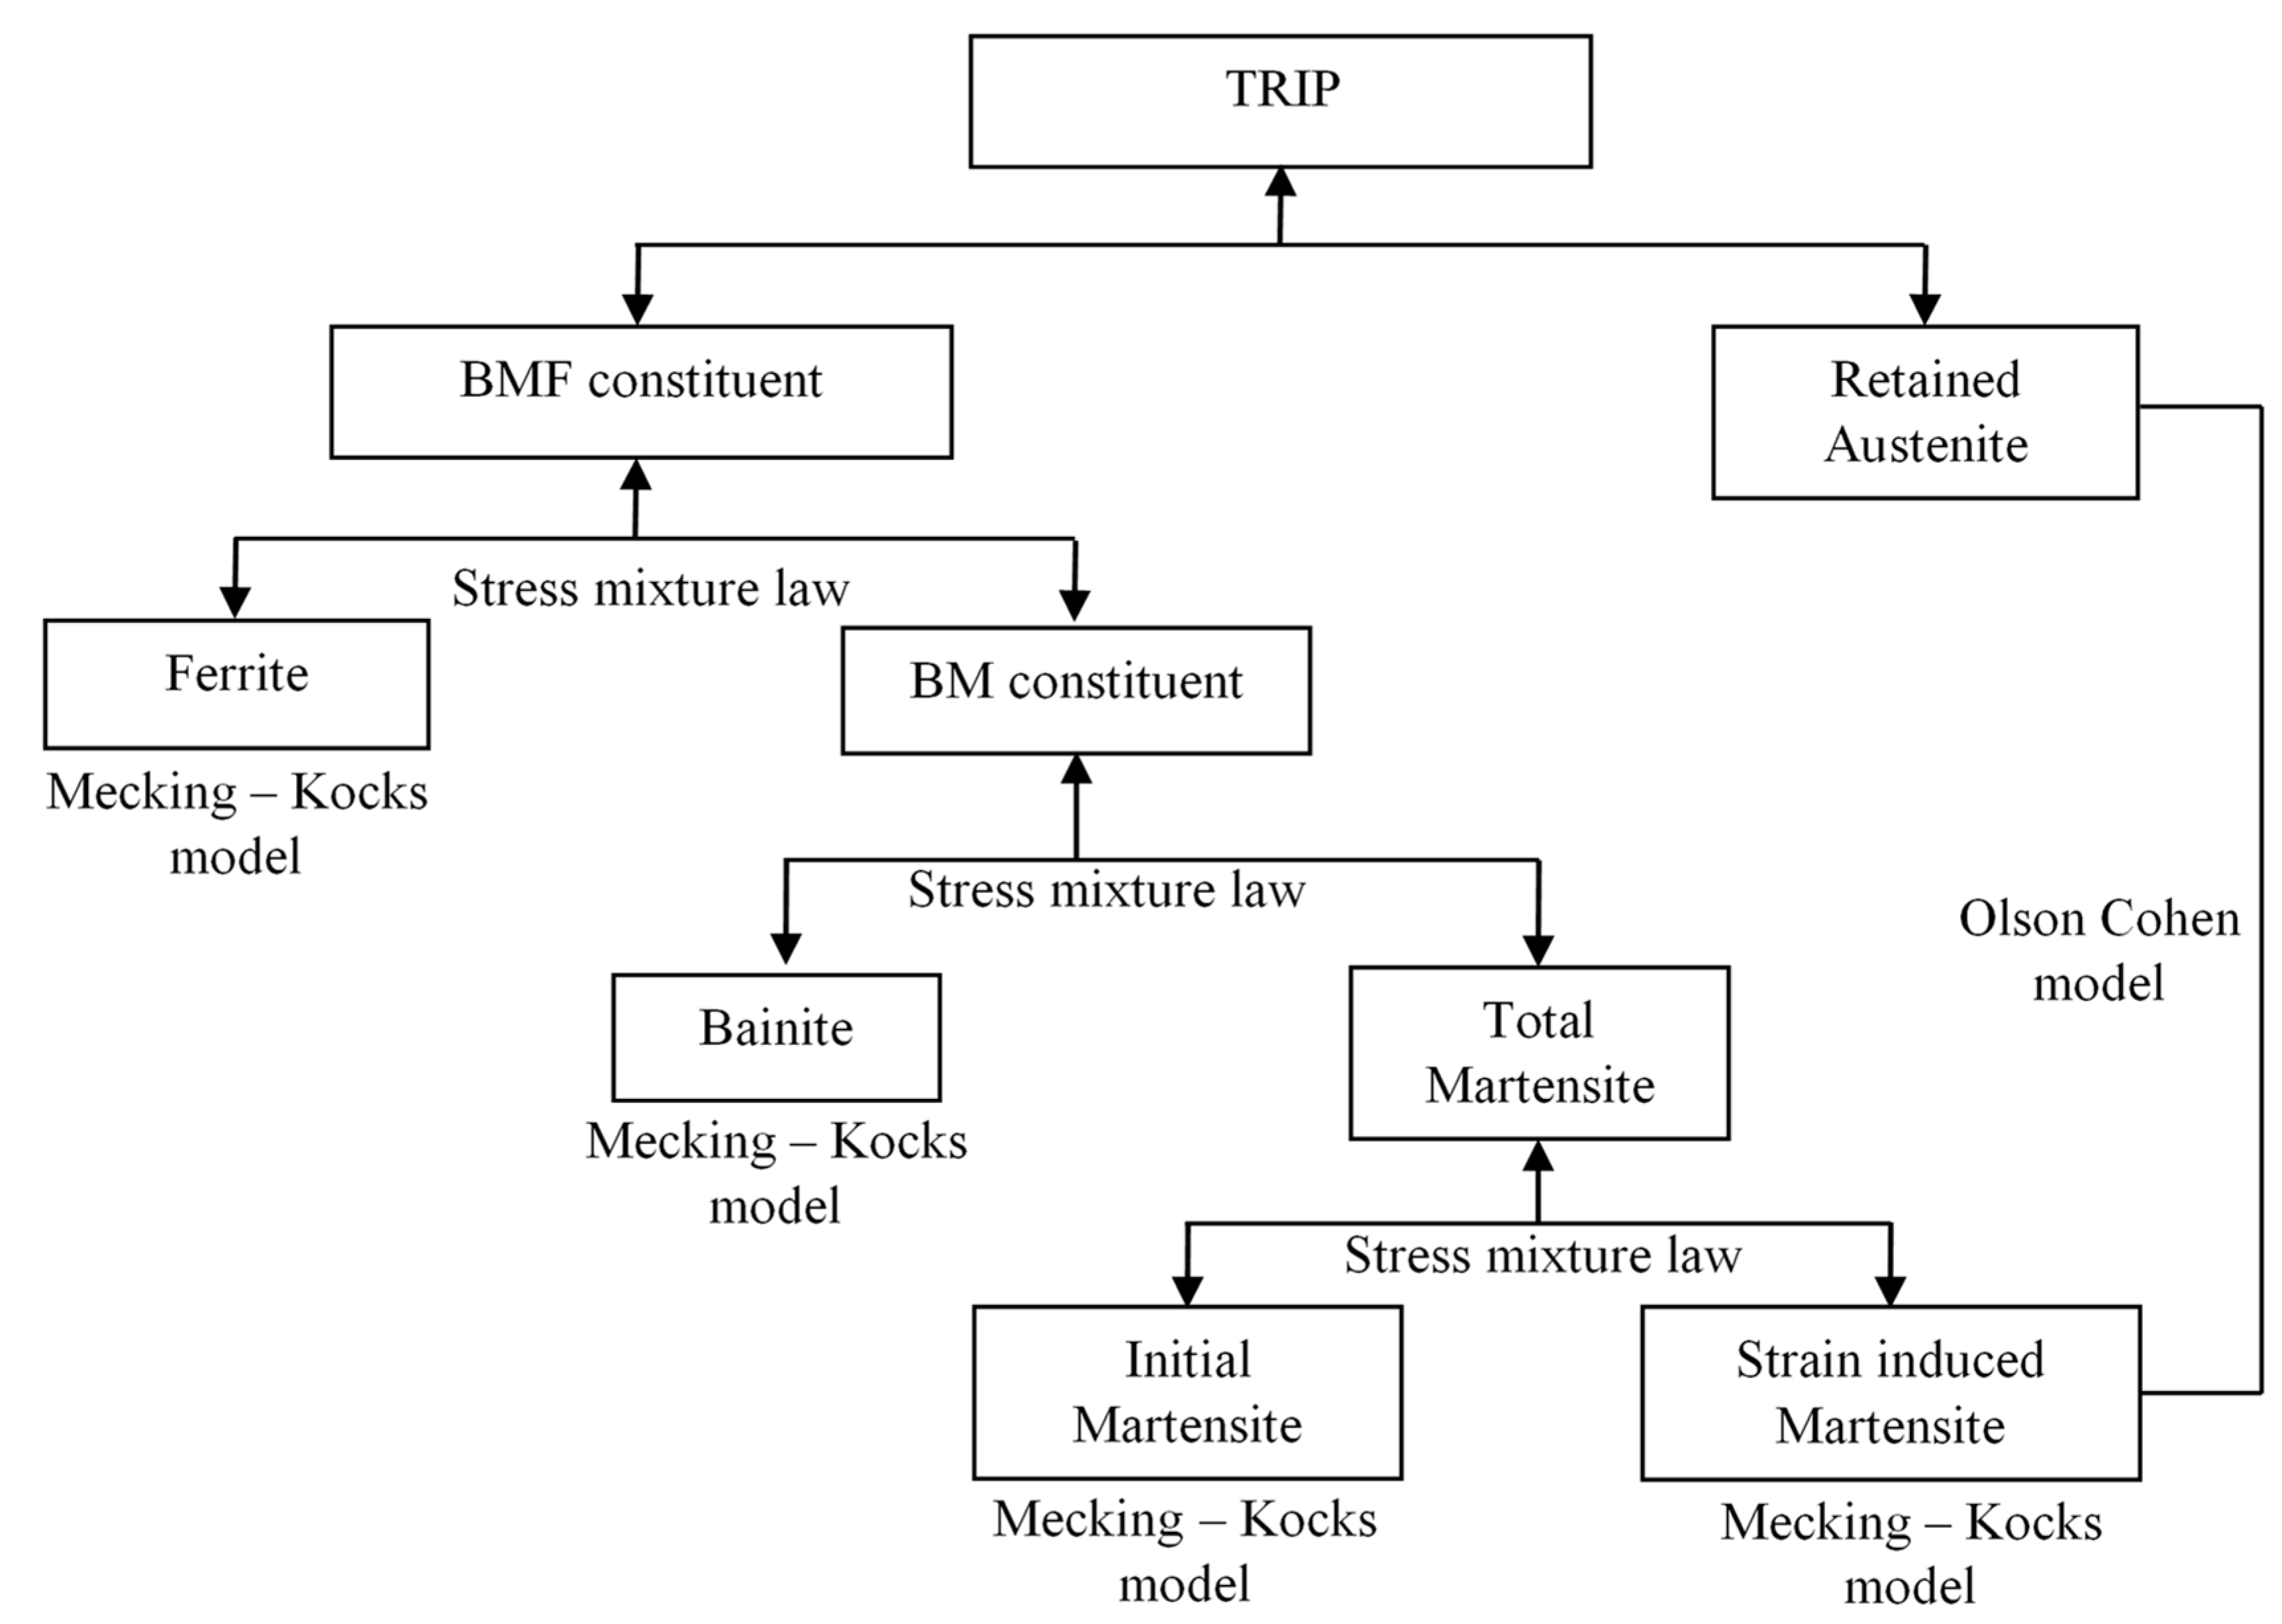
3. Model Description

To assess the mechanical properties of the TRIP steels, the phenomenological constitutive model shown in Figure 6 was used. Martensite on the initial microstructure was also incorporated. Three aspects are taken into account in this model: (i) austenite transformation into martensite by strain; (ii) individual flow law for each microconstituent (ferrite, bainite, austenite, initial martensite, and strain induced martensite); and (iii) mixture laws between the corresponding microconstituents.

3.1. Austenite Transformation

The Olson-Cohen relationship [6] was used for the austenite transformation into martensite by plastic deformation:
f α ´ = 1 exp [ 1 β O C · ( 1 exp [ α O C · ε ] ) n ]
where f α ´ is the austenite volume fraction (relative to initial austenite amount) transformed into martensite at a given ε strain. The expression ( 1 exp [ α O C · ε ] ) is related to the shear band volume fraction evolution by deformation and β O C represents the probability of two shear bands’ intersection generating a martensite nucleus [6]. Samek et al. found expressions for the determination of the parameters α O C   and β O C based on temperature and chemical composition for low-alloy TRIP steels [8]. Table 6 shows the α O C   and β O C values for the current steels using Samek´s expression. A value equal to 2 was considered for the exponent n [25].
Another consideration in the austenite transformation is the evolution of the retained austenite grain size. In this transformation, a reduction in size is expected, but the instantaneous volumes of retained austenite plus strain-induced martensite must equal the volume of the initial retained austenite. If the austenite and martensite are considered as spheres, Equation (2) shows the relationship between the instantaneous austenite and martensite dimensions:
d 0 3 = d i 3 ( ε ) + L i 3 ( ε )
where d 0 is the initial retained austenite grain size, d i ( ε ) is the instantaneous retained austenite size, and L i ( ε ) is the instantaneous martensite size. Equation (3) shows the relation between the instantaneous retained austenite size and the strain:
d i ( ε ) = 1 f α ( ε ) 3

3.2. Individual Flow Laws

The individual flow law for the ferrite, austenite, and bainite can be described by the phenomenological Mecking-Kocks model [26,27]. This model shows the relationship between the stress σ and the dislocation density ρ (Equation (4)), and the dislocation density evolution due to strain (Equation (5)):
σ = σ 0 + α M G b ρ
d ρ M d ε = 1 b d + k b ρ f ρ
There are several factors that influence the strength: (i) Peierl´s strength, which is related to the intrinsic lattice resistance; (ii) solid solution strength; (iii) Hall-Petch or grain size strength; (iv) precipitated particles strength; and (v) dislocation density. The dislocation density is the only factor that can change due to strain. Because of this, σ 0 groups all the strength contributions, except that due to dislocation density. α is a constant which can vary between 0.5 and 1 [26], such that in the current analysis, this value was considered equal to 0.55. M is the Taylor factor, which equals 3 in isotropic materials. G is the shear modulus (78,500 MPa for BCC structures on steel and 72,500 MPa for FCC structures), b is the Burger’s vector (2.48 × 10⁻¹⁰ m for BCC structures on steel and 2.58 × 10⁻¹⁰ m for FCC structures), and d is the instantaneous grain size of the respective constituent (only retained austenite grain size changes with strain as expressed by Equation (3)). k and f are calibrated parameters.
For the martensite constituent, according to the Bouquerel model, the Rodriguez & Gutierrez relationship was used (Equation (6)) [30]:
σ = σ 0 + α M G b 1 exp ( M f ε ) f L ,
in which f is a calibration constant and L is the instantaneous martensite lath size (only strain induced martensite lath size changes with strain according to Equation (2) and Equation (3)).

3.3. Mixture Law

According to Figure 6 for hard constituents (bainite, strain-induced martensite, and initial martensite), an isostrain mixture law was considered. That mix was named BM. For the mixture of ferrite (soft) and BM (hard), named BMF, a combination of Equation (7), Equation (8), and Equation (9) was used, where σ F , σ B M , and σ B M F are the stress state on ferrite, BM, and BMF, respectively, while ε F , ε B M , and ε B M F correspond to the strain state on ferrite, BM, and BMF, respectively. fF in Equation (7) and Equation (8) stands for the volume fraction of ferrite and coefficient q in Equation (9) represents the effective stress transfer and strain partitioning [26]. This mixture law, between soft and hard phases, is frequently used to describe ferrite-martensite Dual Phase steels [31] and TRIP steels [25].
σ B M F = f F σ F + ( 1 f F ) σ B M
ε B M F = f F ε F + ( 1 f F ) ε B M
q = σ B M σ F ε F ε B M
While austenite in low-alloy TRIP steels might be regarded as a hard phase due to the carbon enrichment during the austempering treatment [25], in the current analysis, it was considered as being in between the soft ferrite phase and the hard (BM) mixture. Therefore, for the mixture of austenite and BMF, an isostrain mixture law was used.

4. Implementation of Constitutive Model

4.1. Parameters

There are three kinds of parameters: input, fixed, and calibrated parameters. Due to the phenomenological nature of the current model, the input parameters correspond to the grain size and volume fraction of each phase, as previously shown in Table 3 and Table 4.
The fixed parameters correspond to the Mecking-Kocks model constants. Table 7 shows the fixed parameters along with the calibrated parameters k and f used in the current analysis. ρ 0 is the strain-free dislocation density of each phase, i.e., the initial condition in Equation (6). The corresponding values were taken from [25]. σ 0 corresponds to the strength contributions different from those due to the dislocation density. For bainite, austenite, and martensite, the values used in Bouquerel et al. works were employed. For ferrite, Bouquerel worked with values in the range of 320–350 MPa. On the other hand, ferrite is the soft phase on TRIP steels, with a volume fraction near 50%, so it is expected that TRIP steels yielding starts with ferrite yielding. Figure 7 shows that TRIP yielding starts at stresses in the range of 200–300 MPa, so a ferrite yield strength σ 0 equal to 220 MPa was considered for the current analysis. Values for α, M, G, and b are taken as explained in Section 3.2.
According to Mecking and Kocks’s description [26,27], the evolution of dislocation density reflects the competition between the creation ( d ρ / d ε ) + and annihilation ( d ρ / d ε ) of dislocations. ( d ρ / d ε ) + depends on the mean distance λ between obstacles for dislocation gliding. If there are several kinds of obstacles, λ 1 = i λ i 1 , where λ i is the mean distance between a specific obstacle. In a TRIP steel free of precipitated particles, these obstacles are grain boundaries and other dislocations. Therefore, λ 1 = d 1 + k ρ , where d refers to the grain size, ρ is the instantaneous dislocation density, and k is a fitting constant. ( d ρ / d ε ) represents the dislocation annihilation rate when two dislocations with opposite Burger’s vectors find themselves. This term is expressed as f ρ , where f is a fitting constant. In the current analysis, the values of k and f shown in Table 7 for austenite, bainite, and martensite are similar to those reported in Bouquerel et al.’s work [25].
Austenite transformation into martensite generates a distortion, which is accommodated by extra dislocations in the surrounding soft phase (ferrite) [32]. Due to this phenomenon, it is expected that the evolution of dislocation density in the ferrite phase depends not only on its intrinsic features, but also on the austenite stability. In order to take into account both effects and improve the results of the constitutive model, the k and f constants for ferrite of the Mecking-Kocks’s model had to be determined. Table 8 shows the k and f fitting constants for each TRIP steel.
The Olson-Cohen (OC) parameters obtained by the Samek expressions are shown in Table 6. However, these expressions do not account for other factors that influence austenite stability, such as retained austenite grain size and prior austenite heat treatment, so Table 8 shows the modified OC parameters in order to obtain a better adjustment for the retained austenite volume fraction transformed into martensite.

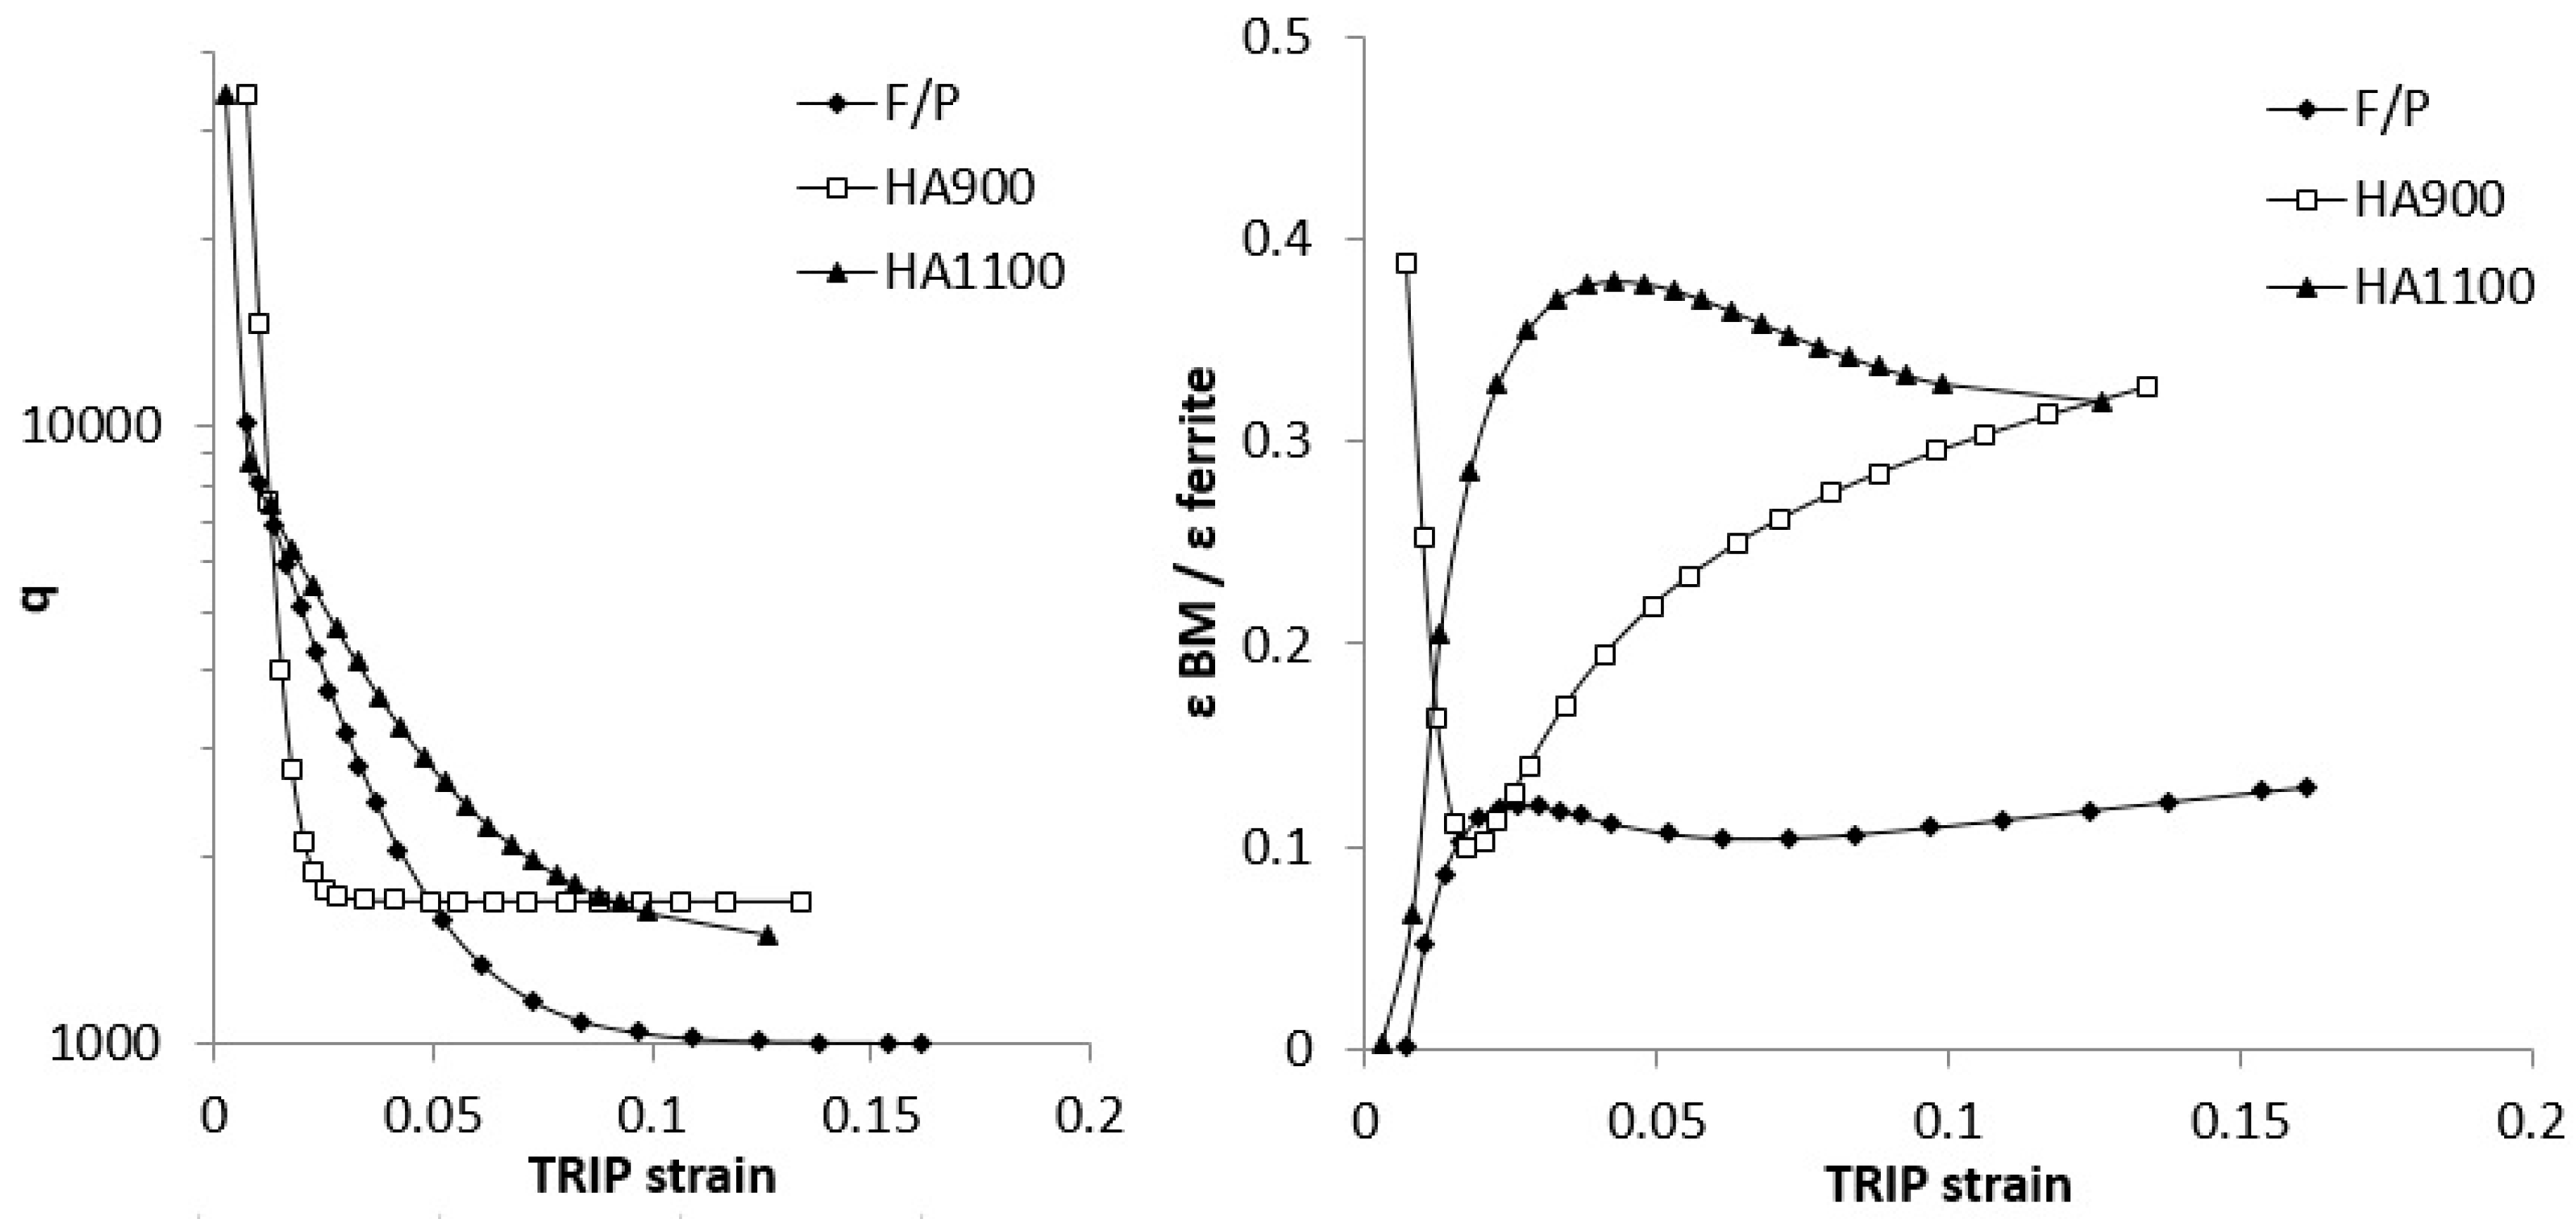
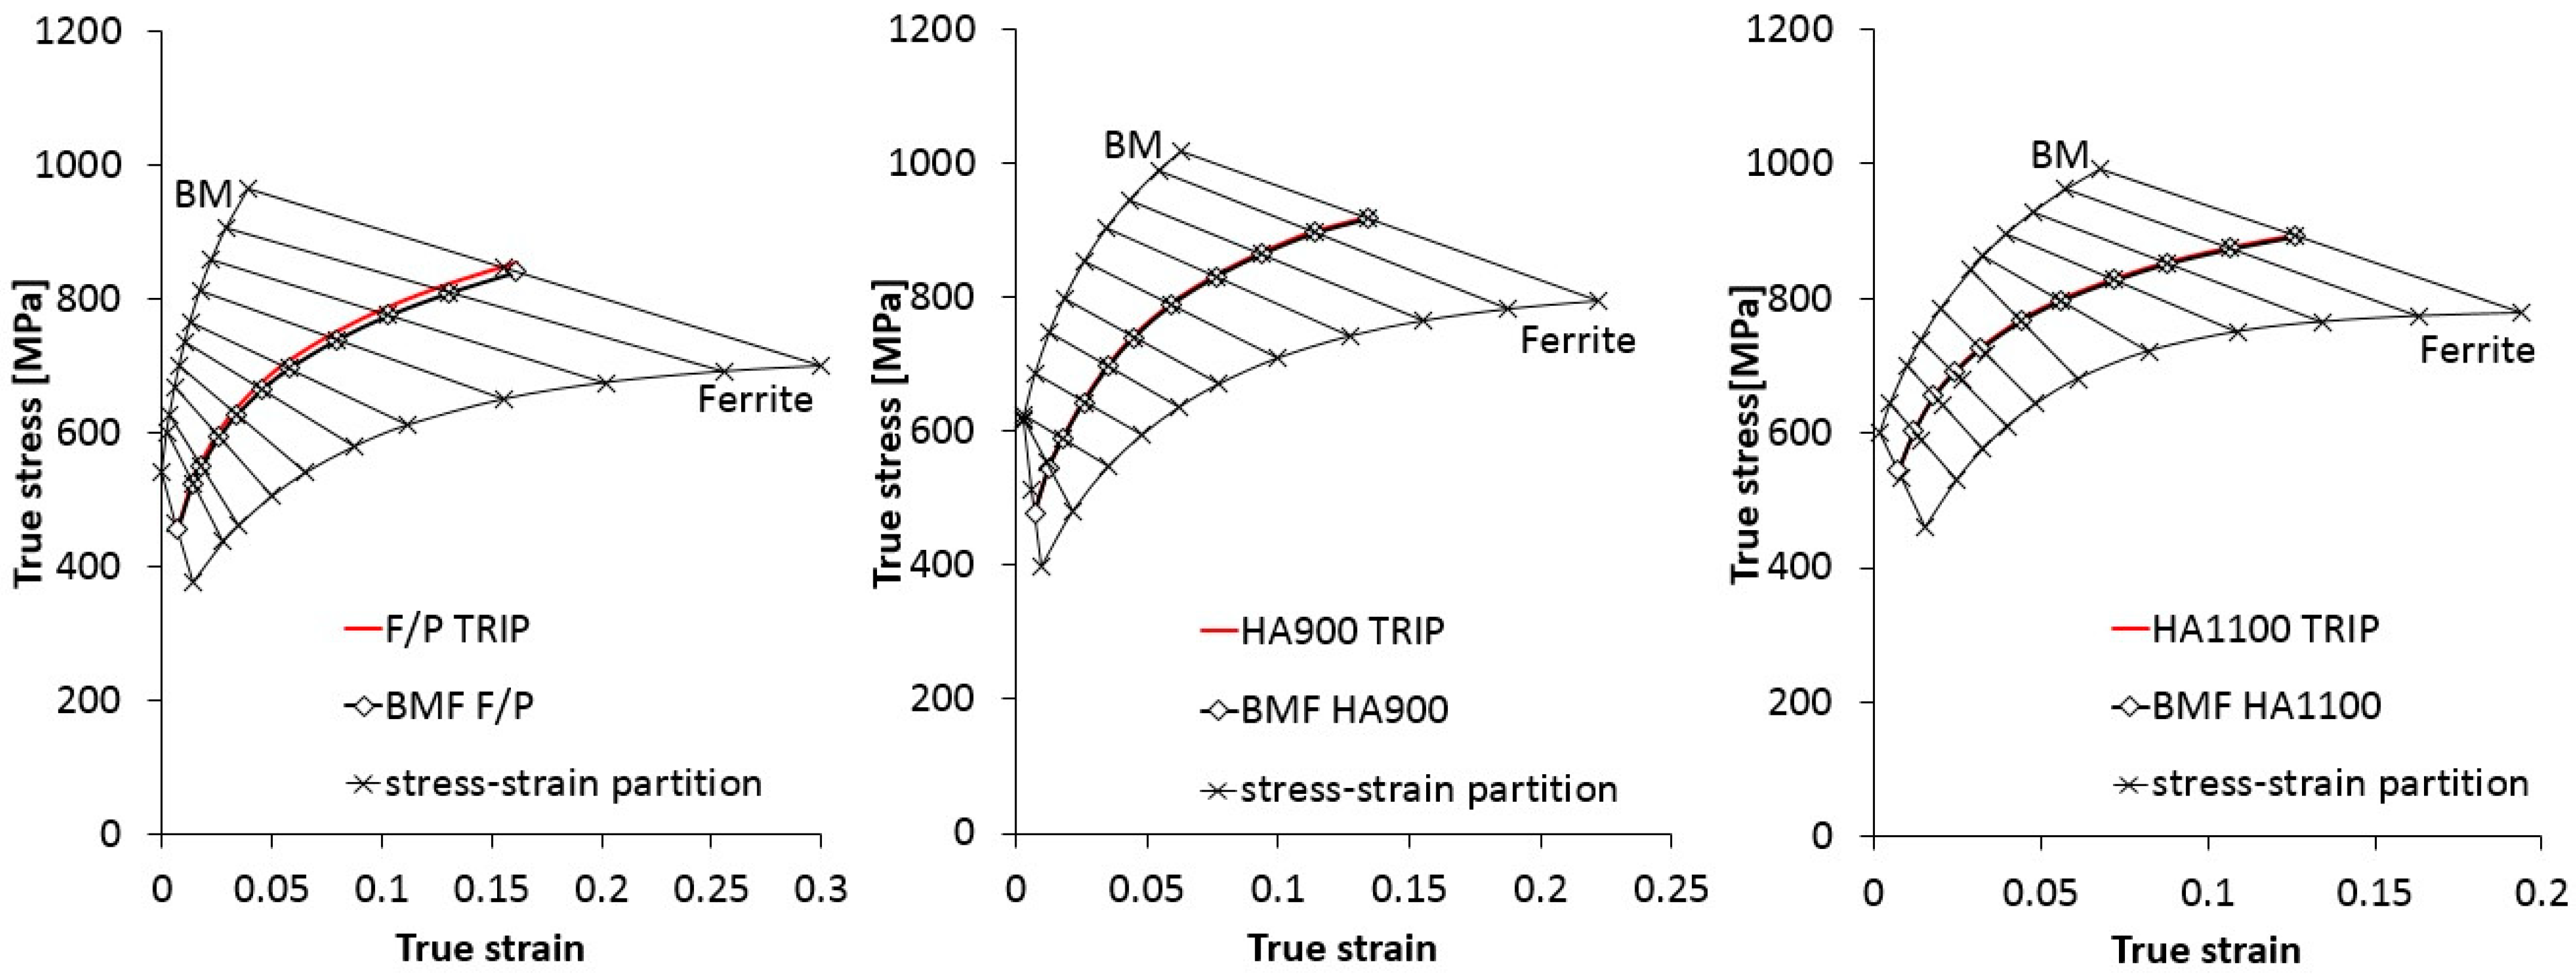
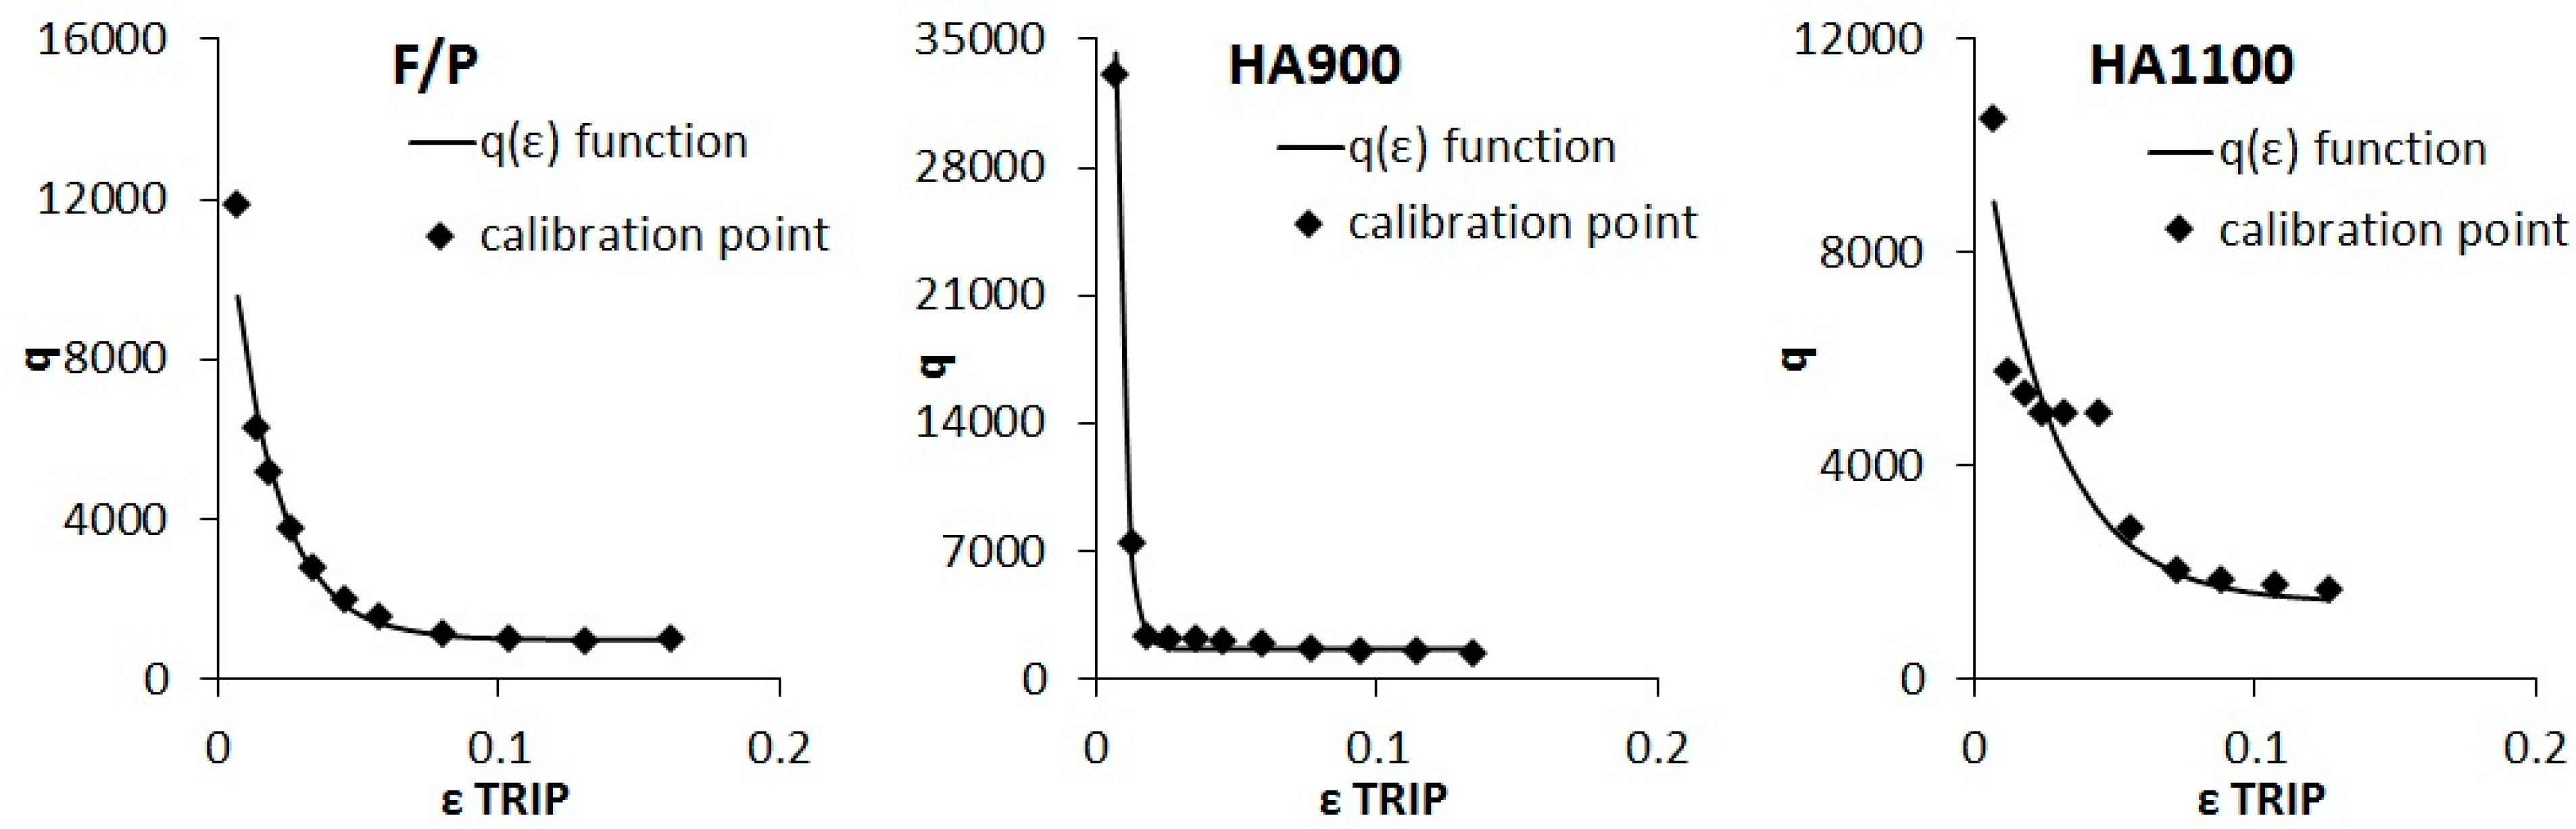
4.2. Stress Strain Partitioning and q Coefficient

Figure 8 shows the true stress vs. true strain curves for each TRIP steel in dashed lines. Due to the specific features of the current model, TRIP steel is an isostrain mixture between BMF and retained austenite. Table 2 shows that the retained austenite volume fraction is low with respect to the whole material and this amount is decreased by its transformation into martensite. Figure 8 shows F/P TRIP (with austenite) and BMF (without austenite), where is possible to appreciate that the relative austenite contribution on the stress-strain curve of the overall material is negligible. Figure 8 also shows the true stress vs. true strain curves for the BMF constituent obtained from experimental curves of TRIP steel eliminating the austenite contribution. The stress-strain partition between soft ferrite and hard BM was done with respect to the BMF constituent and it is accurately shown in Figure 8. The slope value of the stress-strain partition corresponds to the q value (Equation (9)), and it was determined on 11 calibration points.

4.3. q(ε) Function

The q coefficient represents the way in which the stress and strain are distributed between the soft and the hard phase in a specific material, so q can be considered as a material property as it is determined by the intrinsic features of the soft and hard phases. Based on the q values obtained from Figure 8, a three-parameter exponential equation for q(ε) was proposed for each steel (Equation (10)):
q ( ε ) = A · e x p   ( B · ε ) + C
where the A, B, and C constants for each steel are shown in Table 9 and their respective curves, in Figure 9. The behavior of these curves is similar to that reported by other authors for TRIP and Dual Phase steels [25,31].

4.4. Integrated Numerical Model and Evaluation

Based on the microstructural input parameters, the Mecking-Kocks’ fixed parameters, the accuracy of calibrated parameters, the suitable mixture laws, and the definition of q(ε) function, a multiscale constitutive model was implemented. Figure 10 compares the experimental true stress-strain curves [27] and the computed numerical solution.
The parameter q contains the stress strain partitioning information, but in order to understand the effective distribution between hard and soft constituents, the ratio ε BM/ ε ferrite must be analyzed. Figure 11 shows the q curves for each steel along with their corresponding ε BM/ ε ferrite curves.
The F/P and HA1100 ε BM/ ε ferrite curves exhibit a qualitatively similar behavior. In the first stages of the TRIP strain, the ε BM/ ε ferrite values increase sharply. This means that as the ferrite is hardening, the hard phase (BM) increases its relative contribution to the total strain. The ferrite hardening at a low TRIP strain can be explained by the fact that, due to the transformation of austenite into martensite by cooling, a higher initial dislocation density in the ferrite that surrounds this austenite is expected. This effect is markedly stronger for the HA1100 steel due to having the lowest austenite chemical stability (see Table 5). The initial dislocation density ρ 0 for ferrite considered in the constitutive model corresponds to the dislocation density for a free deformation ferrite in all cases (see Table 7). In order to take into account the effect of the austenite stability on the dislocation density evolution into ferrite phase, the Mecking-Kocks’ ferrite constants k and f were calibrated (see Table 8). After this accelerated ferrite hardening, the ε BM/ ε ferrite ratio slightly decreases as the amount of strain-induced martensite increases.
The ε BM/ ε ferrite curve for the HA900 steel behaves differently. At low TRIP strain values, the ε BM/ ε ferrite ratio is high. This value decreases sharply, meaning that, at those low levels of strain, only the soft phase is deforming. The point from the ε BM/ ε ferrite curve that exhibits an increasing behavior is displaced to a high ε TRIP, meaning that plastic deformation for the hard constituent of the HA900 steel starts at a higher TRIP strain than for the other two steels (see Figure 8). From there on, the ε BM/ ε ferrite curve for the HA900 always increases, meaning that its soft ferrite phase continuously hardens. Two combined factors explain this behavior: the fine grain size of ferrite, which increases the dislocation density rate (see Equation (5)), and the high level of strain-induced transformation of retained austenite into martensite (see Table 2), which increases the dislocation density in the surrounding ferrite.
From the previous analysis, the numerical evaluation shows that an accelerated increase in the soft phase occurs in the first stages and with this, the transformation of austenite to martensite could contribute significantly. This hardening is consistent with the different austenite stabilities of each steel, taking into account as stability the transformation of austenite to martensite by cooling and by deformation. Certainly, the hardening evolution by the TRIP effect is more interesting in the first stages of the deformation process, but the gradual hardening in the first stages is a result of two forms of austenite transformation: cooling (heat treatment) and strain. Further study of hardening and changes in the very early stages will be addressed by the authors in a future development of the model by means of interrupted tension tests.

5. Conclusions

The mechanical-microstructural characterization of three low-alloy multiphase TRIP steels of the same composition, but that underwent different heat treatments, was performed. The proportion of phases during intercritical annealing was similar, so the differences in stress strain flow laws and mechanical properties were credited to two factors: austenite stability and grain size of the respective phase. The main conclusions are summarized as:
  • A model based on Bouquerel’s work to describe stress strain flow on three different TRIP steels was used. In the current case, similar parameters were employed. Based on this fact, this work represents a validation of Bouquerel’s work;
  • In order to improve the accuracy, some parameters were calibrated. This calibration was justified by the dislocation density increment associated with austenite stability;
  • Due to the phenomenological nature of the current model, it is possible to gain a better understanding of the mechanical behavior and the stress strain flow law for each TRIP steel;
  • The strain partition between the soft ferrite and the hard bainite/martensite constituents was estimated. The partition is mainly related to the ferrite hardening rate and this is linked to austenite stability and the ferrite grain size.

Author Contributions

Conceptualization, A.M. and A.S.; Methodology, A.M., A.S. and A.A.; Software, A.S. and D.C.; Validation, A.S. and D.C.; Formal Analysis, A.S. and A.M.; Investigation, A.M. and A.S.; Resources, A.M.; Data Curation, A.S.; Writing-Original Draft Preparation, A.S.; Writing-Review & Editing, A.S., A.M. and L.C.; Visualization, A.S. and A.M.; Supervision, A.M.; Project Administration, A.M.; Funding Acquisition, A.M.

Funding

“Proyectos Basal USA 1555—Vridei 051714MG_MOV. Universidad Santiago de Chile”, FONDECYT Grant 1170905, CONICYT-PFCHA/Doctorado Nacional/2013-21130833, and DICYT USACH.

Acknowledgments

The authors wish to thank “Proyectos Basal USA 1555—Vridei 051714MG_MOV. Universidad Santiago de Chile”, FONDECYT Grant 1170905, CONICYT-PFCHA/Doctorado Nacional/2013-21130833, and DICYT USACH, for their financial support. Also, the authors wish to thank “Programa de Integridad Estructural”, “Redes USACH” Grant 051814 MG_RED, and “Redes CONICYT” Grant 180123.

Conflicts of Interest

The authors declare no conflict of interest.

References

  1. Petrov, R.; Kestens, L.; Houbaert, Y. Recrystallization of a cold rolled trip-assisted steel during reheating for intercritical annealing. ISIJ Int. 2001, 41, 883–890. [Google Scholar] [CrossRef]
  2. Jacques, P.J.; Furnémont, Q.; Lani, F.; Pardoen, T.; Delannay, F. Multiscale mechanics of TRIP-assisted multiphase steels: I. Characterization and mechanical testing. Acta Mater. 2007, 55, 3684–3693. [Google Scholar] [CrossRef]
  3. Matsumara, O.; Sakuma, Y.; Takechi, H. Enhancement of elongation by retained austenite in intercritical annealed 0.4C-1.5Si-0.8Mn steel. Trans. ISIJ 1987, 27, 570–579. [Google Scholar] [CrossRef]
  4. Takahashi, M.; Development of High Strength Steels for Automobiles. Nippon Steel Technical Report. 2003. Available online: http://www.nssmc.com/en/tech/report/nsc/pdf/n8802.pdf (accessed on 21 September 2018).
  5. Van Dijk, N.H.; Butt, A.M.; Zhao, L.; Sietsma, J.; Offerman, S.E.; Wright, J.P.; Van der Zwaag, S. Thermal stability of retained austenite in TRIP steels studied by synchrotron X-Ray diffraction during cooling. Acta Mater. 2005, 53, 5439–5447. [Google Scholar] [CrossRef]
  6. Olson, G.B.; Cohen, M. Kinetics of strain-induced martensitic nucleation. Metall. Trans. A 1975, 6A, 791–795. [Google Scholar] [CrossRef]
  7. Baik, S.C.; Kim, S.; Jin, Y.S.; Kwon, O. Effects of alloying elements on mechanical properties and phase transformation of cold rolled TRIP steel sheets. ISIJ Int. 2001, 41, 290–297. [Google Scholar] [CrossRef]
  8. Samek, L.; De Moor, E.; Penning, J.; De Cooman, B.C. Influence of alloying elements on the kinetics of strain-induced martensitic nucleation in low-alloy, multiphase high-strength steels. Metall. Mater. Trans. A 2006, 37A, 109–124. [Google Scholar] [CrossRef]
  9. Basuki, A.; Aernoudt, E. Influence of rolling of TRIP steel in the intercritical region on the stability of retained austenite. J. Mater. Process. Technol. 1999, 89–90, 37–43. [Google Scholar] [CrossRef]
  10. Wang, J.; Van der Zwaag, S. Stabilization mechanisms of retained austenite in transformation-induced plasticity steel. Metall. Mater. Trans. A 2001, 32A, 1527–1539. [Google Scholar] [CrossRef]
  11. Iwamoto, T.; Tsuta, T. Computational simulation of the dependence of the austenitic grain size on the deformation behavior of TRIP steels. Int. J. Plast. 2000, 16, 791–804. [Google Scholar] [CrossRef]
  12. Iwamoto, T. Multiscale computational simulation of deformation behavior of TRIP steel with growth of martensitic particles in unit cell by asymptotic homogenization method. Int. J. Plast. 2004, 20, 841–869. [Google Scholar] [CrossRef]
  13. Jacques, P.J.; Girault, E.; Mertens, A.; Verlinden, B.; van Humbeeck, J.; Delannay, F. The developments of cold-rolled TRIP-assisted multiphase steels. Al-alloyed TRIP-assisted multiphase steels. ISIJ Int. 2001, 41, 1068–1074. [Google Scholar] [CrossRef]
  14. Zhang, M.; Li, L.; Ding, J.; Wu, Q.; Wang, Y.-D.; Almer, J.; Guo, F.; Ren, Y. Temperature-dependent micromechanical behavior of medium-Mn transformation-induced-plasticity steel studied by in situ synchrotron X-ray diffraction. Acta Mater. 2017, 141, 294–303. [Google Scholar] [CrossRef]
  15. Kim, H.; Lee, J.; Barlat, F.; Kim, D.; Lee, M.-G. Experiment and modeling to investigate the effect of stress state, strain and temperature on martensitic phase transformation in TRIP-assisted steel. Acta Mater. 2015, 97, 435–444. [Google Scholar] [CrossRef]
  16. Grzegorczyk, B.; Kozlowska, A.; Morawiec, M.; Muszynski, R.; Grajcar, A. Effect of deformation temperature on the Portevin-Le Chatelier effect in medium-Mn steel. Metals 2019, 9, 2. [Google Scholar] [CrossRef]
  17. Hecker, S.S.; Stout, M.G.; Staudhammer, K.P.; Smith, J.L. Effects of strain state and strain rate on deformation- induced transformation in 304 stainless steel part I. magnetic measurements and mechanical behavior. Metall. Mater. Trans. A 1982, 13, 619–626. [Google Scholar] [CrossRef]
  18. Grajcar, A.; Kwasny, W.; Zalecki, W. Microstructure-property relationships in TRIP aided medium-C bainitic steel with lamellar retained austenite. Mater. Sci. Technol. 2015, 31, 781–794. [Google Scholar] [CrossRef]
  19. Hall, E.O. The deformation and ageing of mild steel. Proc. Phys. Soc. 1951, 64, 747–753. [Google Scholar] [CrossRef]
  20. Petch, N.J. The cleavage strength of polycrystals. J. Iron Steel Inst. 1953, 174, 25–28. [Google Scholar]
  21. Airod, A.; Petrov, R.; Colás, R.; Houbaert, Y. Analysis of the trip effect by means of axisymmetric compressive test on a Si-Mn bearing steel. ISIJ Int. 2004, 44, 179–186. [Google Scholar] [CrossRef]
  22. Van Slycken, J.; Verleysen, P.; Degrieck, J.; Bouquerel, J.; De Cooman, B.C. Dynamic response of aluminium containing TRIP steel and its constituent phases. Mater. Sci. Eng. A 2007, 460–461, 516–524. [Google Scholar] [CrossRef]
  23. Cai, Z.H.; Ding, H.; Xue, X.; Jiang, J.; Xin, Q.B.; Misra, R.D.K. Significance of control of austenite stability and three-stage work-hardening behavior of an ultrahigh strength-high ductility combination transformation-induced plasticity steel. Scripta Mater. 2013, 68, 865–968. [Google Scholar] [CrossRef]
  24. Panich, S.; Barlat, F.; Uthaisangsuk, V.; Suranuntchai, S.; Jirathearanat, S. Experimental and theoretical formability analysis using strain and stress based forming limit diagram for advanced high strength steels. Mater. Des. 2013, 51, 756–766. [Google Scholar] [CrossRef]
  25. Bouquerel, J.; Verbeken, K.; De Cooman, B.C. Microstructure-based model for the static mechanical behaviour of multiphase steels. Acta Mater. 2006, 54, 1443–1456. [Google Scholar] [CrossRef]
  26. Mecking, H.; Kocks, U.F. Kinetics of flow and strain-hardening. Acta Metall. 1981, 29, 1865–1875. [Google Scholar] [CrossRef]
  27. Estrin, Y.; Mecking, H. A unified phenomenological description of work hardening and creep based on one-parameter models. Acta Metall. 1984, 32, 57–70. [Google Scholar] [CrossRef]
  28. Salinas, A.; Artigas, A.; Perez-Ipiña, J.; Castro-Cerda, F.; Garza-Montes de Oca, N.; Colás, R.; Petrov, R.; Monsalve, A. Effects of heat treatment on morphology, texture and mechanical properties of a MnSiAl multiphase steel with TRIP behavior. Metals 2018, 8, 1021. [Google Scholar] [CrossRef]
  29. Monsalve, A.; Guzmán, A.; De Barbieri, F.; Artigas, A.; Carvajal, L.; Bustos, O.; Garza-Montes de Oca, N.; Colás, R. Mechanical and Microstructural characterization of an aluminum bearing TRIP Steel. Metall. Mater. Trans. A 2016, 47A, 3088–3094. [Google Scholar] [CrossRef]
  30. Rodriguez, R.; Gutierrez, I. Unified formulation to predict the tensile curves of steels with different microstructures. Mater. Sci. Forum 2003, 246–432, 4525–4530. [Google Scholar] [CrossRef]
  31. Lian, J.; Jiang, Z.; Liu, J. Theoretical model for the tensile work hardening behaviour of dual-phase steel. Mater. Sci. Eng. A 1991, A147, 55–65. [Google Scholar] [CrossRef]
  32. Greenwood, G.W.; Johnson, R.H. The deformation of metals under small stresses during phase transformations. Proc. R. Soc. Lond. A 1965, 283, 403–422. [Google Scholar] [CrossRef]
Figure 1. Scheme of the multiscale constitutive stress-strain model for complex multiphasic low-alloy TRIP steels proposed by Bouquerel et al. based on individual constituents [25].
Metals 09 00250 g001
Figure 2. Schematic representation of heat treatments employed to obtain multiphase TRIP aided steels.
Metals 09 00250 g002
Figure 3. Microstructures of (a) cold worked ferrite and pearlite, Nital; (b) F/P, LePera; (c) HA900, LePera; (d) HA1100, LePera. (bd) show three multiphase low-alloy TRIP steels [28].
Metals 09 00250 g003
Figure 4. SEM micrographs of representative samples of each steel: (a) F/P, (b) HA900, (c) HA1100. A/M: Austenite/Martensite, F: Ferrite, B: Bainite [28].
Metals 09 00250 g004
Figure 5. IQ + phase map for each steel. In the IQ map, dark zones correspond to a low IQ value, and in the phase map, the BCC structures are shown in red (ferrite, bainite, martensite) and the FCC structures are shown in green (austenite). (a) F/P steel, (b) HA900 steel, (c) HA1100 steel. Step size 60 nm [28].
Metals 09 00250 g005
Figure 6. Multiscale constitutive model for low-alloy multiphase TRIP steels used in the current analysis. BM: Bainite+Martensite. BMF: Bainite+Martensite+Ferrite.
Metals 09 00250 g006
Figure 7. Stress vs. strain curves on representative samples for each steel.
Metals 09 00250 g007
Figure 8. Stress-strain partition between Ferrite and BM for each steel.
Metals 09 00250 g008
Figure 9. Stress-strain partition coefficient q(ε) functions proposed for each steel.
Metals 09 00250 g009
Figure 10. Comparison of true stress true strain of the whole material obtained by experimental data [28] and the numerical model for each steel.
Metals 09 00250 g010
Figure 11. q curves and strain partition for the three steels.
Metals 09 00250 g011
Table 1. Parameters used for the heat treatment cycles and austenite grain size after austenitization.
Id. SteelAust. *IAT **IBT ***PAGS ****
[°C][min][°C][min][°C][min][µm]
F/P----750103907--
HA9009001075090390710.3 ± 0.8
HA1100110010750135390718.9 ± 3.5
* Austenization. ** Intercritical Annealing Treatment. *** Isothermal Bainitic Treatment. **** Prior Austenite Grain Size (developed during the HA treatment).
Table 2. Austenite and martensite volume fraction obtained by X-Ray and EBSD.
Steel% Austenite BTT
(X-Ray)
% Austenite ATT
(X-Ray)
AV Transformed% Austenite
BTT
(EBSD)
% Martensite
BTT
(EBSD)
F/P5.72.23,55.92.5
HA9005.00.54,45.34.1
HA11003.70.43,43.54.8
BTT: Before Tensile Test ATT: After Tensile Test AV: Austenite Volume.
Table 3. Characteristic dimensions for each steel [μm].
SteelFerriteBainiteAusteniteMartensite
F/P11 ± 32.9 ± 0.60.7 ± 0.30.5 ± 0.3
HA9005 ± 14.1 ± 1.91.0 ± 0.60.7 ± 0.4
HA110011 ± 25.4 ± 1.51.0 ± 0.51.0 ± 0.7
Table 4. Phase volume fractions for each steel [%].
SteelFerriteBainiteAusteniteMartensite
F/P43.8 ± 3.148.15.72.4
HA90044.3 ± 0.746.95.03.9
HA110046.2 ± 0.545.03.75.1
Table 5. Evolution of the amount of austenite due to transformation into martensite.
Austenite volume fraction [%]F/PHA900HA1100
Prior to cooling from austempering 8.18.98.8
Retained after austempering5.75.03.7
Retained after tensile test 2.20.50.4
Austenite transformed to Martensite [%]
By cooling304.45.8
By strain (tensile test), fα619089
Table 6. Olson-Cohen (OC) parameters using Samek´s expresions [8].
OC-ParameterF/PHA900HA1100
α O C 22.522.022.3
β O C 2.42.42.4
Table 7. Fixed parameter values.
ConstantUnitsFerriteBainiteAusteniteMartensiteRef.
ρ 0 m−23 × 1012 10121013--[25]
σ 0 MPa220 [ref. Figure 7]200420900[25]
α--0.550.550.550.55[26]
M--3333[25]
GMPa78,50072,50078,50078,500[25]
bm2.48 × 10−102.48 × 10−102.58 × 10−102.48 × 10⁻¹⁰[25]
k----0.0220.01--[25]
f----5412.5[25]
Table 8. Calibrated parameters for the current model.
ParameterF/PHA900HA1100
Mecking-Kocks ferrite k constant0.0150.0200.060
Mecking-Kocks ferrite f constant5.56.515
Olson - Cohen   α O C 242426
Olson - Cohen   β O C 1.02.22.2
Table 9. Constants for q(ε) obtained for each steel.
ConstantF/PHA900HA1100
A13,200350,00010,000
B6033040
C1,00017001440

