Article

Hot Deformation Behavior of a 2024 Aluminum Alloy Sheet and its Modeling by Fields-Backofen Model Considering Strain Rate Evolution

1
National Key Laboratory for Precision Hot Processing of Metals, Harbin Institute of Technology, Harbin 150001, China
2
School of Mechanical Engineering, Dalian University of Technology, Dalian 116024, China
*
Author to whom correspondence should be addressed.
Metals 2019, 9(2), 243; https://doi.org/10.3390/met9020243
Submission received: 17 December 2018 / Revised: 10 February 2019 / Accepted: 14 February 2019 / Published: 18 February 2019
(This article belongs to the Special Issue Constitutive Modelling for Metals)

Abstract

:
The deformation behavior of a 2024 aluminum alloy sheet at elevated temperatures was studied by uniaxial hot tensile tests over the nominal initial strain rate range of 0.001–0.1 s−1 and temperature range of 375–450 °C. In order to analyze the deformation behavior with higher accuracy, a digital image correlation (DIC) system was applied to determine the strain distribution during hot tensile tests. Local stress-strain curves for different local points on the specimens were calculated. The strain rate evolution of each point during the tensile tests was investigated under different deformation conditions. Then, an improved Fields–Backofen (FB) model, taking into account the local strain rate evolution instead of the fixed strain rate, was proposed to describe the constitutive behaviors. It has been found that obvious non-uniform strain distribution occurred when the true strain was larger than 0.3 during hot tensile tests. The strain rate distribution during deformation was also non-uniform. It showed increasing, steady, and decreasing variation tendencies for different points with the increasing of strain, which led to the local flow stress being different at different local points. The flow stresses predicted by the improved FB model showed good agreement with experimental results when the strain rate evolutions of local points during tensile tests were considered. The prediction accuracy was higher than that of traditional FB models.

Graphical Abstract

1. Introduction

In recent years, aluminum alloys have been widely used in the aviation and automotive industries, due to their high strength to weight ratio and corrosion resistance [1,2]. However, further applications in complex-shaped components are limited because of the poor formability of aluminum alloys at room temperature. Forming at elevated temperature is a promising solution, because of the reduced flow stress, increased ductility, and increased toughness of the material compared with cold forming [3]. Hot forming processes, such as superplastic forming [4], quick plastic forming [5], and hot form and quench [6,7], have been developed to manufacture components with complex shapes and high dimensional accuracy. However, the material flow behavior is often complex during hot deformation, which is significantly affected by processing parameters, i.e., the strain, strain rate, and temperature [8,9]. A thorough study is necessary for researchers to have a better understanding of hot deformation behaviors to improve the forming processes.
Generally, constitutive models are of great importance for the analysis of hot deformation behaviors. There are three categories of constitutive models, among which the phenomenological models are the most widely used, due to fewer material parameters compared to the physical-based ones [10,11]. The strain-compensated Arrhenius model was found to provide more precise descriptions on the flow stress at evaluated temperatures [12,13]. However, the formula of the Arrhenius model is relatively complicated, and the parameter solution process is complex. The Fields-Backofen (FB) model has a very simple form for describing the flow behavior. It has been found that the original FB model is unable to predict the softening behavior of flow stress curves, because the exponential functions of strain and strain rate are monotonic increasing functions [14,15]. A strain softening item was introduced to the original FB model by Zhang [16] to describe the softening behavior for a magnesium alloy, the prediction of flow stress agreed better than the original FB model. Lin et al. [17] further improved the FB model for the titanium alloy by introducing strain rate in the softening item, which enhanced the prediction accuracy at higher strain rates. In the above literature, the formula of the improved FB model turned out to be more complicated. Although many efforts have been made for the FB model to fit the softening stages of flow stress curves, the FB model is still inaccurate for hot deformation when the strain rate and temperature ranges are relatively wide. Thus, further efforts are needed to improve the accuracy and maintain the simple form of the FB model at the same time.
To obtain constitutive models with higher accuracy, the experimental data obtained by the tensile test must be more precise [18]. The digital image correlation (DIC) system is an optical strain measurement method, which has been proven to be an effective way to detect the full-field strain distribution with very high accuracy [19,20]. In a traditional tensile test, the strain distribution was assumed to be uniform over the gauge length. Kang et al. [21] questioned the validity of this assumption. A digital image correlation system was used to evaluate the strain distribution of an AZ31magnesium sheet during tensile tests at room temperature. Nonlinear strain distribution was found on the sheet surface, due to the premature onset of diffused necking. In order to eliminate the influence of non-uniform strain distribution on the calculation of flow stress, Yoon et al. [22] analyzed the evolution of strain distribution of a steel sheet during tensile tests at room temperature. Various gauge lengths of 0.36–25 mm were used to determine the flow stress curves. Results showed that the stress-strain curves were more accurate and reliable based on shorter gauges than longer ones. Agirre et al. [23] further verified the validity of the DIC technique on the measurement of stress-strain curves during inhomogeneous deformation stages by various materials of steels and titanium alloys at room temperature. From the above works, it can be concluded that the strain distribution is non-uniform during tensile tests. The usage of an extensometer to calculate the strain and flow stress will lead to the underestimation of true strain and true stress. By using the DIC system, a localized small area, where the strain can be regarded as uniform, is defined at the necking zone to measure the true strain. In this way, more accurate flow stress curves at the inhomogeneous deformation stage are achieved at room temperature.
For hot deformation, the decreasing hardening effect at high temperatures intensifies the diffused necking, leading to the onset of inhomogeneous deformation earlier than at room temperature. In addition, the temperature distribution is often non-uniform when the tensile test is carried out by a Gleeble testing machine, which has a Gaussian form [24]. This will also lead to a non-uniform strain distribution of the tensile specimen. For non-uniform deformation at high temperatures, the DIC system is still an effective method for obtaining the strain distribution. Wang et al. [25] studied the deformation behavior of friction stir welded blanks at high temperatures by gas bulging tests. The non-uniform strain distributions of the base metal and weld were obtained by the DIC system. Merklein and Lechler [26] obtained more accurate flow stress curves of hot stamping steel 22MnB5 at high temperatures by using the DIC system. The influences of rolling direction, temperature, and strain rate on the flow properties were then analyzed. Bariani et al. [27] also used the DIC system to study the deformation behavior of a 6016 aluminum alloy with temperatures ranging from 20 to 500 °C and strain rates ranging from 0.01 to 1 s−1. Although they take the non-uniform deformation into account, the strain rate was still regarded as a constant during hot tensile tests. In fact, the non-uniform strain distribution results in the changing of strain rate in the measurement area, which cannot be ignored, due to the strain rate sensitivity for hot deformation. Thus, if the flow stress is calculated by the local strain measured using the DIC system, the local strain rate evolution must be given at the same time. Only in this way can the flow behavior of metals at high temperatures be described accurately.
In order to describe the hot deformation behavior of a 2024 aluminum alloy with higher accuracy, a digital image correlation system was employed to determine the strain distribution and the strain rate evolution during hot tensile tests. Local stress-strain curves of different local points were analyzed to reveal the influence of deformation behavior on the calculation of flow stress. A modified local Fields-Backofen constitutive model made in consideration of the strain rate evolution of each local point was used to predict the flow behavior of the material.

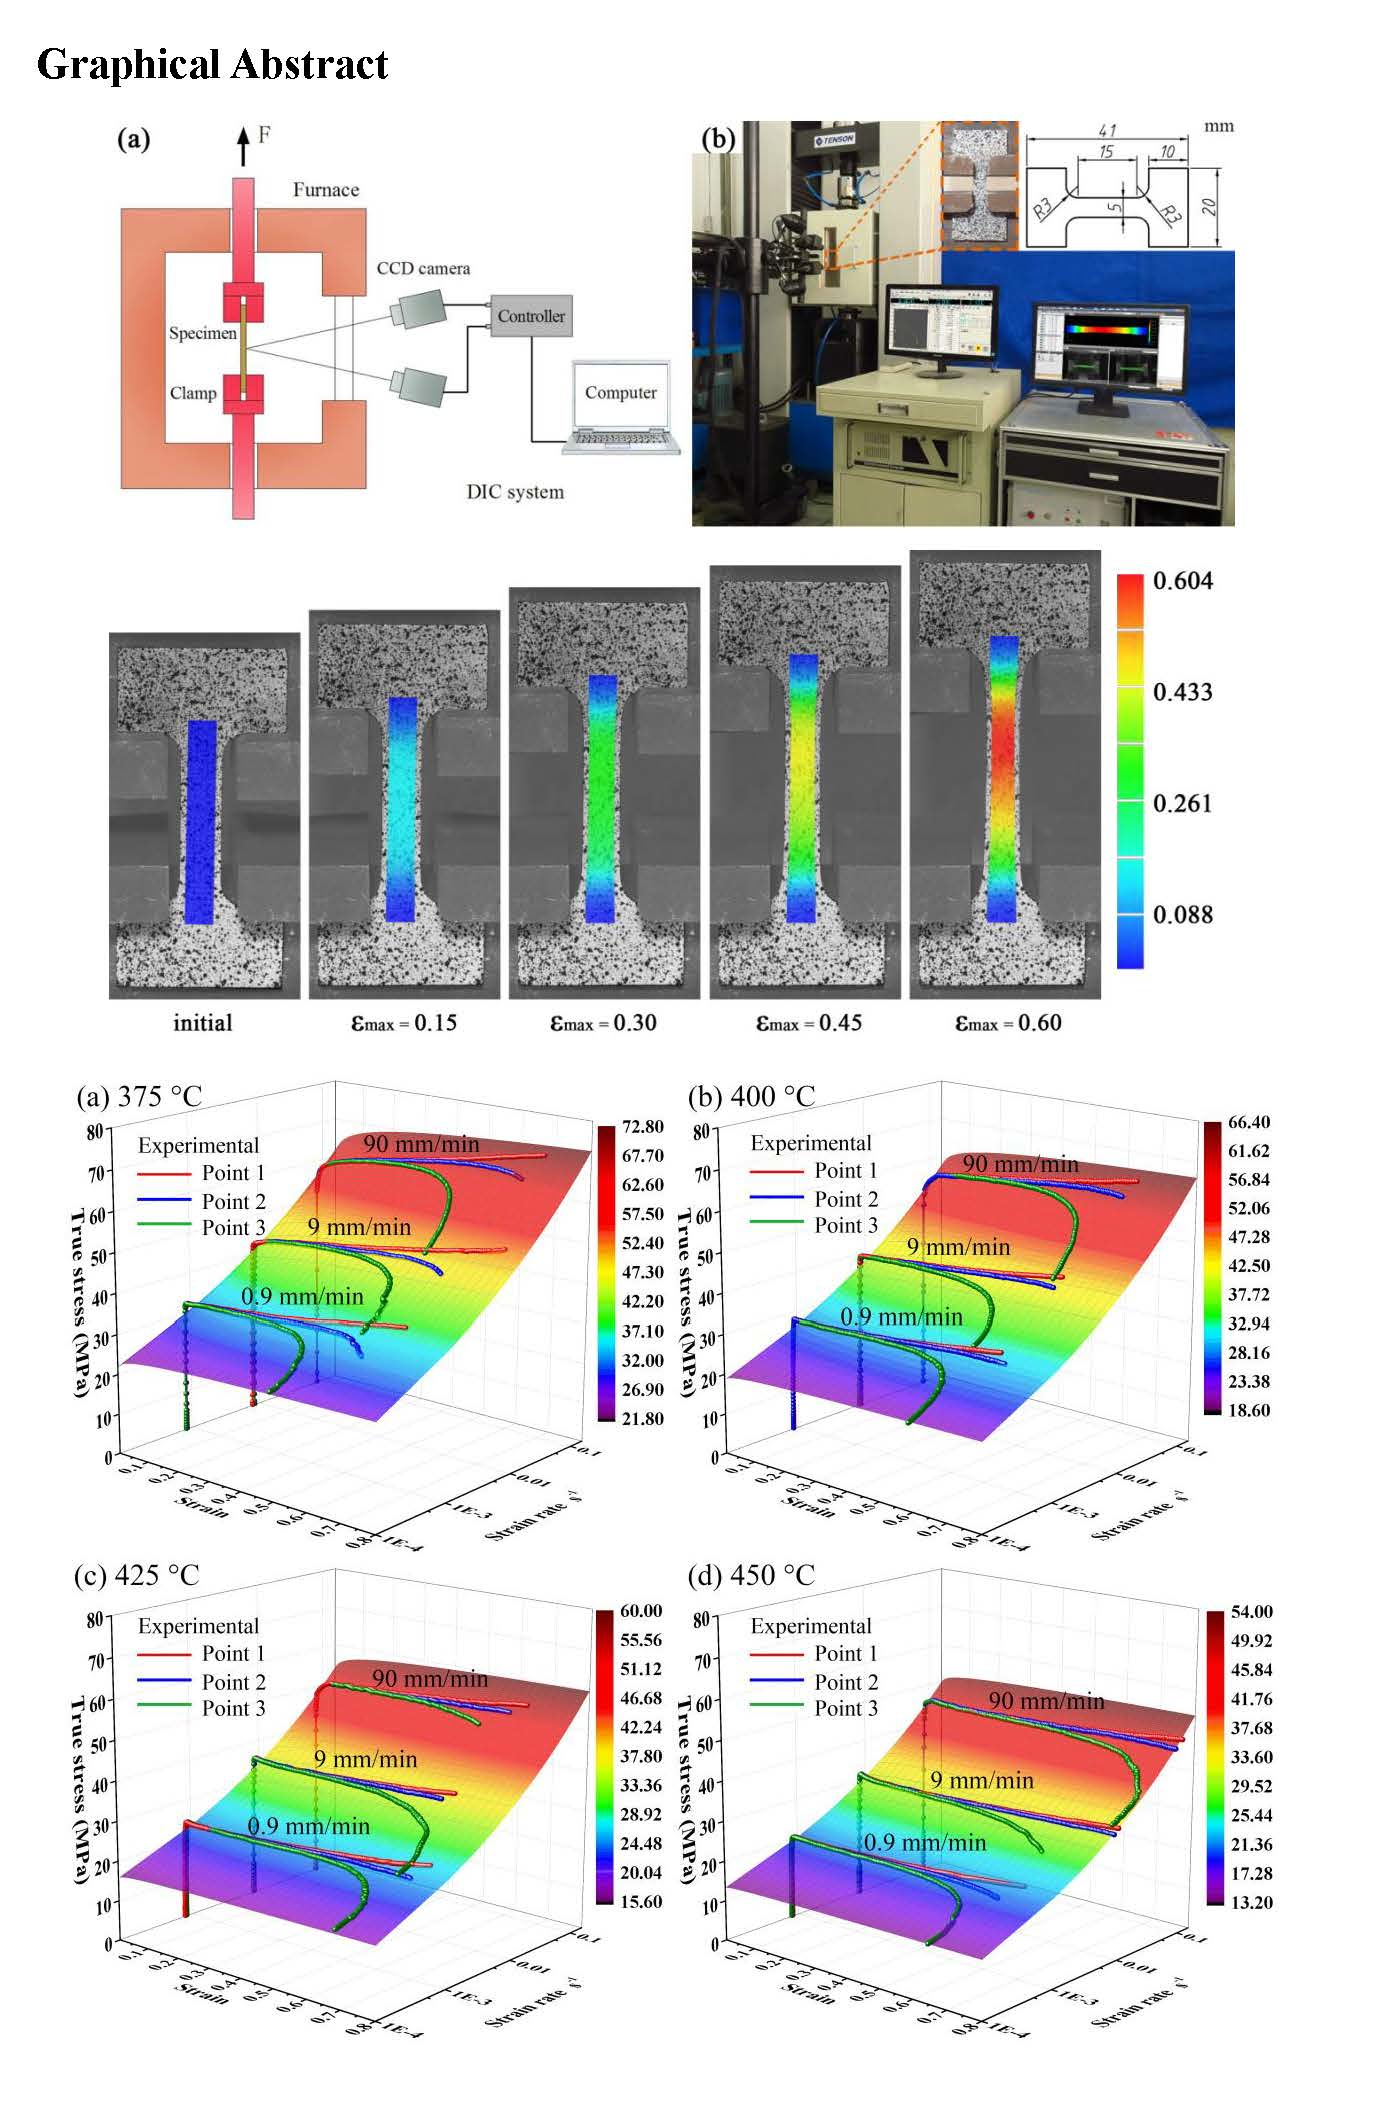
2. Materials and Methods

The material used in this research was a 2024 aluminum alloy sheet in an annealed condition with a thickness of 2.95 mm. Its chemical composition is given in Table 1.
With the aim of studying the hot deformation characteristics of the 2024 aluminum alloy sheet at high temperature, a three-dimensional DIC system was employed to determine the strain distribution during hot tensile tests. Figure 1 illustrates the hot tensile test set-up with a DIC system. Uniaxial tensile tests were conducted at temperatures of 375, 400, 425, and 450 °C by the tensile test machine WDW-T50 (Jinan Tianchen Co., Ltd., Jinan, China) with a high temperature furnace. The furnace was customized with an observation window in the front, covered by double-layered quartz glasses, which ensured the heat insulation of the furnace as well as ability to capture sample images. Two cameras (Basler AG, Ahrensburg, Germany) were placed up and down to measure the deformation on the specimen. The specimen was prepared with a 15 mm gauge length and 5 mm width, as shown in Figure 1b. The crosshead speeds were set as 0.9, 9, and 90 mm/min, which represented the nominal initial strain rates of 0.001, 0.01, and 0.1 s−1, respectively. After the furnace reached the set temperature, the specimens were fixed on the clamp and held for 20 min to gain a uniform temperature distribution before tensile tests. To obtain the strain distribution, a white under coating was painted on the sample to enhance the image contrast when preparing the speckles. However, it fell off easily under large deformation at high temperatures, resulting in the failure of strain measurement. Thus, a dull finish was adopted instead of the white under coating. After that, the DIC specimen was prepared by painting black speckles on the specimen with heat-resistant paint.

3. Results

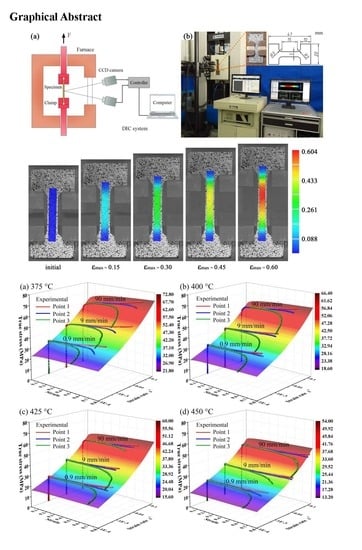
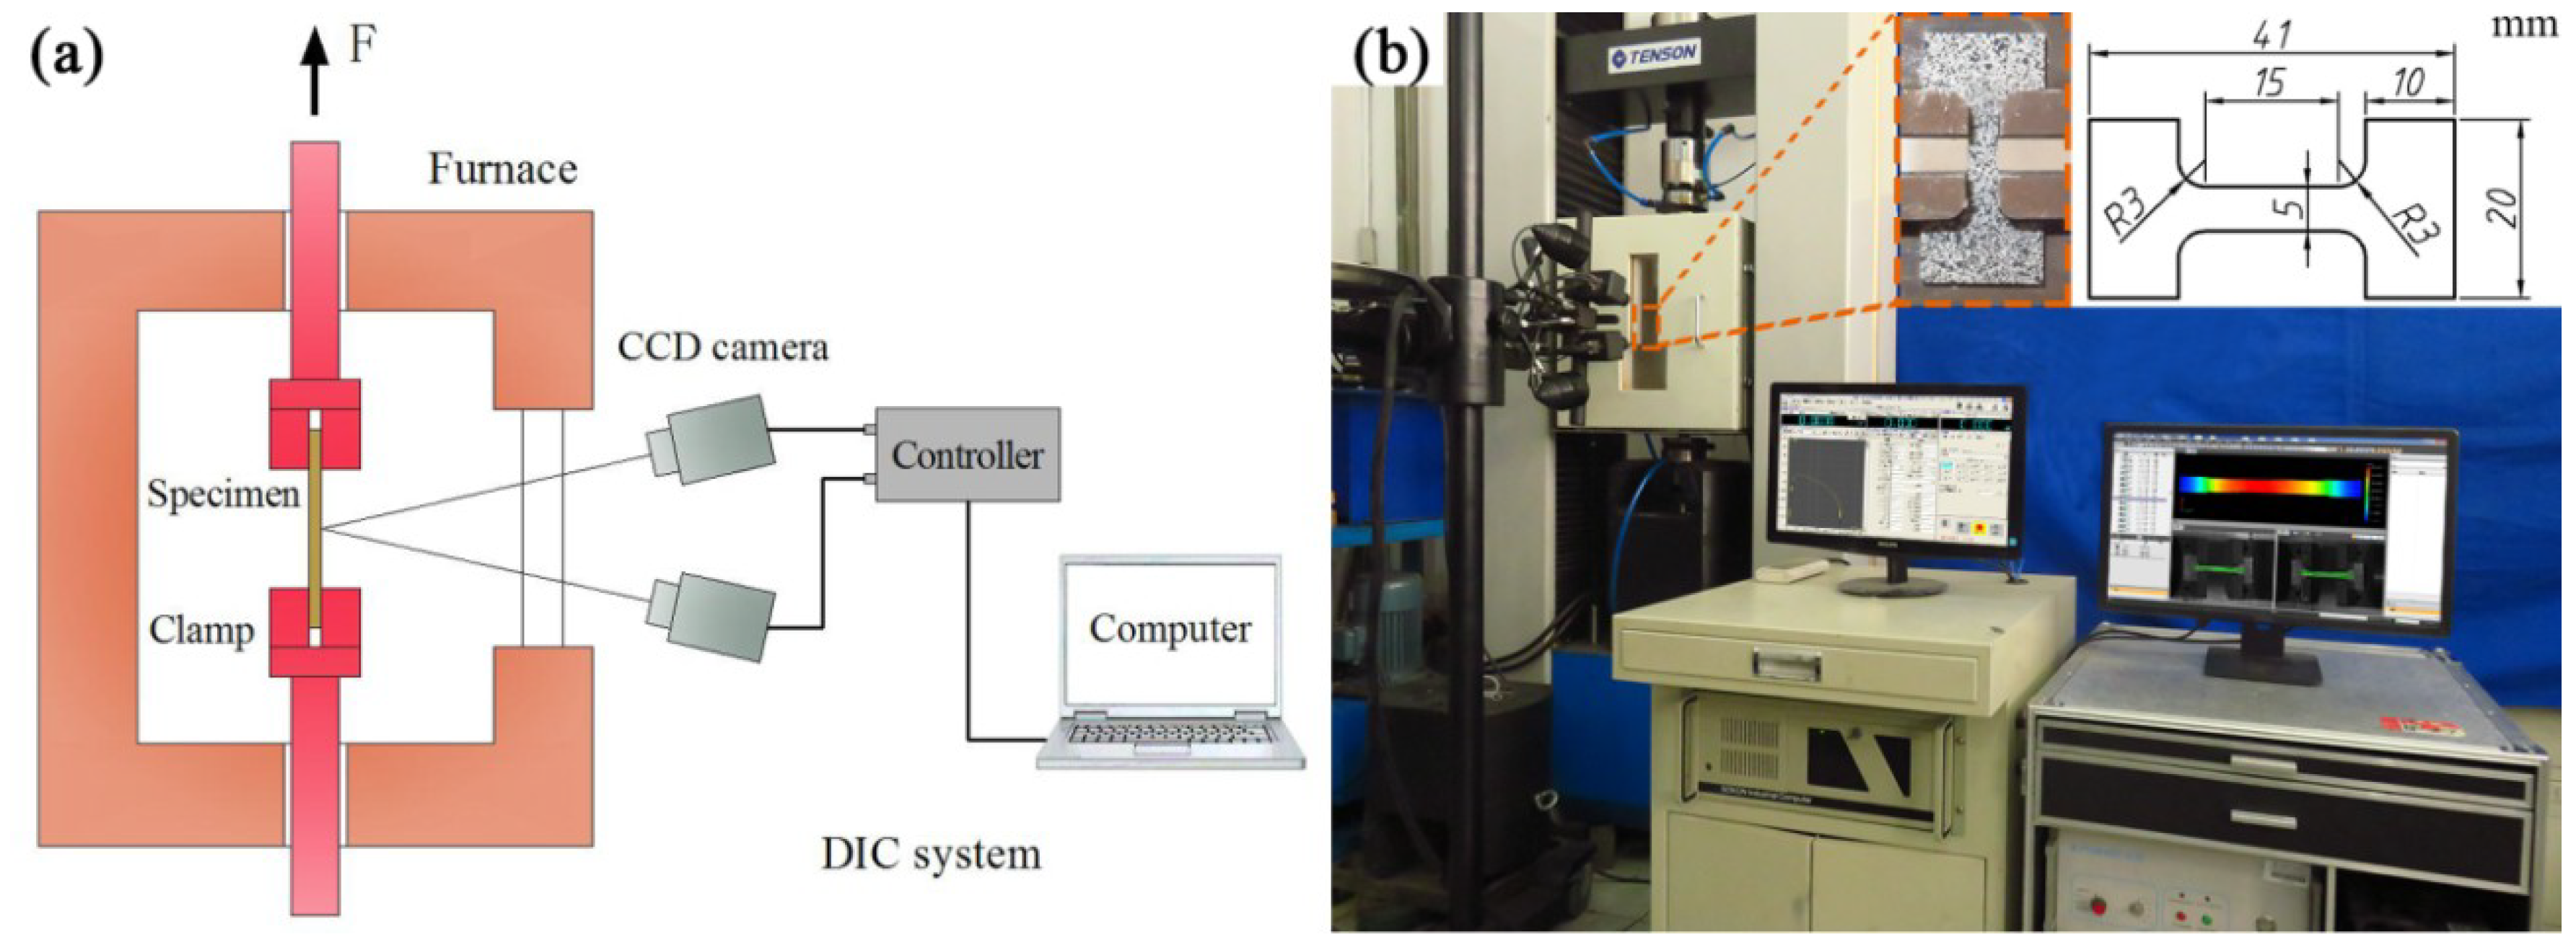
3.1. Non-uniform Flow Behavior

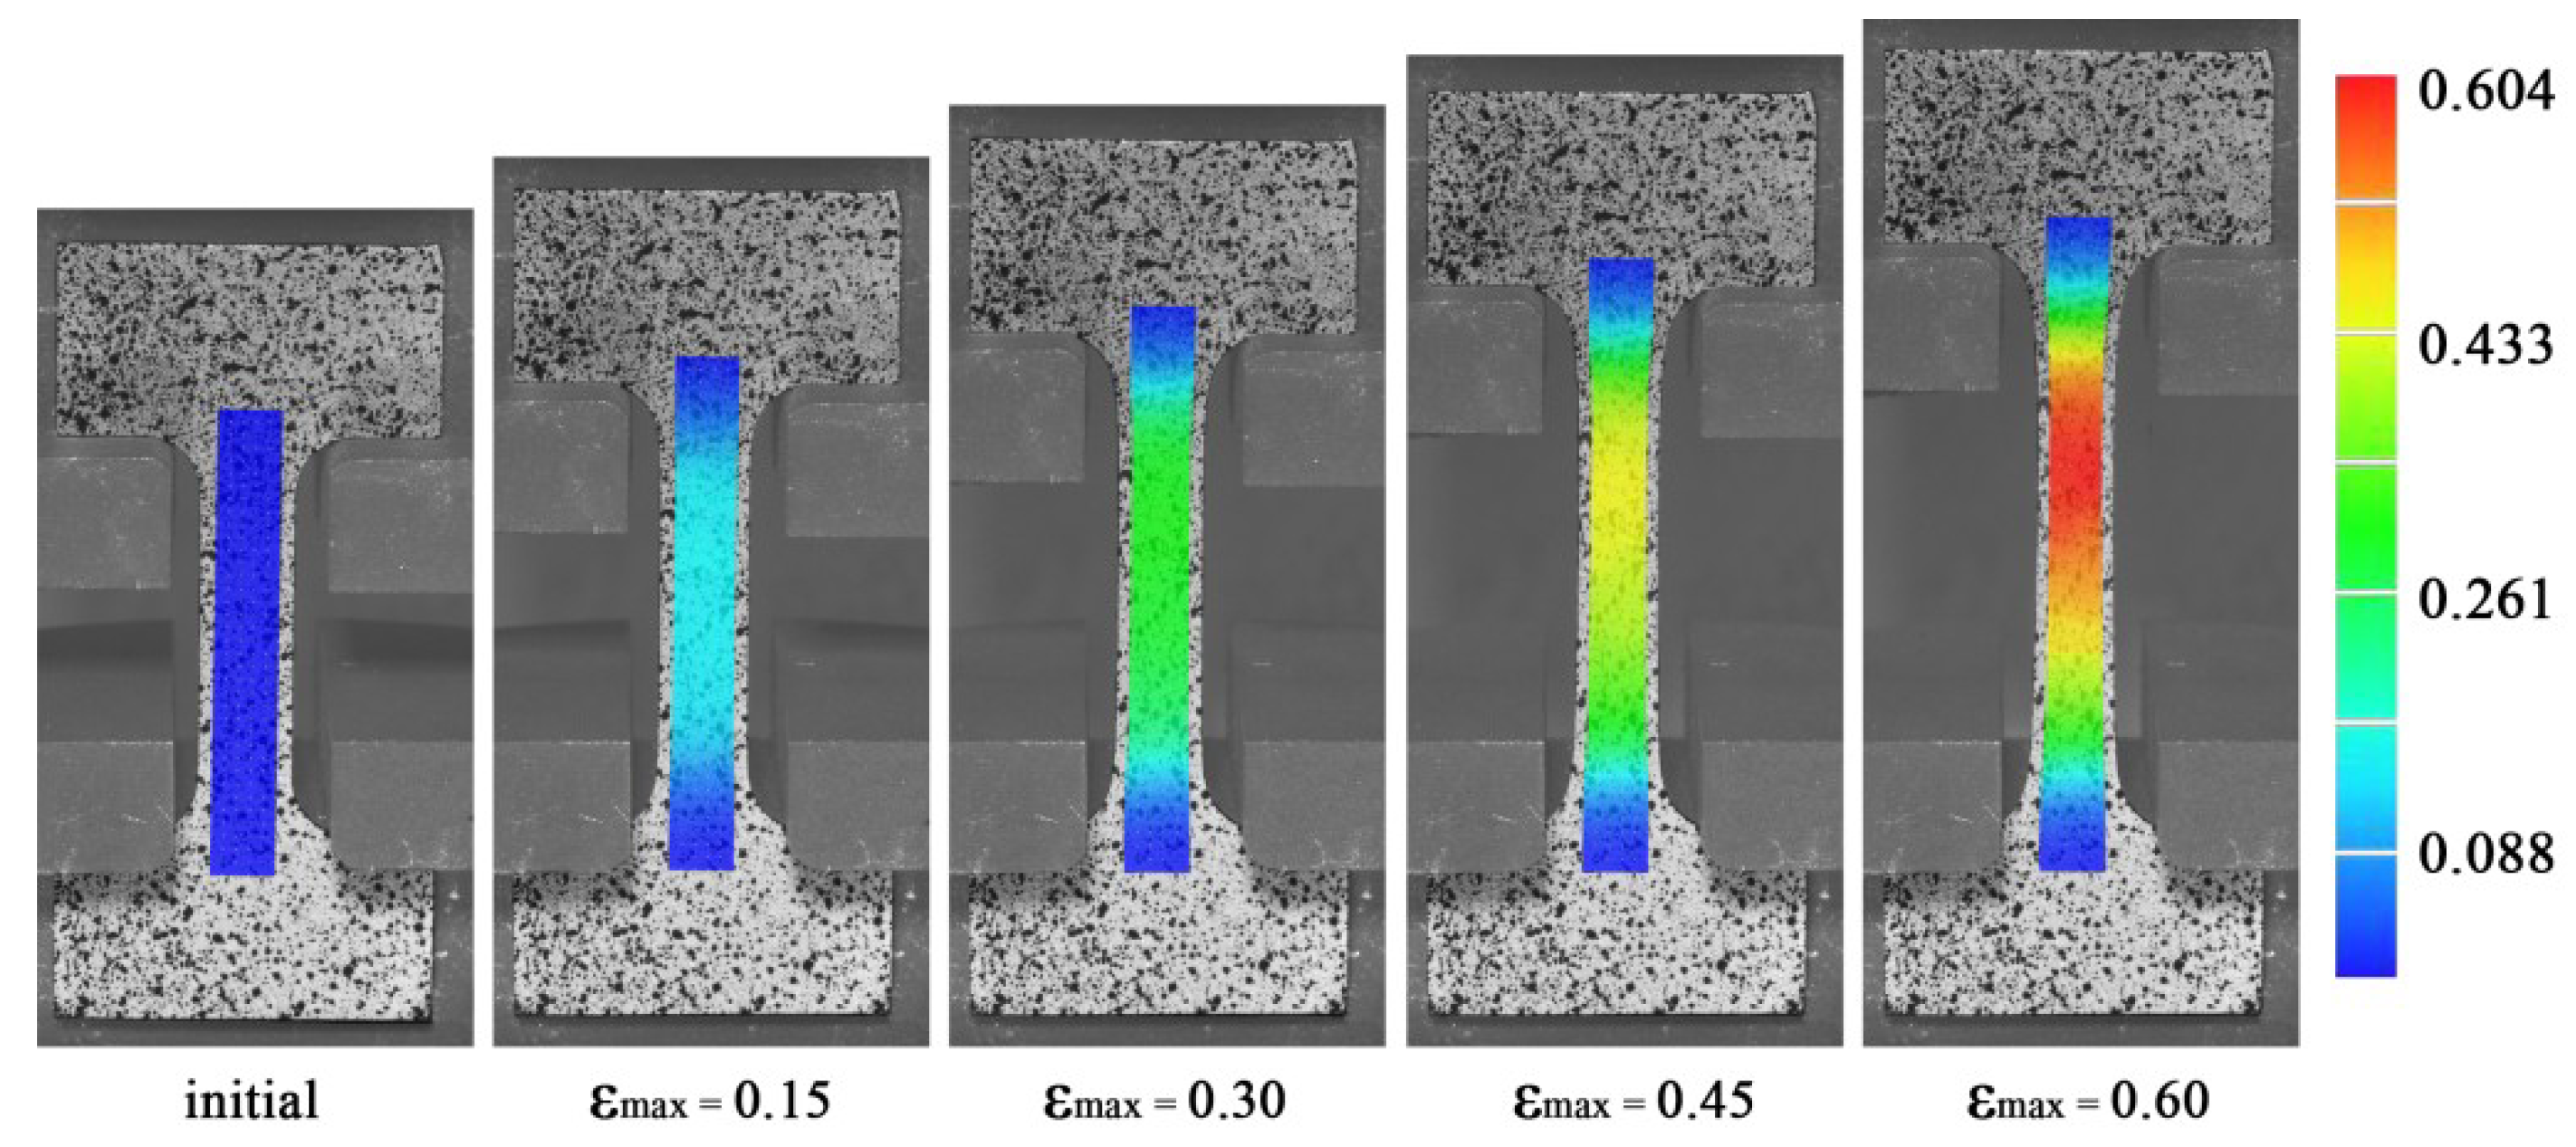
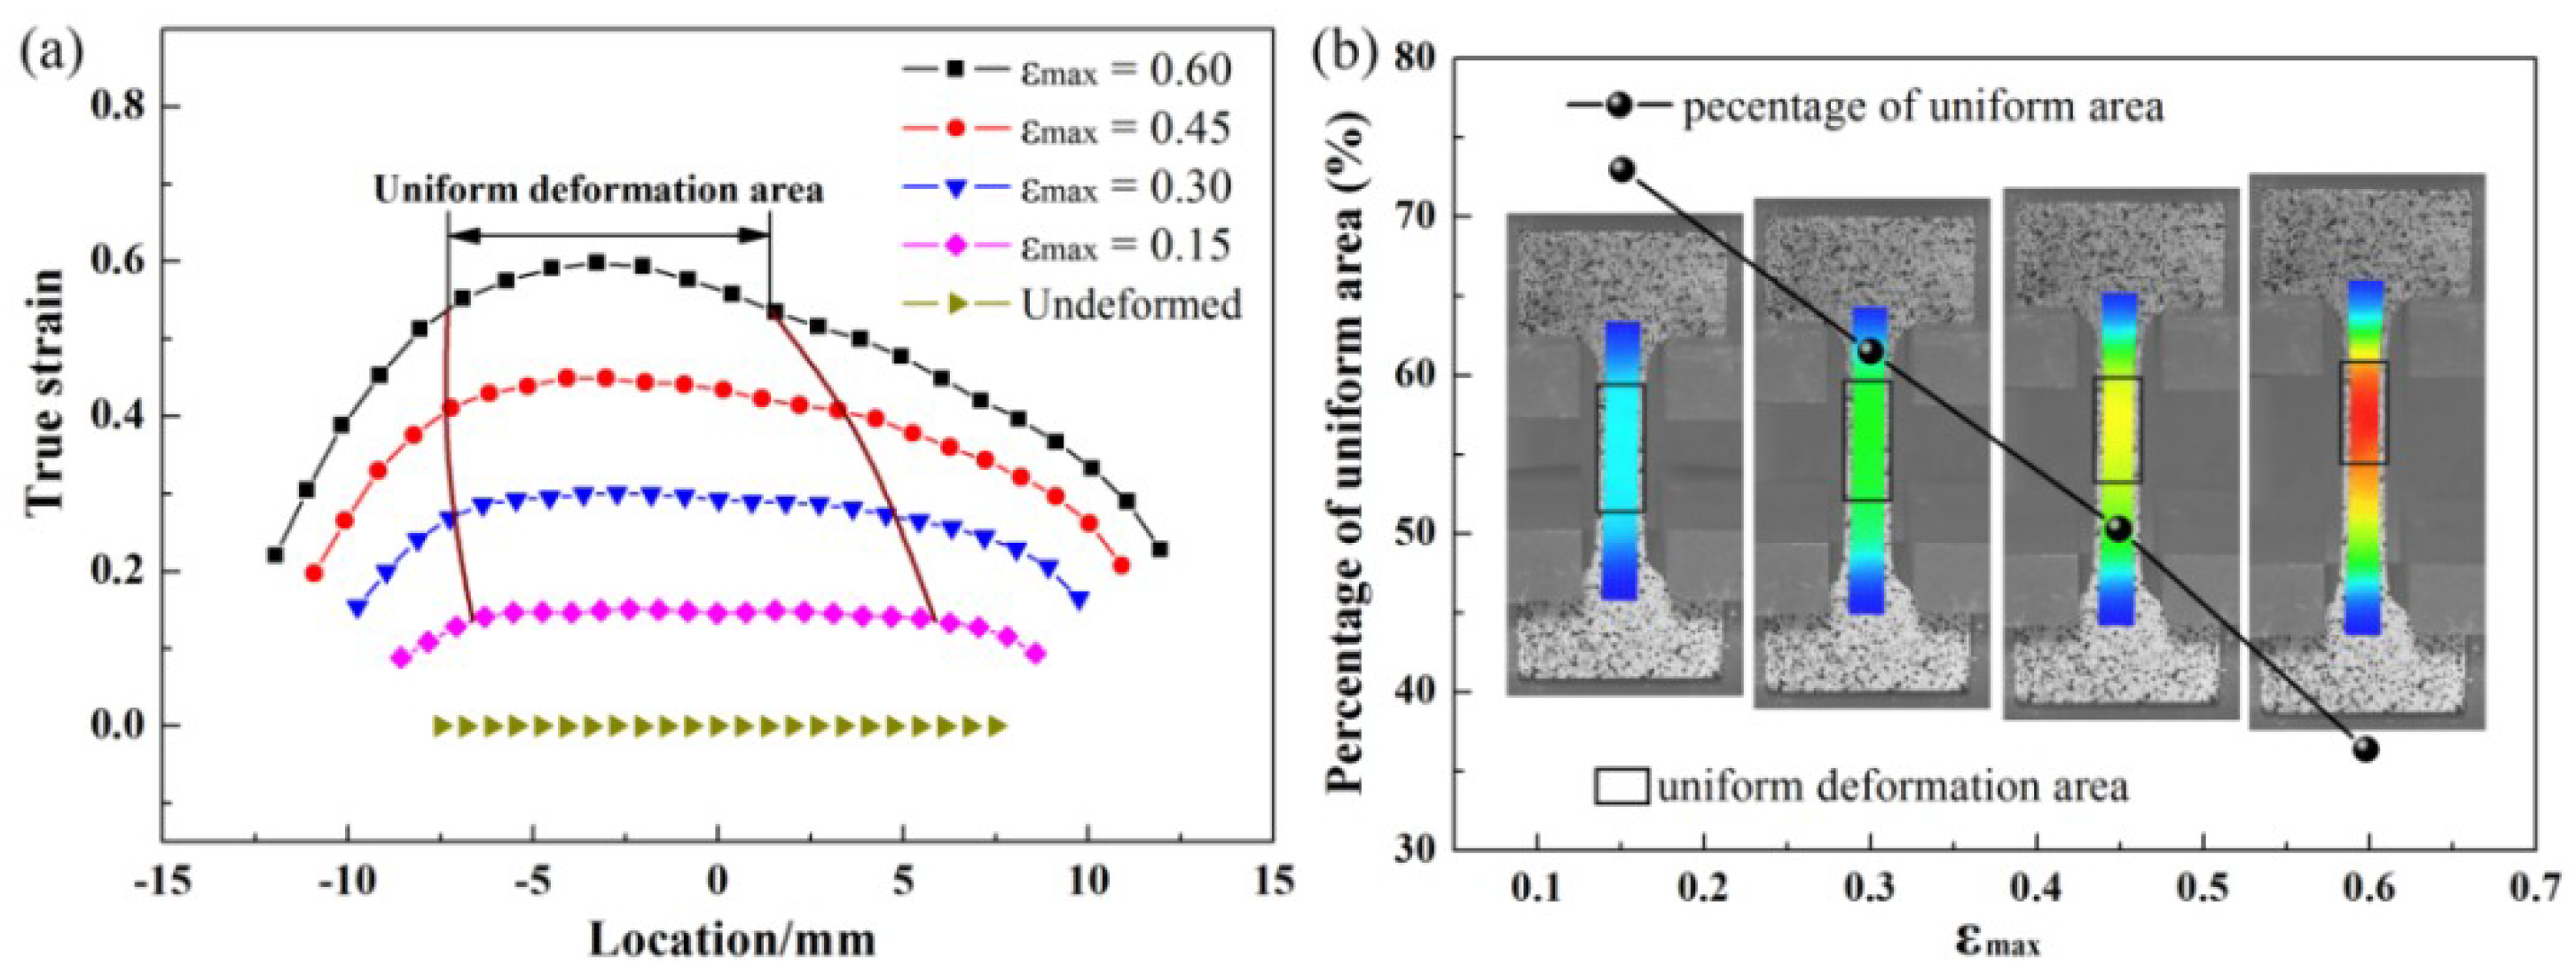
3.1.1. Strain Distribution

In order to analyze the strain distribution, an area covering the reduced section, corner area, and part of clamping area on the specimen was selected. Figure 2 shows the axial strain distribution of specimens tested at 400 °C and crosshead speeds of 0.9, 9, and 90 mm/min, respectively. It was found that the strain distributions were similar to each other for different crosshead speeds. All of the specimens exhibited a non-uniform deformation behavior. The strain was found to be concentrated in the middle of the specimen. The strain at the corner area was limited because of the constraint of the holding area.
In order to further study the deformation behavior during hot tensile tests, the evolution of strain distribution of the specimen at a temperature of 400 °C and crosshead speed of 90 mm/min was investigated. Figure 3 illustrates the strain maps during different deformation stages, i.e., the initial stage, εmax = 0.15, 0.30, 0.45, and 0.60, respectively. It can be seen that, as the displacement of the clamp increased, the strain in the reduced section of the specimen increased. The specimen deformed almost uniformly within the reduced section of the specimen before the maximum strain reached to 0.3. After that, the strain distribution became more and more inhomogeneous with the deformation increase. Localized strain distribution was clearly observed in the middle area when the maximum strain increased to 0.6. The strain distribution could not be analyzed accurately when the strain was greater than 0.6, because the speckle on the specimen failed to be recognized at larger deformation conditions. The preparation of speckles on the specimen needs to be further improved to obtain the strain distribution for a larger deformation.
To quantify the non-uniform strain distribution during hot tensile tests, the strain value was measured in the reduced section of the specimen, as shown in Figure 4a. It was found that the strain distribution of the reduced section changed gradually, from uniform at the beginning to non-uniform at the end. The difference between the maximum and the minimum strain on the reduced section for different stages increased from 0.061 to 0.38. This indicated that the degree of deformation uniformity decreased with the strain increase. The uniform deformation area was defined for the region with strain ranging from 0.9εmax to εmax. The percentage of uniform deformation area was calculated by dividing the length of the uniform deformation area by the instant length of the reduced section, as given in Figure 4b. The percentage of uniform deformation area was 73.0% when εmax was 0.15. It decreased to 36.4% when εmax increased to 0.6. The percentage of uniform deformation area had a linear regression with εmax, which indicated that the inhomogeneity of deformation increased with the proceeding of strain.
Due to the non-uniform deformation behavior of the specimen at high temperatures, the strain calculated by the traditional method is a mean value within the gauge, which underestimates the real strain, as mentioned by Yoon et al. [22]. Thus, the stress-strain curves calculated by the traditional method are unreliable.

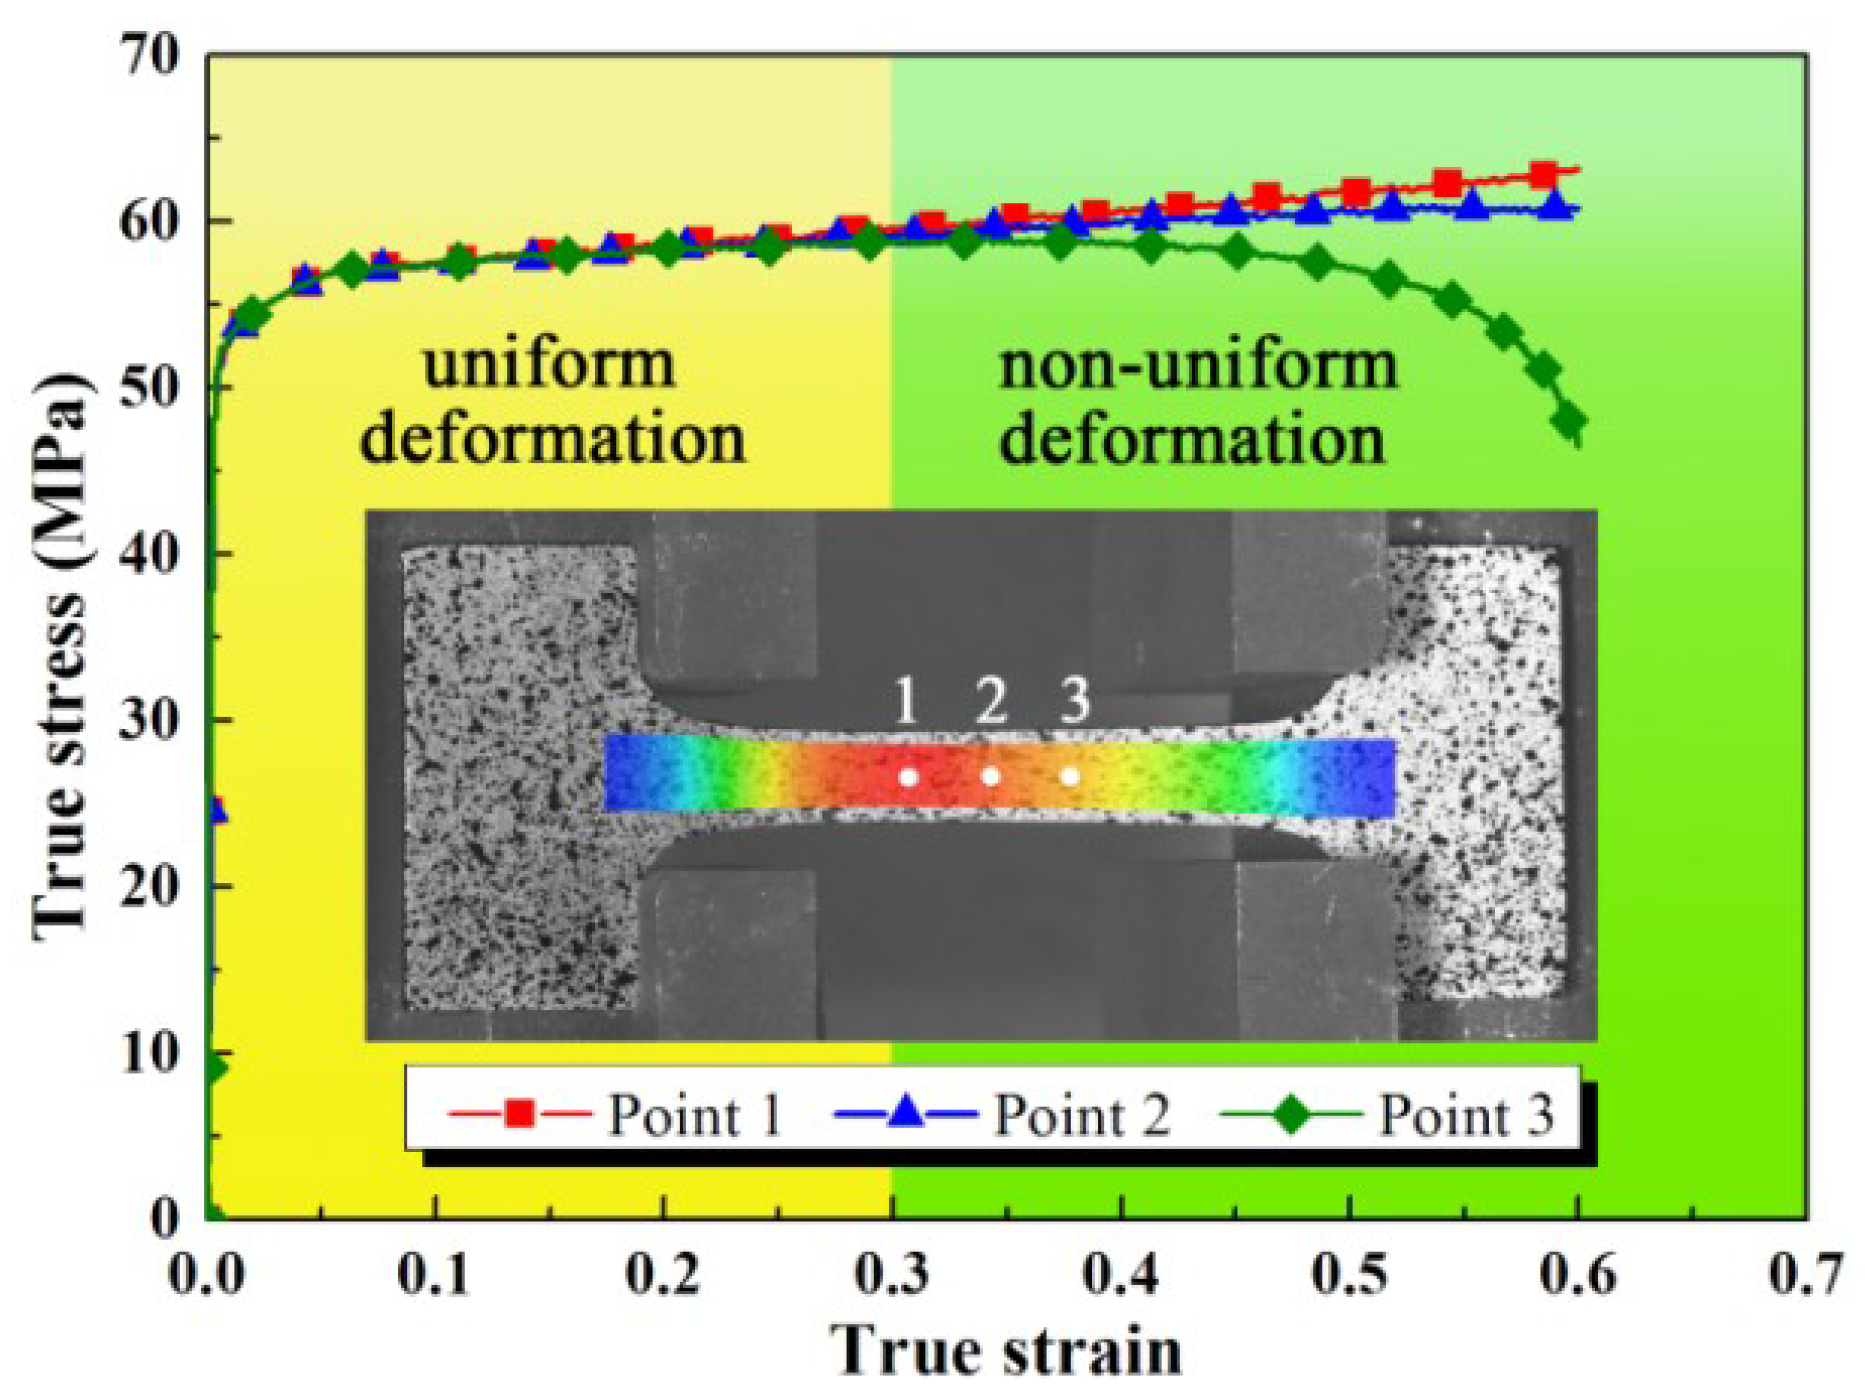
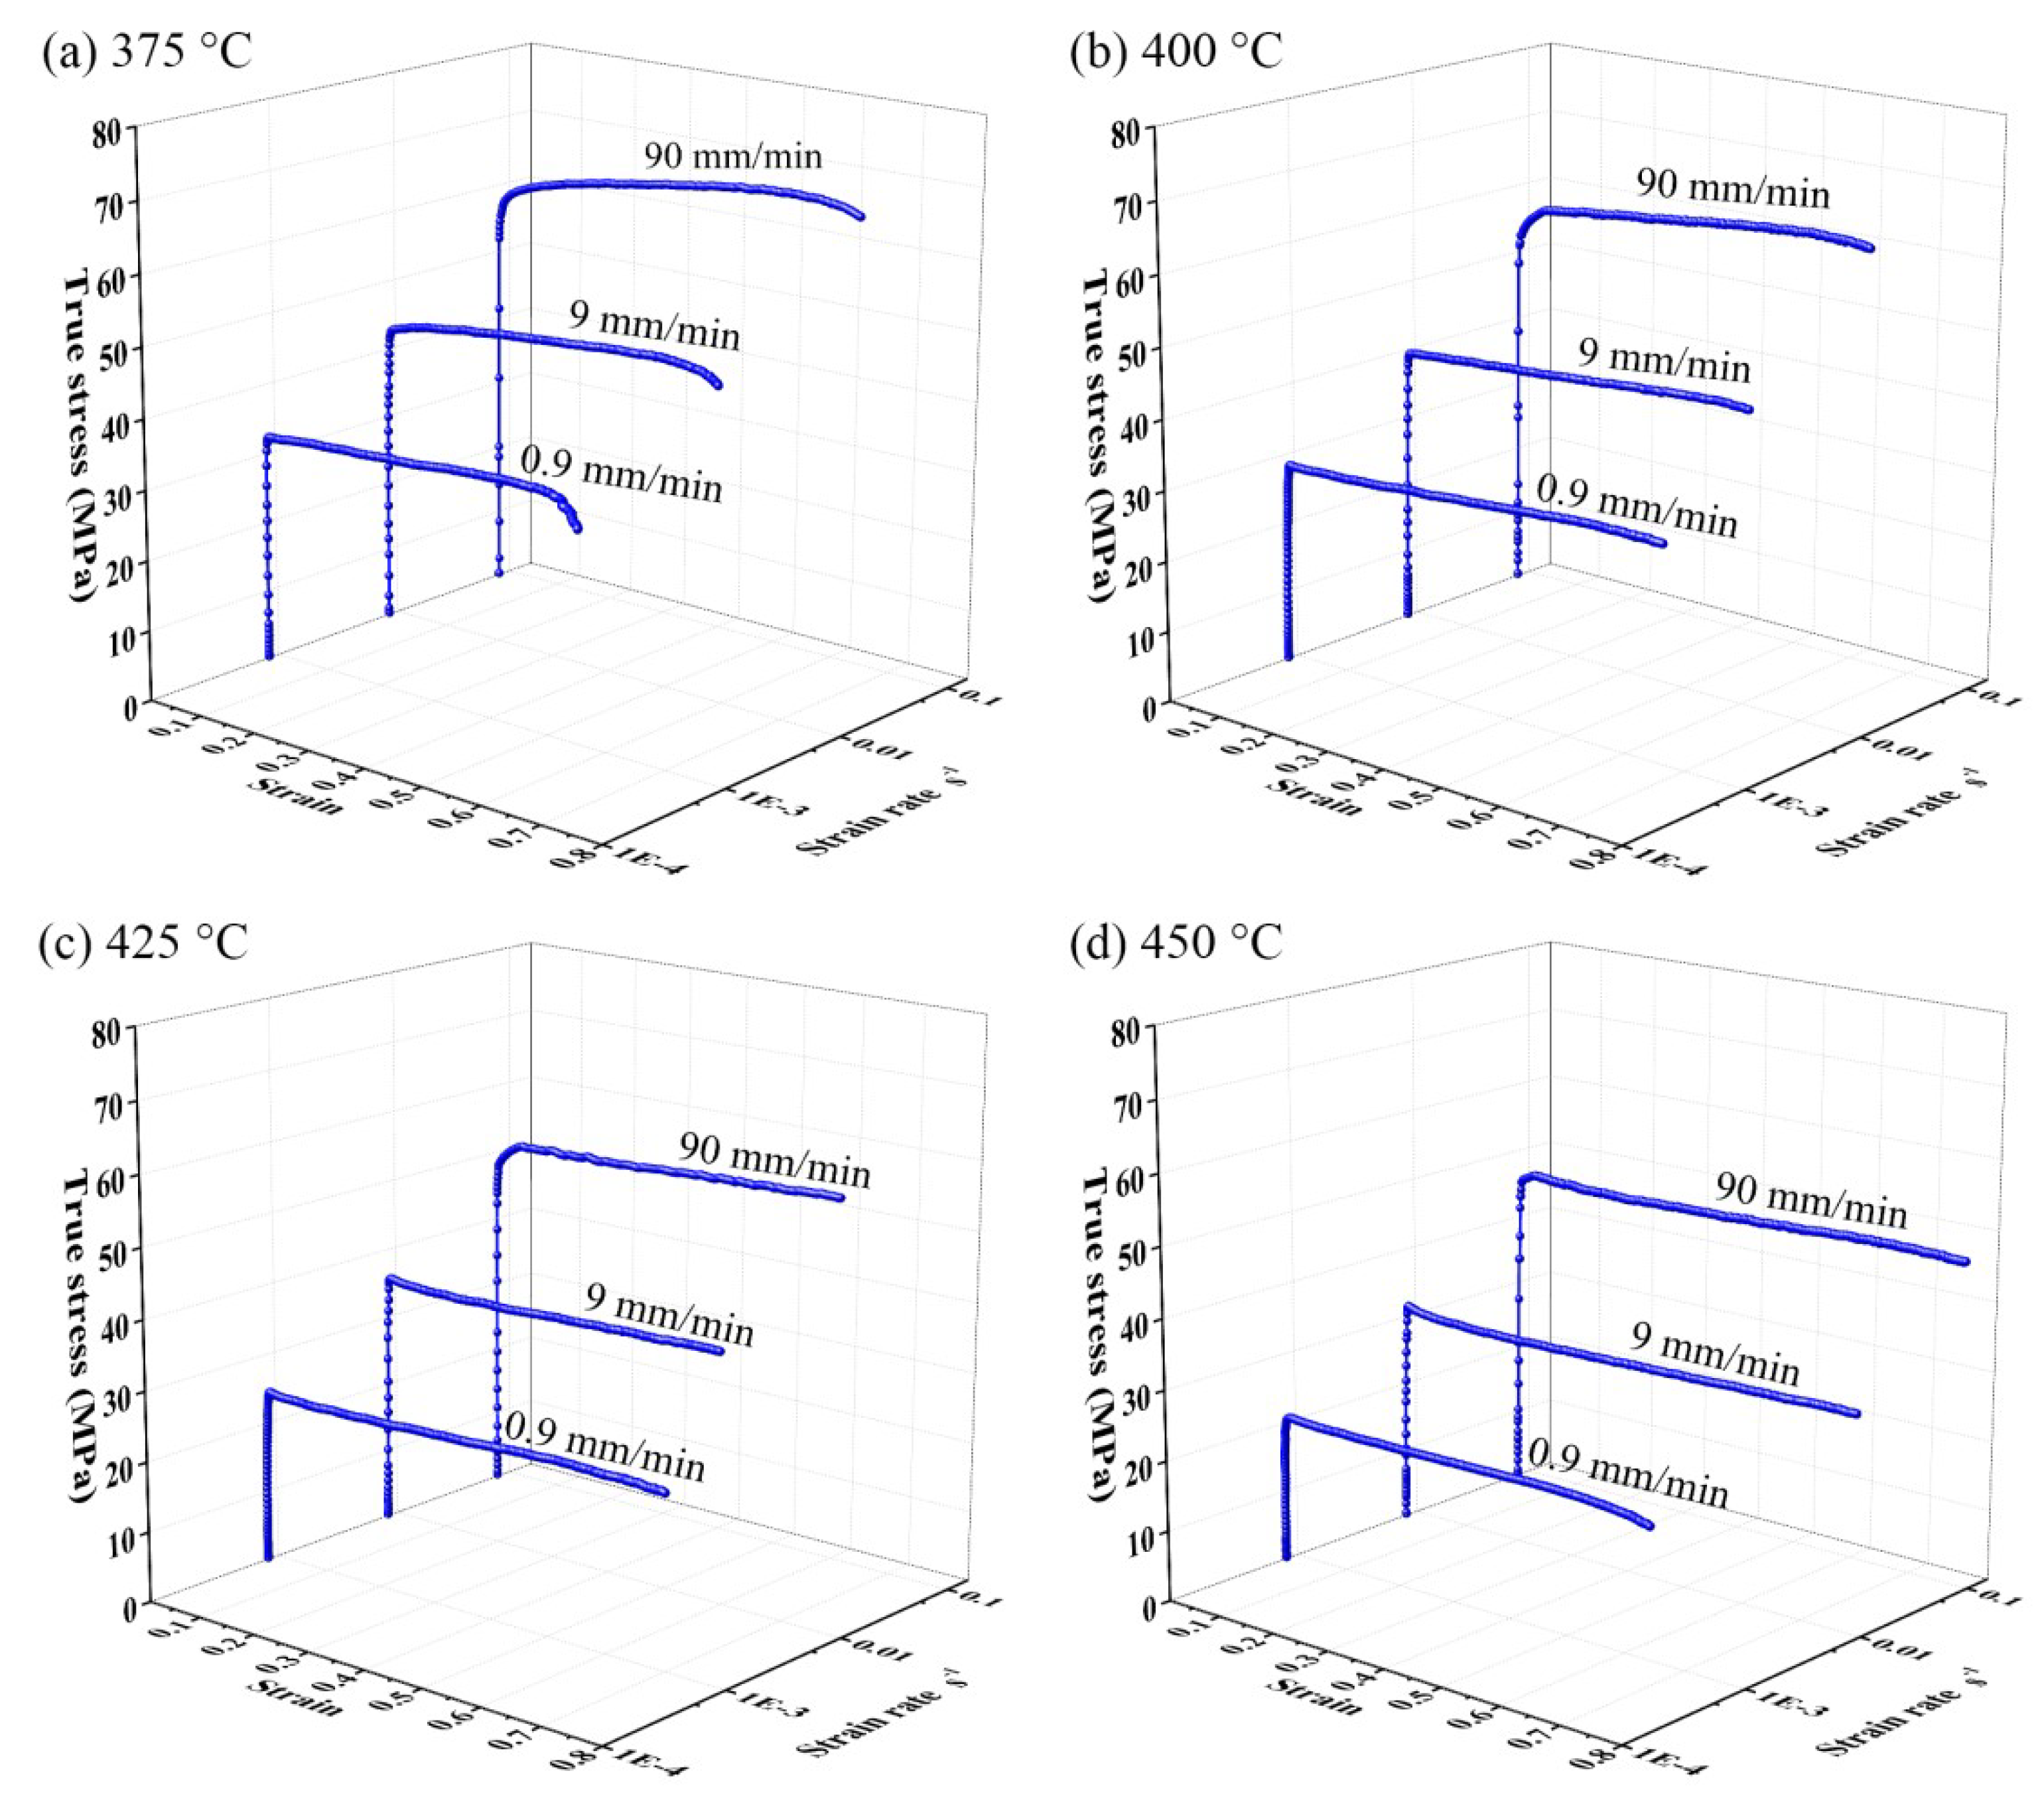
3.1.2. Local Stress-Strain Curves

In order to obtain reliable flow stress curves for hot deformation, the local strain of a local point obtained by the DIC system should be used. In fact, the local point can be regarded as a gauge with a very small length. Thus, the strain distribution becomes completely uniform in the local point. In this way, the influence of non-uniform deformation on the calculation of strain is eliminated. The instant cross section area at a local point, A, is written as
A = A 0 × exp ( ε )
where A0 is the initial cross section area and ε is the instant local true strain at local point measured by the DIC system.
Thus, the local true stress of the local point can be calculated using Equation (2)
σ = F A = F A 0 exp ( ε )
where F is the force.
In order to analyze the influence of non-uniform deformation on the calculation of local flow stress curves, the local flow stress curves at deformation conditions of 400 °C and 90 mm/min crosshead speed were studied. Three different local points on the specimen were selected to calculate the local flow stress curves, as shown in Figure 5. The three local points, named Point 1, 2, and 3, were marked at an interval of 2 mm, among which Point 1 was located at the maximum strain point on the specimen. The local true strain for each point was acquired by the DIC system. The local true stress was calculated using Equation (2).
The local flow stress curves calculated from three local points coincided with each other at the initial stage. However, the flow stress curves for different points varied when the strain was greater than 0.3. The flow stress for Point 1 was the highest among the three points. It increased with the strain increase, exhibiting a hardening phenomenon. The flow stress for Point 2 kept steady as the strain increased. The flow stress for Point 3 was the lowest. It decreased significantly with the increasing of strain. The flow stresses were 63.1, 60.8, and 46.4 MPa, respectively, for each point when the strain reached 0.6. The local flow stress of Point 1 was 36% larger than that of Point 3. Although the flow stresses differed at different points, they revealed the real flow stresses at different locations exactly. The differences of the flow stresses between the points were caused by the non-uniform deformation.

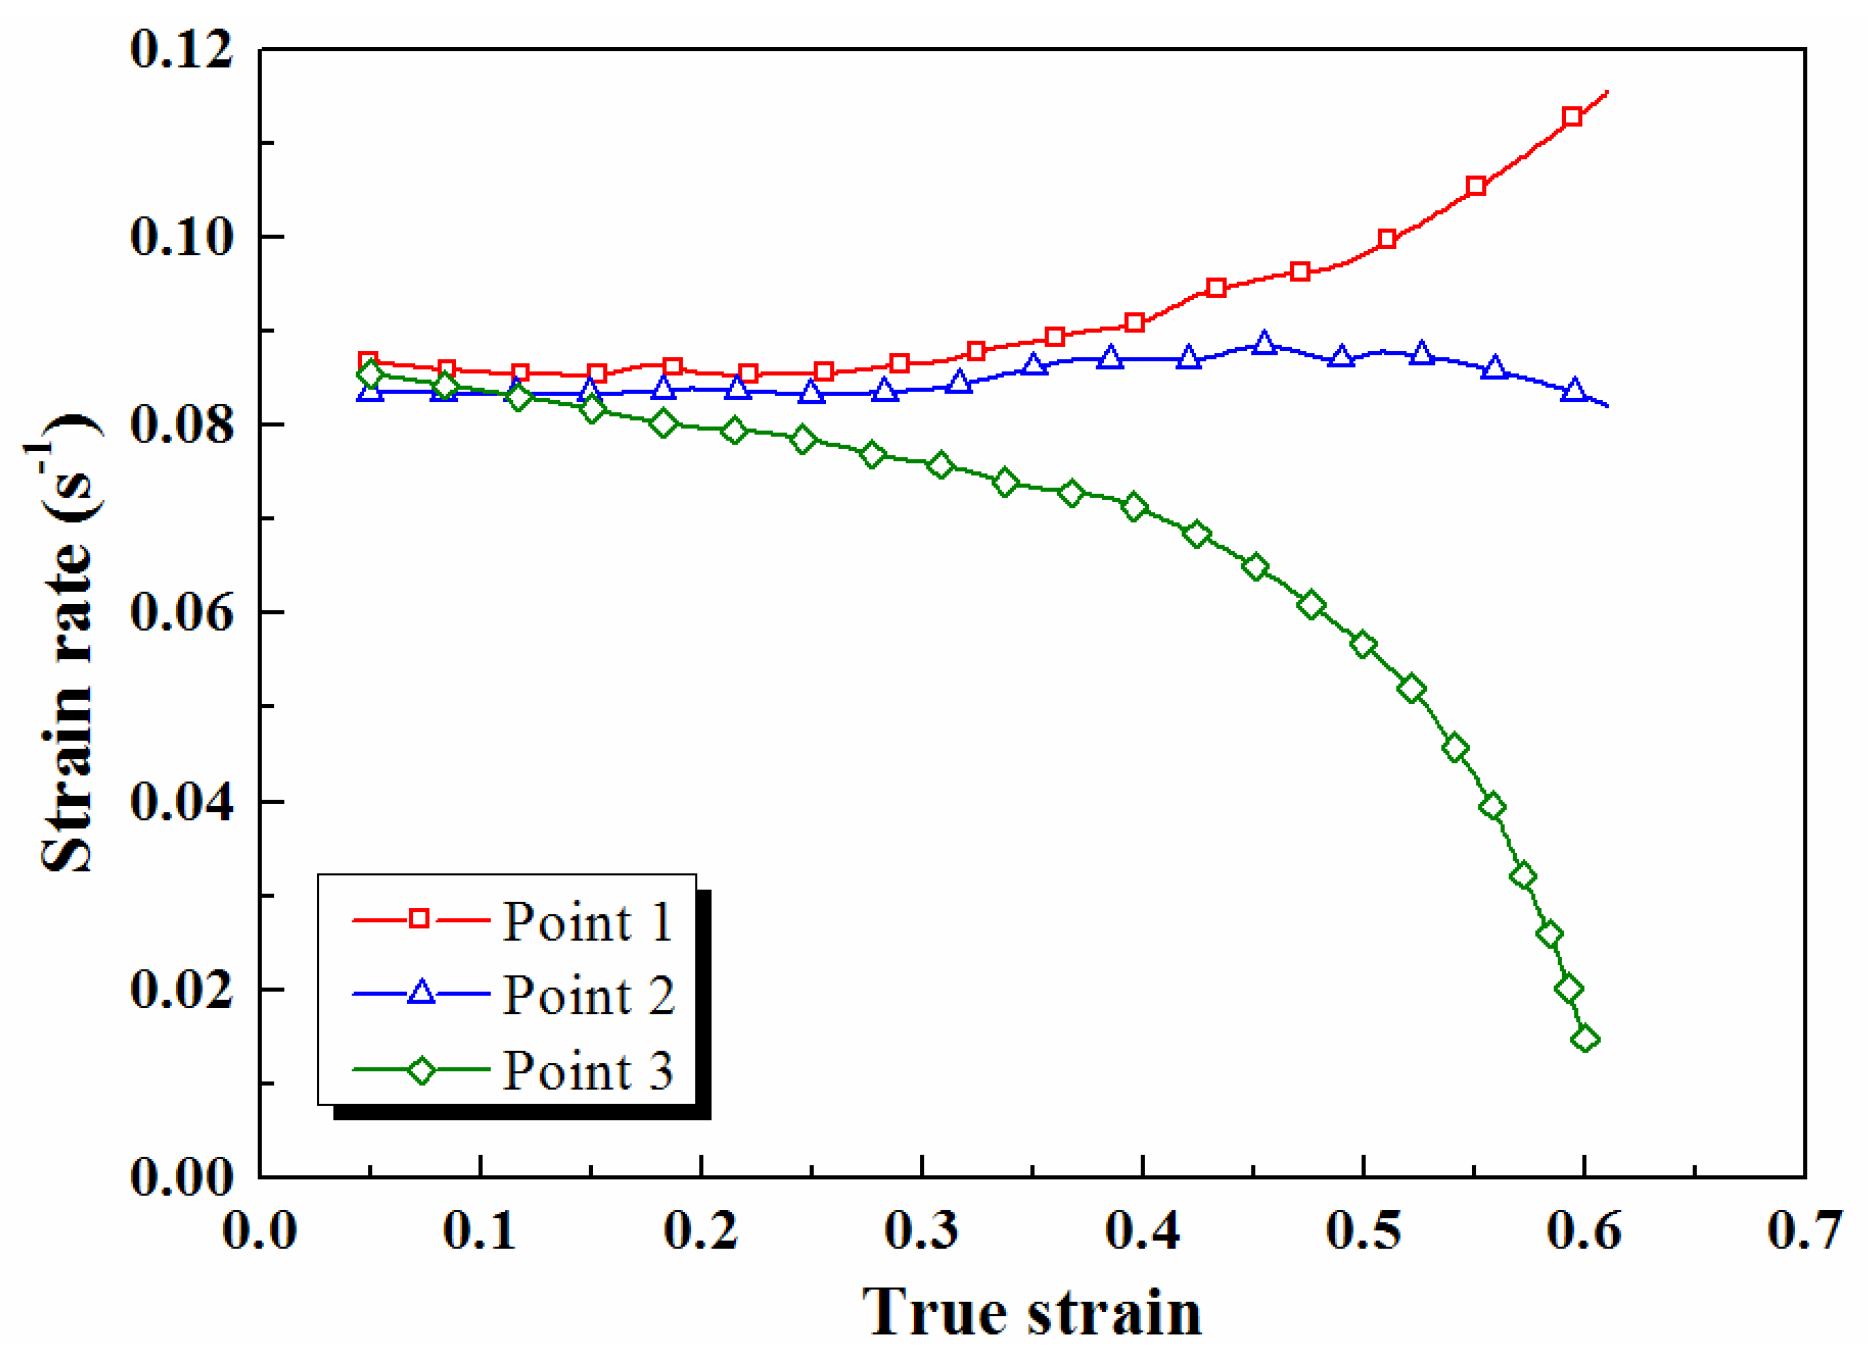
3.1.3. Strain Rate Evolution

To study the hardening and softening phenomena for the flow stress curves calculated with different local points, the instant strain rate during deformation was calculated by taking the derivative of the strain. Figure 6 shows the strain rate evolutions of different local points at the deformation conditions of 400 °C and 90 mm/min crosshead speed. It was found that the strain rates for different local points were nearly the same at the beginning of deformation. However, significant variation of strain rates for different local points could be found as the strain increased. The strain rates of Point 1 increased clearly. The strain rates of Point 2 changed slightly, which can be regarded as a constant. The strain rate of Point 3 decreased clearly as the strain increased. When the strain was 0.6, the corresponding strain rate was 0.113 s−1 for Point 1 while it was 0.015 s−1 for Point 3. The great difference of the strain rate at different points was the result of the strong inhomogeneous deformation on the specimen. The decrease of strain rate of Point 3 indicated that deformation did not occur at this point, as localized deformation concentrated at Point 1.
As is known, the strain rate plays an important role in the flow behavior of metals at high temperatures. Combining Figure 5 and Figure 6, it can be seen that the changing tendencies of the flow stresses were similar to the variations of strain rates. The flow stress exhibited a hardening behavior at Point 1, resulting from the increasing strain rate. The flow stress kept in a steady state when the strain rate was almost a constant at Point 2. The flow stress exhibited an obvious softening behavior due to the decreasing of strain rate at Point 3.

3.2. Improved Fields-Backofen Constitutive Model

3.2.1. Improved FB Model with Varied Strain Rates and its Determination

In hot forming processes, the hardening behavior is mainly influenced by the two parameters of strain hardening exponent n, and the strain rate sensitivity exponent m. As mentioned above, the Fields–Backofen (FB) model is one of the most widely used phenomenological constitutive models to describe the stress-strain relationships at elevated temperatures, which is written as
σ = K ε n ε ˙ m
where K is the strength coefficient.
In this model, the values of n and m are constants at a certain temperature and the strain rate is always substituted with fixed values, such as 0.001, 0.01, and 0.1 s−1. Thus, the original FB model is a monotonic increasing function, by which the softening behavior cannot be described.
As mentioned in Section 3.1.3, the strain rates changed in different manners with the increasing of strain for different local points on the specimen. Thus, varied strain rates, rather than fixed strain rates, should be used to determine flow stress in order to improve the accuracy of Equation (3). The instant strain rate can be written as a function of the strain:
ε ˙ = ε ˙ ( ε )
Thus, Equation (3) is modified as
σ = K ε n ε ˙ m ( ε )
If the strain rate decreases during the deformation, the flow stress determined by Equation (5) also decreases, which enables the softening behavior to be described.
Considering the influence of temperature on the flow behavior of the hot forming process, Equation (5) can be written as
σ = K ( T ) ε n ( T ) ε ˙ ( ε ) m ( T )
In this way, the original FB model is improved by introducing the term of varied strain rate, ε ˙ ( ε ) , and the improved FB model maintains the simple form. The original FB model can be regarded as a particular case of the improved FB model when the strain rate of deformation is a constant.
In order to determine the material parameters of K, n, and m, the logarithm of both sides of Equation (5) are taken, resulting in the following equation:
ln σ = ln K + n ln ε + m ln ε ˙ ( ε )
It can be seen that the material parameters of K, n, and m are the coefficients of a multivariate linear function. The material parameters could be obtained by means of taking multivariate linear regression with the independent variables ln ε , ln ε ˙ ( ε ) , and the dependent variable ln σ .
In order to describe the flow behavior in a wide range of strain rates and temperatures, the flow stress curves for temperatures of 375, 400, 425, and 450 °C and crosshead speeds of 0.9, 9, and 90 mm/min were calculated, respectively. The local point of Point 2, which had an approximately constant strain rate, was selected on each specimen, as mentioned in Section 3.1.2, to calculate the local flow stress curves. Figure 7 illustrates the flow stress curves, as well as the corresponding strain rate evolutions, for each local point. It can be seen that the flow stress increased with the strain rate increase, and it decreased with the temperature increase.
The material parameters were obtained by multivariate linear regression analysis, as shown in Table 2. The relationships of T–K, T–n, and T–m are shown in Figure 8. Obvious linear relationships can be found between the parameters of K and T, n and T, as well as m and T. The K and n decreased with the temperature increase, while the m increased with the temperature increase.
Thus, the flow stress equation can be written by the improved FB model in Equation (8) utilizing the determined relationships in Figure 8,
σ = ( 191.2 0.257 T ) ε ( 0.138 0.000273 T ) ε ˙ ( ε ) ( 0.000541 T 0.0643 )
It can be seen that the flow stress calculated by Equation (8) is a curved surface when the temperature is fixed. The flow stress is a three-dimensional curved surface when the strain rate variation is known.

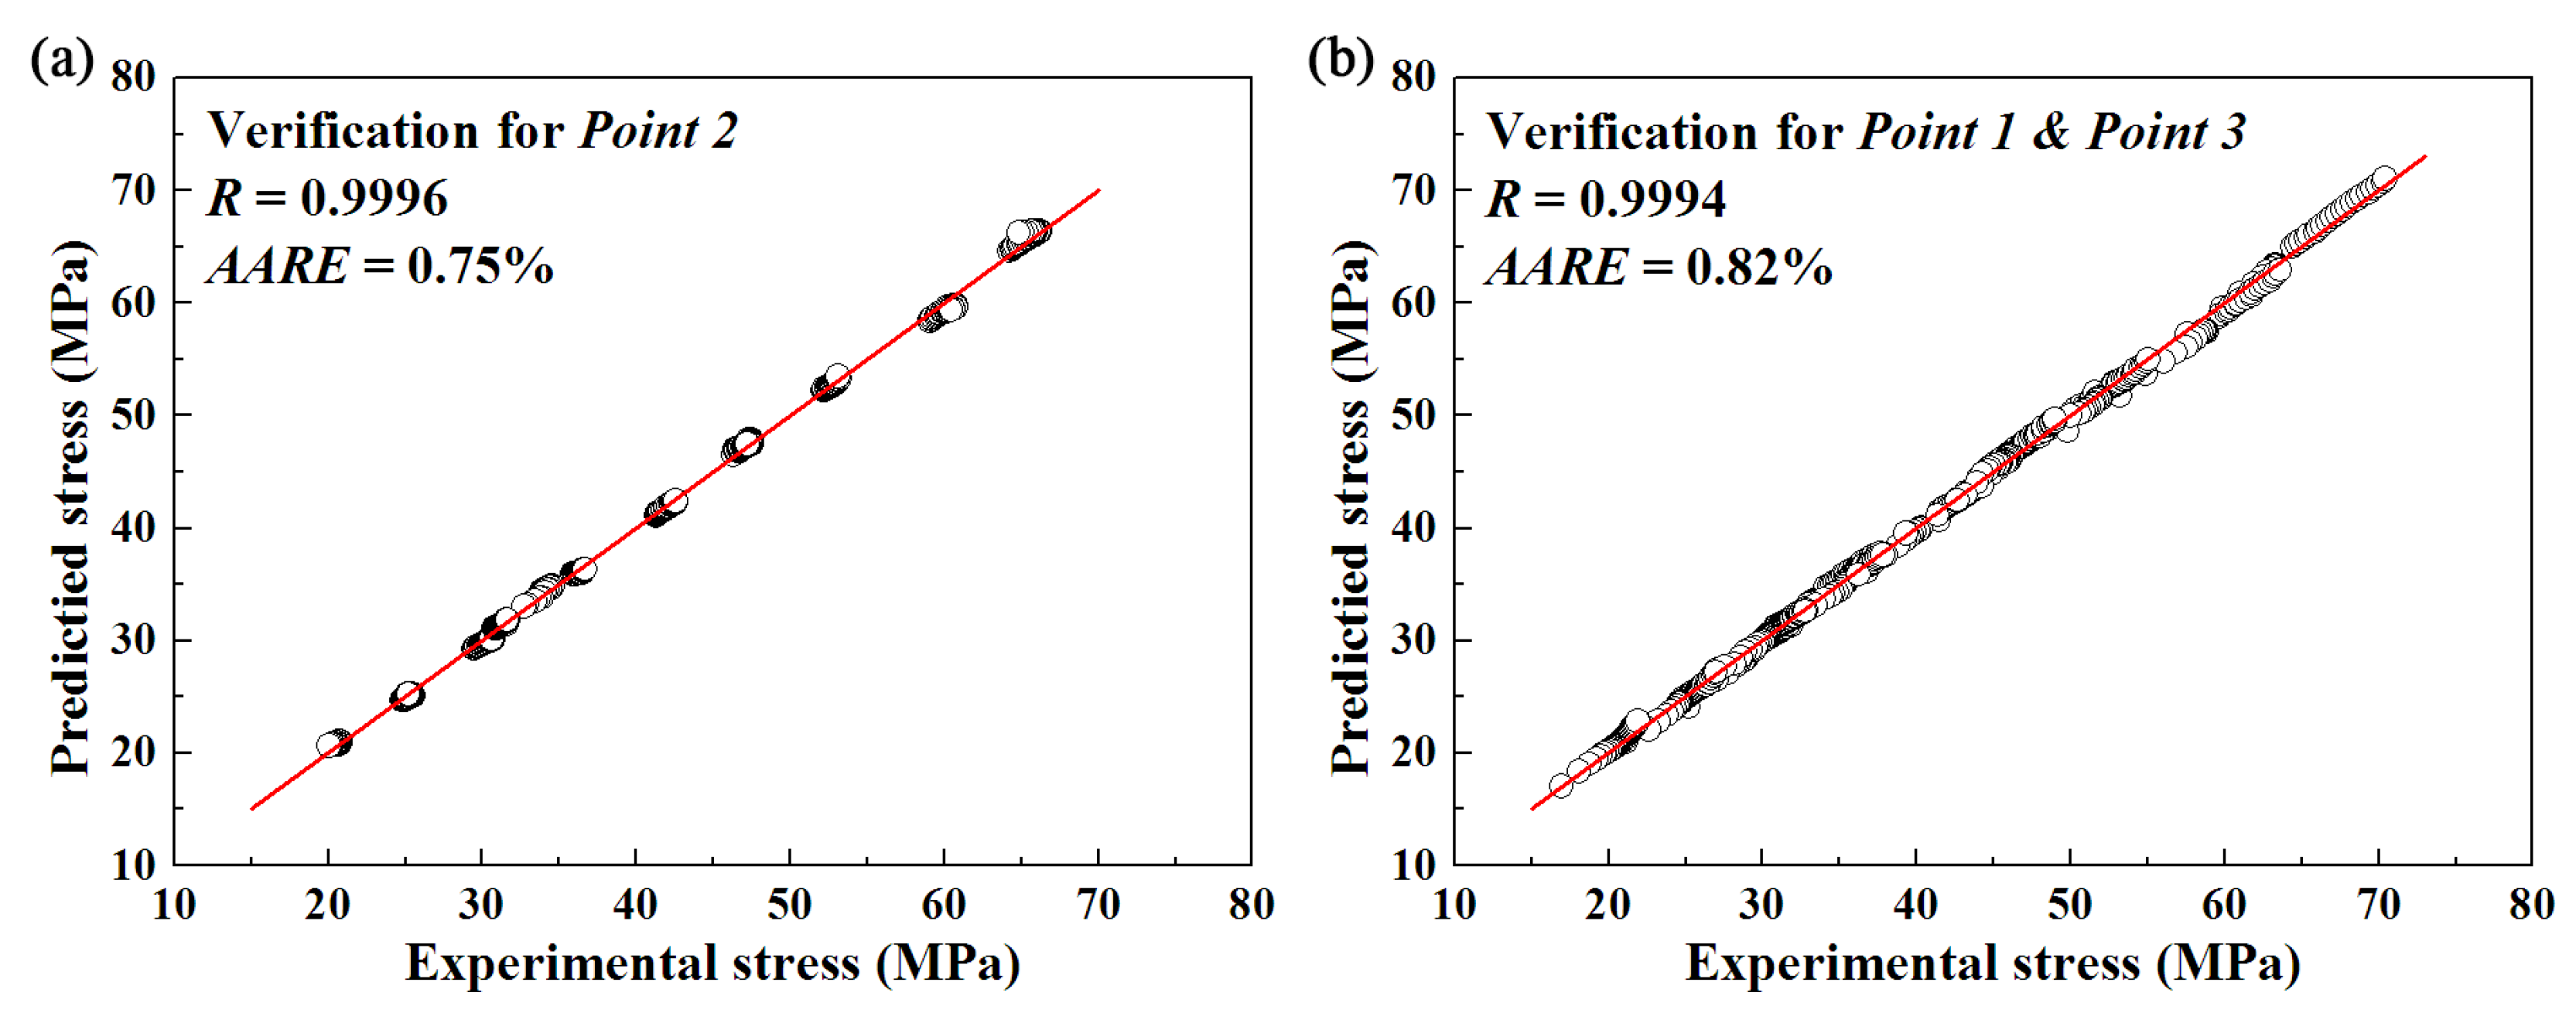
3.2.2. Verification of the Improved FB Models

As analyzed above, the improved constitutive equation of non-uniform deformation behavior was established using an FB model based on both the instant strain and instant strain rate of local points. In order to further evaluate the accuracy of the established model, the flow stresses of Point 1 and Point 3 under each deformation condition were also calculated and compared with predicted flow stresses, as shown in Figure 9.
In Figure 9, the colored surfaces represent the predicted flow stresses at different temperatures determined by Equation (8). The red lines represent the experimental flow stress curves of Point 1, which have a three-dimensional curve shape with increasing strain rate and flow stress. The blue lines represent the experimental flow stress curves of Point 2, which have an approximately two-dimensional curve shape for a constant strain rate. The green lines represent the experimental flow stress curves of Point 3, which have a three-dimensional curve shape with decreasing strain rate and flow stress. It can be seen that the predicted flow stresses agreed well with the experimental flow stresses. The flow stresses could be excellently predicted, not only for the increasing stress at Point 1, but also for the decreasing stress at Point 3 when varied strain rates of each point were substituted into the equation.
In order to evaluate the accuracy of the established model, the parameters of correlation coefficient (R) and average absolute relative error (AARE) were calculated, which can be expressed as
R = i = 1 N ( σ E σ ¯ E ) ( σ P σ ¯ P ) i = 1 N ( σ E σ ¯ E ) 2 i = 1 N ( σ P σ ¯ P ) 2
A A R E ( % ) = 1 N i = 1 N | σ E σ P σ E | × 100 %
where σ E is the experimental flow stress, σ P is the predicted stress, σ ¯ E and σ ¯ P are the mean values of σ E and σ P , and N is the number of data. Since the flow stresses of the three points under each deformation condition are very similar to each other when the strain is less than 0.3, the R and AARE values were calculated using data with strain greater than 0.3.
The prediction accuracy was verified by comparing the predicted and experimental stresses of Point 2, as shown in Figure 10a. The coefficient R was 0.9996 and the AARE value was 0.75%. In order to further verify the prediction accuracy of the improved FB model, the predicted and experimental stresses of Point 1 and Point 3, whose strain rate was continuously changed with the strain increase, are plotted in Figure 10b. It can be seen that the coefficient R was 0.9994 and the AARE value was 0.82%. This indicated that the improved FB model had a high accuracy to predict the flow stresses of the tested aluminum alloy within the temperature range of 375–450 °C and an initial strain rate range of 0.001–0.1 s−1.
According to previous works, the original FB model can only describe the work hardening behavior of metallic materials. However, the predicted stresses agreed well with the experimental stresses, whether the flow stresses increased in Point 1 or decreased in Point 3, when varied strain rates of local points were included in the improved FB model. Therefore, the improved FB model, considering the strain rate evolutions of local points, can describe the flow behavior with strain rate continuously changing during the hot forming process. The improved FB model not only had a higher accuracy, but also maintained a simple form like the original FB model.

4. Conclusions

The deformation behavior of a 2024 aluminum alloy sheet at the temperatures of 375–450 °C and nominal initial strain rates of 0.001–0.1 s−1 was studied by hot tensile tests. The local flow stress curves and the corresponding strain rate evolutions for different local points were analyzed. An improved FB constitutive model in consideration of strain rate evolutions of local points was proposed to describe the flow behavior. The conclusions are as follows:
(1)
The strain distribution during hot tensile tests was non-uniform on the reduced section of the sample. Concentrated strain distribution was observed when the maximum strain on the specimen was greater than 0.3. The percentage of uniform deformation area decreased linearly as the strain increased.
(2)
The local flow stress curves determined by different local points exhibited hardening, steady, and softening behaviors, respectively, resulting from the different strain rate evolutions during the tensile tests. The flow stress exhibited a hardening behavior when the strain rate increased with the proceeding of straining. It kept steady when the strain rate changed slightly. Obvious softening behavior was observed when the strain rate decreased with the increase of strain.
(3)
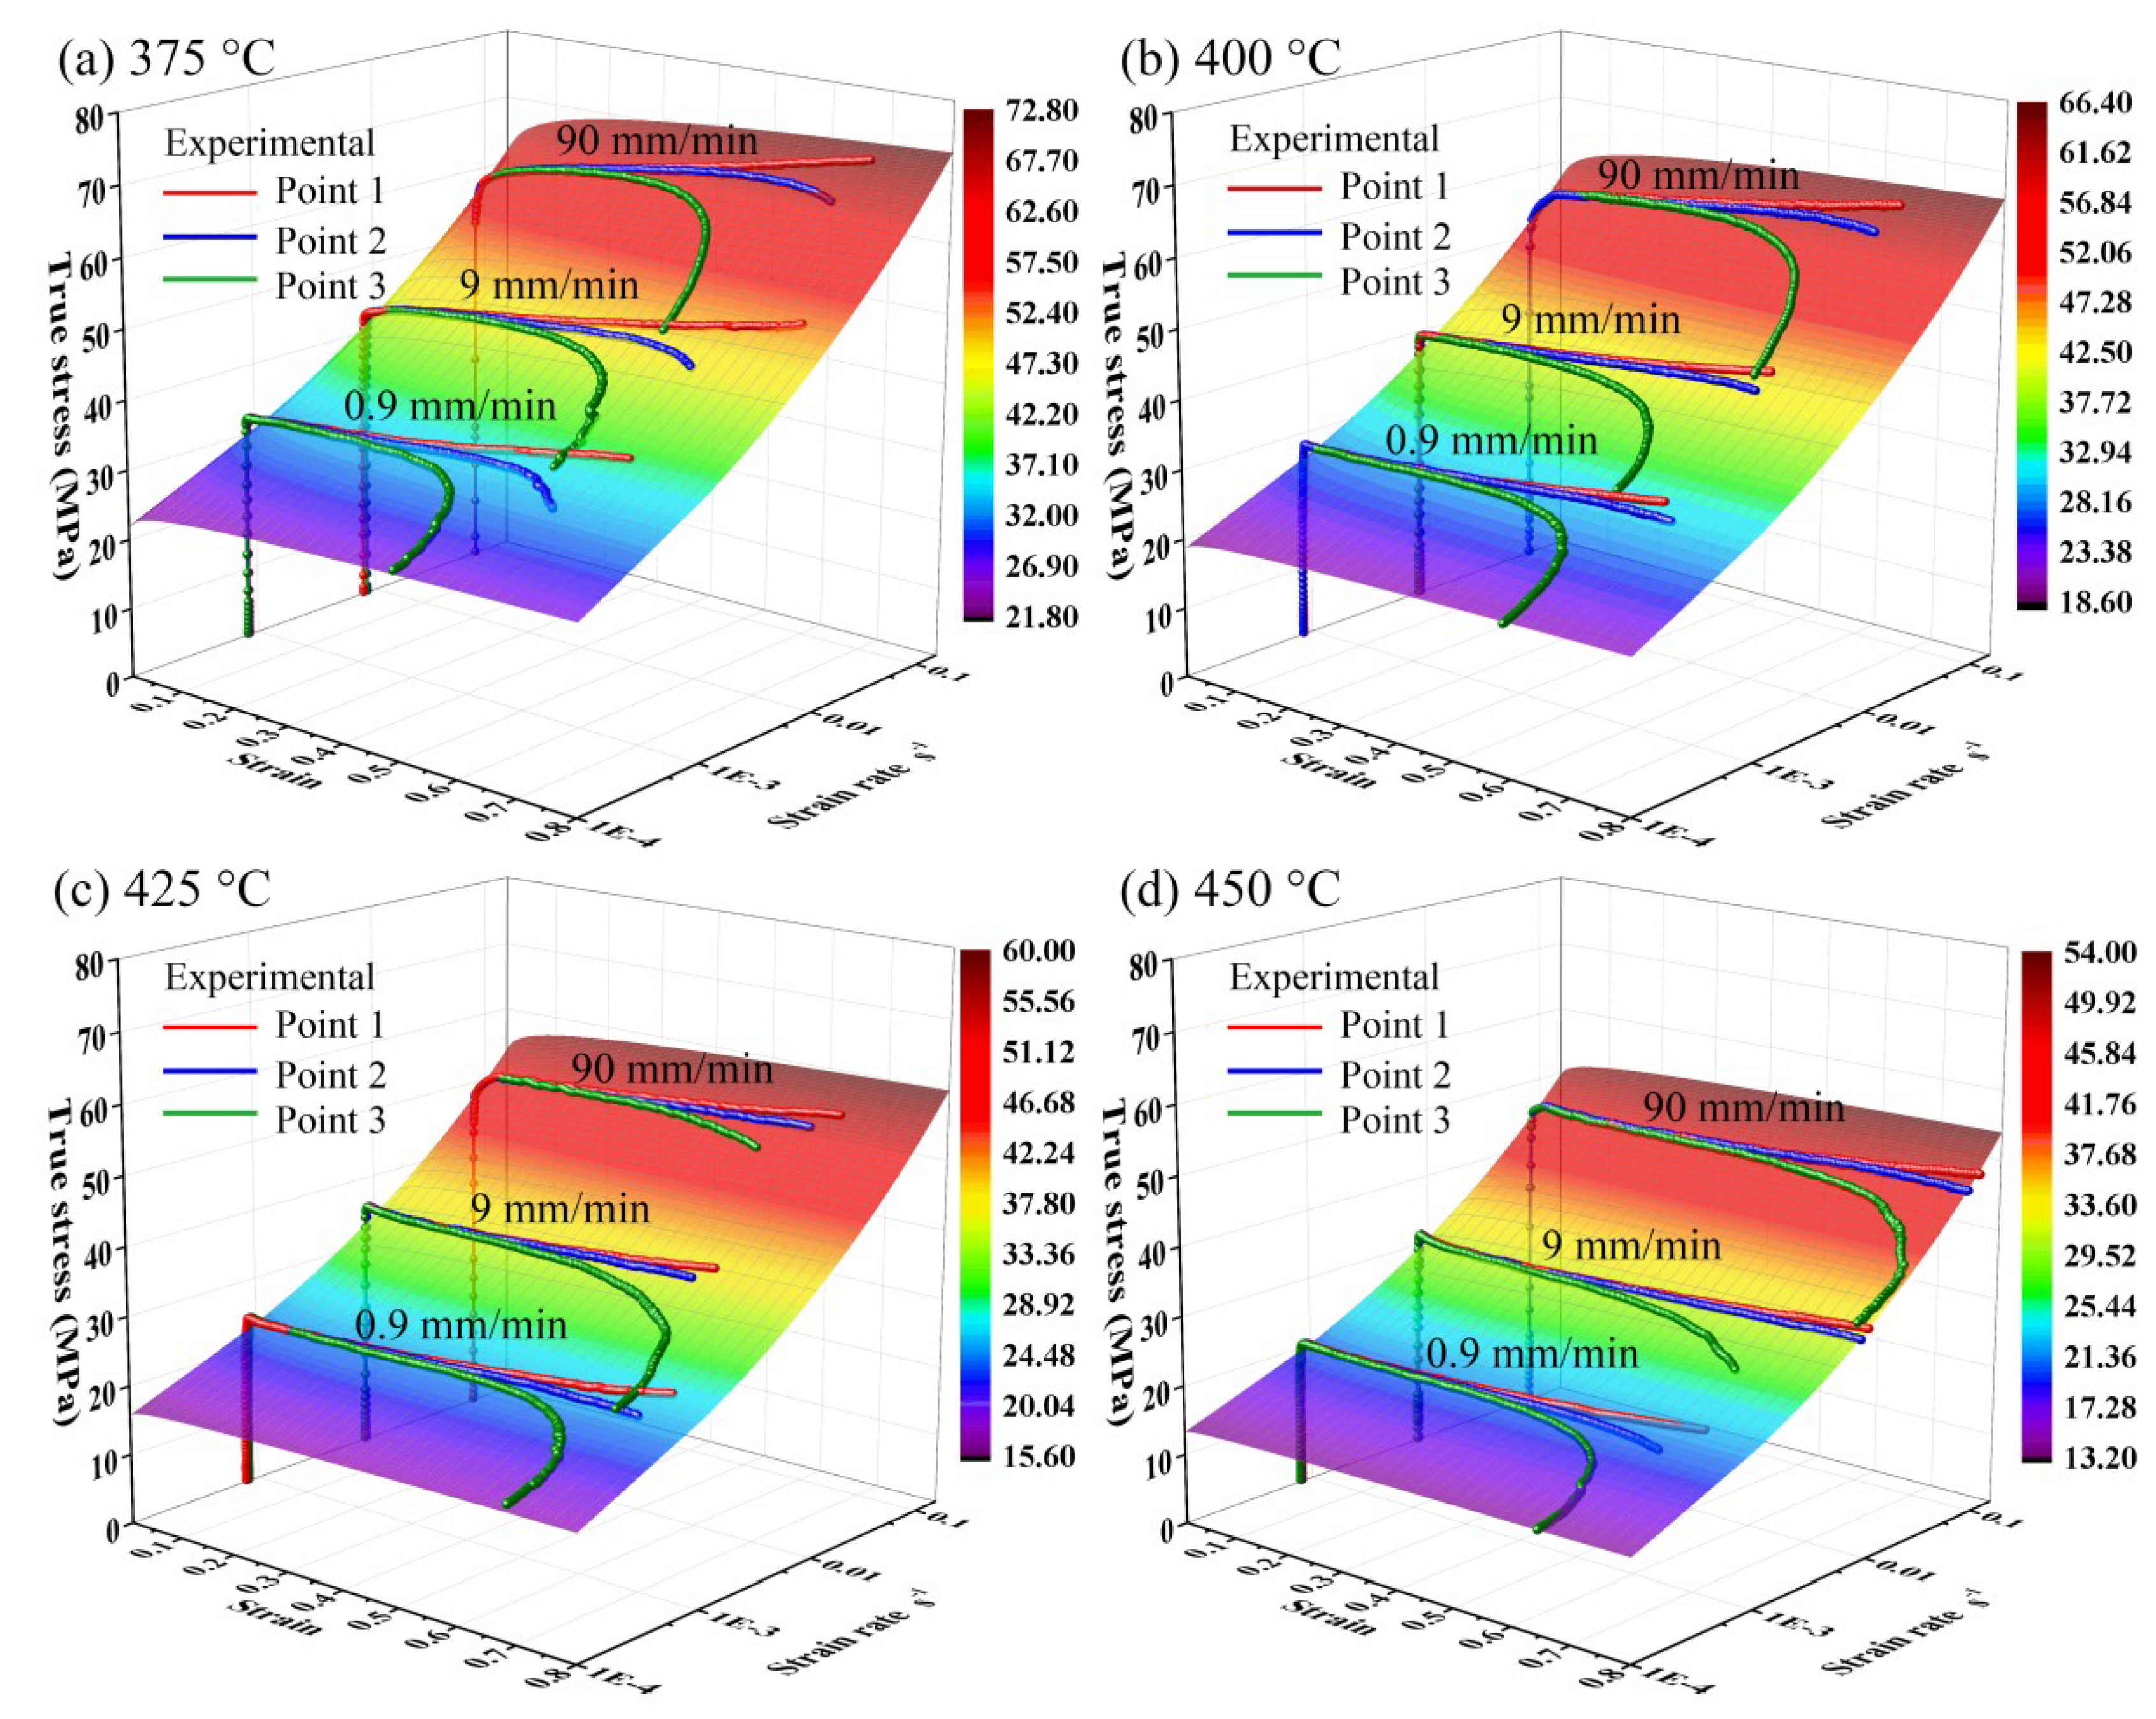
The improved FB constitutive model considering strain rate evolutions of local points showed a good agreement with experimental results. The hardening and softening behavior of the flow stress can be well predicted when varied strain rates of local points were considered in the equation. The improved FB model can describe the deformation behavior for continuously varied strain rate, resulting in an extended application of the model.

Author Contributions

Z.H. conceived the experiments and provided all sorts of support during the work; Z.W. performed the experiment and wrote the paper; Y.L. analyzed the data; X.F. analyzed and discussed the results and supervised the experiments.

Funding

This study was financially supported by National Key R&D Program of China (2017YFB0304400, 2017YFB0306300), the National Natural Science Foundation of China (No. 51575131, 51705102), the Program for Changjiang Scholars and Innovative Research Team in University (No.IRT1229). The authors would like to take this opportunity to express their sincere appreciation for the funds.

Conflicts of Interest

The authors declare no conflict of interest.

References

  1. Hirsch, J. Recent development in aluminium for automotive applications. T. Nonferr. Metal. Soc. 2014, 24, 1995–2002. [Google Scholar] [CrossRef]
  2. Bressan, J.D.; Bruschi, S.; Ghiotti, A. Prediction of limit strains in hot forming of aluminium alloy sheets. Int. J. Mech. Sci. 2016, 115, 702–710. [Google Scholar] [CrossRef]
  3. Abedrabbo, N.; Pourboghrat, F.; Carsley, J. Forming of aluminum alloys at elevated temperatures—Part 1: Material characterization. Int. J. Plast. 2006, 22, 314–341. [Google Scholar] [CrossRef]
  4. Barnes, A.J. Superplastic Forming 40Years and Still Growing. J. Mater. Eng. Perform. 2007, 16, 440–454. [Google Scholar] [CrossRef]
  5. Krajewski, P.E.; Schroth, J.G. Overview of Quick Plastic Forming Technology. Mater. Sci. Forum 2007, 551, 3–12. [Google Scholar] [CrossRef]
  6. Fan, X.; He, Z.; Zheng, K.; Yuan, S. Strengthening behavior of Al–Cu–Mg alloy sheet in hot forming–quenching integrated process with cold–hot dies. Mater. Des. 2015, 83, 557–565. [Google Scholar] [CrossRef]
  7. El Fakir, O.; Wang, L.; Balint, D.; Dear, J.P.; Lin, J.; Dean, T.A. Numerical study of the solution heat treatment, forming, and in-die quenching (HFQ) process on AA5754. Int. J. Mach. Tools Manuf. 2014, 87, 39–48. [Google Scholar] [CrossRef] [Green Version]
  8. Shao, Z.; Li, N.; Lin, J.; Dean, T. Formability evaluation for sheet metals under hot stamping conditions by a novel biaxial testing system and a new materials model. Int. J. Mech. Sci. 2017, 120, 149–158. [Google Scholar] [CrossRef] [Green Version]
  9. Xiao, Z.B.; Huang, Y.C.; Liu, H.; Wang, S.X. Hot Tensile and Fracture Behavior of 35CrMo Steel at Elevated Temperature and Strain Rate. Metals 2016, 6, 210. [Google Scholar] [CrossRef]
  10. Lin, Y.C.; Chen, X.M. A critical review of experimental results and constitutive descriptions for metals and alloys in hot working. Mater. Des. 2011, 32, 1733–1759. [Google Scholar] [CrossRef]
  11. Wang, S.X.; Huang, Y.C.; Xiao, Z.B.; Liu, Y.; Liu, H. A Modified Johnson-Cook Model for Hot Deformation Behavior of 35CrMo Steel. Metals 2017, 7, 337. [Google Scholar] [CrossRef]
  12. Chen, L.; Zhao, G.; Yu, J. Hot deformation behavior and constitutive modeling of homogenized 6026 aluminum alloy. Mater. Des. 2015, 74, 25–35. [Google Scholar] [CrossRef]
  13. Sun, Y.; Ye, W.H.; Hu, L.X. Constitutive Modeling of High-Temperature Flow Behavior of Al-0.62Mg-0.73Si Aluminum Alloy. J. Mater. Eng. Perform. 2016, 25, 1621–1630. [Google Scholar] [CrossRef]
  14. Jia, W.; Xu, S.; Le, Q.; Fu, L.; Ma, L.; Tang, Y. Modified Fields–Backofen model for constitutive behavior of as-cast AZ31B magnesium alloy during hot deformation. Mater. Des. 2016, 106, 120–132. [Google Scholar] [CrossRef]
  15. Chen, W.; Guan, Y.; Wang, Z. Modeling of Flow Stress of High Titanium Content 6061 Aluminum Alloy Under Hot Compression. J. Mater. Eng. Perform. 2016, 25, 4081–4088. [Google Scholar] [CrossRef]
  16. Zhang, X.H. Experimental and Numerical Study of Magnesium Alloy during Hotworking Process. Ph.D. Thesis, Shanghai Jiaotong University, Shanghai, China, 1 June 2003. [Google Scholar]
  17. Lin, Y.; Zhang, K.; He, Z.; Fan, X.; Yan, Y.; Yuan, S. Constitutive Modeling of the High-Temperature Flow Behavior of α-Ti Alloy Tube. J. Mater. Eng. Perform. 2018, 27, 2475–2483. [Google Scholar] [CrossRef]
  18. Hu, W.; Lin, Y.; Yuan, S.; He, Z. Constitutive models for regression of various experimental stress–strain relations. Int. J. Mech. Sci. 2015, 101, 1–9. [Google Scholar] [CrossRef]
  19. Belhabib, S.; Haddadi, H.; Gaspérini, M.; Vacher, P. Heterogeneous tensile test on elastoplastic metallic sheets: Comparison between FEM simulations and full-field strain measurements. Int. J. Mech. Sci. 2008, 50, 14–21. [Google Scholar] [CrossRef]
  20. Liu, W.; Guines, D.; Leotoing, L.; Ragneau, E. Identification of sheet metal hardening for large strains with an in-plane biaxial tensile test and a dedicated cross specimen. Int. J. Mech. Sci. 2015, 101, 387–398. [Google Scholar] [CrossRef]
  21. Kang, J.; Wilkinson, D.S.; Mishra, R.K.; Yuan, W.; Mishra, R.S. Effect of inhomogeneous deformation on anisotropy of AZ31 magnesium sheet. Mater. Sci. Eng. A 2013, 567, 101–109. [Google Scholar] [CrossRef]
  22. Yoon, J.I.; Kim, J.G.; Jung, J.M.; Lee, D.J.; Jeong, H.J.; Shahbaz, M.; Lee, S.; Kim, H.S. Obtaining reliable true plastic stress-strain curves in a wide range of strains using digital image correlation in tensile testing. Korean J. Metals Mater. 2016, 54, 231–236. [Google Scholar]
  23. Agirre, J.; Galdos, L.; Saenz de Argandoña, E.; Mendiguren, J. Hardening prediction of diverse materials using the Digital Image Correlation technique. Mech. Mater. 2018, 124, 71–79. [Google Scholar] [CrossRef]
  24. Abspoel, M.; Neelis, B.M.; van Liempt, P. Constitutive behaviour under hot stamping conditions. J. Mater. Process. Technol. 2016, 228, 34–42. [Google Scholar] [CrossRef]
  25. Wang, Z.B.; He, Z.B.; Fan, X.B.; Zhou, L.; Lin, Y.L.; Yuan, S.J. High temperature deformation behavior of friction stir welded 2024-T4 aluminum alloy sheets. J. Mater. Process. Technol. 2017, 247, 184–191. [Google Scholar] [CrossRef]
  26. Merklein, M.; Lechler, J. Investigation of the thermo-mechanical properties of hot stamping steels. J. Mater. Process. Technol. 2006, 177, 452–455. [Google Scholar] [CrossRef]
  27. Bariani, P.F.; Bruschi, S.; Ghiotti, A.; Michieletto, F. Deformation of AA6016 Aluminum Alloy Sheets at High Temperature and Strain Rate. Mater. Sci. Forum 2014, 783–786, 114–119. [Google Scholar] [CrossRef]
Figure 1. Hot tensile test with digital image correlation (DIC): (a) schematic diagram; (b) setup.
Metals 09 00243 g001
Figure 2. Strain maps for different crosshead speeds: (a) 0.9 mm/min; (b) 9 mm/min; (c) 90 mm/min.
Metals 09 00243 g002
Figure 3. Axial strain maps for different deformation stage at 90 mm/min crosshead speed.
Metals 09 00243 g003
Figure 4. Non-uniform deformation behavior in the reduced section at 90 mm/min crosshead speed: (a) strain distribution at different stages; (b) percentage of uniform deformation area.
Metals 09 00243 g004
Figure 5. Local stress-strain curves for different local points.
Metals 09 00243 g005
Figure 6. Strain rates’ evolution.
Metals 09 00243 g006
Figure 7. Stress-strain curves of specimens deformed at different temperatures and crosshead speeds: (a) 375°C; (b) 400°C; (c) 425°C; (d) 450°C.
Metals 09 00243 g007
Figure 8. The relationships between the parameters: (a) T–K; (b) T–n; (c) T–m.
Metals 09 00243 g008
Figure 9. Comparisons of the flow stresses predicted by the improved FB models and the experimental flow stresses for each point at different temperatures: (a) 375 °C; (b) 400 °C; (c) 425 °C; (d) 450 °C.
Metals 09 00243 g009
Figure 10. Accuracy evaluation of the established FB model: (a) verification for Point 2; (b) verification for Point 1 and Point 3.
Metals 09 00243 g010
Table 1. Chemical composition of the aluminum alloy (AA) 2024 sheet (wt.%).
CuMgMnFeSiZnTiNiAl
4.781.560.570.240.110.20.10.1Bal
Table 2. Parameters at different temperatures.
Temperature (°C)Knm
375 °C93.7890.03460.139
400 °C89.5020.03050.153
425 °C81.6180.02280.164
450 °C74.9610.01440.180

