Article

Hard Metal Production by ERS: Processing Parameter Roles in Final Properties

1
Department of Materials and Transportation Engineering and Science, Escuela Técnica Superior de Ingeniería, Universidad de Sevilla, Camino de los Descubrimientos s/n, 41092 Sevilla, Spain
2
Industry and Transport Division, Tecnalia Research & Innovation, Mikeletegi Pasealekua, 2., 20009 San Sebastián, Spain
3
Branch Lab Dresden, Fraunhofer Institute for Manufacturing Technology and Advanced Materials, Winterbergstrasse, 28., 01277 Dresden, Germany
4
Department of Chemical Engineering, Physical Chemistry and Materials Science, Escuela Técnica Superior de Ingeniería, Universidad de Huelva, Campus El Carmen, Avda, Tres de marzo s/n, 21007 Huelva, Spain
*
Author to whom correspondence should be addressed.
Metals 2019, 9(2), 172; https://doi.org/10.3390/met9020172
Submission received: 10 December 2018 / Revised: 24 January 2019 / Accepted: 31 January 2019 / Published: 2 February 2019
(This article belongs to the Special Issue Design of Cemented Carbides and Cermet)

Abstract

:
Cemented carbide is a hard composite material, used widely in a variety of industries. The value of the global tungsten carbide market is expected to grow by 4.4% (compound annual growth rate) from 2017 to 2022. One of the main markets is in metal cutting and wear parts, where small pieces (or inserts), a few grams in weight, are used. Field-assisted sintering technique (FAST) technologies allow for the production of small blanks in a single step from powder, which are near final dimensions. Production cycles are very short. In this paper, one of the FAST processes, the ERS technology, is applied to obtain WC10Co parts. A review of the process variable effects on the final properties of the parts is accomplished. Final properties of a range of conventionally produced inserts are obtained, using 100 MPa compacting pressure, 80 MA/m2 of current density, and processing times of around 800 ms.

1. Introduction

Parts produced from powders commonly use the cold pressing and sintering conventional procedure [1], because of its simplicity and lower cost. Nevertheless, the powder metallurgy (PM) industry incorporates a wide variety of different procedures, depending on the specific features of the component to be produced, or the material to be processed [2]. In this context, directly using electricity as a method to sinter powders (both metals and ceramics) has been suggested and tested historically [3], generally without a consistent theoretical base. This technology was developed to the exploration stage between 1906 and 1960. Pure direct current resistance sintering, or mixed capacitor discharge and transformers, were initially explored [4,5,6]. From 1960 to 1990, after studies by Inoue [7] concerning the use of different current waveforms, the development stage was reached. Recently, the technology has entered the exploitation stage, with an exponential increase of publications, patents, and applications [8].
The acronym FAST (field-assisted sintering techniques) is usually applied to PM techniques in which electricity is directly used to perform the sintering of the powders [3]. Indeed, the term FAST is very appropriate, as a short production time is the most remarkable characteristic among these techniques. Consolidation cycle lengths in FAST methods are extremely short, compared to the conventional PM methods. Additionally, short-lasting processes can limit structural evolution. In this way, nanostructures, or even glassy materials [9], can be processed.
Three main criteria can be used to classify FAST methods: (a) The power source nature, (b) the process duration, and (c) the electrical nature (conductor or insulating) of the die containing the powders. Three FAST processes stand out, from more than 30 variants described in the literature [10,11]: Capacitor Discharge Consolidation (CDC), Spark Plasma Sintering (SPS), and Electrical Resistance Sintering (ERS).
The CDC process uses the energy stored in a capacitor bank to consolidate the powders. Current is discharged through the powder (which may be under compression), acting as electrical resistance. The bank electrical capacitance and the charging voltage (up to the order of kV) dictate the energy amount of the process. The discharge takes place between a micro and a millisecond, with peak current values of the order of kA. Current flows only through the electrically conductive powders, due to the insulating nature of the dies. Sintering is usually attributed to microwelds between the powder particles, as powder and die heating is limited [12,13].
Some similarities occur between the SPS and ERS processes, concerning power supply. Both of them can use a welding transformer as power source. However, the dwelling times of SPS are longer (in the order of minutes). Consequently, a protective inert or vacuum environment is usually needed for SPS. Heat is mainly produced in the SPS electrically-conductive die, normally made of graphite. Therefore, the powders do not necessarily have to be conductive. It is still debated whether plasma between the particles develops during the process, despite the common name given to the process [14,15,16].
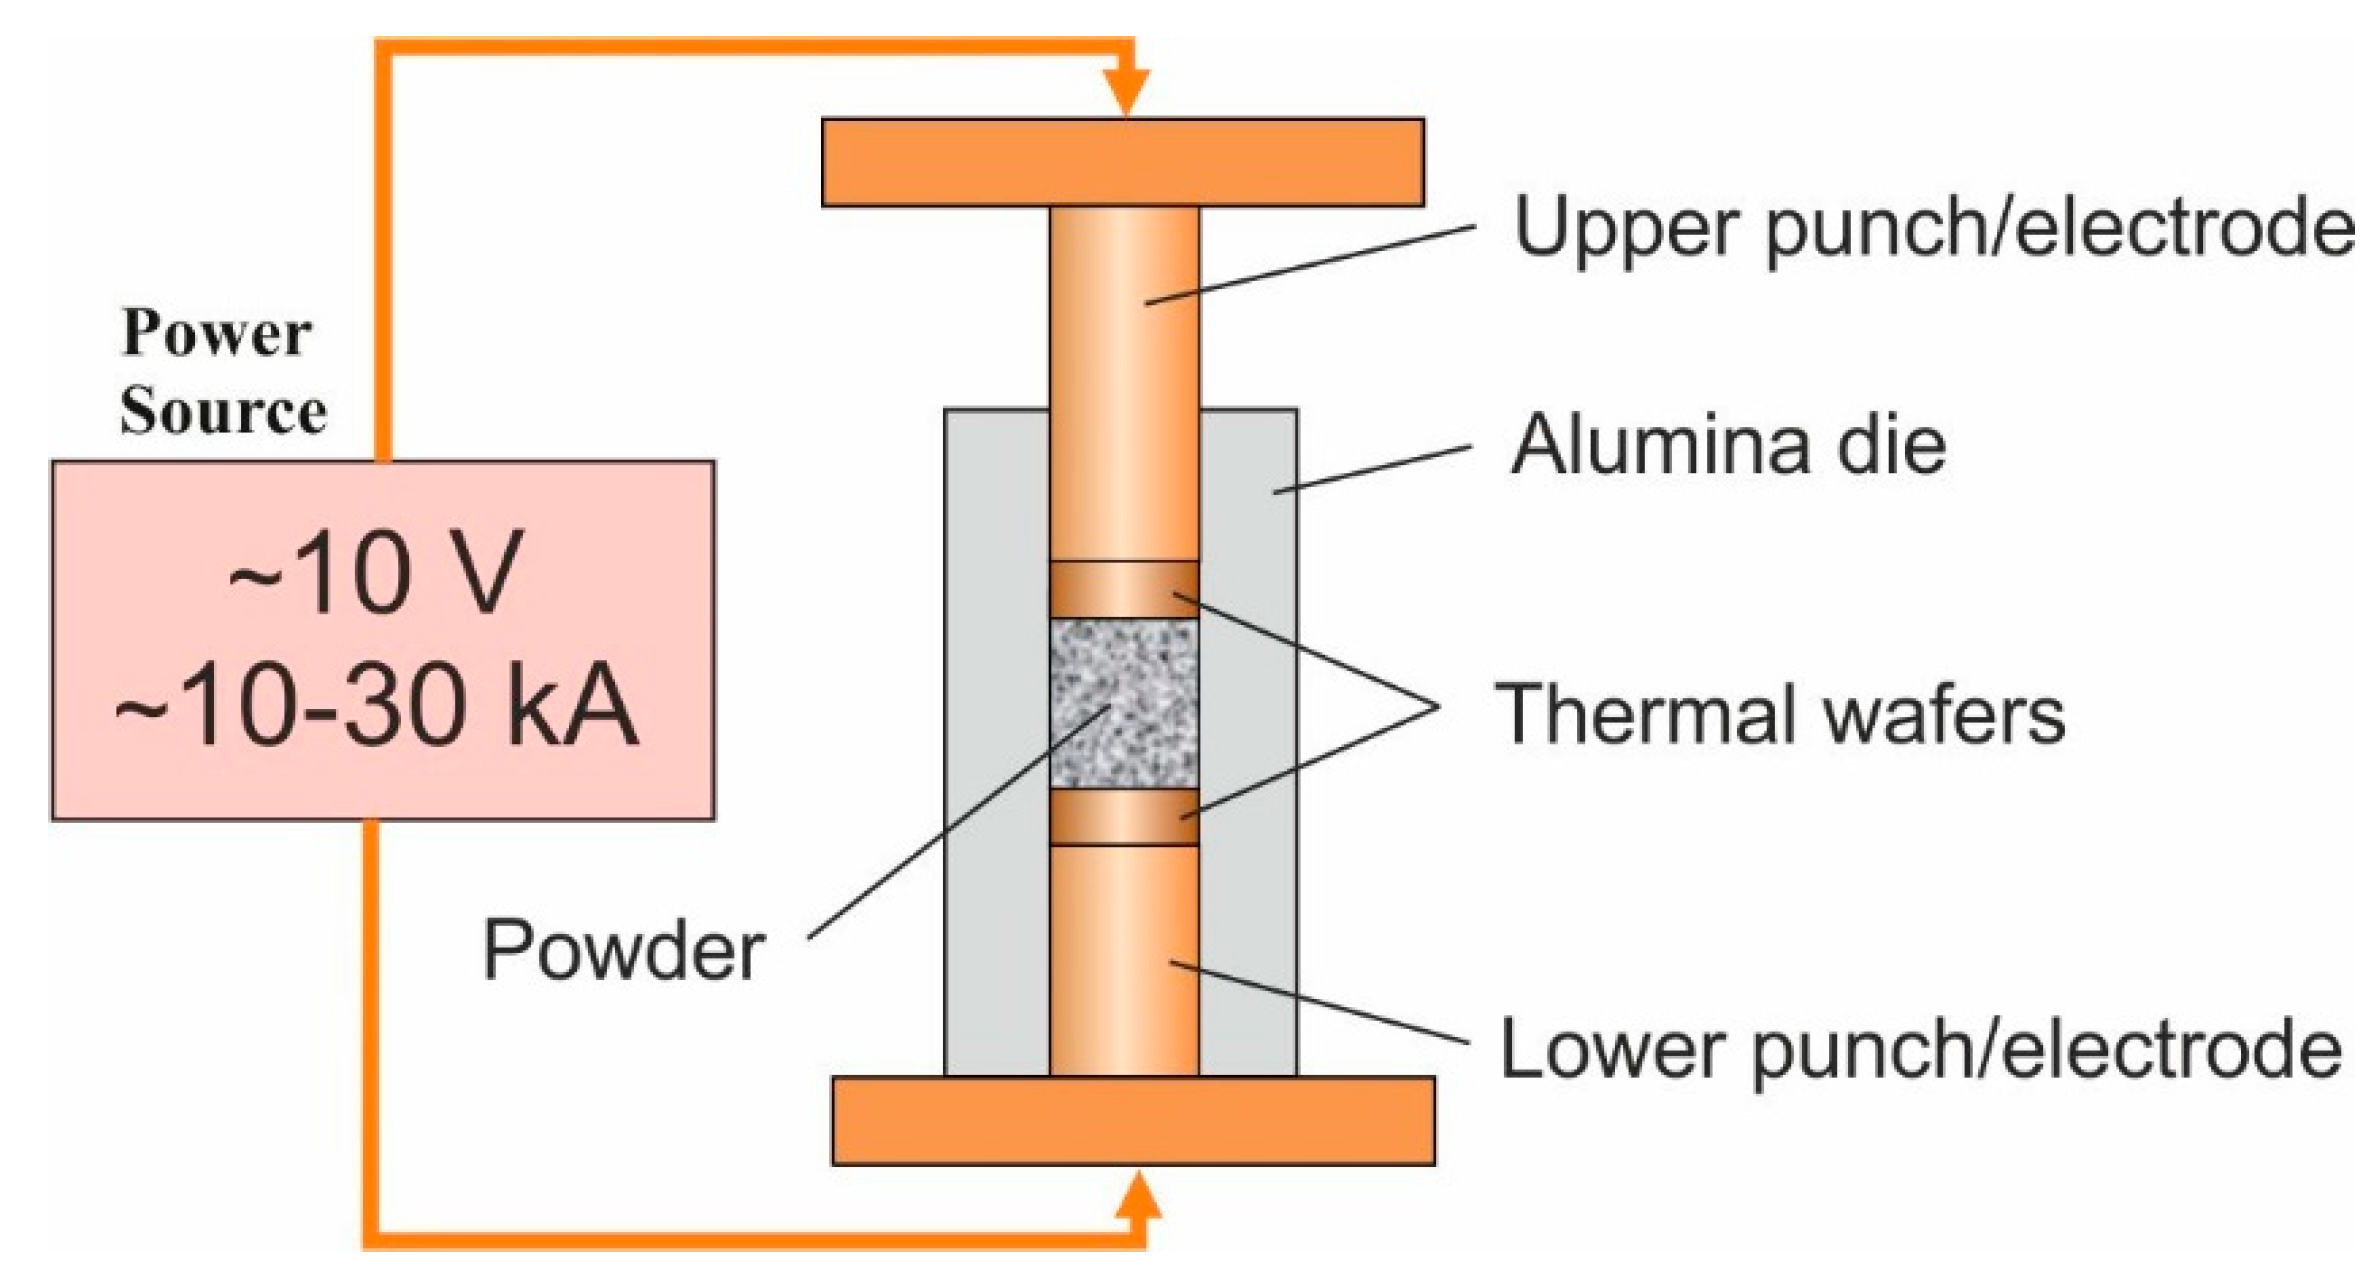
ERS usually complements the plain-welding transformer current supply with medium-frequency power electronics, thus reducing the transformer size. Voltage, typically 10 V, and current, between 10–30 kA, are maintained during the whole period of the process, which is typically on the order of a second. As the dies are electrically insulating, the powders must be conductors. Heating by the Joule effect softens the powder mass, which is simultaneously subjected to pressure [17]. At the same time, secondary processes occur in the powder: Surface oxide removal, electromigration, and electroplasticity.
The hard metal or cemented carbides industry [18,19] can clearly benefit from FAST processes. In addition, the market revenue is high enough as to justify the necessary exploitation stage development. Nevertheless, it is important to understand the difficulties associated with these processes. Non-linear, coupled interactions between several system properties, as well as between the densification process and the geometry of the system, occur during the consolidation process. As a general picture, increasing pressures reduce green (as-pressed) porosity, but not homogeneously in the powder mass. Density unevenness produced when applying pressure will be magnified by the process. On applying a current, the resistance and Joule heat produced will be higher in high-porosity areas. Conversely, denser green zones will increase density at a slower pace. To understand the final properties, it is also important to consider the electrical and thermal conductivity dependences on temperature. Even though the ERS process is extremely quick, temperatures can increase to near or above the melting temperature. Specific heat capacity will also vary, due to phase transformations during heating. Heat losses, through die walls and pressing punches, may contribute to microstructural inhomogeneities. Die and punch thermal conductivities are, indeed, very important [20].
Therefore, it is of great interest to know the exact effect of every process variable on the final product properties. In this paper, a general review of the effect of process variables is carried out on the ERS of WC + 10 wt.% Co hard metals.

2. Materials and Methods

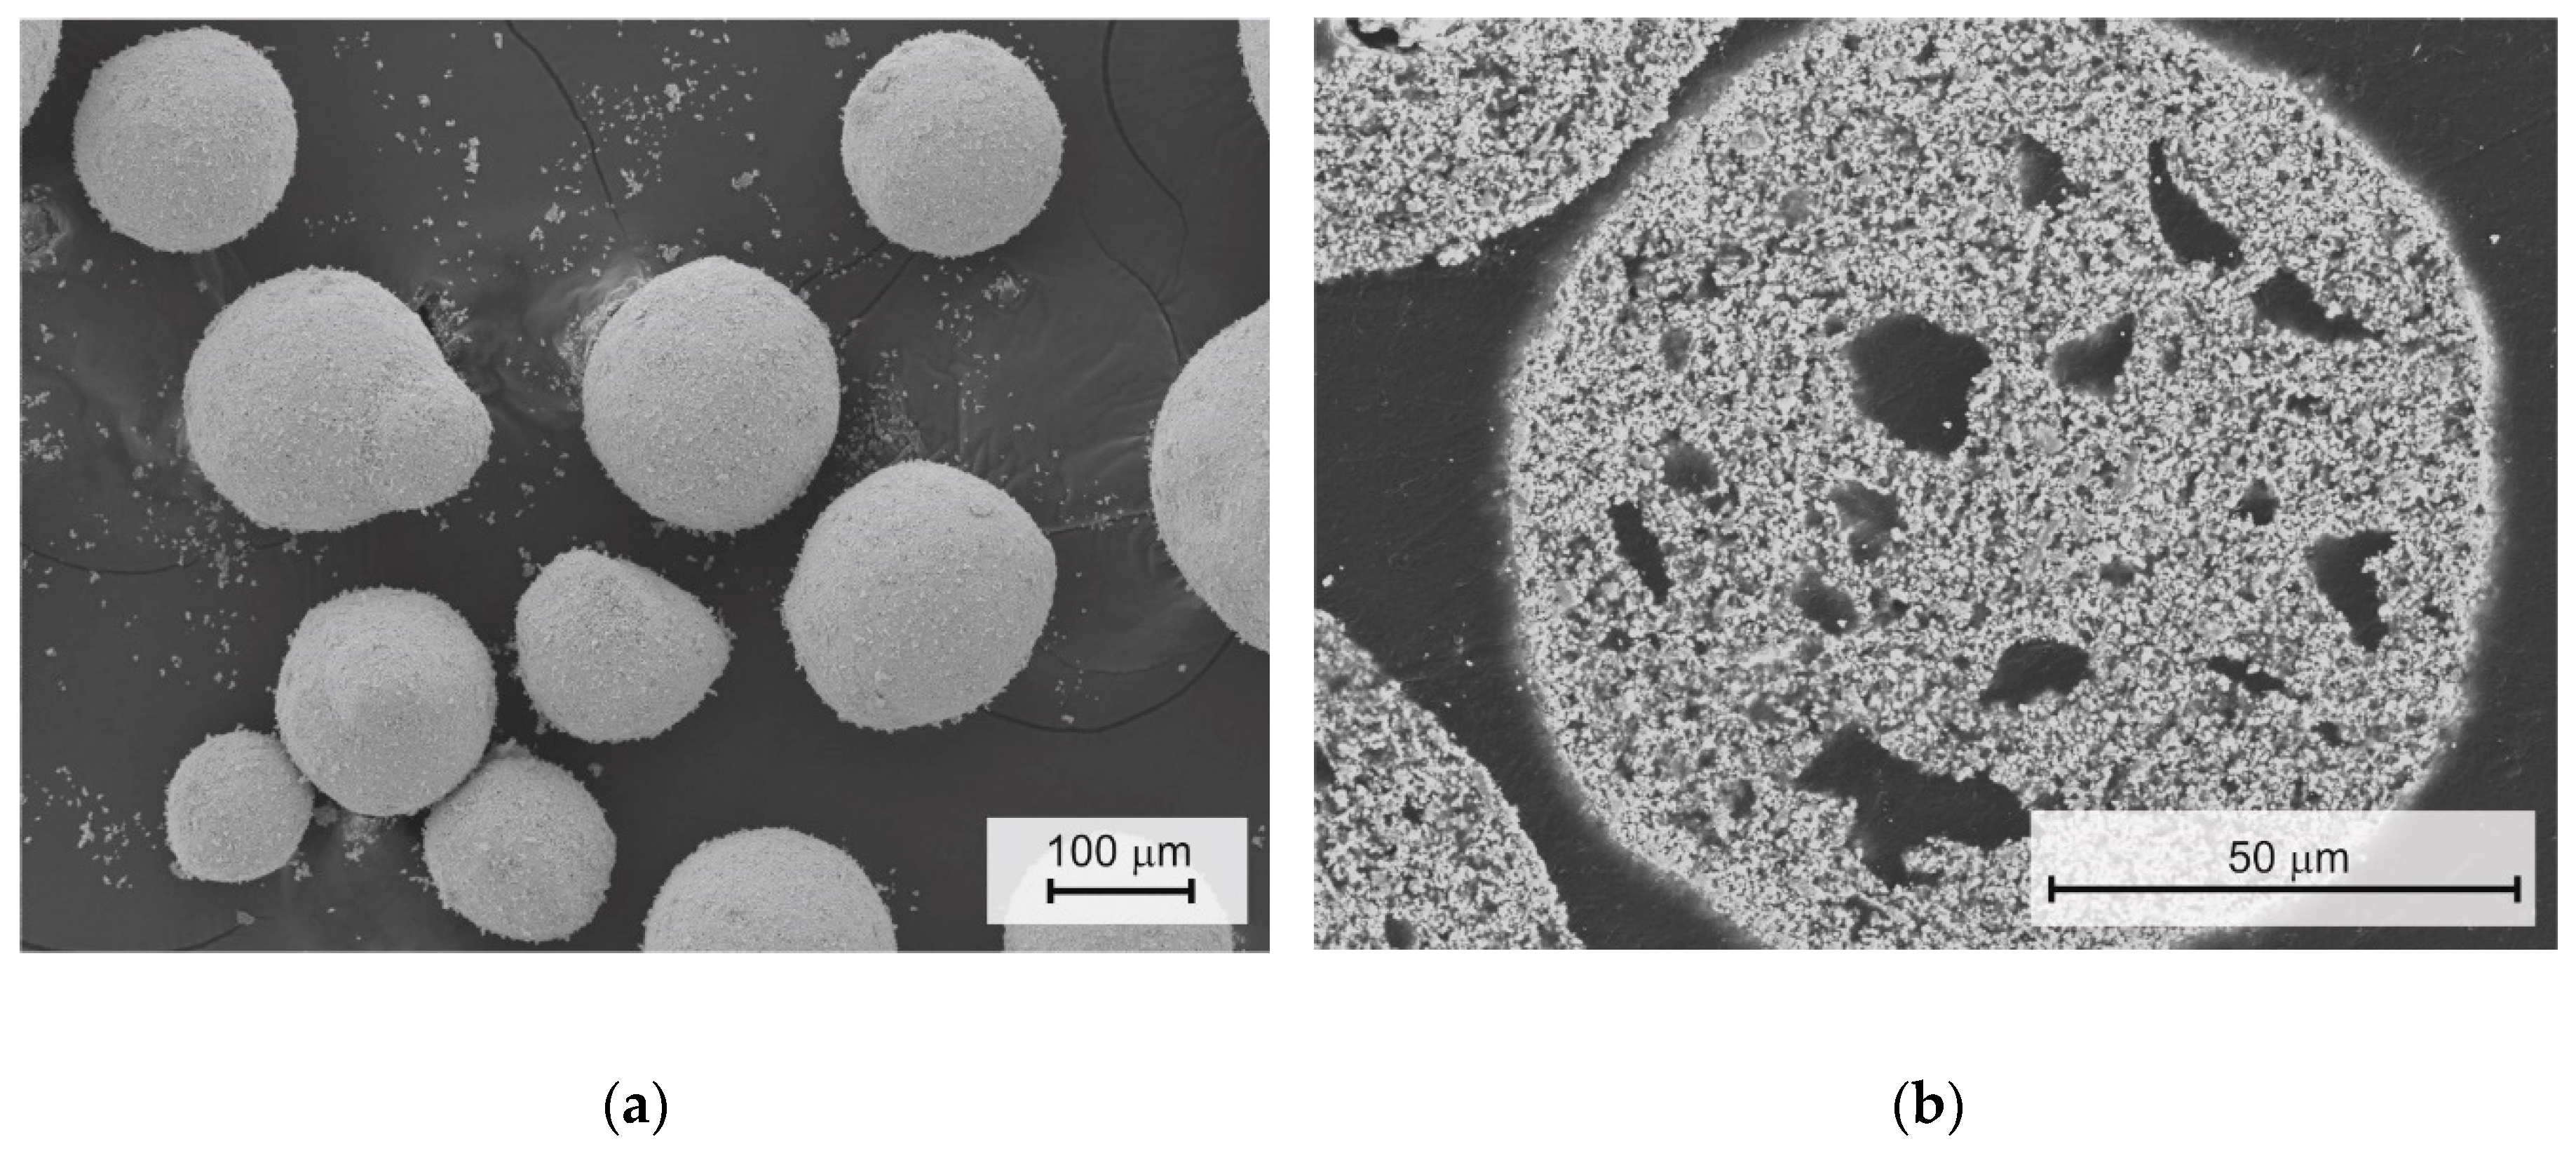
Premixed WC + 10 wt.% Co (WC10Co) powders, supplied by several producers, were tested to select the most adequate to be processed by ERS. The main properties to be tested were particle size distribution, flow rate, compressibility, electrical resistivity vs. applied pressure, carbon content, and dissolved gases. A balance of ample flow rate, high compressibility, and a relatively low electrical conductivity were considered, a priori, as the target properties of the powder mass. Another important property was the thermal conductivity of the powder mass. It is well known, for other systems [21], that ERS consolidation is dramatically affected by such properties. Kyocera Unimerco (Denmark) was selected as the powder supplier for this study. The selected WC10Co powder was degassed (840 °C/0.75 h/N2H2) to minimize problems due to gas expulsion during processing, and presintered (1100 °C/2 h/Ar) in order to increase particle size and facilitate flow rate for further processing. Final particles consisted of spherical agglomerates (Figure 1), some of them consisting of an external layer, with the inner being partially empty. The final powder had an ultrafine WC grain size of around 300 nm. Table 1 shows the main properties of the selected powder. LECO combustion analysis was used to measure the C and O content.
The experimental ERS sintering equipment employed (Beta 214 MF, Serra Soldadura, Barcelona, Spain) is sketched in Figure 2. A weighed amount of powder, as to produce a full dense compact 4 mm thick, was fed into the electrically insulating die and vibrated to achieve its tap density [22]. Two cylindrical dense alumina dies, with 8 and 12 mm nominal inner diameters, respectively, were used for the experiments. Graphite powder in acetone suspension was used as die wall lubrication. High purity copper punches, lined with Cu-W wafers on the powder contact surface, were employed.
The first step of the ERS process was to apply a uniaxial, single effect pressure through an electrically driven actuator with a maximum force capacity of 10 kN and a top travel speed of 100 mm/s. In this work, two pressures were tested, namely, 100 MPa (12 mm diameter die) and 250 MPa (8 mm diameter die). Typical travel speeds were of 50 mm/s.
The power source was regulated through a computer controlled inverter. An electrical current wave was applied in the form of a 10 MHz square pulse, direct current. After some trials to avoid experimental problems (mainly welding between powders and wafers and die durability), current densities (up to 125 MA/m2) and sintering times (between 300 ms and 1000 ms) were tested. Pressure was applied for 1000 ms before allowing current passing, and was released 1000 ms after current get-off to allow for compact cooling. A typical cycle, as measured by the equipment sensors, is shown in Figure 3. As shown, the initial shrinkage of the powders due to current passage cannot be followed by the punch, and a pressure drop was measured, being slowly recovered. On the other hand, intensity requires a certain time to reach the target value, due to this transitory period (of about 100 ms) where the current control algorithm is unable to fix the set value.
Final compact density was measured in the as-sintered compact, as per the Archimedean method and by weighing and measuring the cylindrical samples. Archimedean density was calculated by the differential weighing method, in air and then after maintaining the sample in boiling water for 1 h, as described in the well-accepted ISO Standards [23]. Samples were axially sectioned, and then prepared by proper grinding with up to 400 grit SiC paper and polishing with 6 and 3 micrometer diamond paste. When needed, an Epiphot 200 (Nikon, Tokyo, Japan) metallographic light microscope (LM) was used. The Vickers HV30 hardness, with a high enough load to give a mean hardness value of carbides and cobalt, was measured on a Duramin-A300 (Struers GmbH, Willich, Germany), according to ISO Standards [24]. Porosity was measured through image analysis (software Image Pro Plus 6, Media Cybernetics Inc., Rockville, MD, USA) on scanning electron microscopy (SEM, model Teneo, FEI, Eindhoven, The Netherlands) images, accomplished by appropriate metallographic preparation and according to ISO Standards [25]. Finally, toughness (using the Palmqvist method, ISO Standards [26]) was also measured, after a precisely-shaped crack was produced by the indentation method. Those properties were assessed at five points in the sectioned sample, according to the pattern shown in Figure 4. These points were always sufficiently away from the outer porous layer surrounding the sintered specimen. Finally, this outer porous layer was characterized, using the ratio of the dense core height to the total height of the sample.

3. Results and Discussion

3.1. Specific Thermal Energy (STE)

In order to understand the effect of the process variables on the final compact properties, it is useful to know the amount of energy released during the sintering process. Its value is affected by the resistance of the powder mass as consolidation takes place. Specific Thermal Energy (STE) (i.e., the amount of energy exerted per mass unit) can be calculated by time-integrating current per voltage values (or I2·R, the known parameters), as measured instantaneously by the equipment sensors, and dividing by the compact mass.
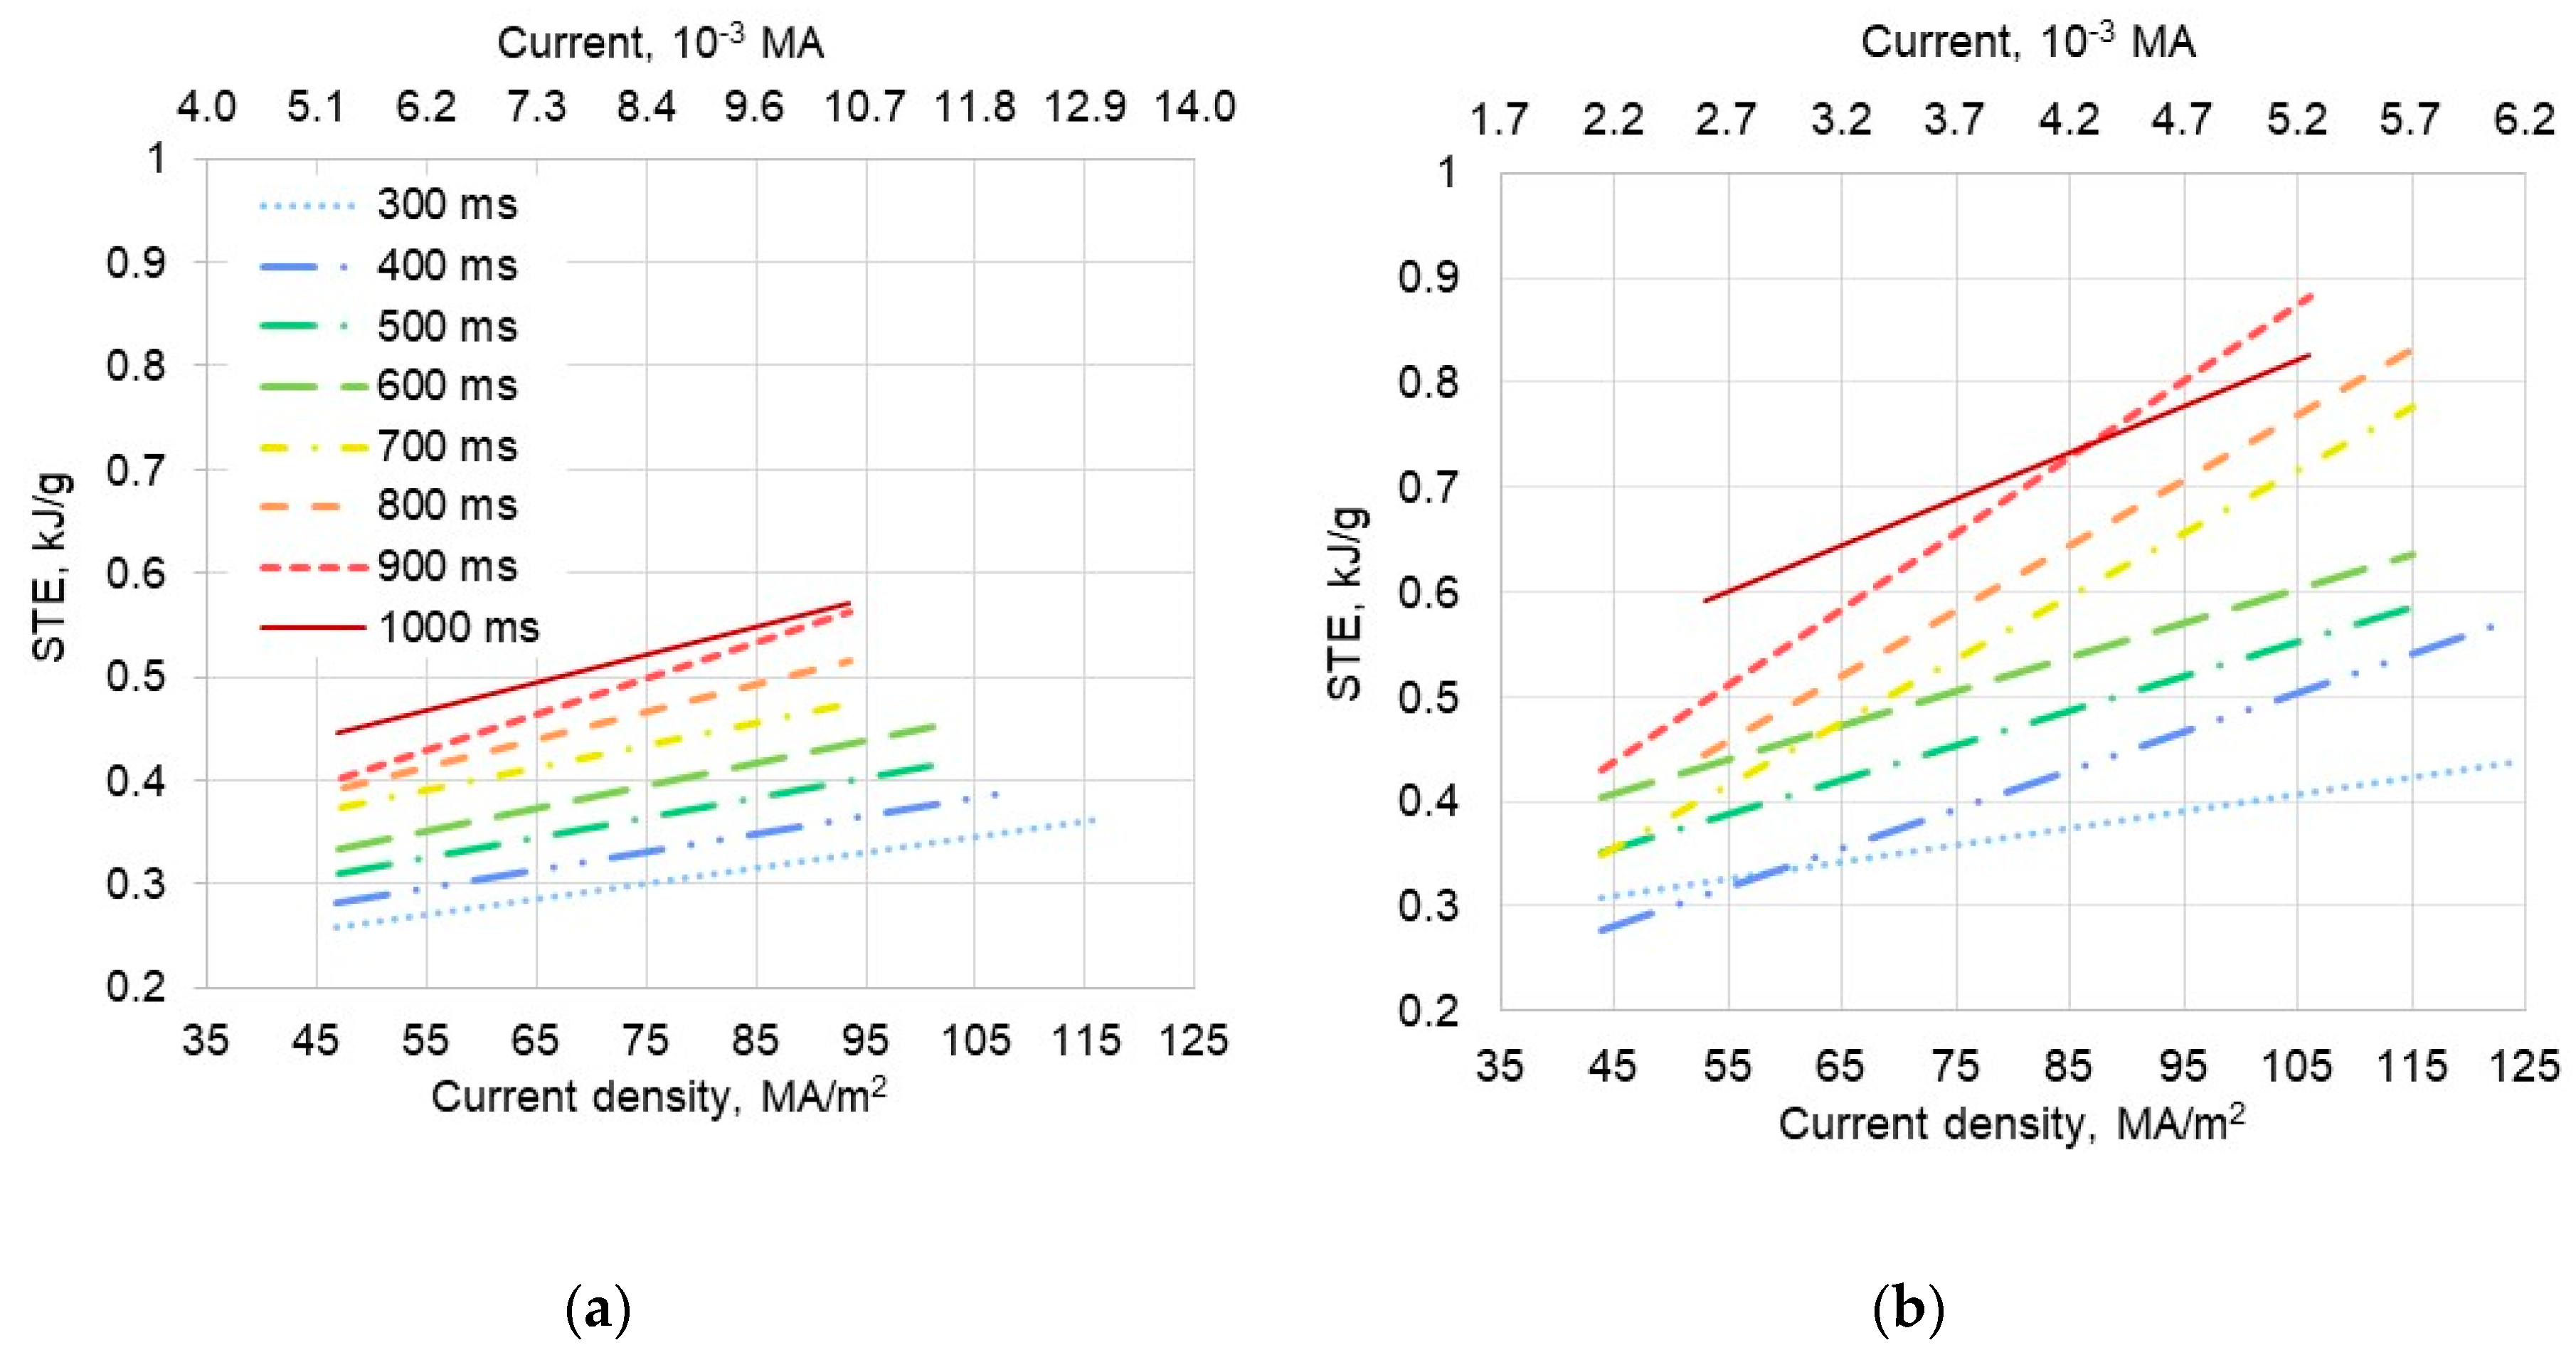
Figure 5 shows the computed (from monitored ERS variables) STE evolution, as a function of current and time, for the two different compacting pressures tested. To produce consistent drawings, measured current density was used, instead of nominal applied current.
The STE values grow as current intensity and sintering time increase. It may be expected that STE should tend to an asymptotic value in the higher range of time, or even diminish in the higher range of current. This is due to the electrical resistance of the powder mass becoming lower as density increases, and when sintering time and/or current are increased. Nevertheless, computer simulations of the ERS process showed that the effect of increasing the current and/or time compensates for the effect of decreasing the resistance [27]. As a result, the relationships between STE and current and/or time are approximately linear, from a practical point of view, as represented in Figure 5. Certain experimental points may show small deviations, due to the varied weight of the discussed factors at every ERS stage.
Concerning the effect of compacting pressure, several mechanisms must be considered. At the beginning of the sintering cycle, higher pressures mean higher densities, lower resistivity, and a smaller Joule effect. Consequently, initial temperature increase and the contribution to STE with 250 MPa pressure was less pronounced than with 100 MPa. But, shortly after the beginning of the sintering cycle, the initial higher Joule effect with 100 MPa diminishes, as higher densities and conductivities were reached sooner than with 250 MPa. Therefore, towards the end of long-lasting cycles, STE notably increased with 250 MPa. Considering all the sintering cycles, STE at 250 MPa may be higher than for 100 MPa tests (as can be deduced from Figure 5), even though the “quality” of this heat (highest temperature) was lower in the 250 MPa runs.
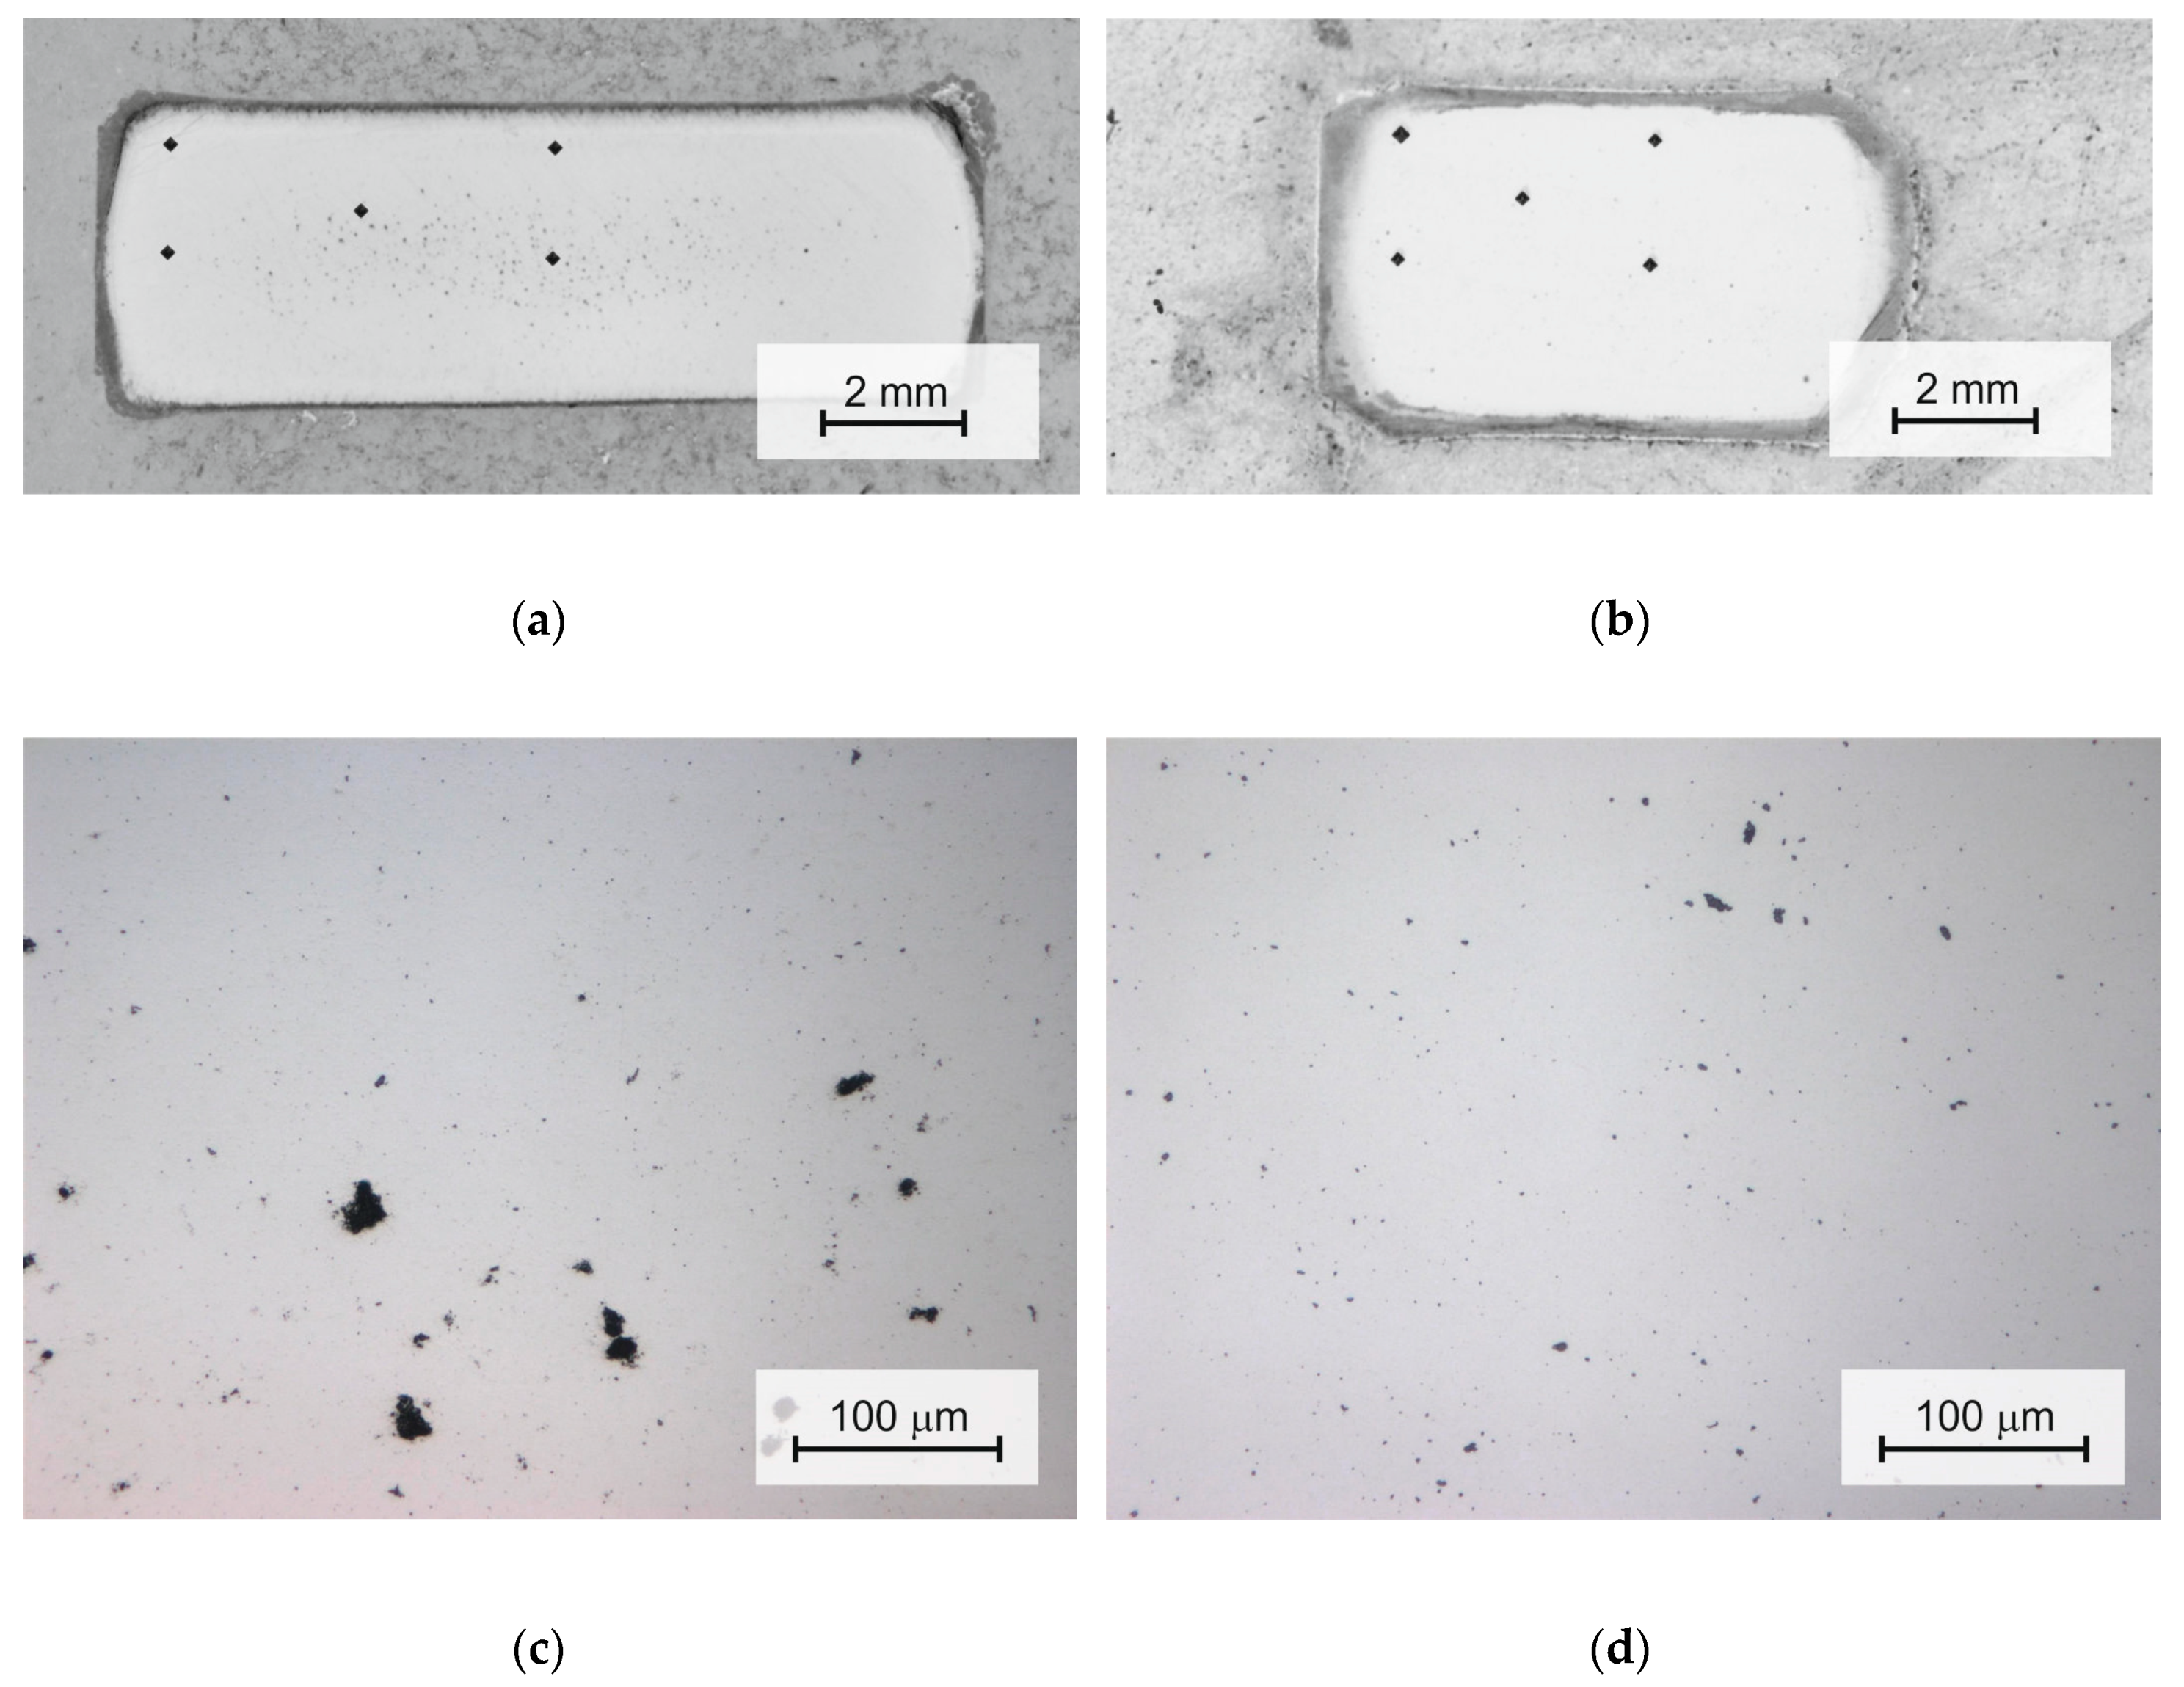
Previous qualitative discussion has been partially confirmed by the numerical simulation of the ERS process [28]. Temperature rise in the case of 100 MPa tests was steeper than with 250 MPa, and the maximum temperature is also higher. Nevertheless, simulation failed to predict that the integral value of STE, all around the cycle, is much higher with 250 MPa (i.e., factors included in the model and considered in the previous paragraph are not wholly responsible for the observed behavior). It may occur that a mechanism not included in the simulation is active and affecting real STE values. For instance, gas evolution observed during the experiments: Gas evolution may have been increased in the core of 100 MPa pressed compacts, due to the higher temperatures developed inside the part, which produced a porous central area (Figure 6). Gas evolution in lower-temperature 250 MPa pressed compacts was smaller but, due to the higher initial density, was trapped throughout the compact. This, in turn, will have produced a further delay in densification and/or conductivity improvement, thus increasing the real value of STE.

3.2. Current and Sintering Time Effect

Joule-effect heat is generated in the powder body and flows outwards through the die and punches. Furthermore, the powder container is cool at the beginning of the experience. Consequently, the compact outer coat usually reaches lower temperatures and density. A porous external layer is indeed found in some compacts (see Figure 4). The thicknesses of such outer porous areas have been also evaluated, depending on the ERS processing parameters.
The various effects of different factors, considered in the previous paragraphs, can also produce a small unevenness in the properties measured in the sample core (i.e., inside the external layer). But, at first approach, those differences are small enough to be negligible, as will be shown later on. Consequently, unevenness may be disregarded, as long as the mean measured property is on the order of the standard value of commercial samples. In the following paragraphs those mean properties, obtained from the measurements in the five points of Figure 4, are considered to find the effect of the ERS process variables.
Figure 7 presents the resulting global or mean properties of compacts prepared using a pressure of 100 MPa and 12 mm diameter alumina die. Density is represented here from dimensions and Archimedean measurements, a more direct way of obtaining this mean value. For clarity’s sake, only the tendency lines have been represented. As a reference, typical values for commercial WC10Co samples are: D = 14.4 g/cm3, HV = 1680, KIc = 11 MPa·m1/2.
Mean density increased as higher currents were used, while increased sintering times produced a less clear density improvement, even lower as current was increased. Due to the presence of the outer porous layer, Archimedean density values were higher than those derived from sample outer dimension measurement and weighing but followed a similar evolution. Values changed from a green density of about 5.3 g/cm3 to 10–14 g/cm3, because of the ERS process.
Specifically, for the effect of increasing applied current, there was a sort of saturation effect as current increased over 90–100 MA/m2. Considering that, according to Figure 5, STE increased as sintering current increased, the saturation effect must be related to a small quantity of outgas-related porosity that formed when using high current densities (i.e., high compact temperatures). This gas-occluded porosity effect even counteracted the smaller thickness of the outer porous layer as current was increased.
On the other hand, as can be deduced from Figure 7, the correlations between densities and sintering times are not so simple. First, the effect of increasing sintering time was not as clear as that of increasing sintering current. When using lower current values (i.e., lower maximum temperatures), an increase in sintering time produced a decrease in porosity. But, when the value of the current was increased, the relative effect of time was smaller. Nevertheless, this well-known kinetic effect cannot be matched to STE values. From Figure 5, STE steadily increased as time was increased. Maximum temperatures were more relevant to the final density than STE values, as previously mentioned. Longer ERS cycles, producing higher STE values, should only increase density when the maximum temperature is not high enough as to make negligible the effect of time. In addition, central porosity arising from gas evolution produced at high current densities will not be closed by increasing ERS length.
Sample hardness depends on two other main factors: Porosity and maximum temperature reached in ERS. As higher currents were used, maximum temperature increased. This, in turn, decreased the porosity but partly softened the material, because of a probable WC grain growth. The first effect was more pronounced up to around 75–85 MA/m2, therefore increasing the measured hardness. Above these values, the hardness typically decreased. In addition, the presence of evolved gas-produced porosity at higher current densities should also be responsible for the observed current-time-hardness relationships. As stated with density, sintering time effect on hardness is less important and clear.
On the other hand, mean toughness values were found to decrease as sintering current density or time were increased. It may be expected that porous, under-sintered samples would have a lower mean toughness, but this behavior is not clear in Figure 7. The observed behavior was attributed to the local nature of the Palmqvist toughness method, where the crack path usually runs through a fully dense matrix, free of pores. Toughness decrease should, then, be attributed to microstructural coarsening as current or time was increased, and to the porosity arising from gas evolution.
Finally, the outer porous layer, characterized by the dense core height ratio to the total height, quickly diminished as the current was increased. Again, the effect of increasing sintering time was not as effective, but with smaller current densities.

3.3. Compacting Pressure Effect

It is also interesting to understand the compacting pressure role on density, hardness, and toughness. First of all, the effectiveness of the press actuator to keep up a constant pressure should be considered. Indeed, as can be seen in Figure 3, as soon as current is applied, a virtual powder collapse occurs (i.e., the sintering shrinkage rate is extremely high). It happens that, under the most demanding conditions, a press actuator is not able to follow the pace of such powder volume contraction, and effective pressure, as measured by the proper sensor, suddenly dropped. In some extreme cases, punches lost contact with the powder and arcing can occur, resulting in punch weld in the sample. This is, however, not the usual case, with no welding taking place under usual working conditions. The problem should not be confused with the welding obtained from applying too high of a current, which was avoided by using the selected experimental conditions of this work.
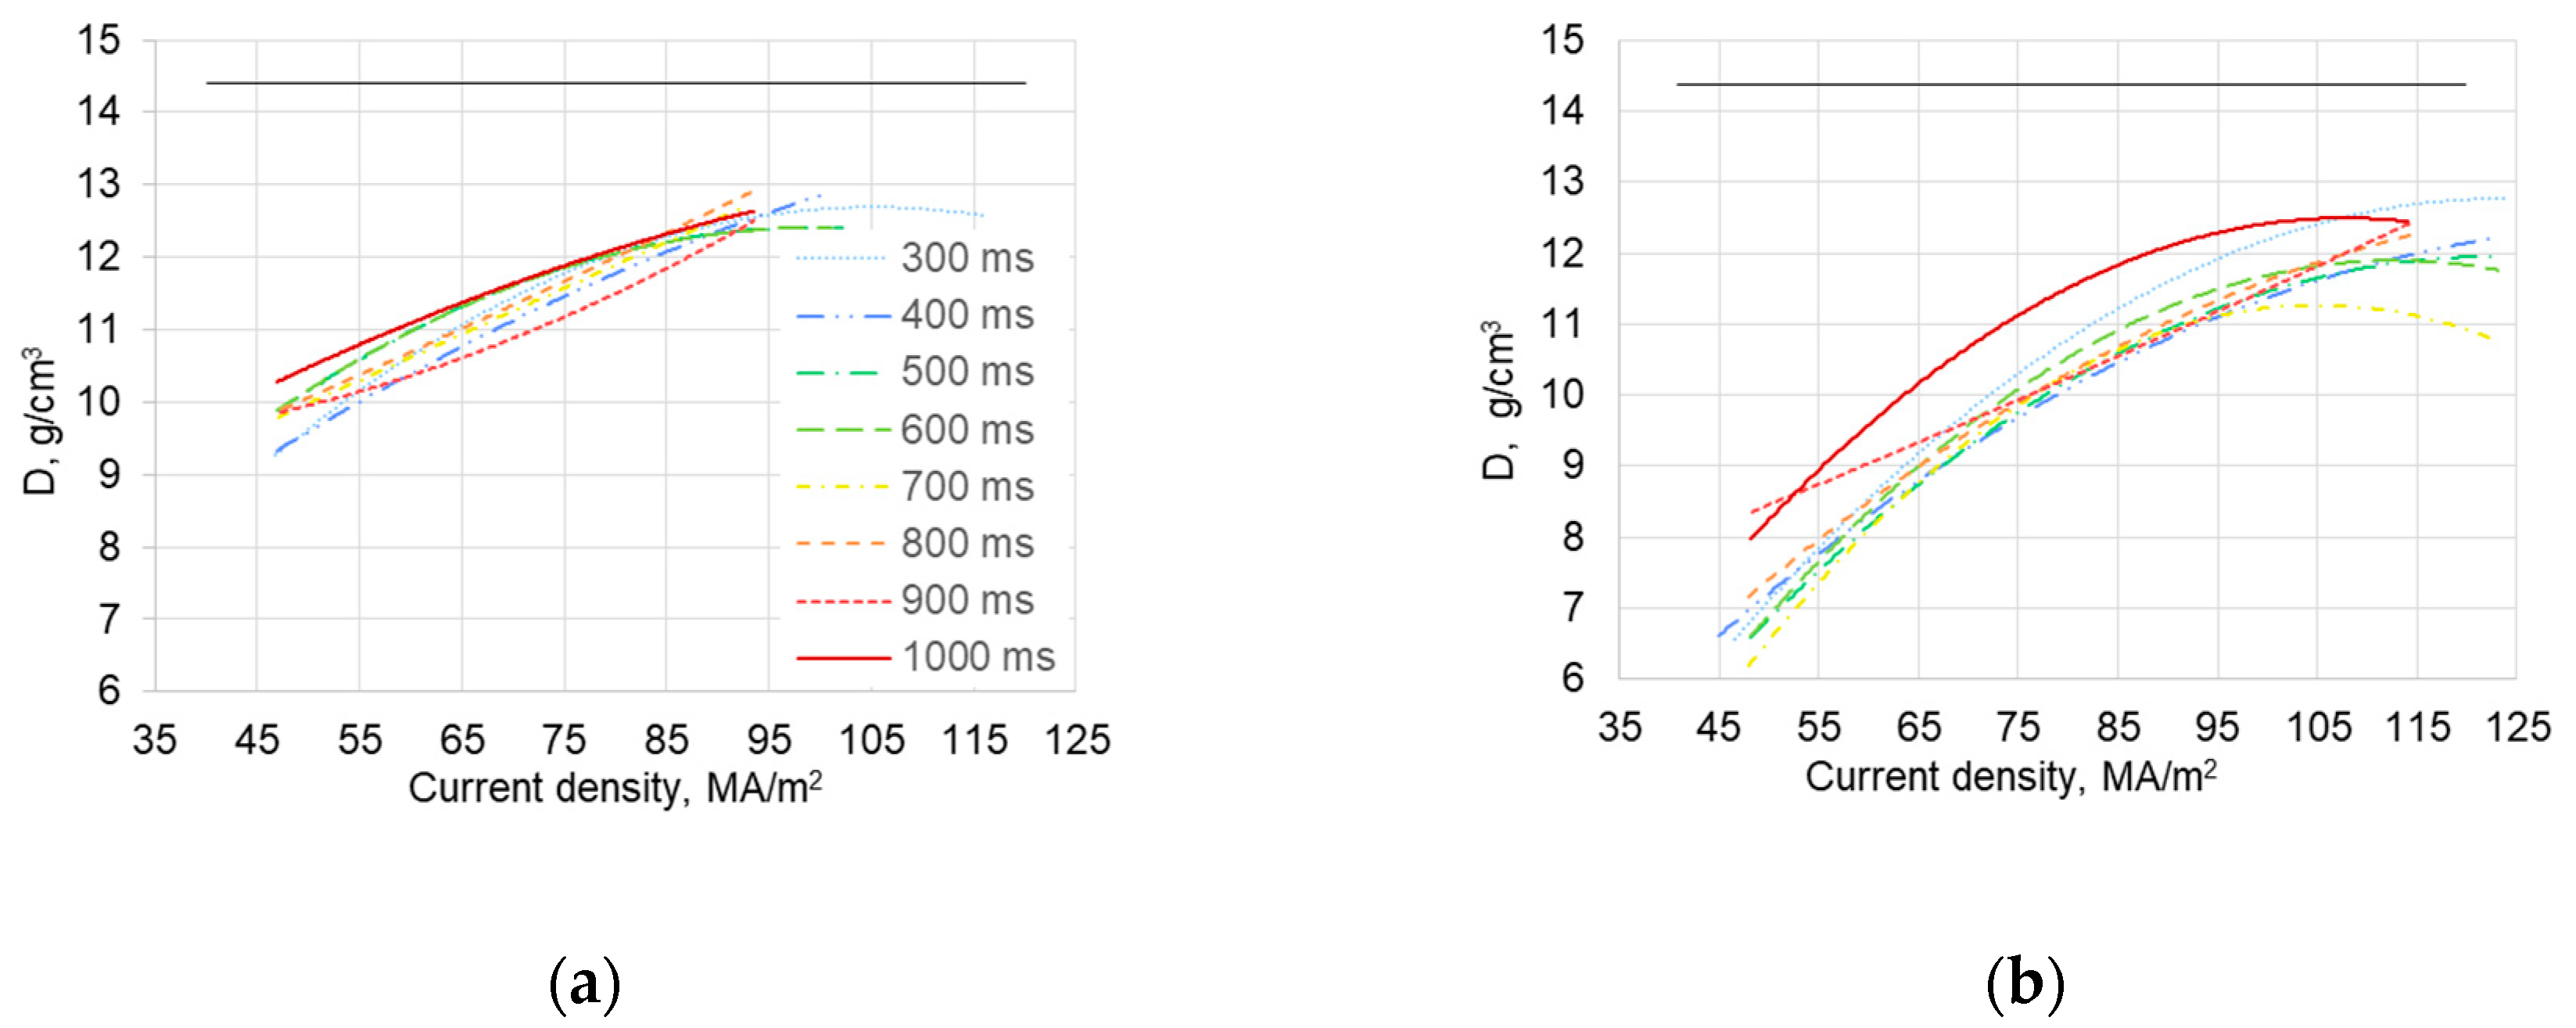
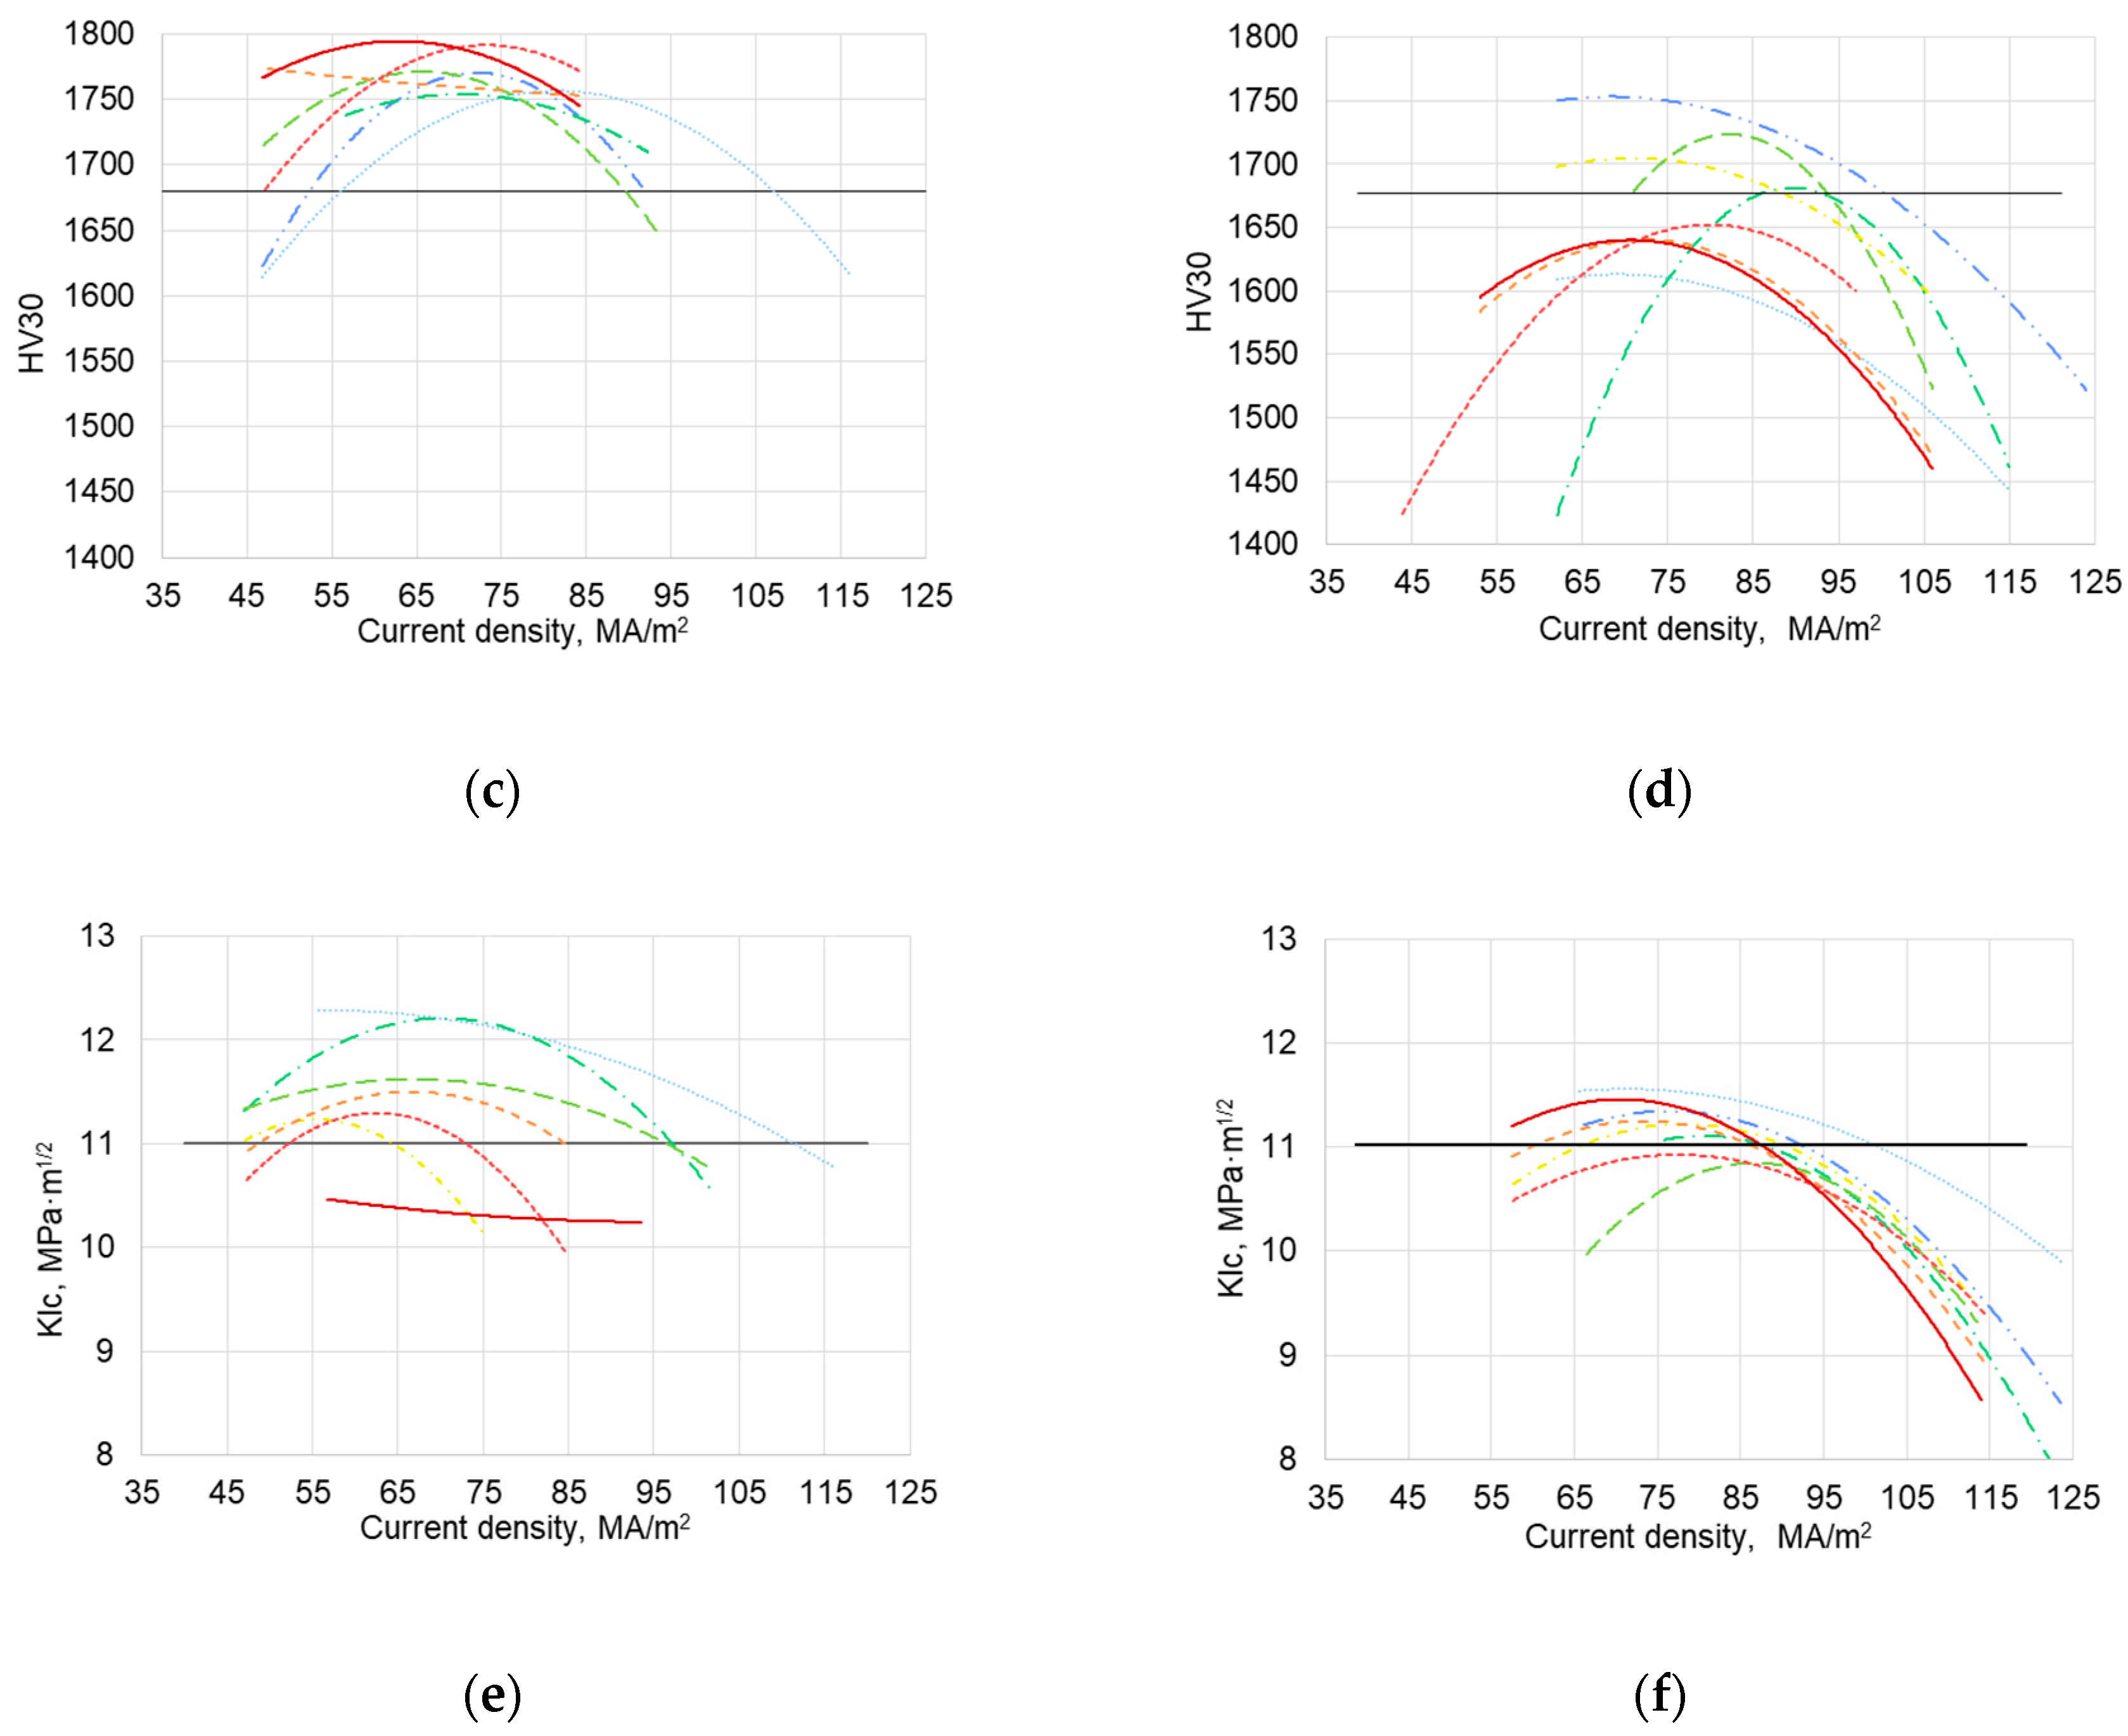
Concerning mean value dependence on applied pressure, Figure 8 shows results obtained, using 100 and 250 MPa as a function of the current density for different cycle times. Due to the large number of experimental points, which blurs the presentation, only tendency curves are shown.
From the figures, it may be said that it is possible to get hard metal parts by ERS which have similar properties to those usually shown by commercial counterparts (shown in Figure 8 by horizontal black lines). Of course, in the case of density, it would be necessary to shave off the outer porous layer to reach similar values as the commercial samples.
The results, shown in Figure 8, can be explained by similar arguments as used in the previous paragraphs. Density, hardness, and toughness evolution as the ERS currents and times are changed, show similar tendencies when using 100 or 250 MPa. Increasing the pressure produced higher STE, but reached lower maximum temperatures, as computed in the simulation [28]. Even though central porosity of samples may be less clear on using 250 MPa, total porosity level was higher. Higher overall porosity of the 250 MPa pressed samples accounts for the slightly lower hardness values. Toughness followed a similar behavior, which should be explained based on other reasons than those of porosity or microstructure.
Concerning the best sintering conditions, from the data of densities, it can be concluded that better properties were achieved with current densities between 90 MA/m2 (100 MPa) and 110 MA/m2 (250 MPa). Sintering time had a secondary influence, but, usually, higher times than 800 ms increased the final density in the current density range, previously mentioned. Considering, now, the hardness results, using low and high current densities reduced mean hardness values, while the effect of sintering times was not so important and clear. The best conditions to obtain higher hardness seem again to be around 70 to 80 MA/m2 and over 800 ms (100 MPa), and 80 to 90 MA/m2 and around 600 ms (250 MPa). There was a certain link between hardness values and porosity, even though other factors, like microstructural features, should be considered. Mean toughness values generally decreased as current and/or time were increased, and were slightly higher for 100 MPa pressed compacts.
The aforementioned were selected as the best processing conditions, but could slightly change if the peripheral area (most porous) is removed from the compact. In this case, an improvement of density and, to a lesser extent, hardness and toughness may be obtained.

3.4. Compact Homogeneity

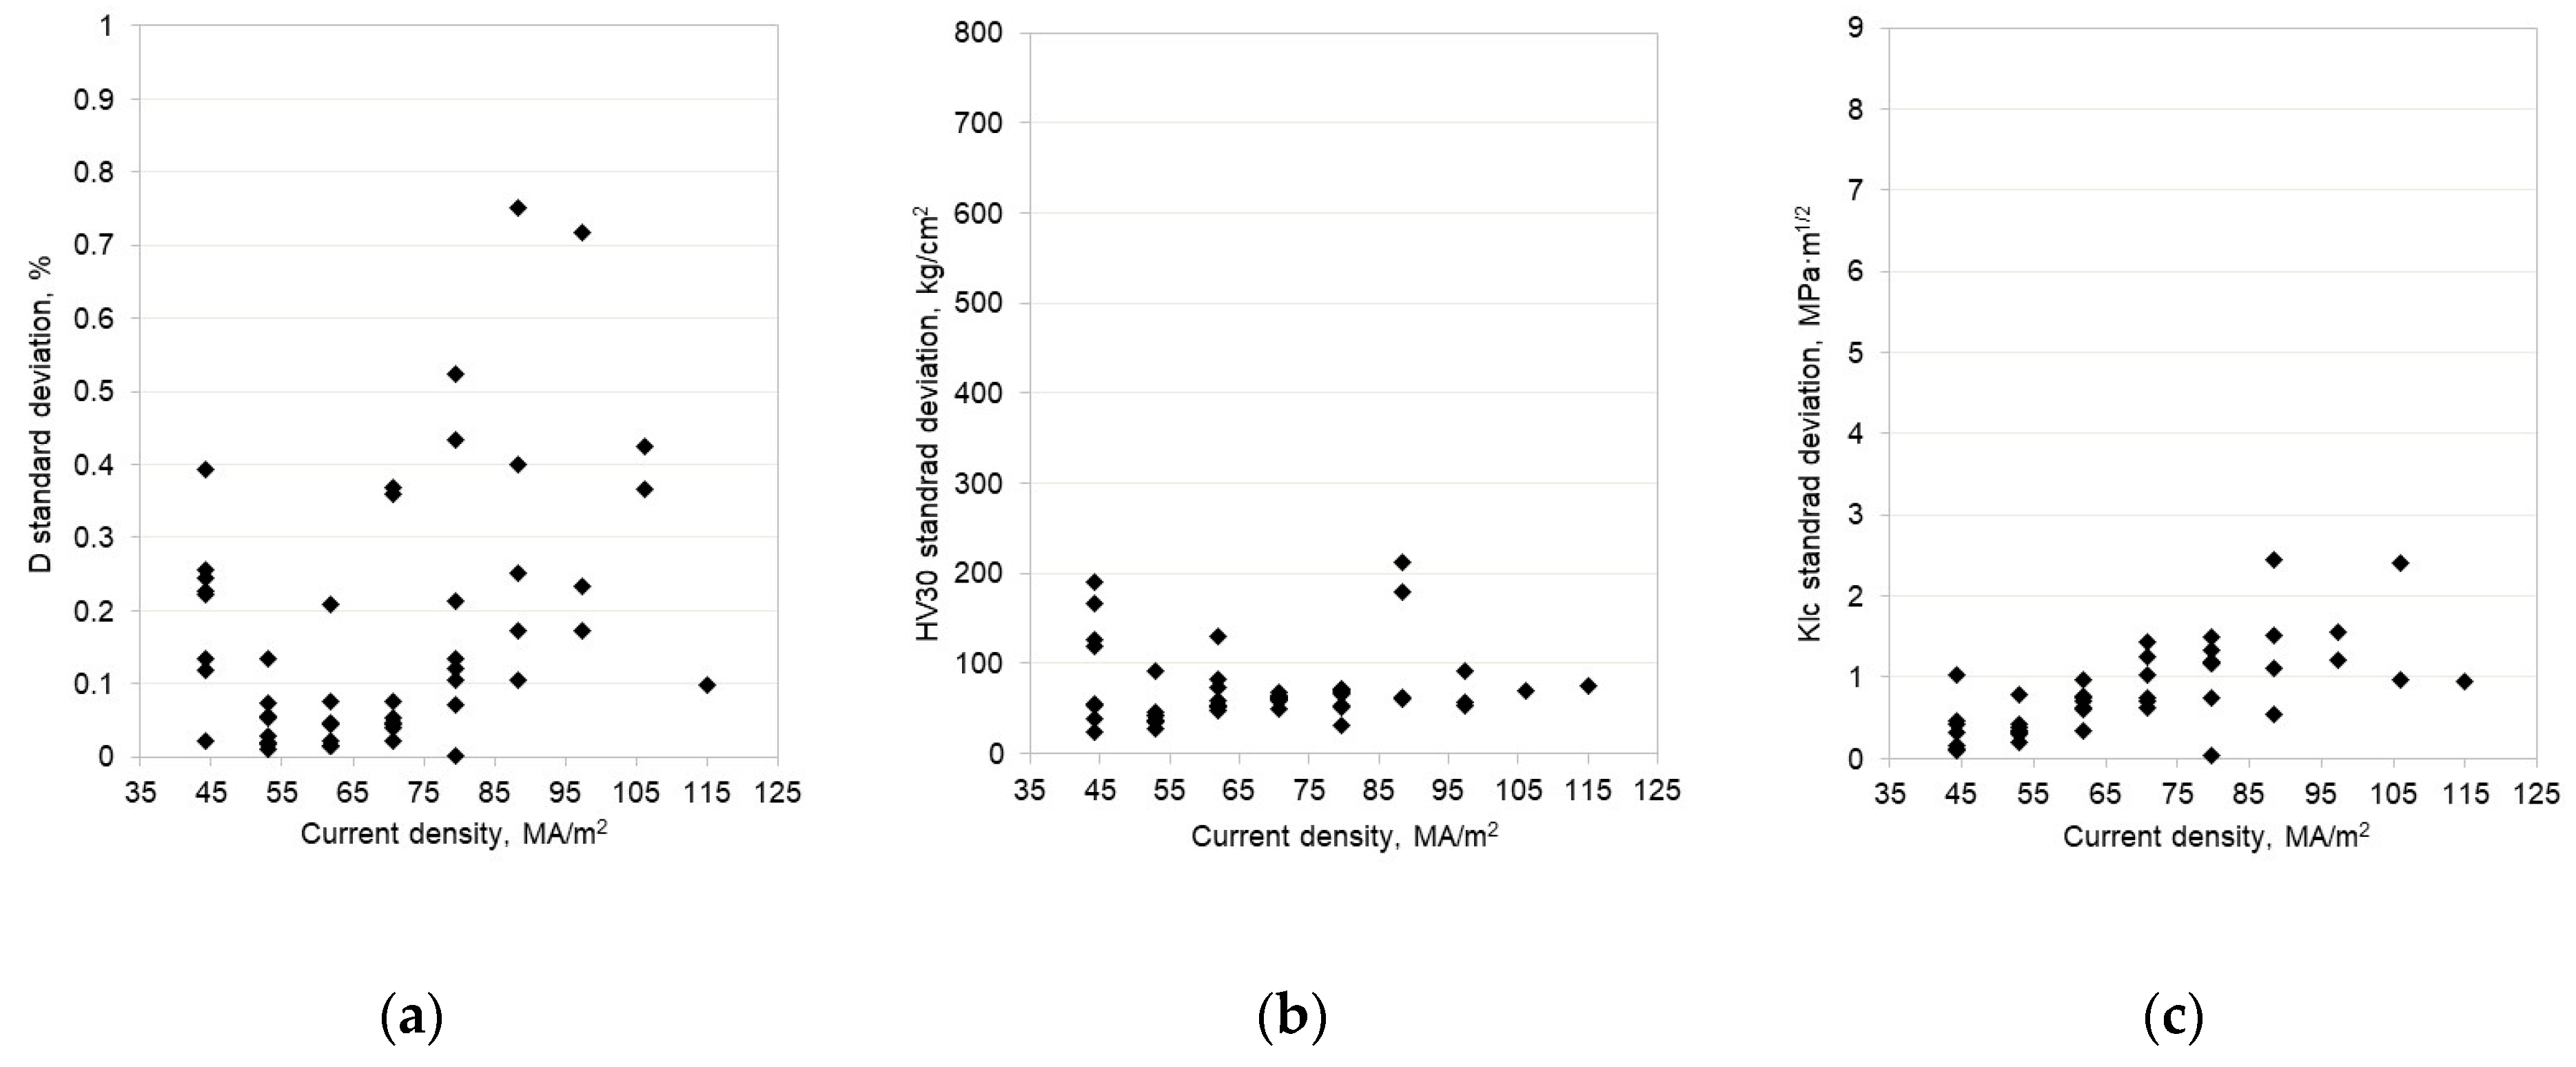
As explained earlier, compact properties have been measured at five different points in the sample section, as depicted in Figure 4. The standard deviation of the values measured at those five points may be considered as a measure of the sample’s homogeneity. Figure 9 and Figure 10 present density (measured by image analysis), hardness, and toughness standard deviations of those five measures, performed in every single sample, as a function of sintering current density for both the 100 and 250 MPa compacting pressures. According to previous results, the effect of sintering time was not as relevant to the absolute mean values of sample’s properties. Given that the same conclusion applies to standard deviation values, no distinction has been represented among different sintering time experimental points.
In general terms, concerning the studied properties, using higher pressures (Figure 10) produced slightly lower compact homogeneity. This behavior could, again, be related to gas entrapment. Thus, although higher pressures allowed for a bigger amount of released energy (Figure 5), this, in turn, was low-quality energy (low temperature). This probably produced a relatively high porosity area in points 1, 2, and 4, even though it was attempted to measure far enough away from the outer porous layer, and additionally in point 5, due to the gas evolution. Concerning the samples prepared using 100 MPa compacting pressure (Figure 9), hardness behavior copied, to some extent, the density variations, as porosity was one of the main factors affecting compact hardness. Nevertheless, when using a 250 MPa compaction pressure, both mean hardness (Figure 8) and hardness inhomogeneities (Figure 10) were very sensitive to small changes in current/time sintering conditions. This behavior was related to gas evolution problems during the sintering cycle. For samples prepared using 100 MPa, the hardness variations inside every sample were generally below 5% of the mean hardness absolute value.
Concerning the effect of the sintering current and sintering time, disregarding isolated standard deviation points, the general tendency seemed to be an increase of compact density homogeneity when lower current density was used, while the effect of time (not represented here) was, again, less clear. Nevertheless, in general terms, standard deviations were lower on sintering for around 600 to 700 ms. As explained before, a higher current density application will intensify property differences related to green density inhomogeneities. In this way, as has been reported elsewhere [27,28], lower STE tended to equalize final compact density. In any case, density inhomogeneities, as measured by the standard deviation, were below 0.2% for the best sintering conditions.
Toughness anisotropy and lack of homogeneity depended on sintering conditions in a more complex way. In addition to the effect of porosity, WC particle size and mean Co path are key microstructural features which define toughness values [29]. In general terms, higher values of the process variables increased toughness inhomogeneities, but a more precise discussion is beyond the scope of this paper.

3.5. Global Behaviour

Figure 11 gathers, in a simple way, the relative effect of the ERS variables on the final properties of the samples. As has been shown, crossed effects are present among different variables, and so there is a global conclusion, in the sense of “what not to do”, more than a precise set of best sintering conditions.

4. Conclusions

Properties of the ERS WC10Co inserts, produced from degassed and presintered powders with a very short final processing time (lasting less than 2 s), are comparable to those produced by hard metal industry standards. However, samples processed by ERS usually need to be shaved to dress out a thin outer porous layer, appearing because of the heat losses to the electrodes and the ceramic die.
The final properties are dependent on the process variables, specifically, compacting pressure, electrical current, and sintering time, among others. This study has showed the influence of these variables on the inserts. The effect of the specific thermal energy released on the powder mass was first studied, which was found to be very much related to the applied pressure. Thus, a lower pressure made the powder more resistive, a higher temperature having been reached inside the compact, and a higher porosity in the compact center attained. Higher pressures produced a more uniform porosity with lower temperatures. To reach appropriate values of porosity, hardness, and toughness, current densities from 80 MA/m2 (100 MPa) to 90 MA/m2 (250 MPa) should be used, a saturation effect occurring with the properties for higher values of current density, mainly because of gas evolution. The effect of sintering time was not as important, with 600 to 800 ms being a reasonable heating period. The effect of higher temperatures inside the compact must also be considered, due to a probable WC grain growth.
Lower pressures and current densities, along with intermediate sintering times, produced the best results from the point of view of parts homogeneity. Thus, the relative density values, measured on different zones of an axial section of the 100 MPa compact, had a standard deviation lower than 1%. Similarly, the standard deviation for hardness was, in general, lower than 5%, and lower than 15% for toughness. Slightly higher deviations were obtained for 250 MPa.

Author Contributions

Conceptualization, J.M.G. and J.M.M.; methodology, Y.T. and F.G.C.; validation, R.A., T.S., and J.C.; writing—original draft preparation, J.M.G. and I.A.; writing—review and editing, F.G.C. and J.C.

Funding

This research was funded by EU, grant number FoF.NMP.2013-10 608729 (7th Framework Programme) EFFIPRO.

Conflicts of Interest

The authors declare no conflict of interest. The funders had no role in the design of the study; in the collection, analyses, or interpretation of data; in the writing of the manuscript, or in the decision to publish the results.

References

  1. Cintas, J.; Montes, J.M.; Cuevas, F.G.; Gallardo, J.M. Influence of PCA content on mechanical properties of sintered MA aluminium. Mater. Sci. Forum 2006, 514–516, 1279–1283. [Google Scholar] [CrossRef]
  2. Gundermann, P. Overview of the status and trends in the European PM industry. Cfi Ceram. Forum Int. 2018, 95, E21–E25. [Google Scholar]
  3. Olevski, E.; Dudina, D. Field-Assisted Sintering: Science and Applications; Springer: Cham, Switzerland, 2018. [Google Scholar]
  4. Lux, J. An Improved Manufacture of Electric Incandescent Lamp Filaments from Tungsten or Molybdenum or an Alloy Thereof. GB Patent No. 27,002, 13 December 1906. [Google Scholar]
  5. Duval D’Adrian, A.L. Article of Fused Metallic Oxide and Process of Producing the Same. U.S. Patent 1,430,724, 3 October 1922. [Google Scholar]
  6. Taylor, G.F. Apparatus for Making Hard Metal Compositions. U.S. Patent No. 1,896,854, 7 February 1933. [Google Scholar]
  7. Inoue, K. Electric-Discharge Sintering. US Patent 3,241,956, 22 March 1966. [Google Scholar]
  8. Grasso, S.; Sakka, Y.; Maizza, G. Electric current activated/assisted sintering (ECAS): A review of patents 1906–2008. Sci. Technol. Adv. Mater. 2009, 10, 053001. [Google Scholar] [CrossRef] [PubMed]
  9. Maurya, R.S.; Sahu, A.; Laha, T. Effect of consolidation pressure on phase evolution during sintering of mechanically alloyed Al86Ni8Y6 amorphous powders via spark plasma sintering. Mater. Sci. Eng. A 2016, 649, 48–56. [Google Scholar] [CrossRef]
  10. Saheb, N.; Iqbal, Z.; Khalil, A.; Hakeem, A.S.; Aqeeli, N.A.; Laoui, T.; Al-Qutub, A.; Kirchner, R. Spark Plasma Sintering of Metals and Metal Matrix Nanocomposites: A Review. J. Nanomater. 2012, 2012, 983470. [Google Scholar] [CrossRef]
  11. Chunping, Z.; Kaifeng, Z. Pulse Current Auxiliary Sintering. In Sintering Applications; Ertuğ, B., Ed.; InTech: Rijeka, Croatia, 2013. [Google Scholar] [Green Version]
  12. Grigoryev, E.G.; Olevsky, E.A. Thermal processes during high-voltage electric discharge consolidation of powder materials. Scr. Mater. 2012, 66, 662–665. [Google Scholar] [CrossRef]
  13. Romero, E.; Montes, J.M.; Cintas, J.; Cuevas, F.G. Electrical discharge consolidation with stud welding technology. In Proceedings of the Materials Science and Technology Conference and Exhibition 2013, Montreal, QC, Canada, 27–31 October 2013; Volume 3, pp. 1737–1744. [Google Scholar]
  14. Guillon, O.; Gonzalez-Julian, J.; Dargatz, B.; Kessel, T.; Schierning, G.; Räthel, J.; Herrmann, M. Field-assisted sintering technology/spark plasma sintering: Mechanisms, materials, and technology developments. Adv. Eng. Mater. 2014, 16, 830–849. [Google Scholar] [CrossRef]
  15. Marder, R.; Estournès, C.; Chevallier, G.; Chaim, R. Spark and plasma in spark plasma sintering of rigid ceramic nanoparticles: A model system of YAG. J. Eur. Ceram. Soc. 2015, 35, 211–218. [Google Scholar] [CrossRef] [Green Version]
  16. Saunders, T.; Grasso, S.; Reece, M.J. Plasma formation during electric discharge (50 V) through conductive powder compacts. J. Eur. Ceram. Soc. 2014, 35, 871–877. [Google Scholar] [CrossRef]
  17. Montes, J.M.; Cintas, J.; Cuevas, F.G.; Ternero, F. Método para la Fabricación Pulvimetalúrgica de Imanes. Patent No. ES2543652 (WO 2015/101682 A1), 23 February 2016. [Google Scholar]
  18. Norgren, S.; García, J.; Blomqvistb, A.; Yin, L. Trends in the P/M hard metal industry. Int. J. Refract. Met. Hard Mater. 2015, 48, 31–45. [Google Scholar] [CrossRef]
  19. Global Tungsten Carbide Market—Analysis & Forecast, 2017–2022. Research and Markets, ID: 4176295. 2017. Available online: https://www.researchandmarkets.com/reports/4176295/global-tungsten-carbide-market-analysis-and (accessed on 1 December 2018).
  20. Montes, J.M.; Rodriguez, J.A.; Cuevas, F.G.; Cintas, J. Consolidation by Electrical Resistance Sintering of Ti Powder. J. Mater. Sci. 2011, 46, 5197–5207. [Google Scholar] [CrossRef]
  21. Montes, J.M.; Cuevas, F.G.; Ternero, F.; Astacio, R.; Caballero, E.S.; Cintas, J. Medium-Frequency Electrical Resistance Sintering of Oxidized C.P. Iron Powder. Metals 2018, 8, 426. [Google Scholar] [CrossRef]
  22. MPIF Standard 46, Determination of tap density of metal powders. In Standard Test Methods for Metal Powders and Powder Metallurgy Products; MPIF, Metal Powder Industries Federation: Princeton, NJ, USA, 2016.
  23. Impermeable Sintered Metal Materials and Hardmetals—Determination of Density; ISO 3369:2006; ISO: Geneva, Switzerland, 2006.
  24. Hardmetals—Vickers Hardness Test; ISO 3878:1983; ISO: Geneva, Switzerland, 1983.
  25. Hardmetals—Metallographic Determination of Microstructure—Part 4: Characterisation of Porosity, Carbon Defects and Eta-Phase Content; ISO 4499-4:2016; ISO: Geneva, Switzerland, 2016.
  26. Hardmetals—Palmqvist Toughness Test; ISO 28079:2009; ISO: Geneva, Switzerland, 2009.
  27. Gallardo, J.M.; Montes, J.M.; Schubert, T.; Cintas, J.; Torres, Y.; Cuevas, F.G.; Weissgaerber, T. Electrical Resistance Sintering (ERS) Simulation Tool. In Proceedings of the Application to Hardmetals, World PM2016 Congress and Exhibition, European Powder Metallurgy Association, Hamburg, Germany, 9–13 October 2016. [Google Scholar]
  28. Montes, J.M.; Cuevas, F.G.; Cintas, J.; Urban, P. A One-Dimensional Model of the Electrical Resistance Sintering Process. Metall. Mater. Trans. A Phys. Metall. Mater. Sci. 2014, 46, 963–980. [Google Scholar] [CrossRef]
  29. Lagos, M.A.; Agote, I.; Schubert, T.; Weissgaerber, T.; Gallardo, J.M.; Montes, J.M.; Prakash, L.; Andreouli, D.; Oikonomou, V.; Lopez, D.; et al. Development of electric resistance sintering process for the fabrication of hard metals: Processing, microstructure and mechanical properties. Int. J. Refract. Met. Hard Mater. 2017, 66, 88–94. [Google Scholar] [CrossRef]
Figure 1. Secondary electron scanning electron microscopy (SEM) image of degassed and presintered WC10Co powder (a). Powder particle microstructure, as seen in a backscattered electron SEM image (b).
Metals 09 00172 g001
Figure 2. Sketch of the experimental equipment used for electrical resistance sintering (ERS) experiments. The power source is connected to the electrodes, applying pressure and conducting the current to the powders placed inside the alumina die.
Metals 09 00172 g002
Figure 3. Registered values of applied pressure, current intensity, and released energy of a typical cycle of an ERS experiment.
Metals 09 00172 g003
Figure 4. Dot pattern (scheme (a) and 12 mm diameter compact (b)) where local porosity, hardness, and toughness were studied.
Metals 09 00172 g004
Figure 5. Specific Thermal Energy (STE) vs. sintering current density for 100 MPa (a) and 250 MPa (b) compacting pressure.
Metals 09 00172 g005
Figure 6. Light microscopy (LM) macrographs (a) and (b), and micrographs of the specimen core (c) and (d) of 90% dense 100 MPa (a) and (c) and 70% dense 250 MPa (b) and (d) sintered specimens (both 85 MA/m2, 600 ms). Also visible at the macrographs are Vickers indentations at points 1 to 5.
Metals 09 00172 g006
Figure 7. Results of the WC10Co ERS tests, carried out at 100 MPa for 300 ms (a), 600 ms (b), and 1000 ms (c).
Metals 09 00172 g007
Figure 8. Density (a) and (b), hardness (c) and (d), and toughness (e) and (f) of sintered compacts as a function of sintering current density for 100 MPa (a), (c) and (e) and 250 MPa (b), (d) and (f). Horizontal black lines represent typical values for commercial parts.
Metals 09 00172 g008aMetals 09 00172 g008b
Figure 9. Standard deviation values of (a) density, (b) hardness, and (c) toughness values, measured at the five selected different points in the sample cross section (see Figure 4). Sample compacting pressure was 100 MPa.
Metals 09 00172 g009
Figure 10. Standard deviation values of (a) density, (b) hardness, and (c) toughness values, measured at the five selected different points in the sample cross section (see Figure 4). Sample compacting pressure was 250 MPa.
Metals 09 00172 g010
Figure 11. Relative general effects of ERS conditions on the final hard metal compact properties.
Metals 09 00172 g011
Table 1. Main properties (r.t.) of the selected WC10Co powder feedstock.
Particle Size, d50µm168.9
Flowabilitys/50 g20.6
Bulk powder density, Dg/cm314.33
Tap densityg/cm34.0
Powder compressibility at 100 MPaDensity, %37.0
Powder compressibility at 250 MPaDensity, %40.0
Electrical conductivity at 100 MPa(Ω·m)−1156,000
Electrical conductivity at 250 MPa(Ω·m)−1161,000
Thermal conductivity at 100 MPaW/m·K0.18
Thermal conductivity at 250 MPaW/m·K0.20
C%5.51
O%0.13