1. Introduction
At the Collaborative Research Center ‘Farbige Zustände’ (CRC 1232) of the German Research Foundation (DFG), a novel method for evolutionary structural material development has been established. A sequence of different characterization processes has been developed using spherical micro samples with a diameter equal to or less than 1 mm, thus enabling high-throughput screening. Droplet generators as in [
1] provide spherical droplets as micro samples, allowing fast production of various alloys while using small batches. Starting with chemical composition, the experimental processes of the different characterization methods are systematically adapted, including the variation of the thermal, thermo-mechanical and mechanical parameters involved. Subsequently, the obtained microstructure states and associated micro-properties are characterized, up-scaled to macro level and valued. By means of machine learning and heuristic methods, the experimental plans are refined and the experimental procedure is continued until, finally, a novel material with the desired properties is found [
2,
3].
The properties of metallic materials are substantially affected by the phases present in the microstructure and their special morphology. Furthermore, the interactions of defects of the respective phases play a decisive role for many metallurgical processes. Defect structure and microstructure are significantly influenced by the heat treatment and the transformation processes taking place, such as the dissolution and precipitation of phases or the change of the crystal structure, but also by the alloy.
Most metallic materials strive to form an equilibrium phase which is counteracted by rapid heating and cooling processes. Due to the important thermal switching behavior and the small Biot number, small-scale samples enable rapid temperature changes in the material and thus the possibility of non-equilibrium states.
Dynamic differential scanning calorimeters (DSC) are used for heat treatment and in situ characterization of structural changes, as well as for rapid ex situ characterization of previously heat-treated samples. The chemical and physical reactions of steel and aluminum materials due to heating or cooling processes during DSC measurements can be investigated. Using this measuring technique, extremely variable temperature–time cycles can be adjusted so that they are device-specifically limited for the maximum temperature, as well as with respect to heating and cooling rates. Not only phase transition, but also precipitation and dissolution processes are detectable during DSC measurements, which can be used as a characterization of microstructural states. Several studies regarding DSC measurements on steels can be found in the literature, e.g., concerning the determination of martensite decay [
4]. In the case of aluminum alloys, extensive work has already been carried out on precipitation and dissolution behavior using DSC from Keßler et al. [
3], in which methods for producing continuous cooling precipitation diagrams, as well as continuous heating dissolution diagrams, were developed. Measuring speed, and thus sample throughput, can be increased using non-equilibrium heating rates. However, an increase in heating rate leads to a different DSC measuring curve [
5]. The analysis and data interpretation of such DSC measurements is a major challenge.
In this paper, the relations between DSC descriptors (short-term determinations, which are based on physical test methods) and heating rates are presented using DSC-supported reheating tests of micro samples. DSC descriptors are characteristic features for microstructural changes derived from the temperature-dependent endo- or exothermic peaks of the DSC curve. The descriptors are quantified and analyzed depending on the heating rate.
Additionally, universal microhardness (UMH) measurements are carried out for evaluating the heat treatment states of the samples after the DSC measurements. This indentation method provides microhardness descriptors which enable a comparability for micro and macro samples and thus gives a validation feature for a calorimetric characterization with increased heating rates [
6].
The aim of this investigation is to accelerate the DSC measurements regarding the high-throughput approach of the CRC 1232 without compromising the calorimetric results.
4. Discussion
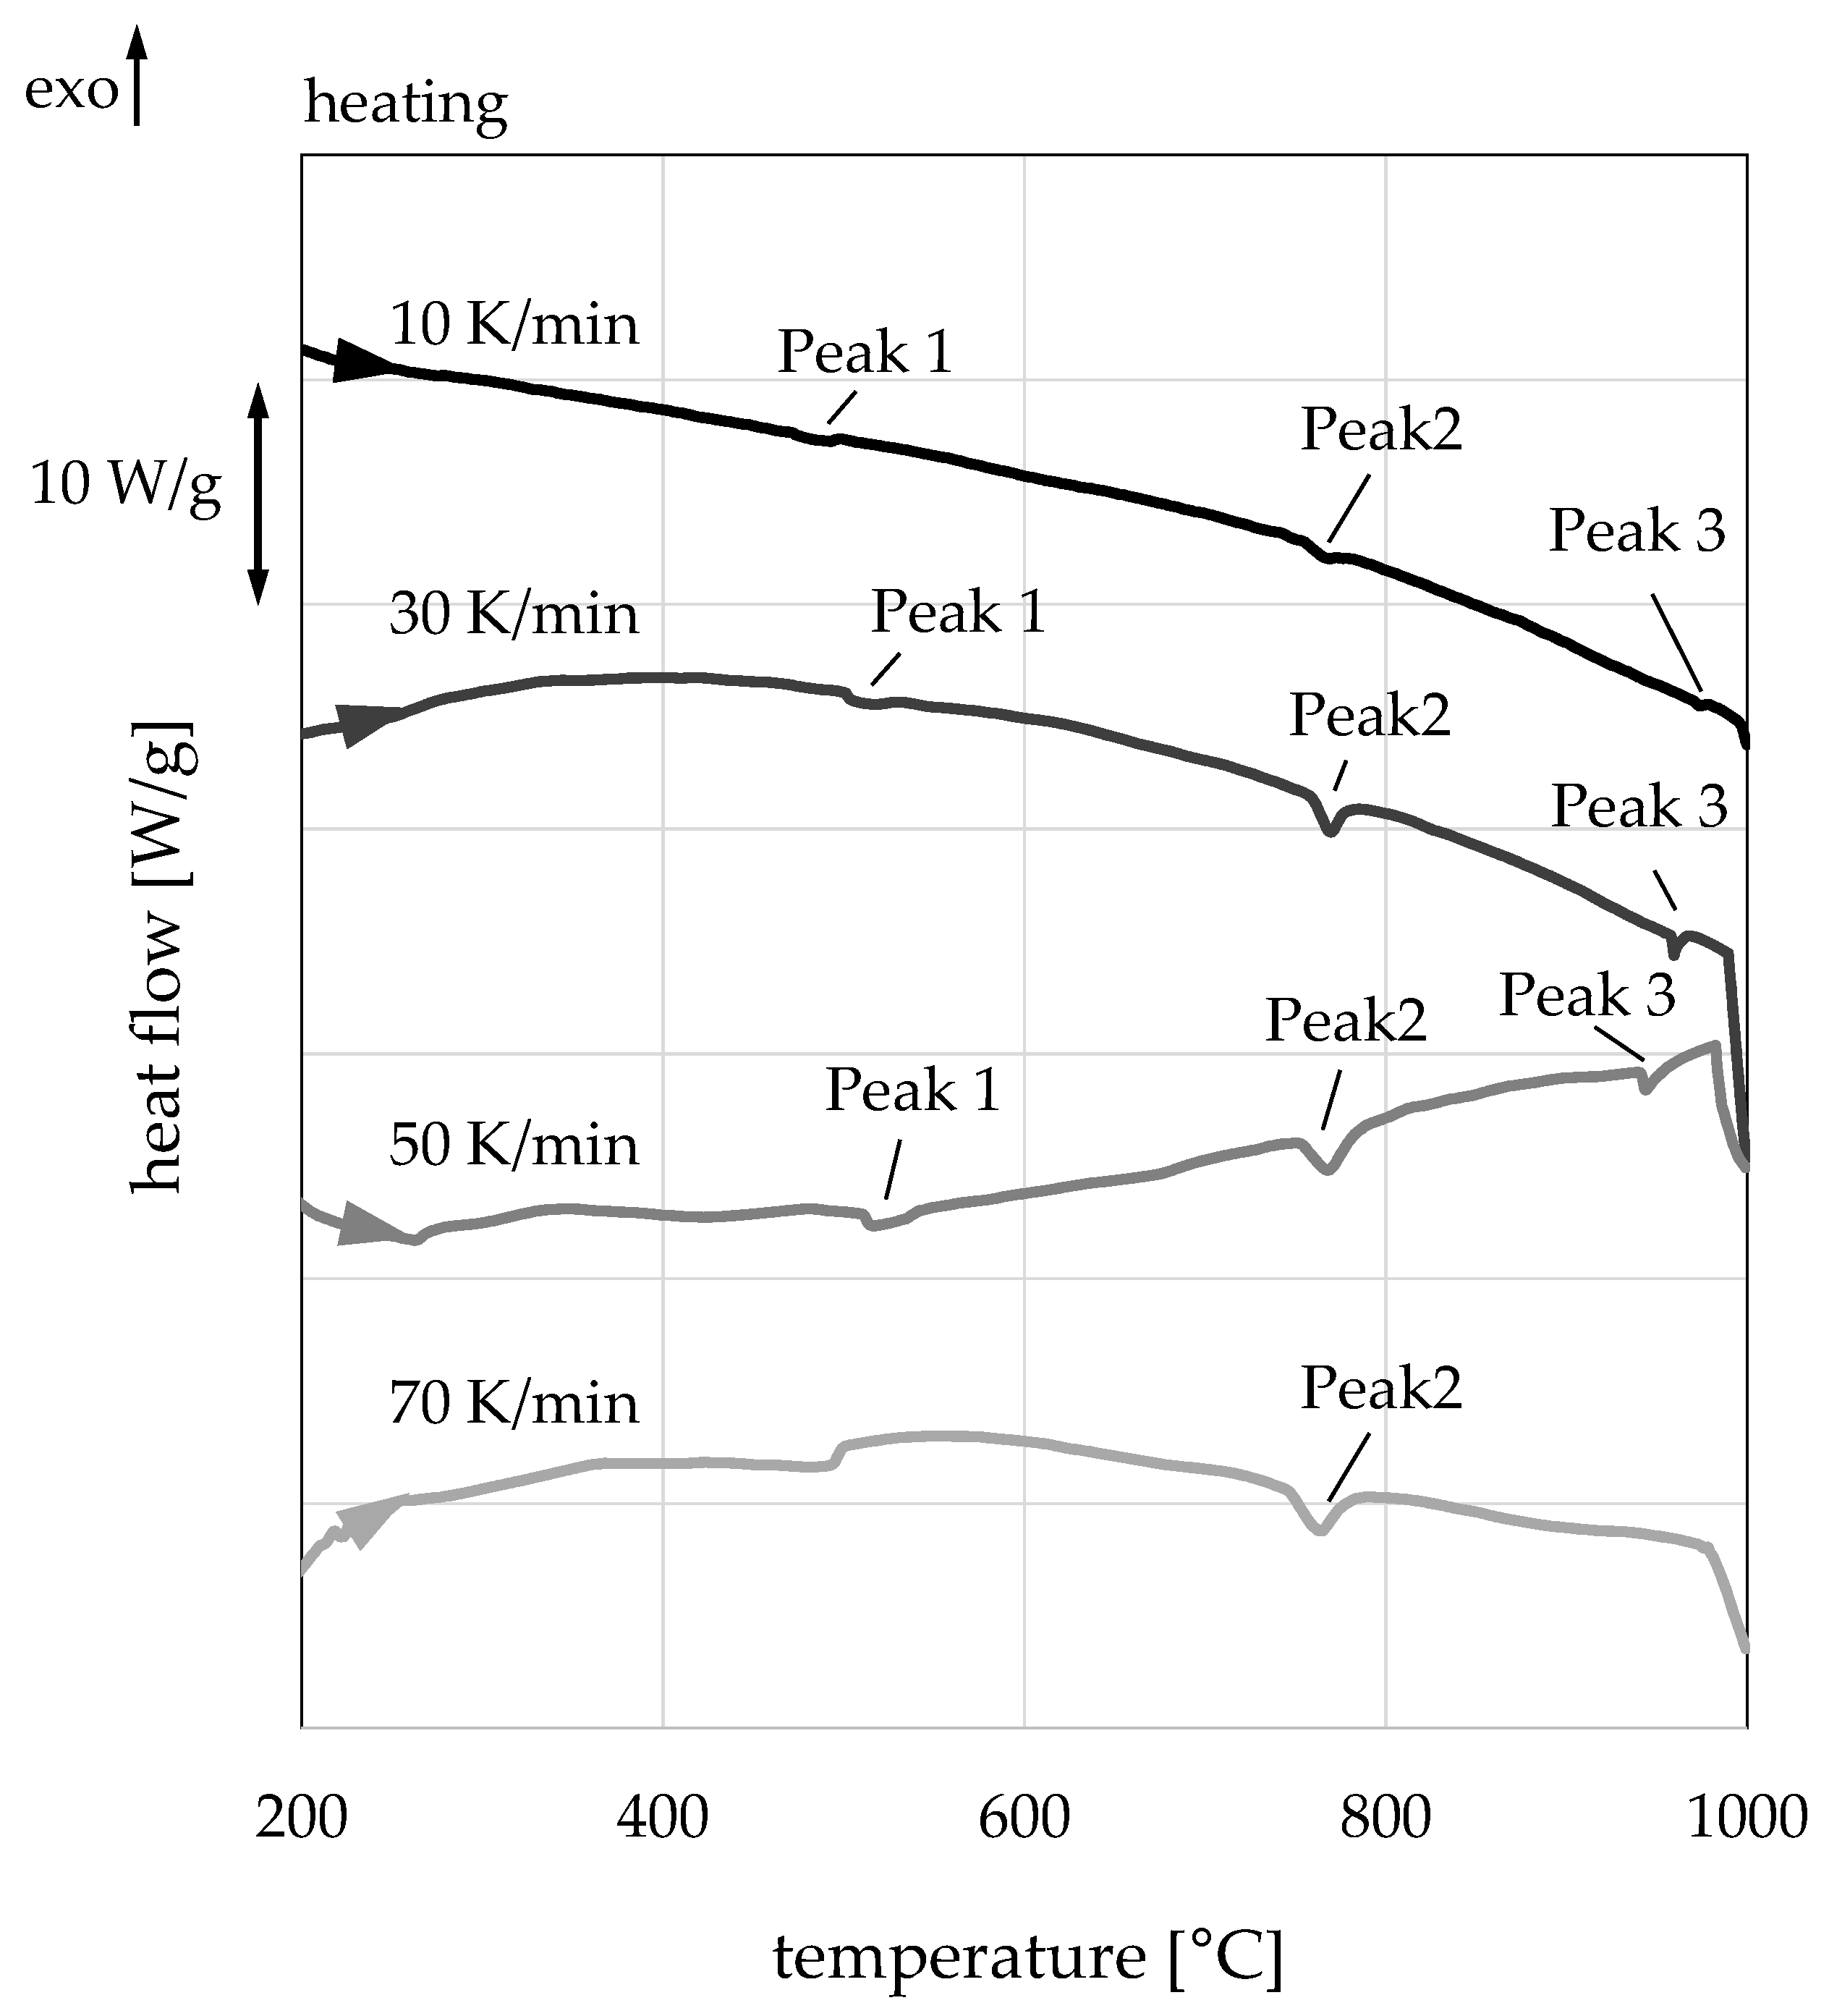
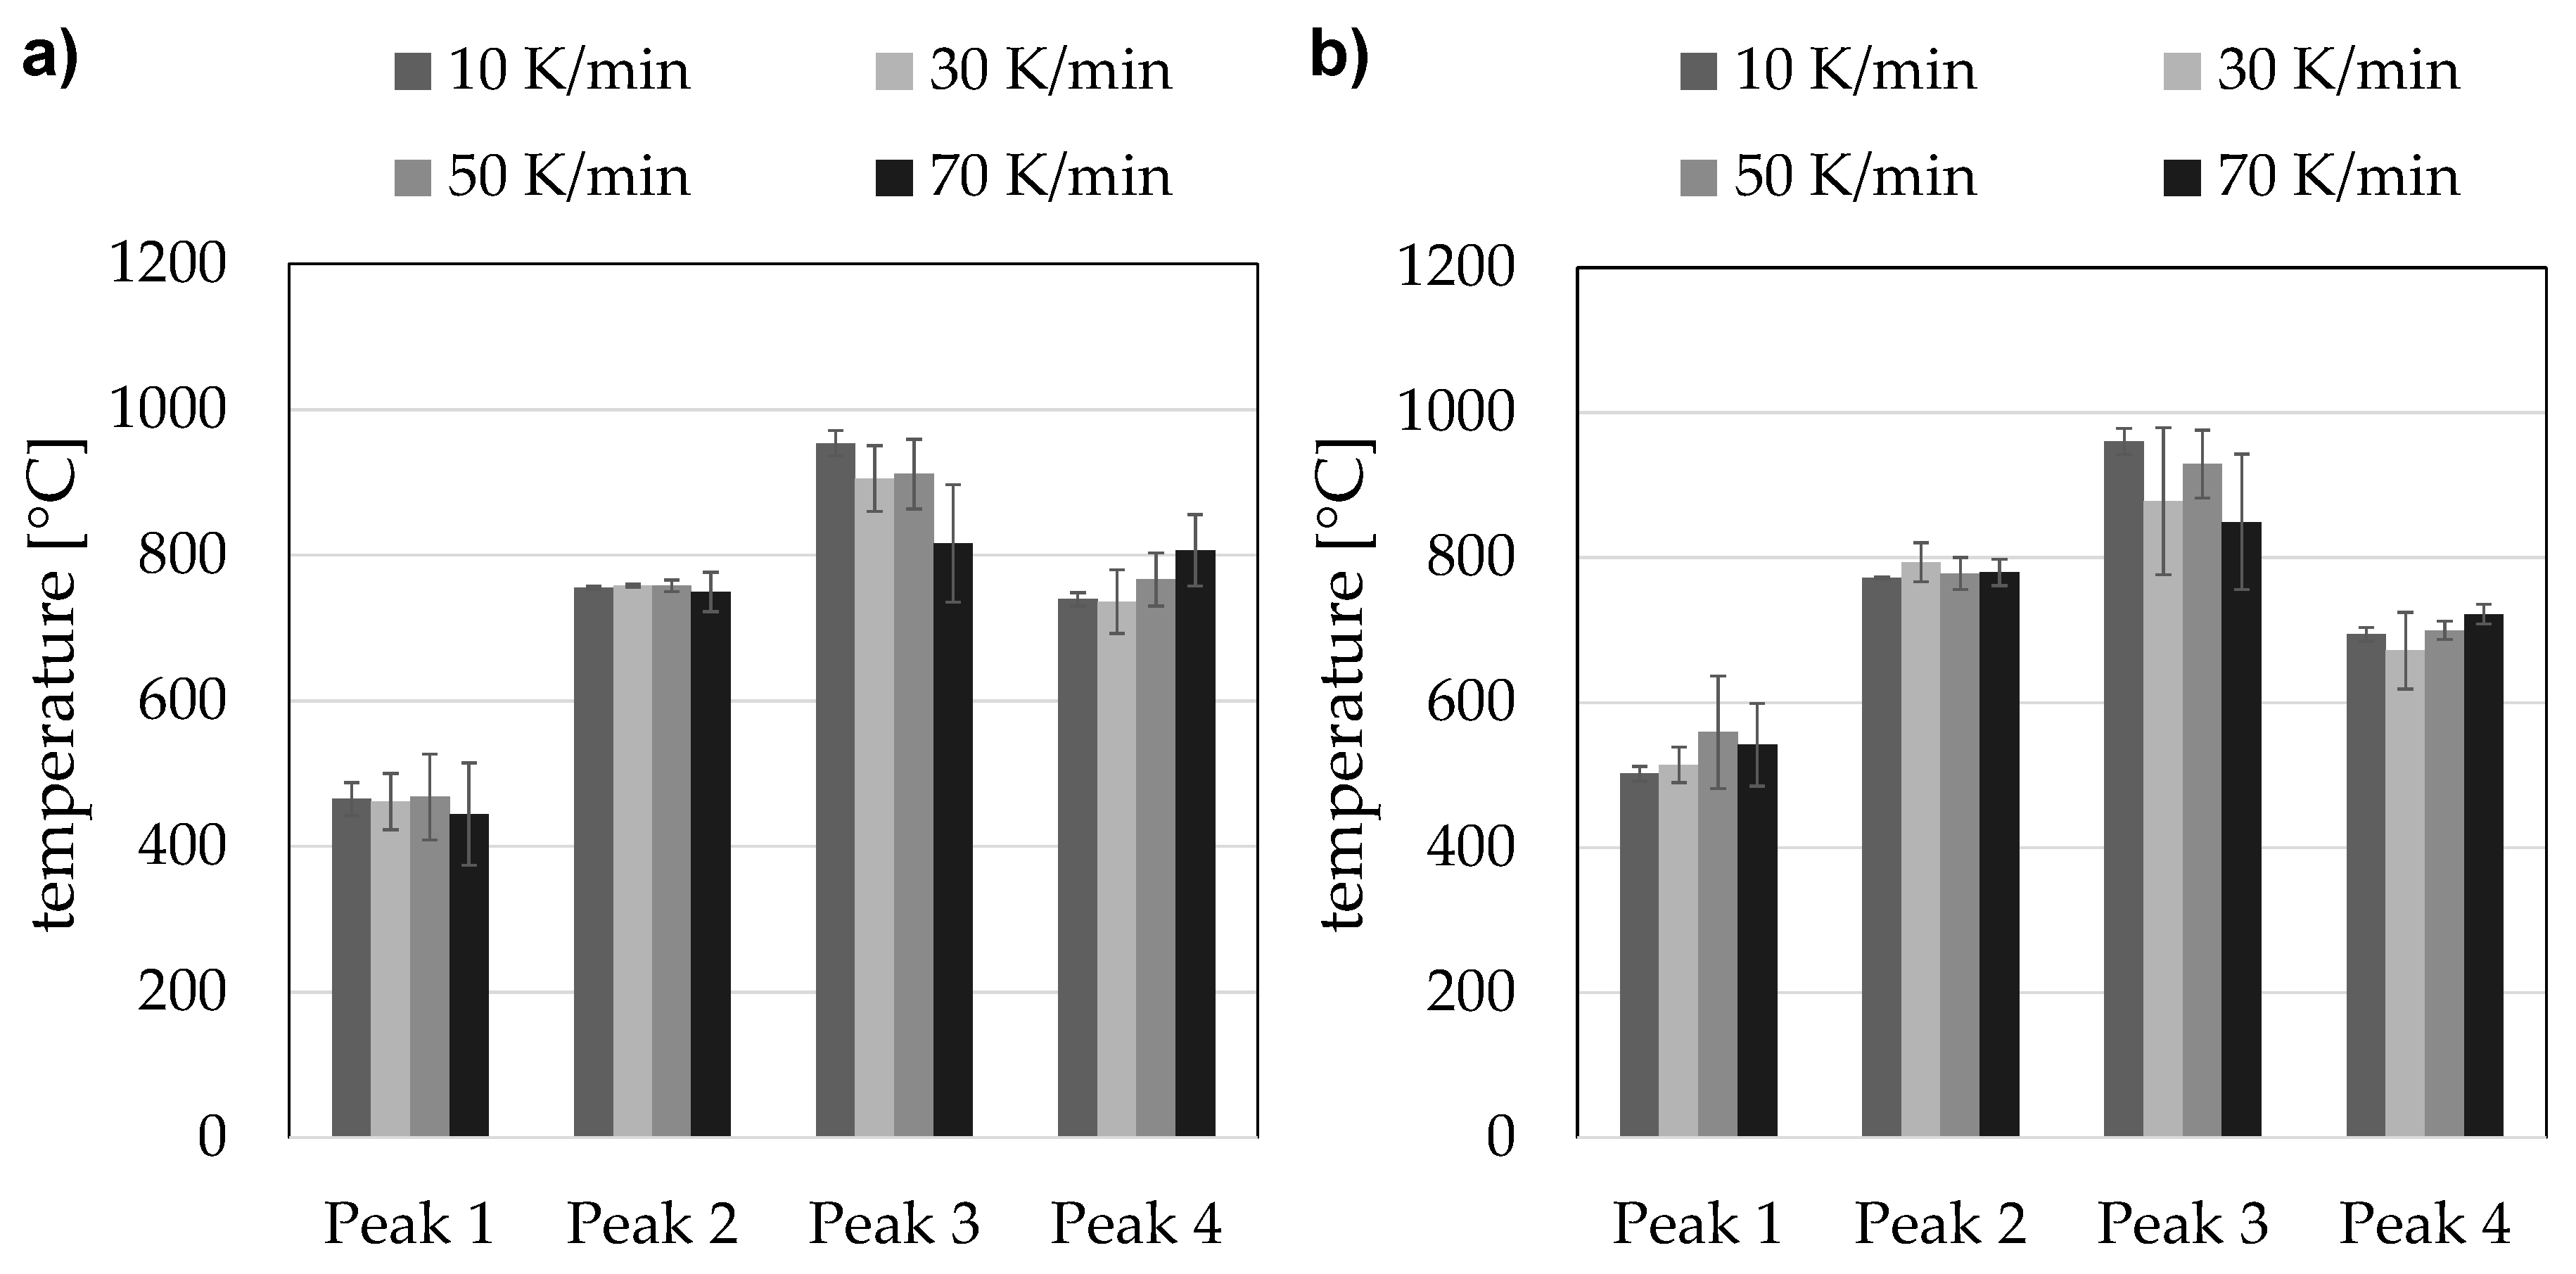
According to the results of the investigations carried out, the critical heating rate for the spherical micro samples is between 50 and 70 K/min. This is mainly due to the maximum sampling rate of ten measured data per second. As the heating rate increases, fewer measured data are taken, reducing accuracy. As a result, some peaks are not displayed correctly, which makes the evaluation of the curves that were recorded at 70 K/min particularly difficult. On all curves except those with a heating rate of 70 K/min, three peaks can be detected. Thus, with the fastest heating rate curve, only A
C1b and A
C1e can be determined. However, these transformation points can be determined at all heating rates, with the lowest standard deviation of maximal 3 °C. DSC results for the start of ferrite into austenite transformation A
C1b are in agreement with the expected temperature of 751 °C shown in the continuous TTA diagram of 100Cr6 for low heating rates [
9]. The changes in intensity of peak 1 can be explained by the amount of retained austenite or the formation of chrome carbides. Due to the slightly different initial microstructure of the micro samples, transformation occurs between 330 and 360 °C during heating.
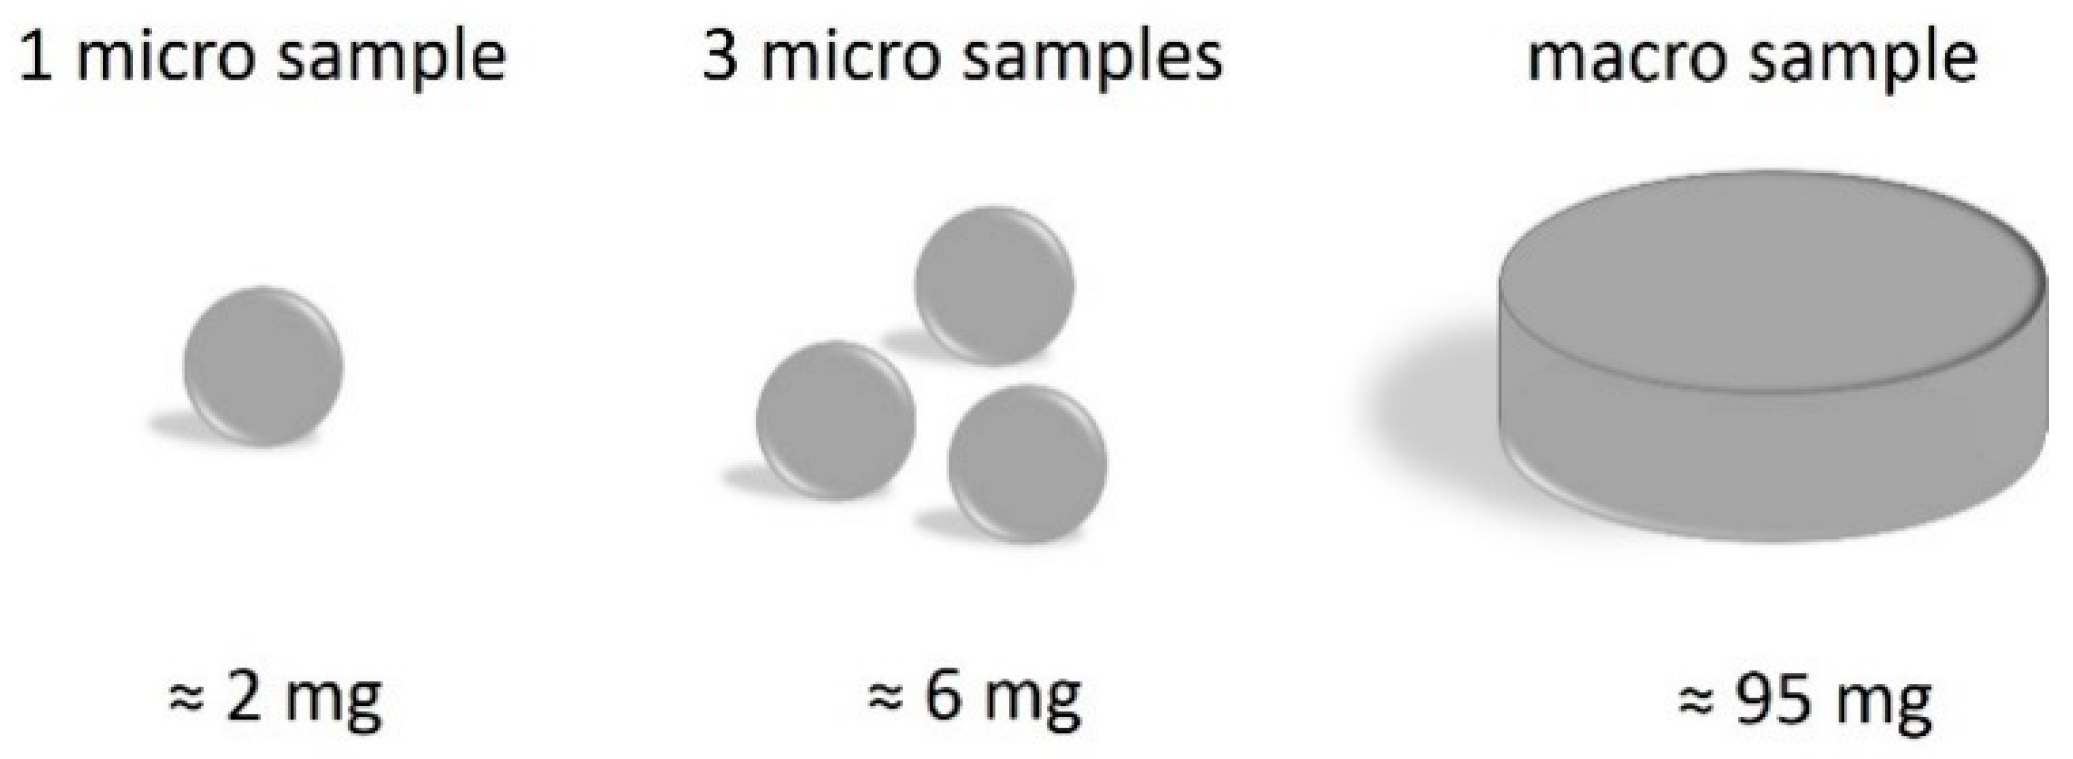
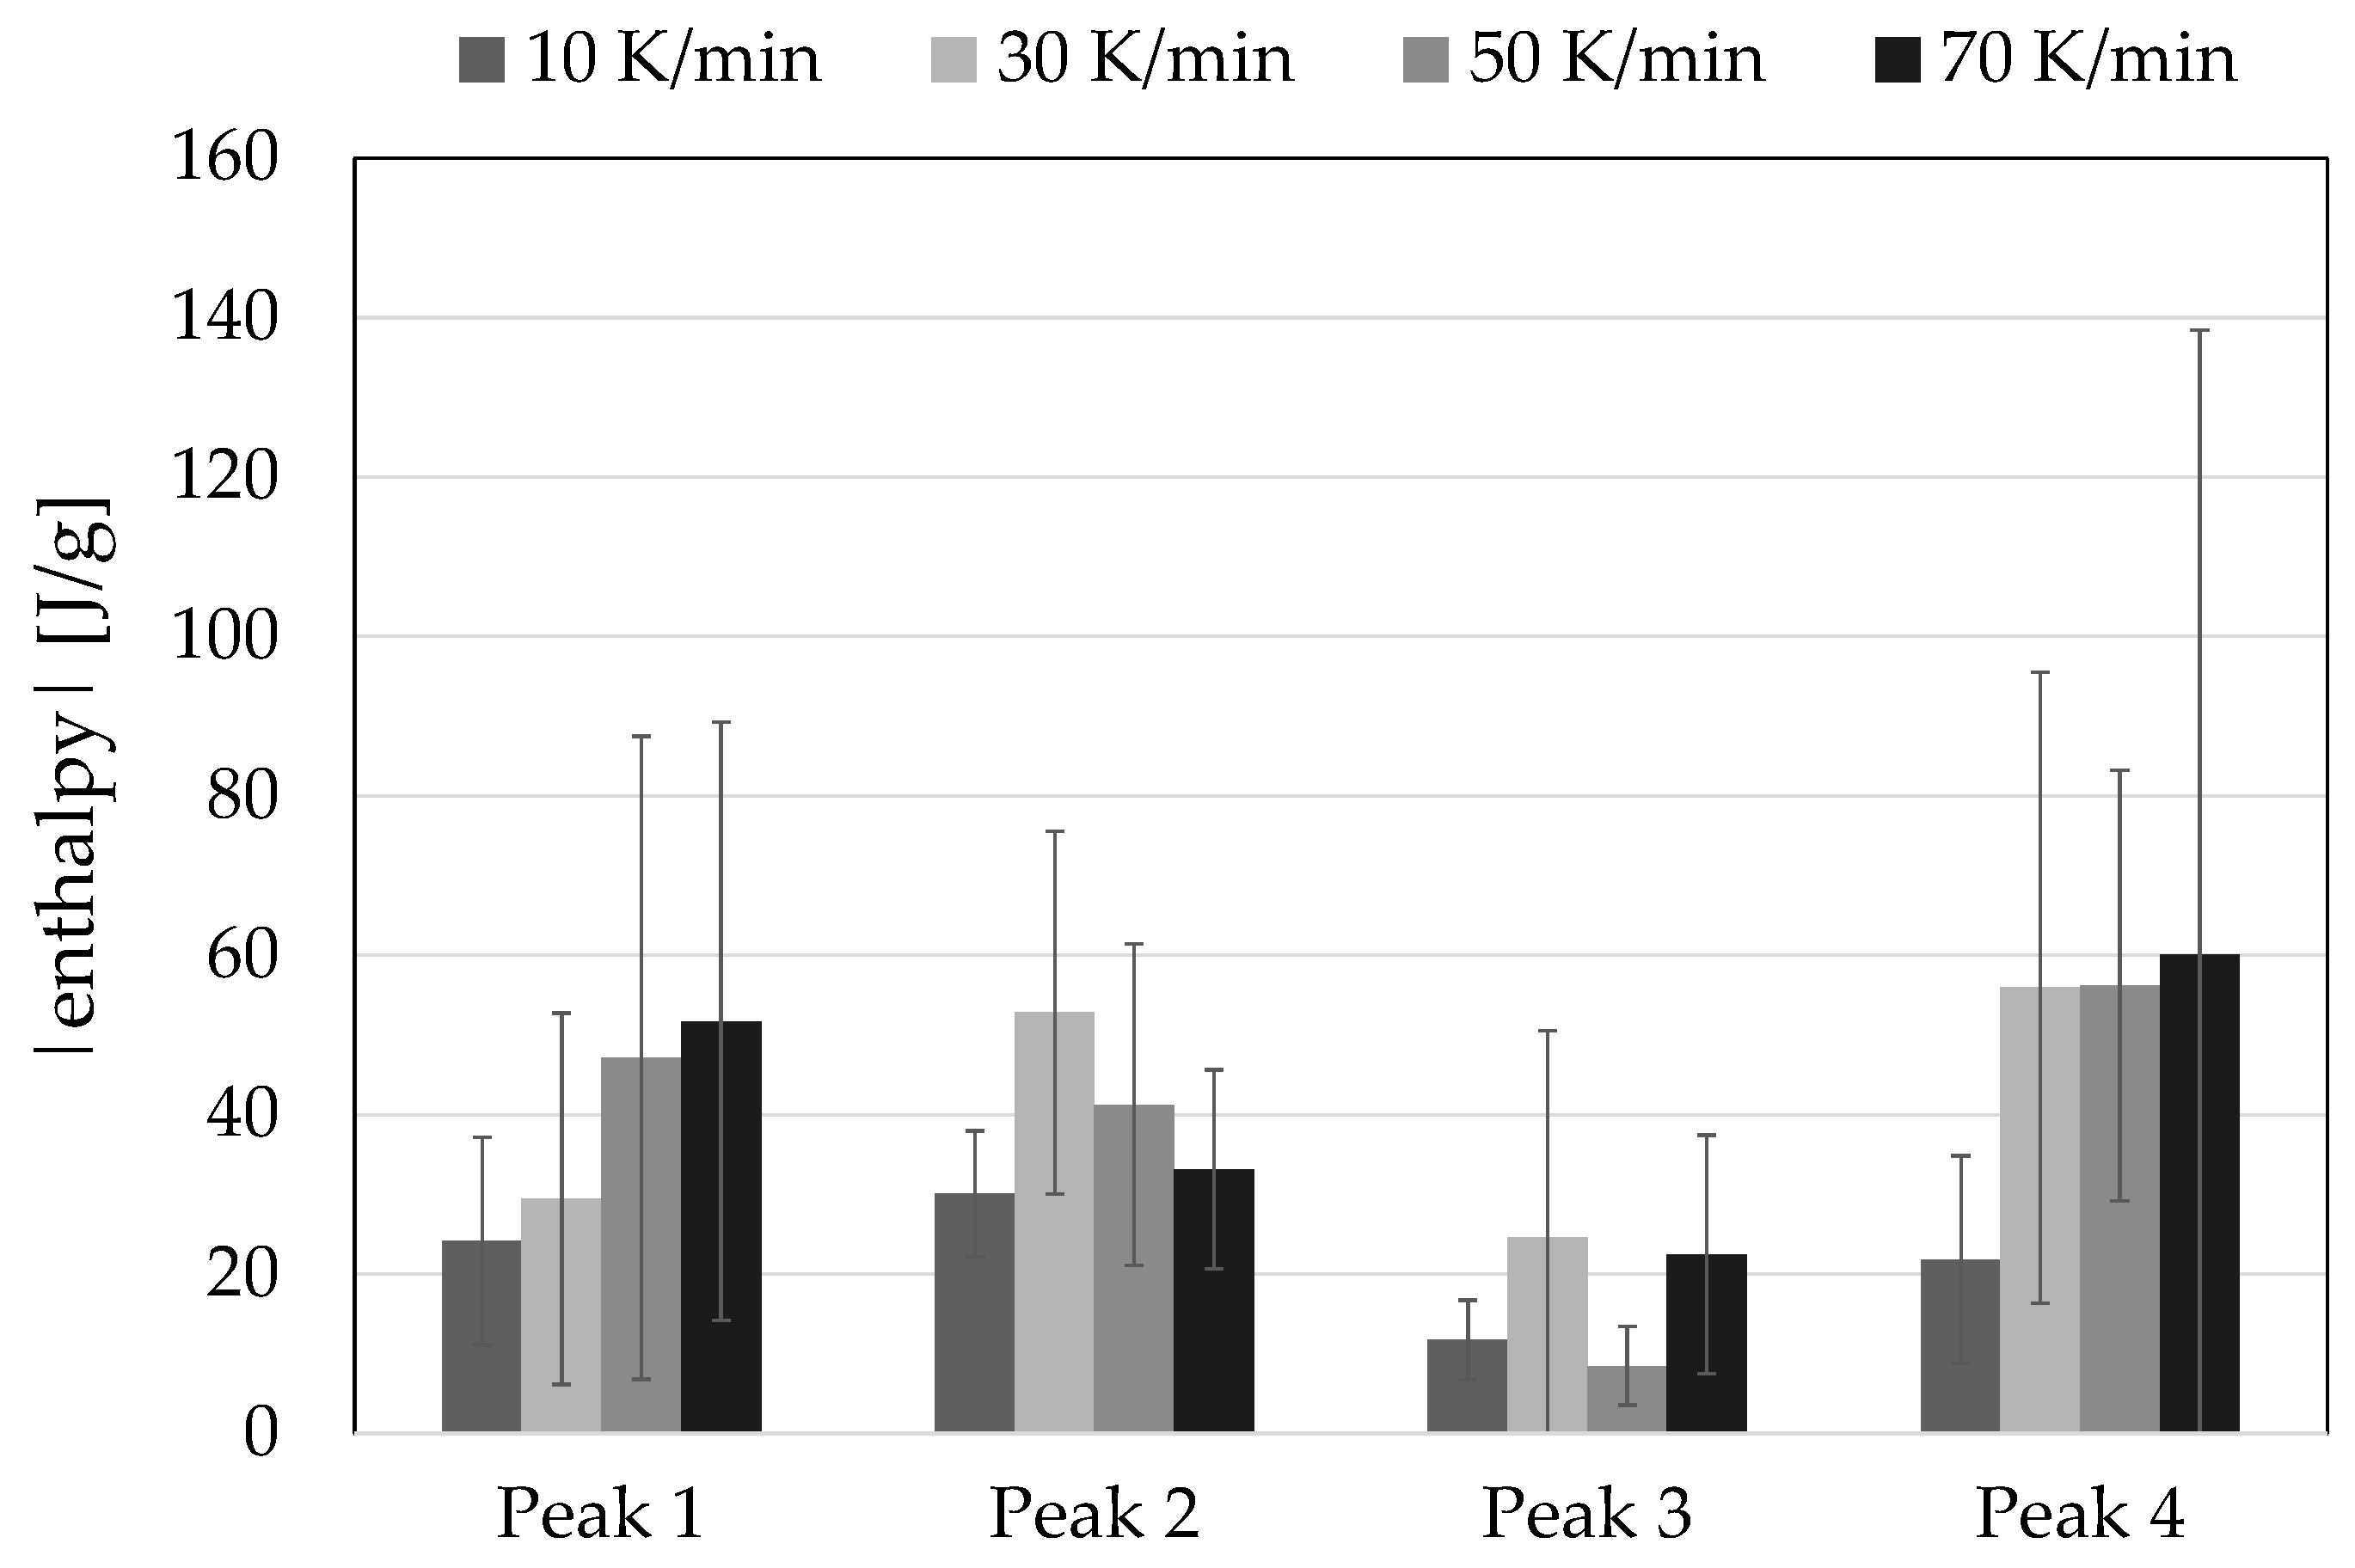
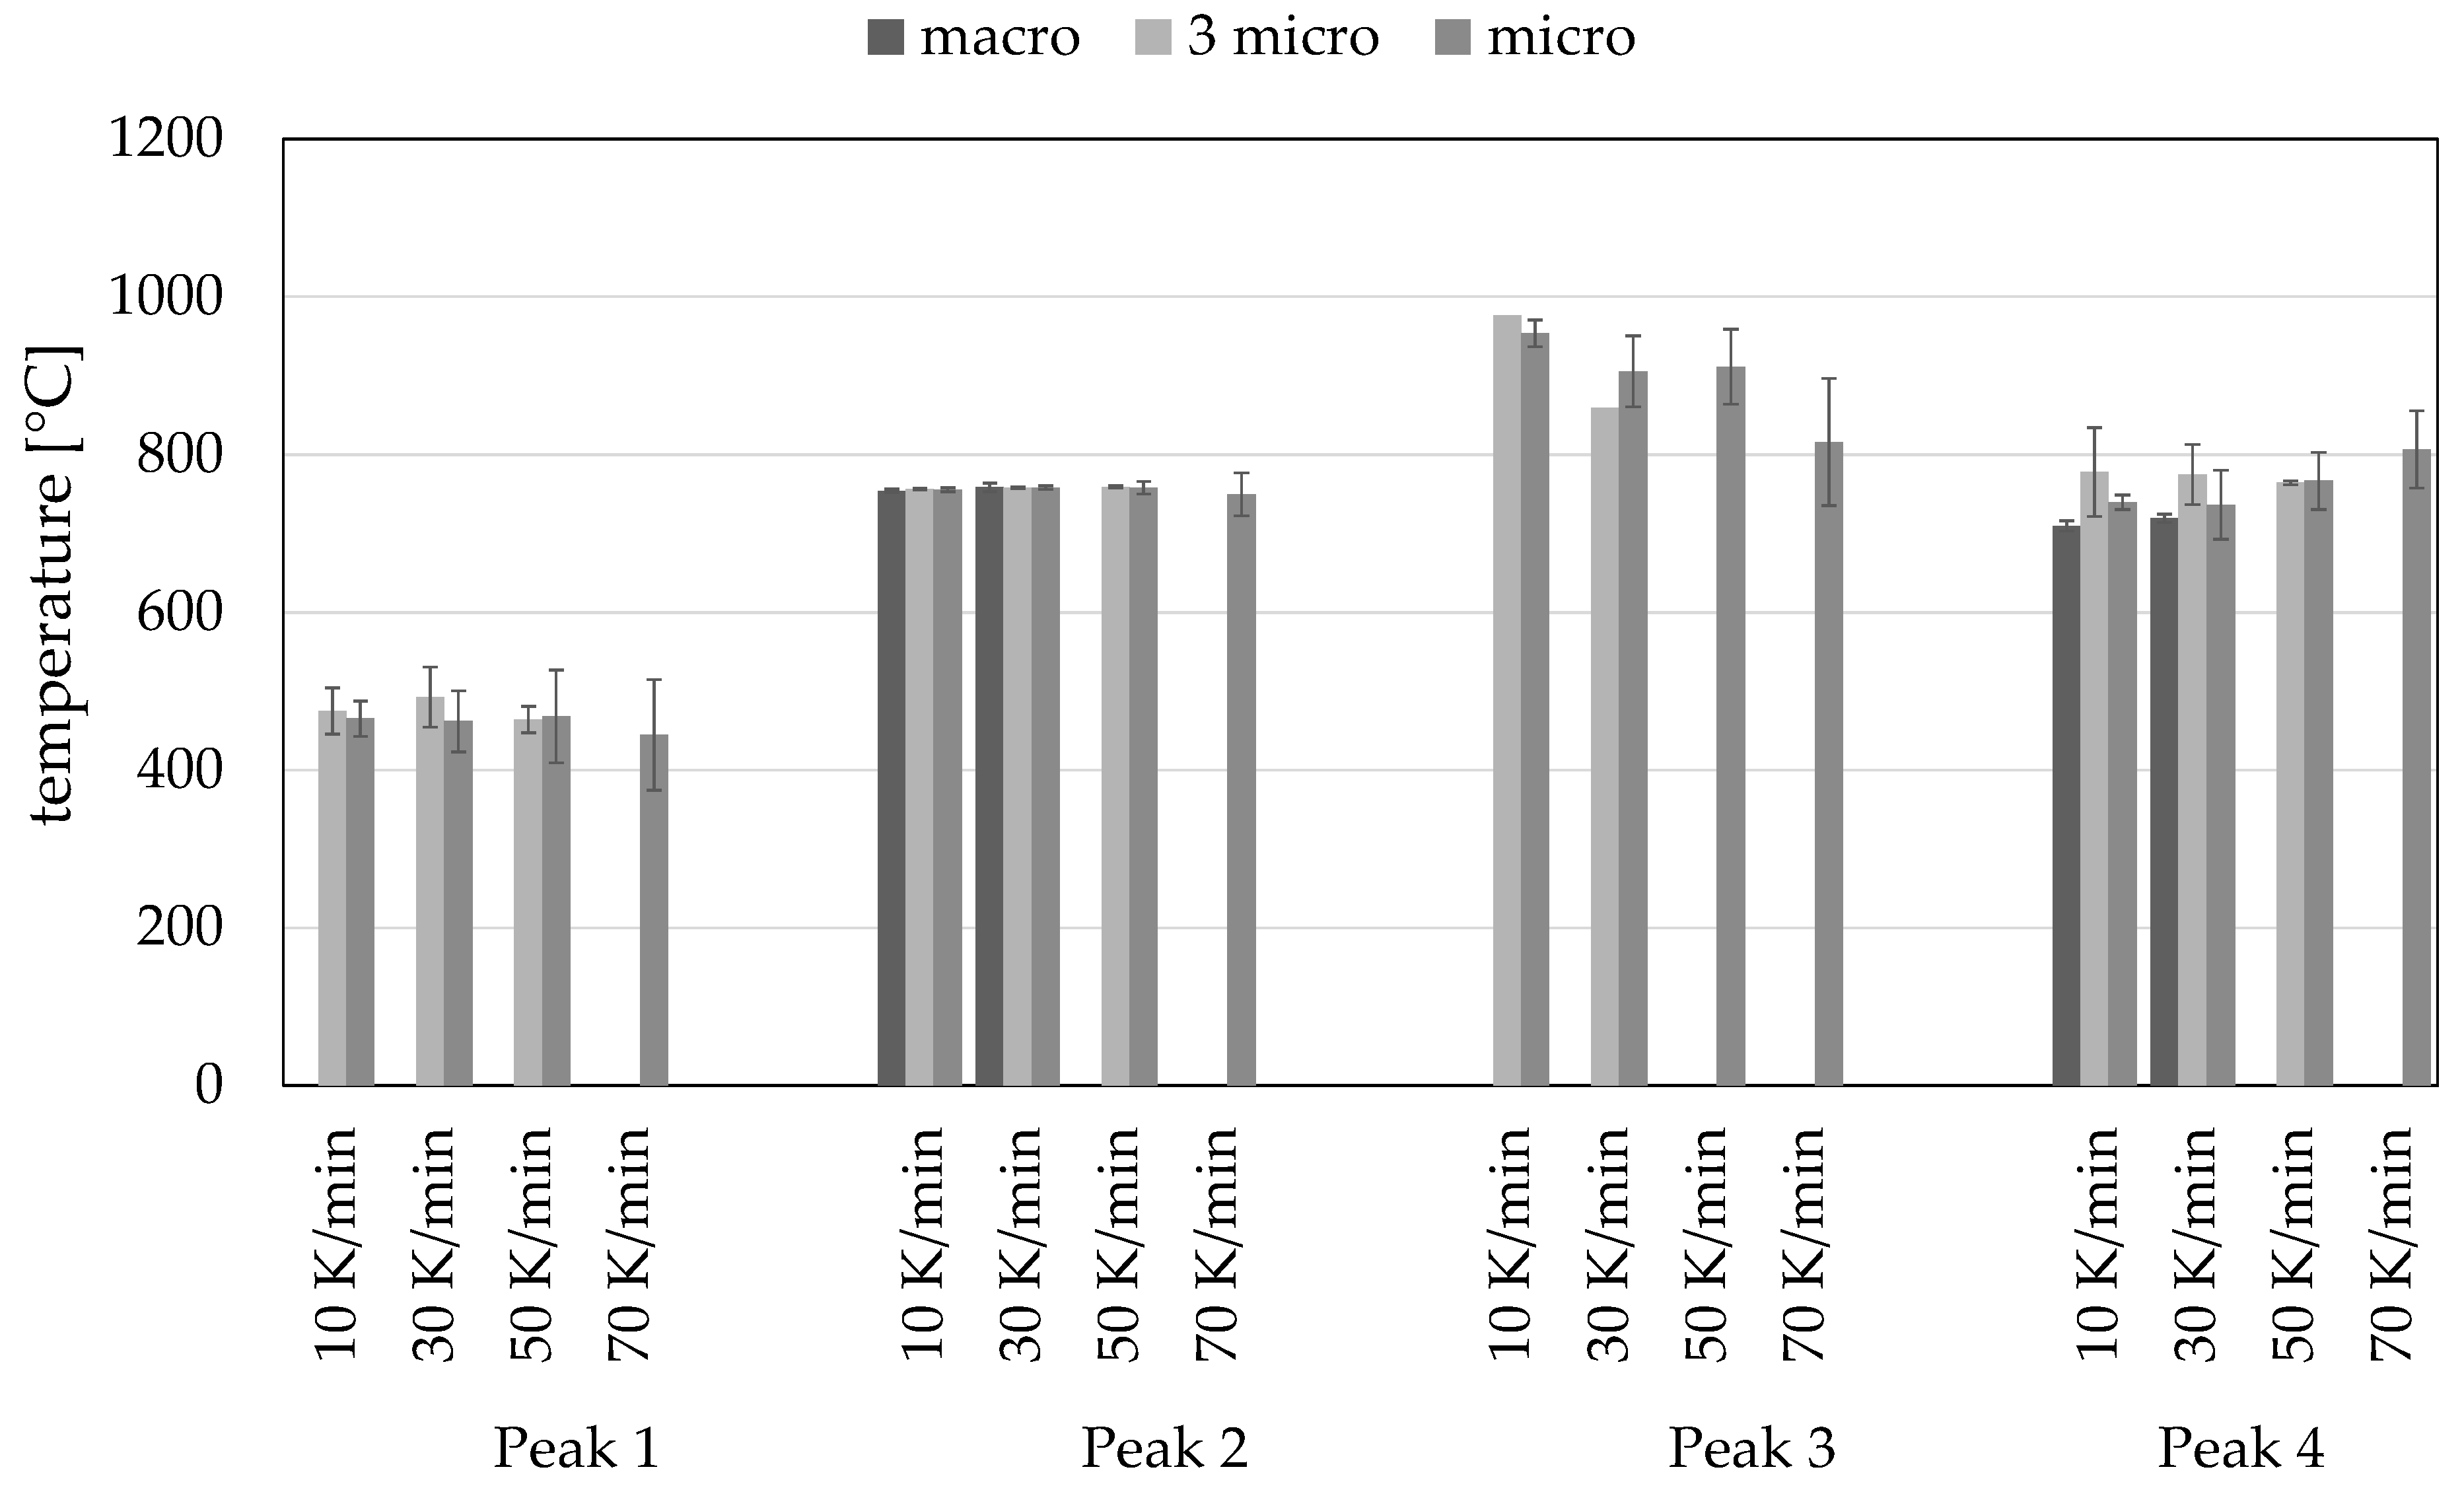
Neither the small mass of the spherical micro samples, nor the point contact with the crucible, have any effect on the accuracy of the measurement of the transformation temperatures. Thus, an increase in the amount and thus also the mass of micro samples from one (2 mg) to three pieces (6 mg) leads to no improvement in accuracy. The results of the measurements on the micro samples are comparable with the measurements on flat macro samples with a mass of about 95 mg. However, the low mass of about 2 mg has an extremely high influence on the reproducibility of the evaluation of the area below the peaks.
After the heat treatment of the micro samples in the DSC, the measured hardness descriptors decrease in comparison to the samples without heat treatment due to the slow cooling rate of 30 K/min, which leads to a ferritic-perlitic microstructure, as no martensitic hardening can be obtained, e.g., the indentation hardness HIT drops from 10.1 GPa for the initial martensitic microstructure to 2.6 GPa after DSC heat treatment with a heating rate of 10 K/min.
UMH measurements provide a very local material characterization depending on the position of indentation and therefore include a high possibility of detecting supposedly opposite information on hardness within one sample. Exemplarily, the indentation hardness H
IT of one micro sample based on 25 measurements after heat treatment in the DSC at a heating rate of 10 K/min varies between 1.79 GPa (minimum value) and 3.29 GPa (maximum value), while the calculated mean is 2.61 GPa (
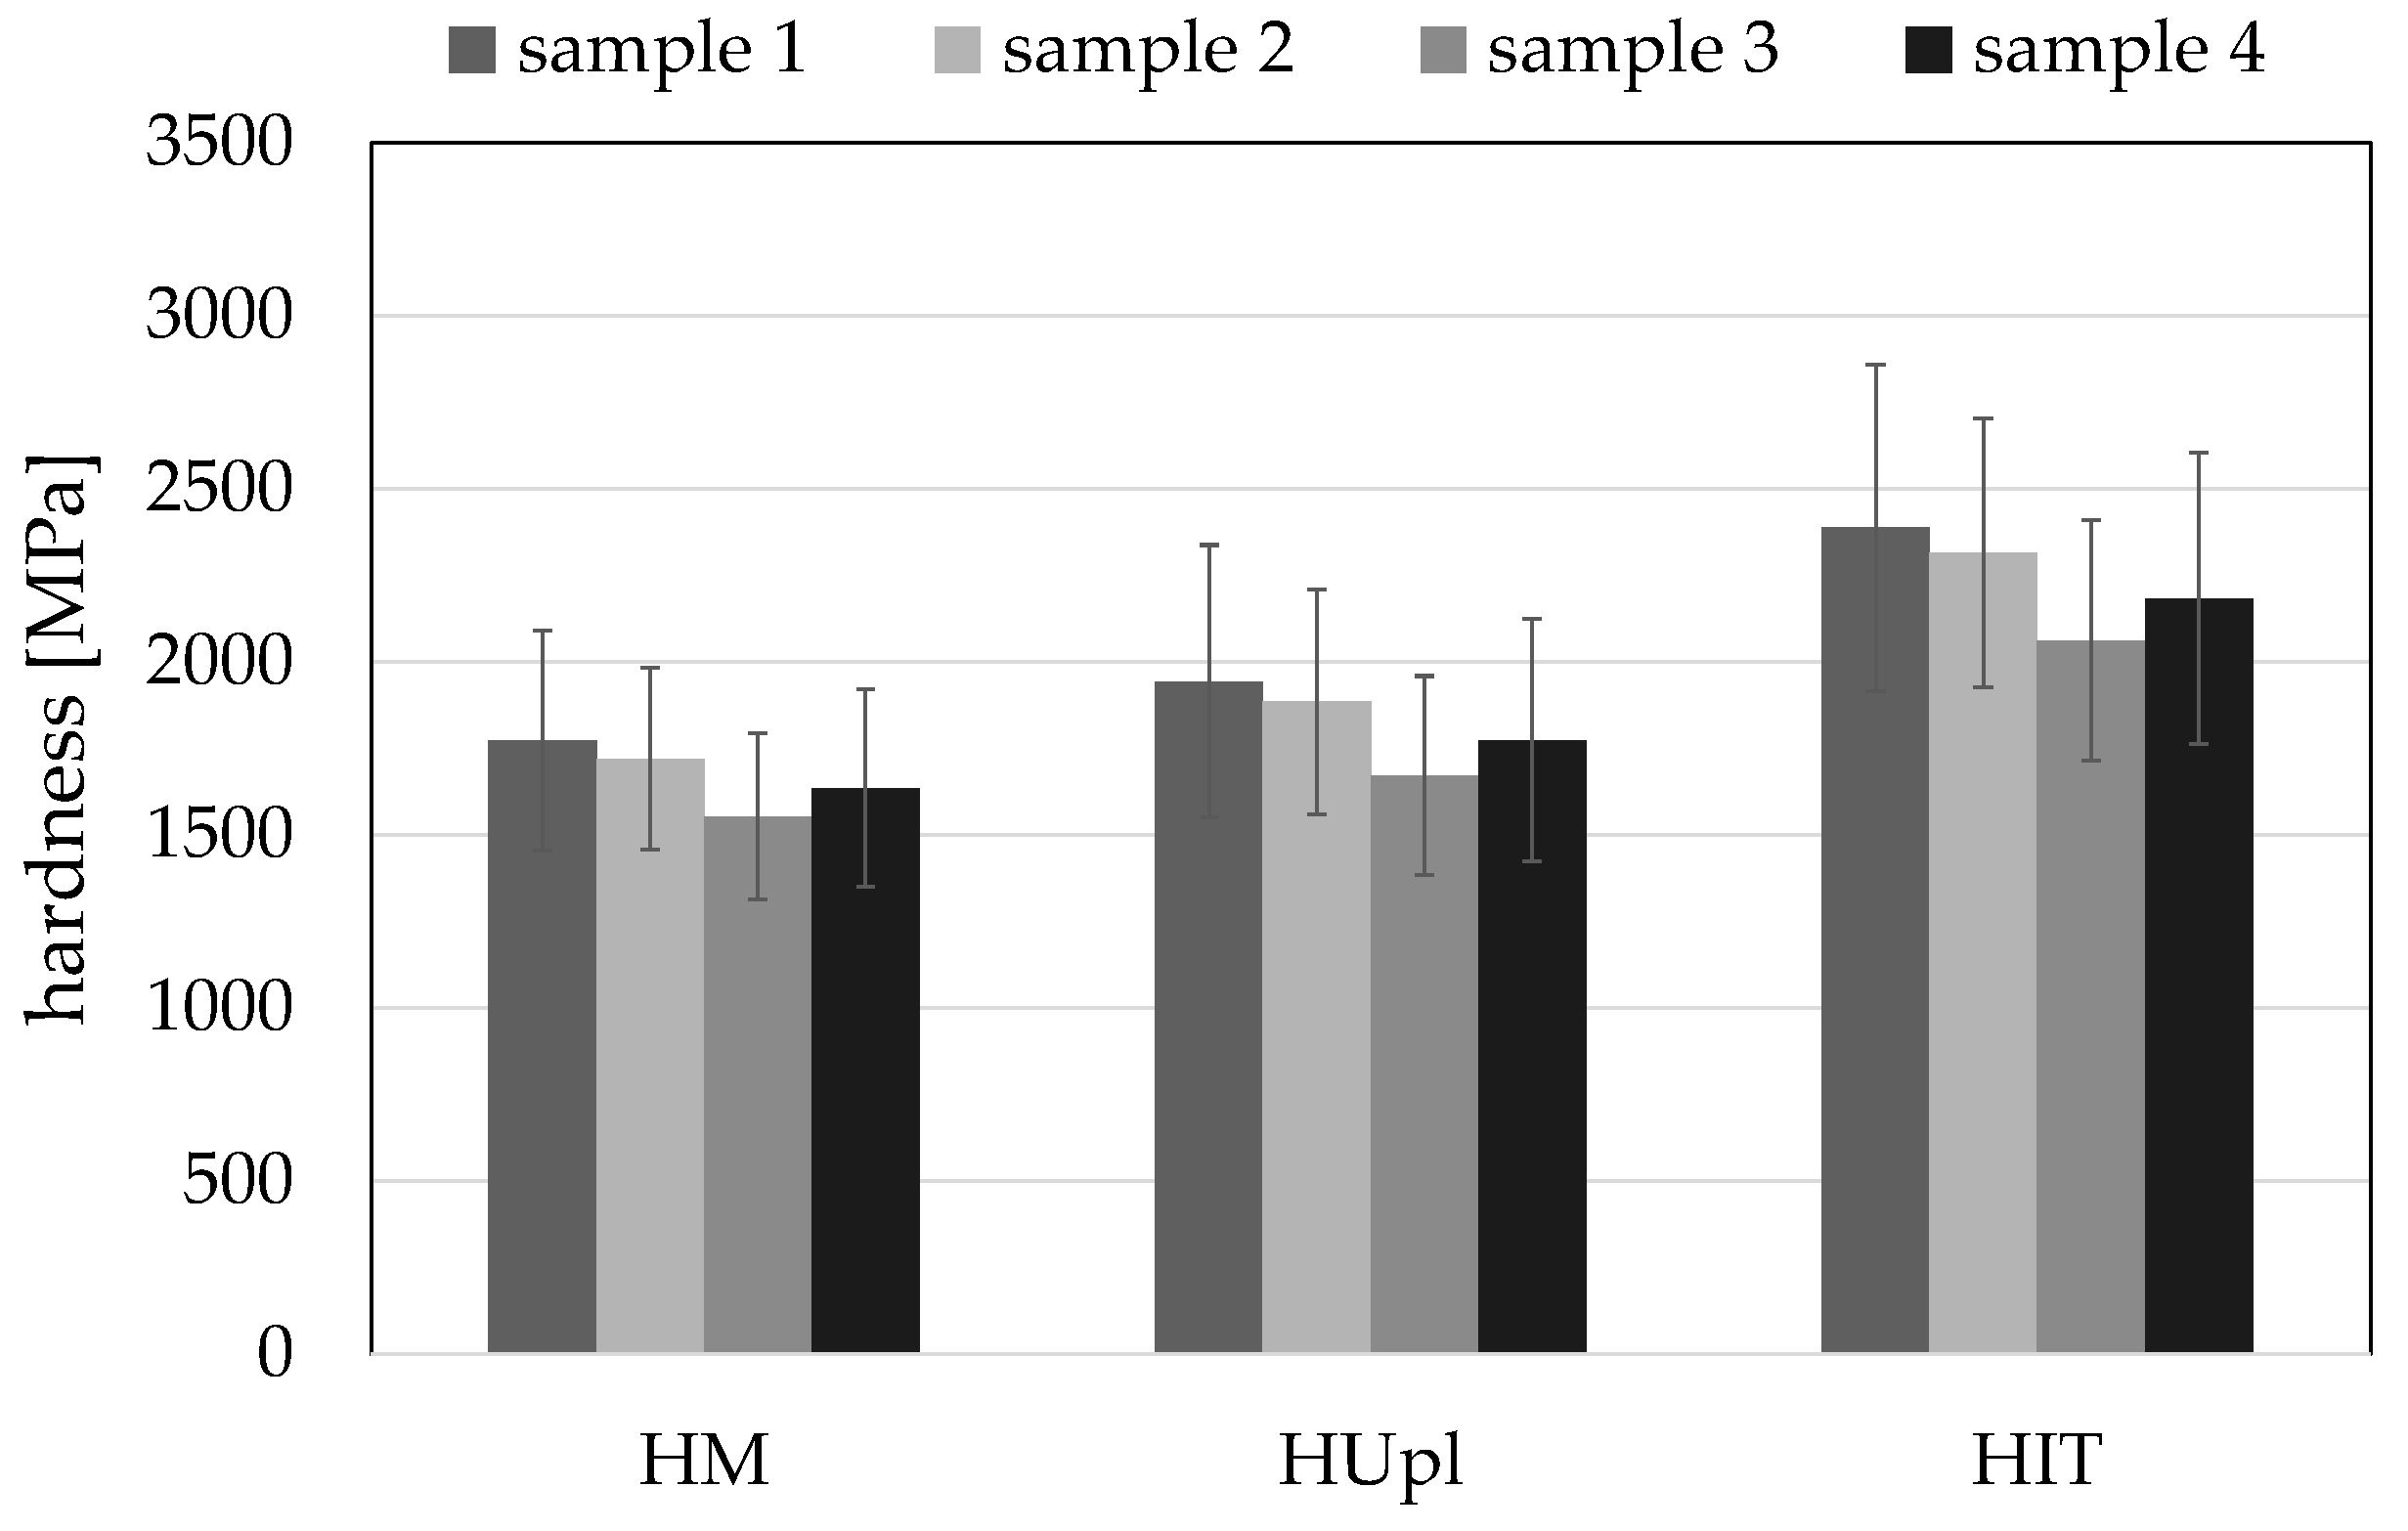
Table 3). Depending on the inspected phase, the indentation hardness can be relatively low for perlite-ferrite on the one hand and very high for precipitated carbides on the other. Since the microstructure of the micro samples shows a high occurrence of carbides the scattering is expected to be high. Despite the high standard deviations for UMH measurements of one micro sample (
Figure 8), comparability between several samples is ensured by the low standard deviations of the averaged mean value, which underlines the validity of the method.
The hardness varies only slightly between the two investigated heating rates of 10 K/min and 30 K/min, which is due to the constant holding time of 20 min after heating and the resulting approximately equal diffusion time. Therefore, as expected, the main influence on the hardness is not the heating rate, but the cooling rate during the heat treatment. Nevertheless, a tendency towards lower hardness descriptor values with increasing heating rate is noticed. In comparison, micro samples with their low weight are more sensitive to accelerations of heating speeds than macro samples. The relative change of indentation hardness
HIT is ten times higher than for macro samples (
Figure 10b).
Author Contributions
A.T. performed DSC experiments and wrote the paper by the aid of H.S. in questions of UMH and C.P. in questions of data analysis. A.v.H. and R.D. supervised all investigations and supported with their expert knowledge. The CRC 1232 ‘Farbige Zustände’ contributed the investigated materials.
Funding
This research was funded by the German Research Foundation (DFG).
Acknowledgments
Financial support of subprojects U03 “Thermal and thermomechanical heat treatment”, D01 “Qualification of material conditions with mechanical and physical measuring methods” and P02 “Heuristic, statistical and analytical experimental design” of the Collaborative Research Center CRC 1232 by the Deutsche Forschungsgemeinschaft (DFG, German Research Foundation)—project number 276397488—SFB 1232 is gratefully acknowledged.
Conflicts of Interest
The authors declare no conflict of interest.
References
- Ellendt, N.; Ciftci, N.; Goodreau, C.; Uhlenwinkel, V.; Mädler, L. Solidification of single droplets under combined cooling conditions. IOP Conf. Ser. Mater. Sci. Eng. 2016, 117, 012057. [Google Scholar] [CrossRef]
- Drechsler, R.; Eggersglüß, S.; Ellendt, N.; Huhn, S.; Mädler, L. Exploring Superior Structural Materials Using Multi-Objective Optimization and Formal Techniques. In Proceedings of the 6th IEEE International Symposium on Embedded Computing and System Design, Patna, India, 15–17 December 2016. [Google Scholar]
- Ellendt, N.; Mädler, L. High-Throughput Exploration of Evolutionary Structural Materials. HTM J. Heat Treat. Mat. 2018, 73, 3–12. [Google Scholar] [CrossRef]
- Morra, P.V.; Böttger, A.J.; Mittemeijer, E.J. Decomposition of iron-based martensite—A kinetic analysis by means of DSC and dilatometry. J. Therm. Anal. Calorim. 2001, 64, 905–914. [Google Scholar] [CrossRef]
- Keßler, O.; Milkereit, B.; Schick, C. Zeit-Temperatur-Auflösungs- und Zeit-Temperatur-Ausscheidungs-Diagramme von Aluminiumlegierungen. Fortschritte in der Metallographie 2012, 44, 3–12. [Google Scholar]
- Lucca, D.A.; Herrmann, K.; Klopfstein, M.J. Nanoindentation: Measuring methods and applications. CIRP Ann. Manuf. Technol. 2010, 59, 803–819. [Google Scholar] [CrossRef]
- Frick, A.; Stern, C. DSC-Prüfung in der Anwendung, 2nd ed.; Carl Hanser Verlag: München, Germany, 2013; pp. 45, 49–51. [Google Scholar]
- Cramer, L.; Toenjes, A.; Steinbacher, M.; von Hehl, A.; Zoch, H. Dilatometric and Calorimetric Short-Term Characterization Methods on 100Cr6 Micro Samples for High-Throughput Investigations. Adv. Eng. Mater. 2018. [Google Scholar] [CrossRef]
- Orlich, J.; Rose, A.; Wiest, P. Zeit-Temperatur-Austenitisierung Schaubilder. In Atlas zur Wärmebehandlung der Stähle; Verlag Stahleisen m.b.H.: Düsseldorf, Germany, 1973; Volume 3. [Google Scholar]
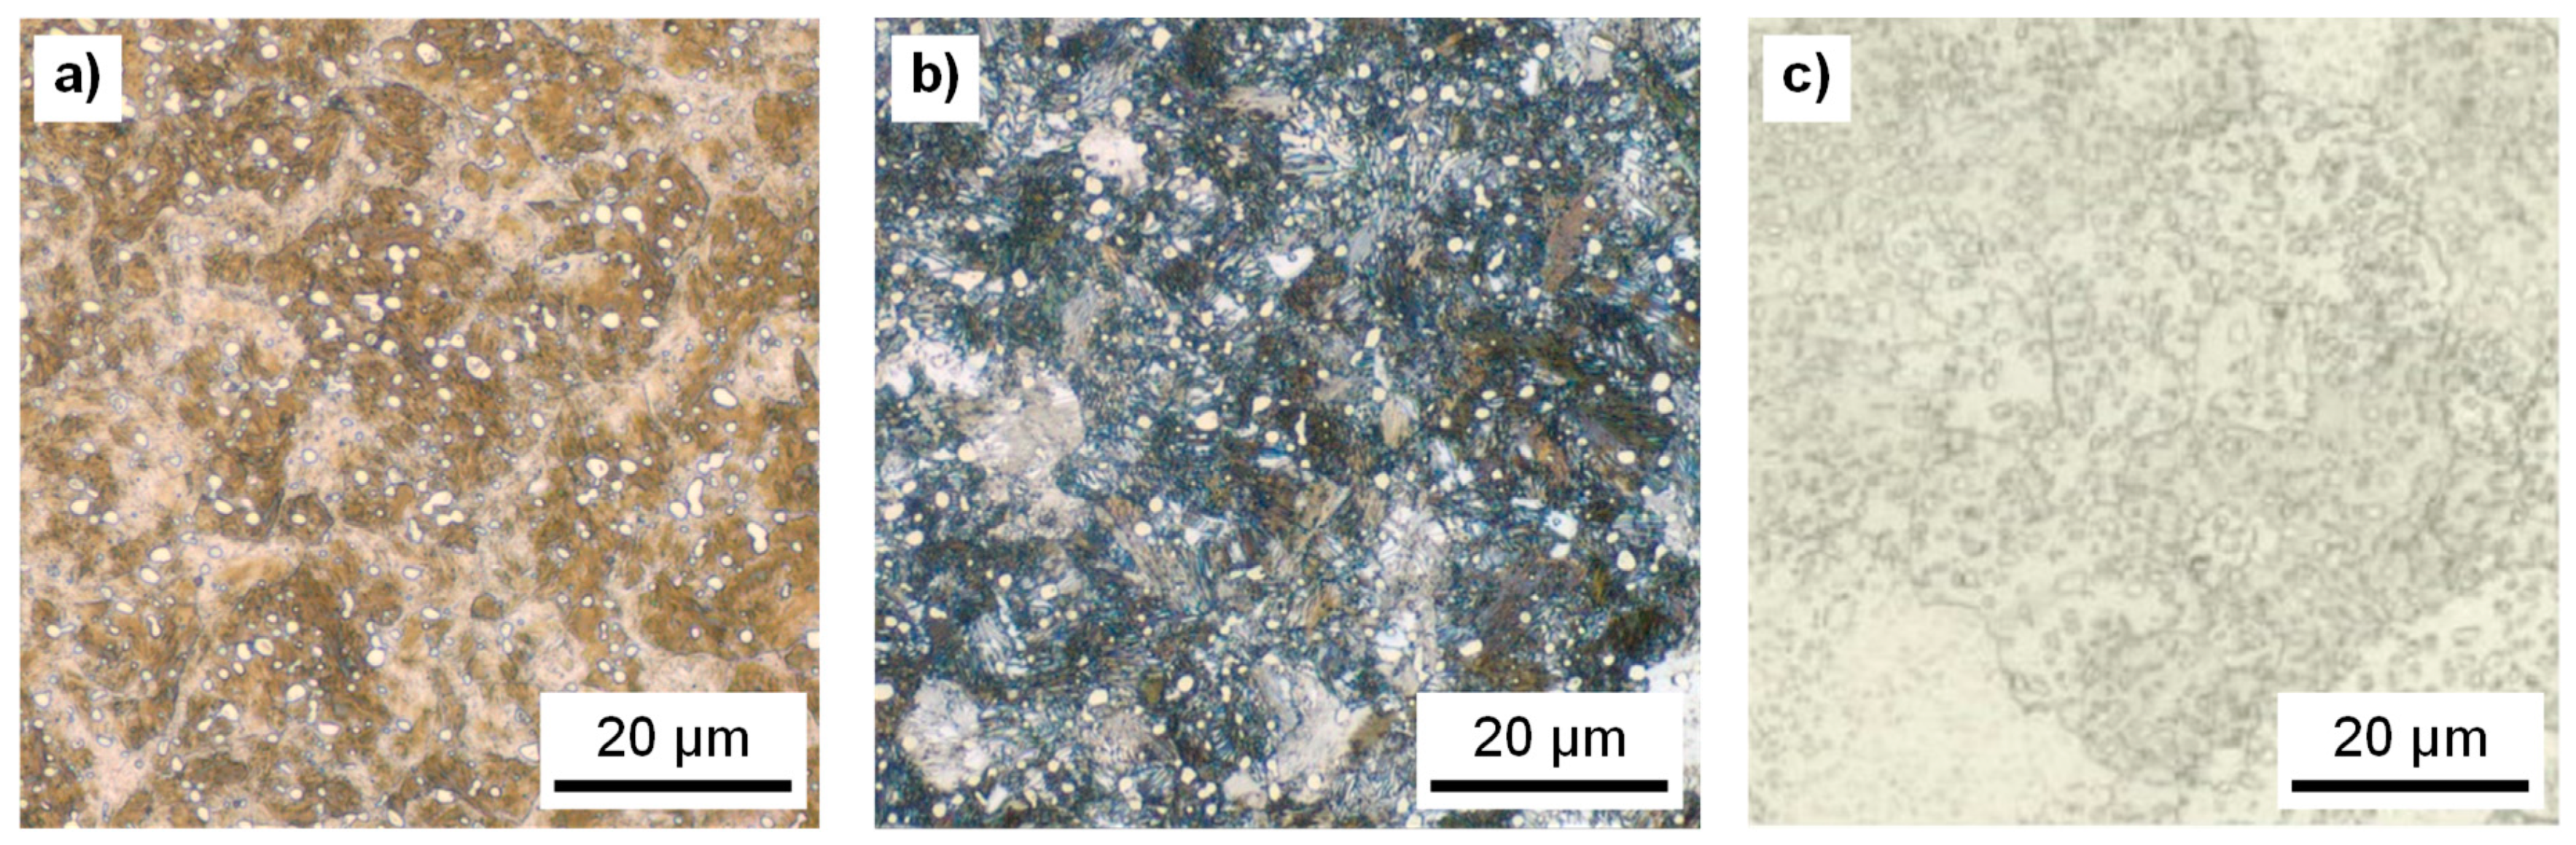
Figure 1.
Microstructure of: (a) micro samples after roller ball production process; (b) micro samples after heat treatment; (c) macro samples; etched 25–30 s in 3% alcoholic HNO3, all equatorial respectively longitudinal cut images.
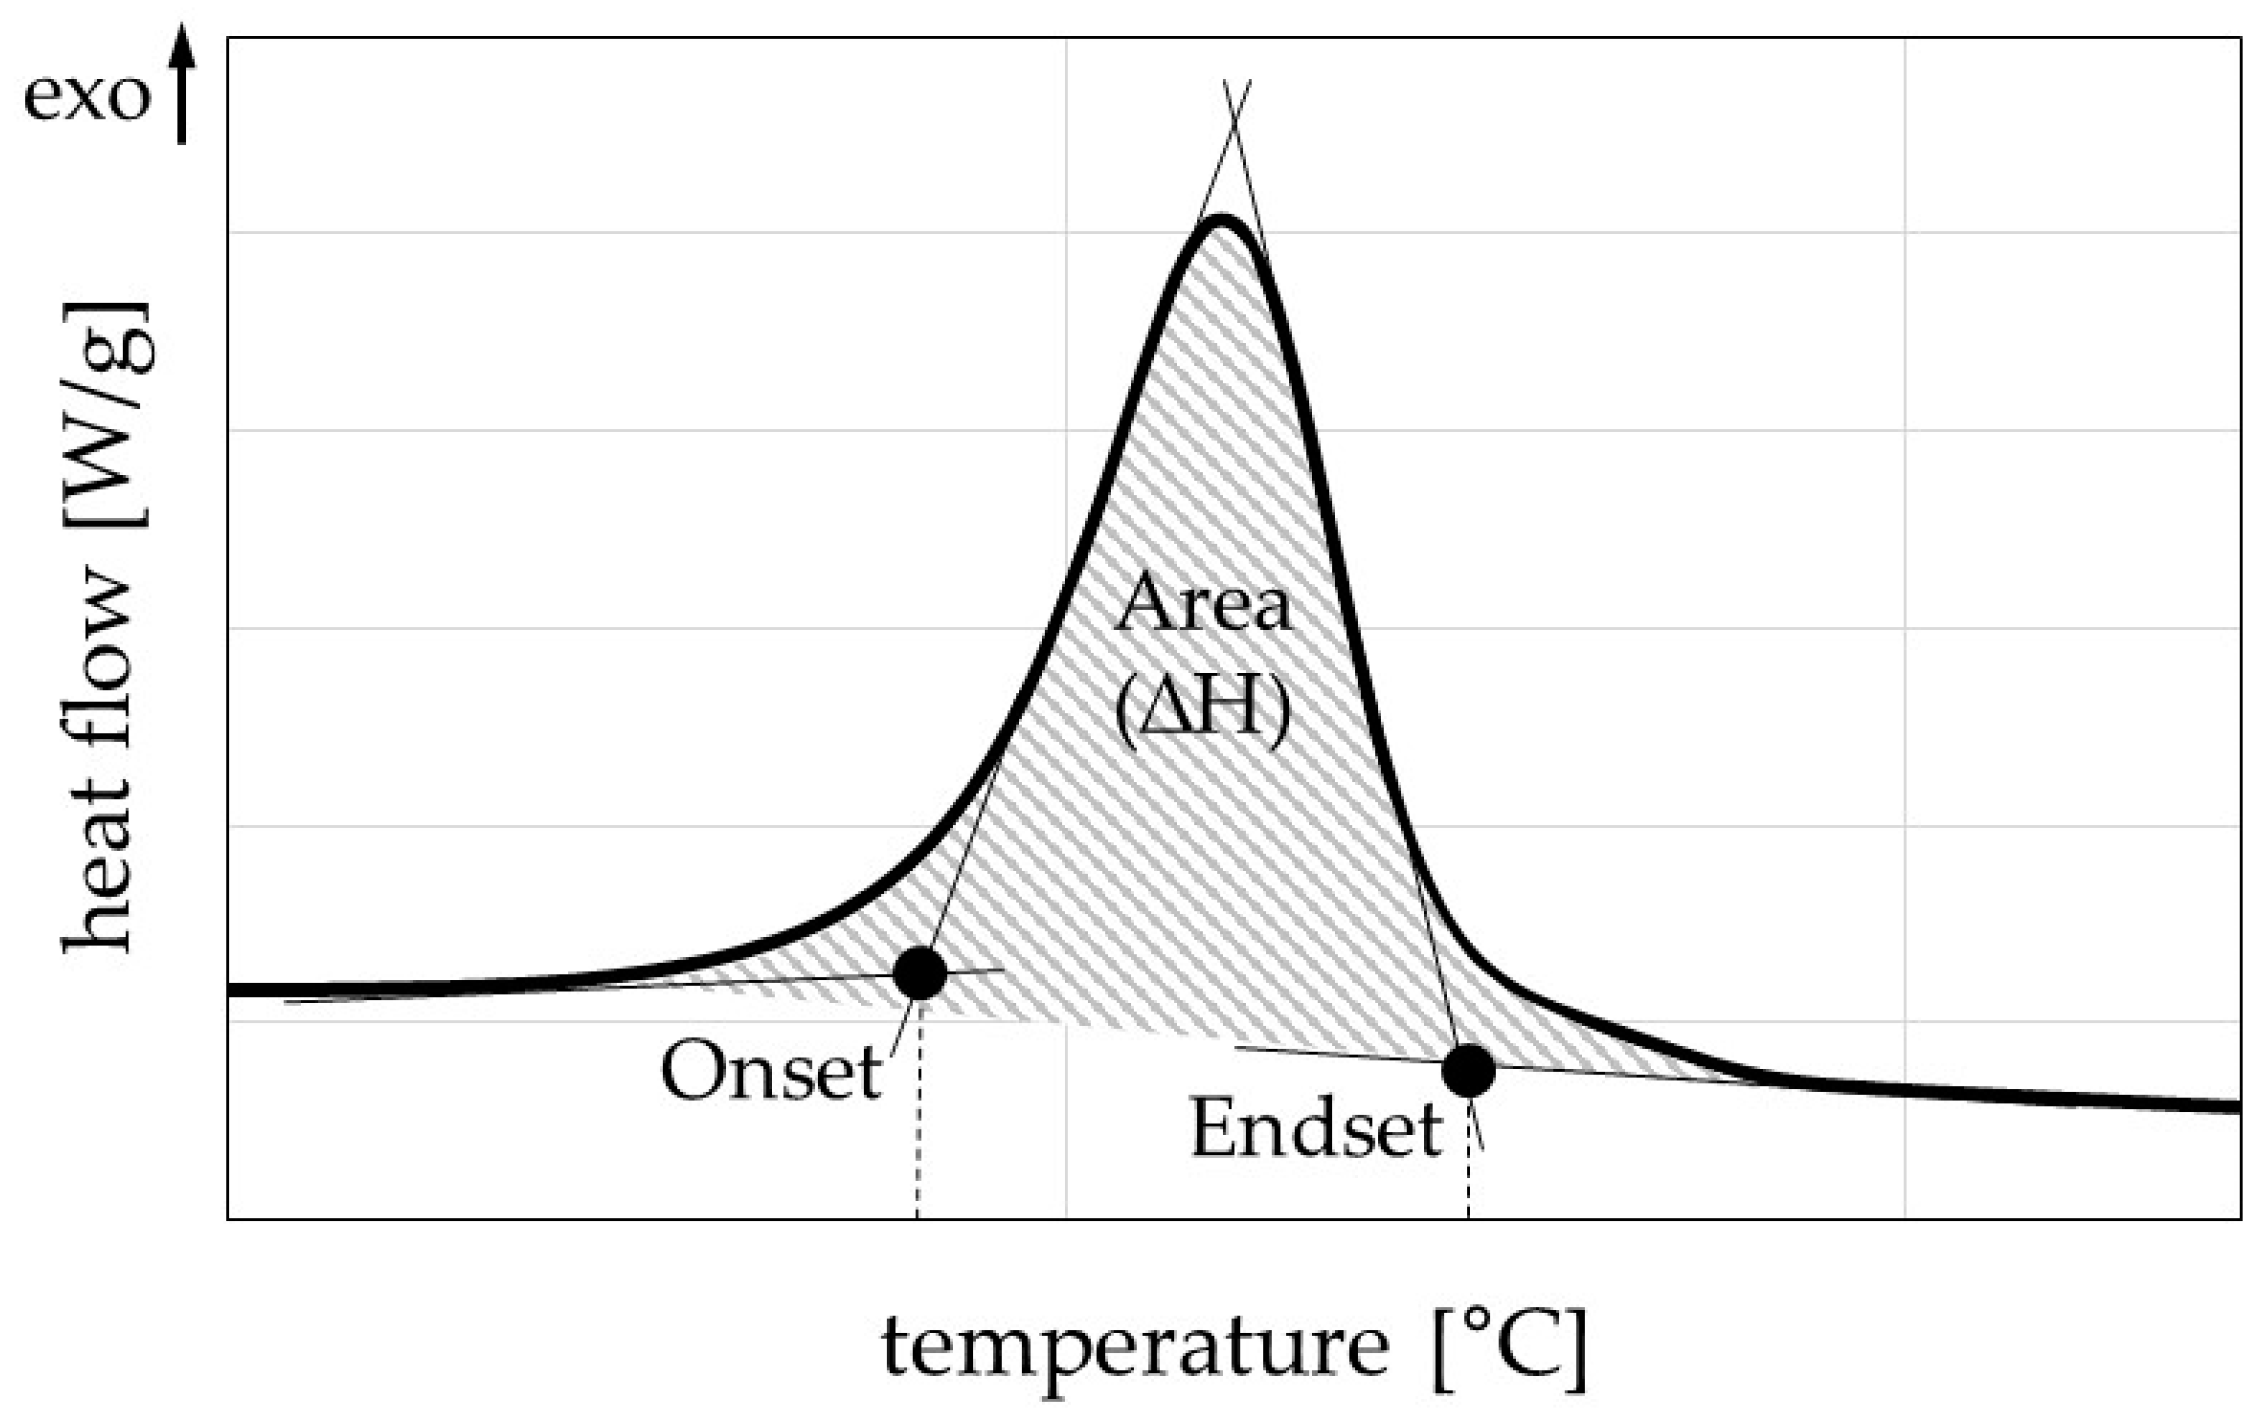
Figure 2.
Differential scanning calorimetry (DSC) descriptors: onset, endset and the area under the peak.
Figure 3.
The shape and approximate weight of the samples.
Figure 4.
Example of heat flow curves of DSC measurements of micro samples for a heating rate of 10, 30, 50 and 70 K/min.
Figure 5.
Temperatures for start (a) and end (b) of transformation peaks computed as arithmetic mean over a sample size of n(10 K/min) = 13, n(30K/min) = 16, n(50 K/min) = 14 and n(70 K/min) = 8.
Figure 6.
Absolute value of the area under transformation peaks with varying heating rates. As in
Figure 5, these are arithmetic means computed with a sample size
n > 7.
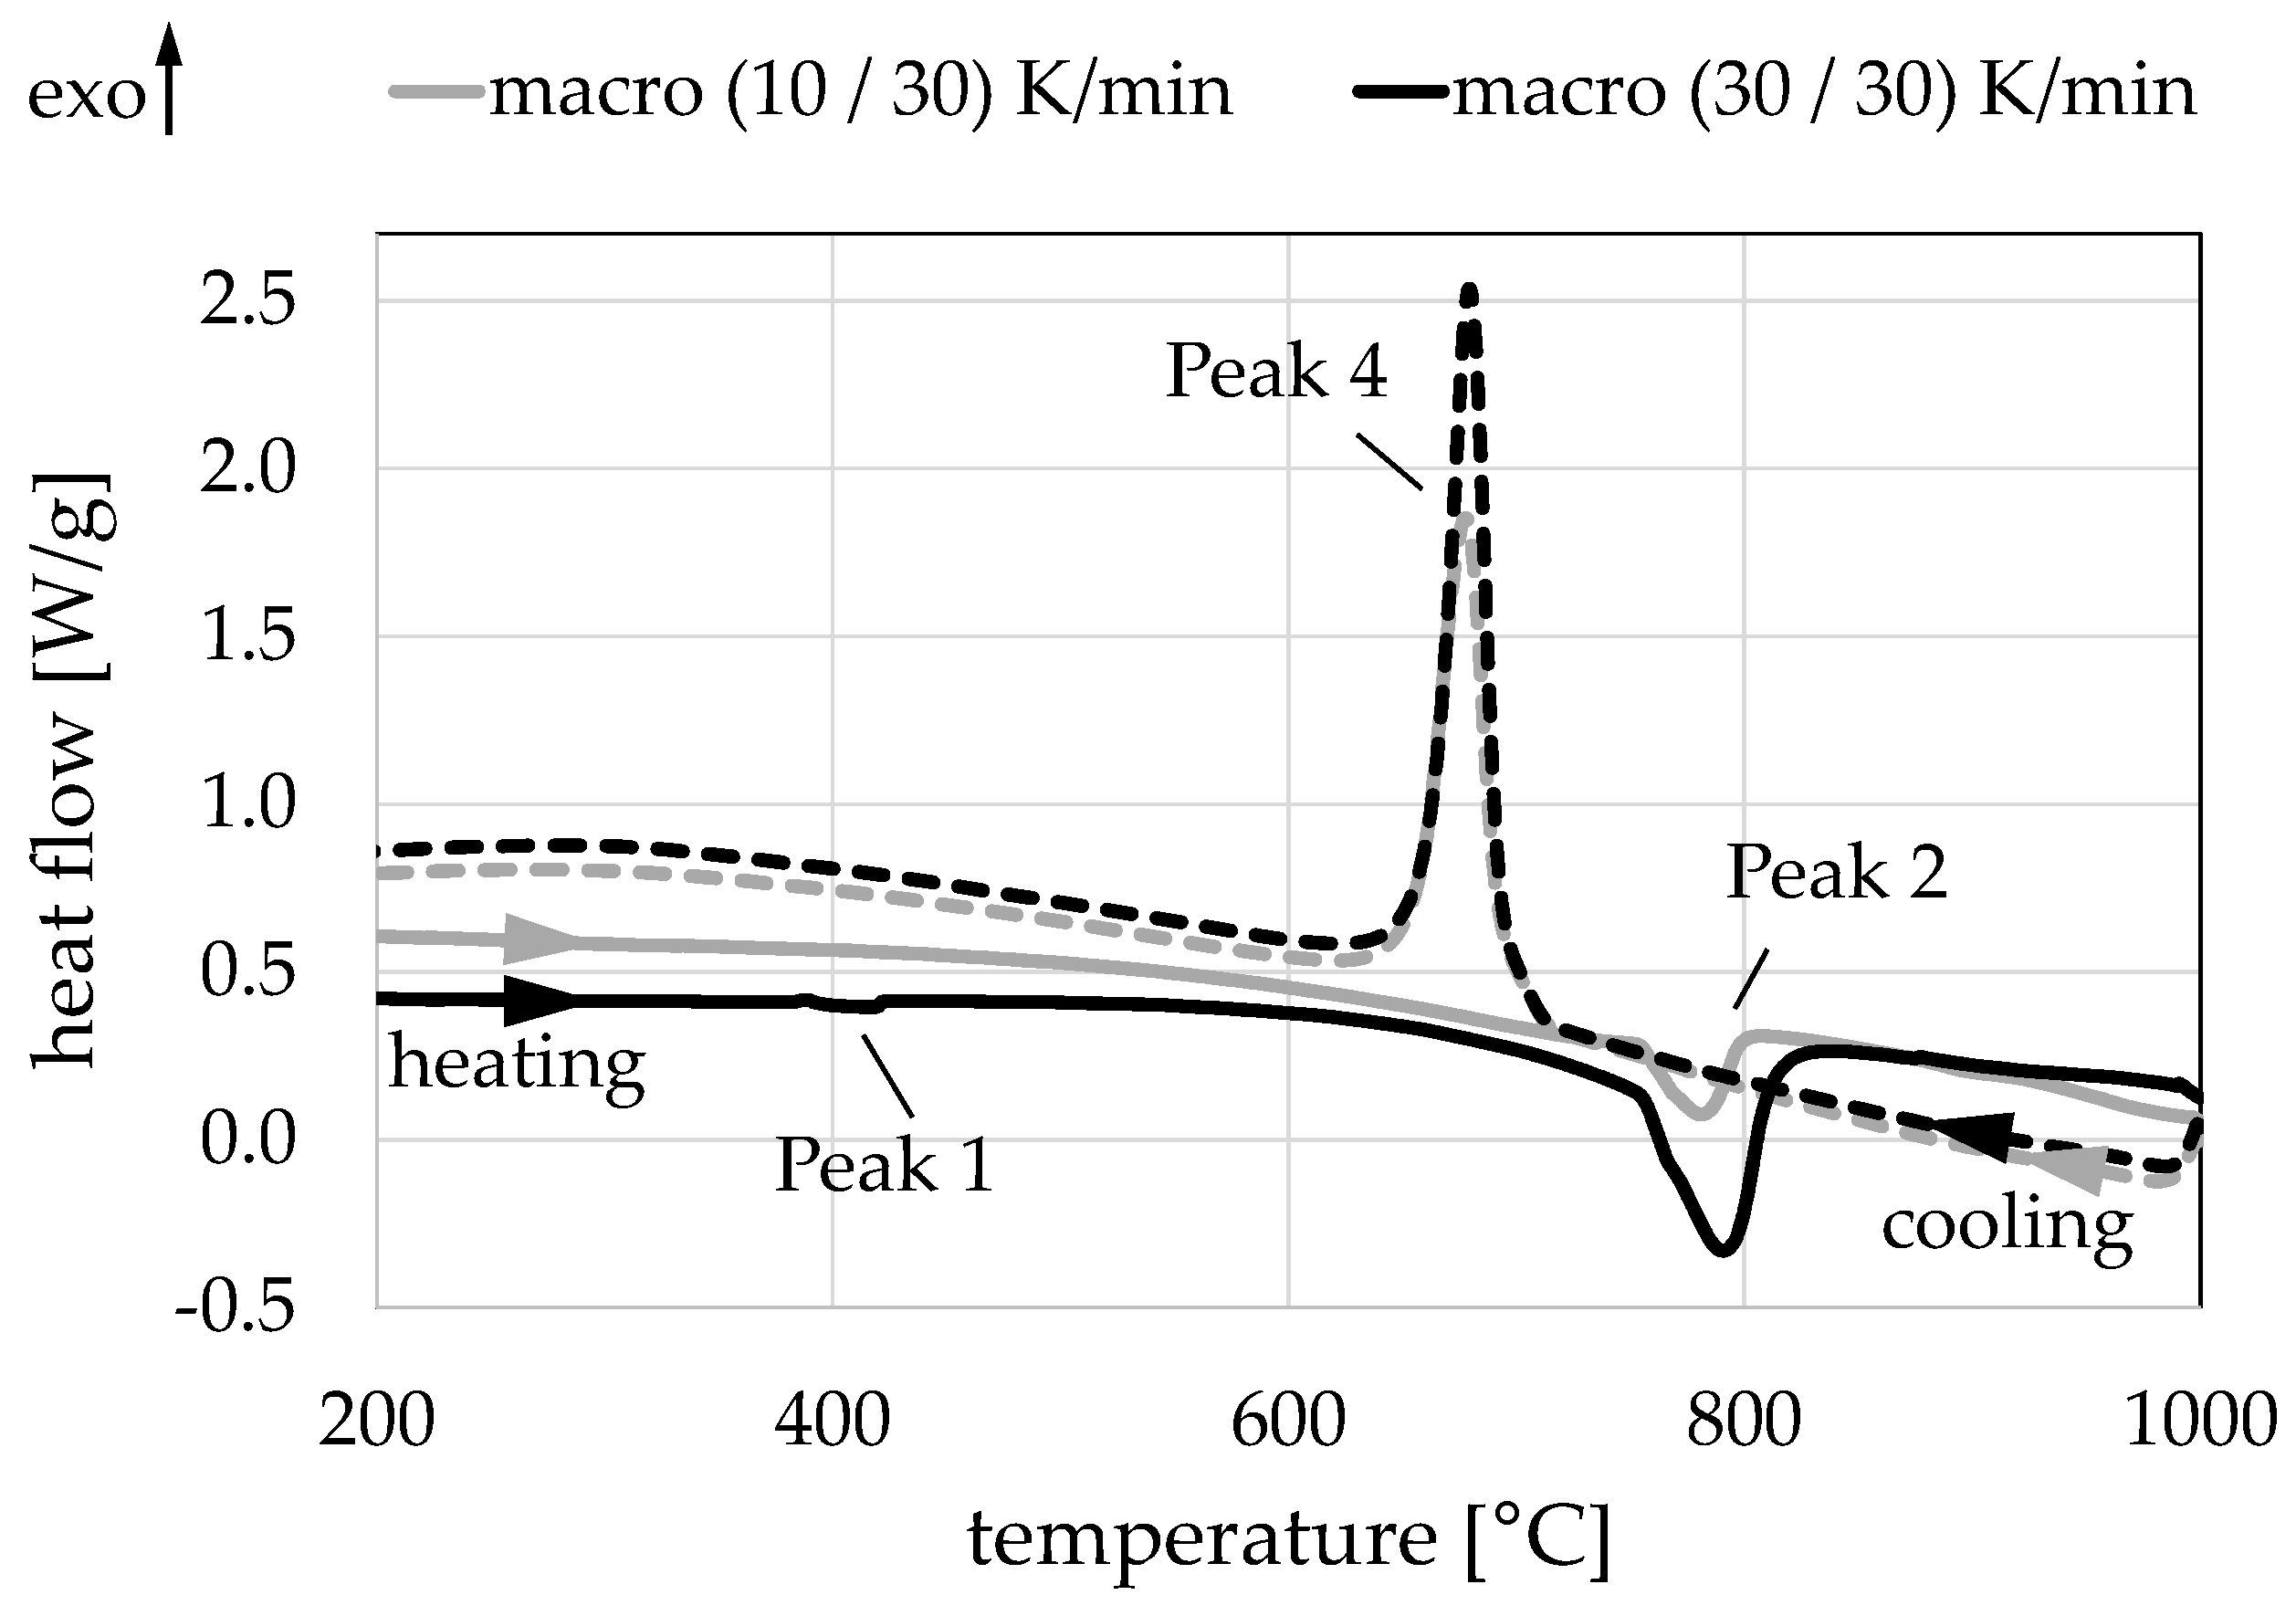
Figure 7.
Example of heat flow curves of DSC measurements of macro samples for a heating rate of 10 K/min and 30 K/min and a cooling rate of 30 K/min.
Figure 8.
Onset temperature for varying heating rates (10, 30, 50 K/min) and mass input (one micro sample, three micro samples and one macro sample) computed as an arithmetic mean from n > 3 samples.
Figure 9.
Arithmetic mean of hardness descriptors (25 measurements each) of four different micro samples and their standard deviations.
Figure 10.
(a) Hardness descriptors of micro samples with different heat treatments in the DSC; (b) relative change in hardness descriptors when varying the heating rate of DSC from 10 K/min to 30 K/min of micro and macro samples.
Table 1.
Chemical composition of the investigated alloys in wt % in comparison with the limitations of the DIN EN ISO 683-17:2000-04.
| Material | Chemical Composition in wt % |
|---|
| Fe | C | Cr | Mn | Ni | P | S | Si |
|---|
| Macro (a) | - | bal. | 1.00 | 1.45 | 0.29 | | 0.013 | 0.023 | 0.25 |
| Micro Test 1 (b) | - | bal. | 1.03 (c) | 1.20 | 0.38 | 0.40 | - | 0.015 (c) | 0.35 (a) |
| Micro Test 2 (b) | - | bal. | 1.07 (c) | 1.31 | 0.35 | 0.17 | - | 0.018 (c) | 0.35 (a) |
| DIN EN ISO 683-17:2000-04 | min
max | bal. | 0.93
1.05 | 1.35
1.60 | 0.25
0.45 | 0.00
0.40 | -
0.025 | -
0.015 | 0.15
0.35 |
Table 2.
Heating, cooling and austenitizing parameters.
| Heating Rate K/min | TA °C | tA min | Cooling Rate K/min | Characterization Method |
|---|
| 10 | 1000 | 20 | 30 | DSC, UMH |
| 30 | 1000 | 20 | 30 | DSC, UMH |
| 10 | 1000 | 20 | 50 | DSC |
| 30 | 1000 | 20 | 50 | DSC |
| 50 | 1000 | 20 | 50 | DSC |
| 70 | 1000 | 20 | 50 | DSC |
Table 3.
Minimum and maximum values of the indentation hardness HIT of micro samples after the heat treatment in DSC with a heating rate of 10 K/min.
| Sample Number | Indentation Hardness HIT (GPa) |
|---|
| Minimum | Maximum | Difference |
|---|
| 1 | 1.79 | 3.29 | 1.49 |
| 2 | 1.92 | 3.34 | 1.42 |
| 3 | 1.74 | 3.28 | 1.54 |
| 4 | 1.91 | 3.67 | 1.75 |
| Mean | 1.84 | 3.39 | 1.55 |
© 2019 by the authors. Licensee MDPI, Basel, Switzerland. This article is an open access article distributed under the terms and conditions of the Creative Commons Attribution (CC BY) license (http://creativecommons.org/licenses/by/4.0/).


