Effect of B2O3 on the Crystallization Behavior of CaF2-Based Slag for Electroslag Remelting 9CrMoCoB Steel


Abstract
1. Introduction
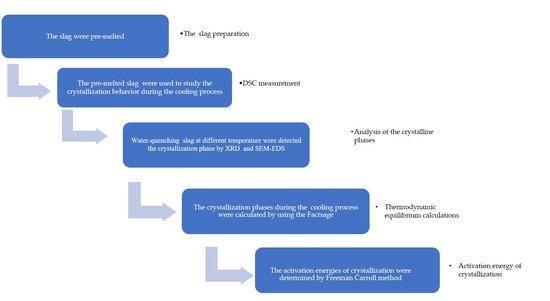
2. Experiments
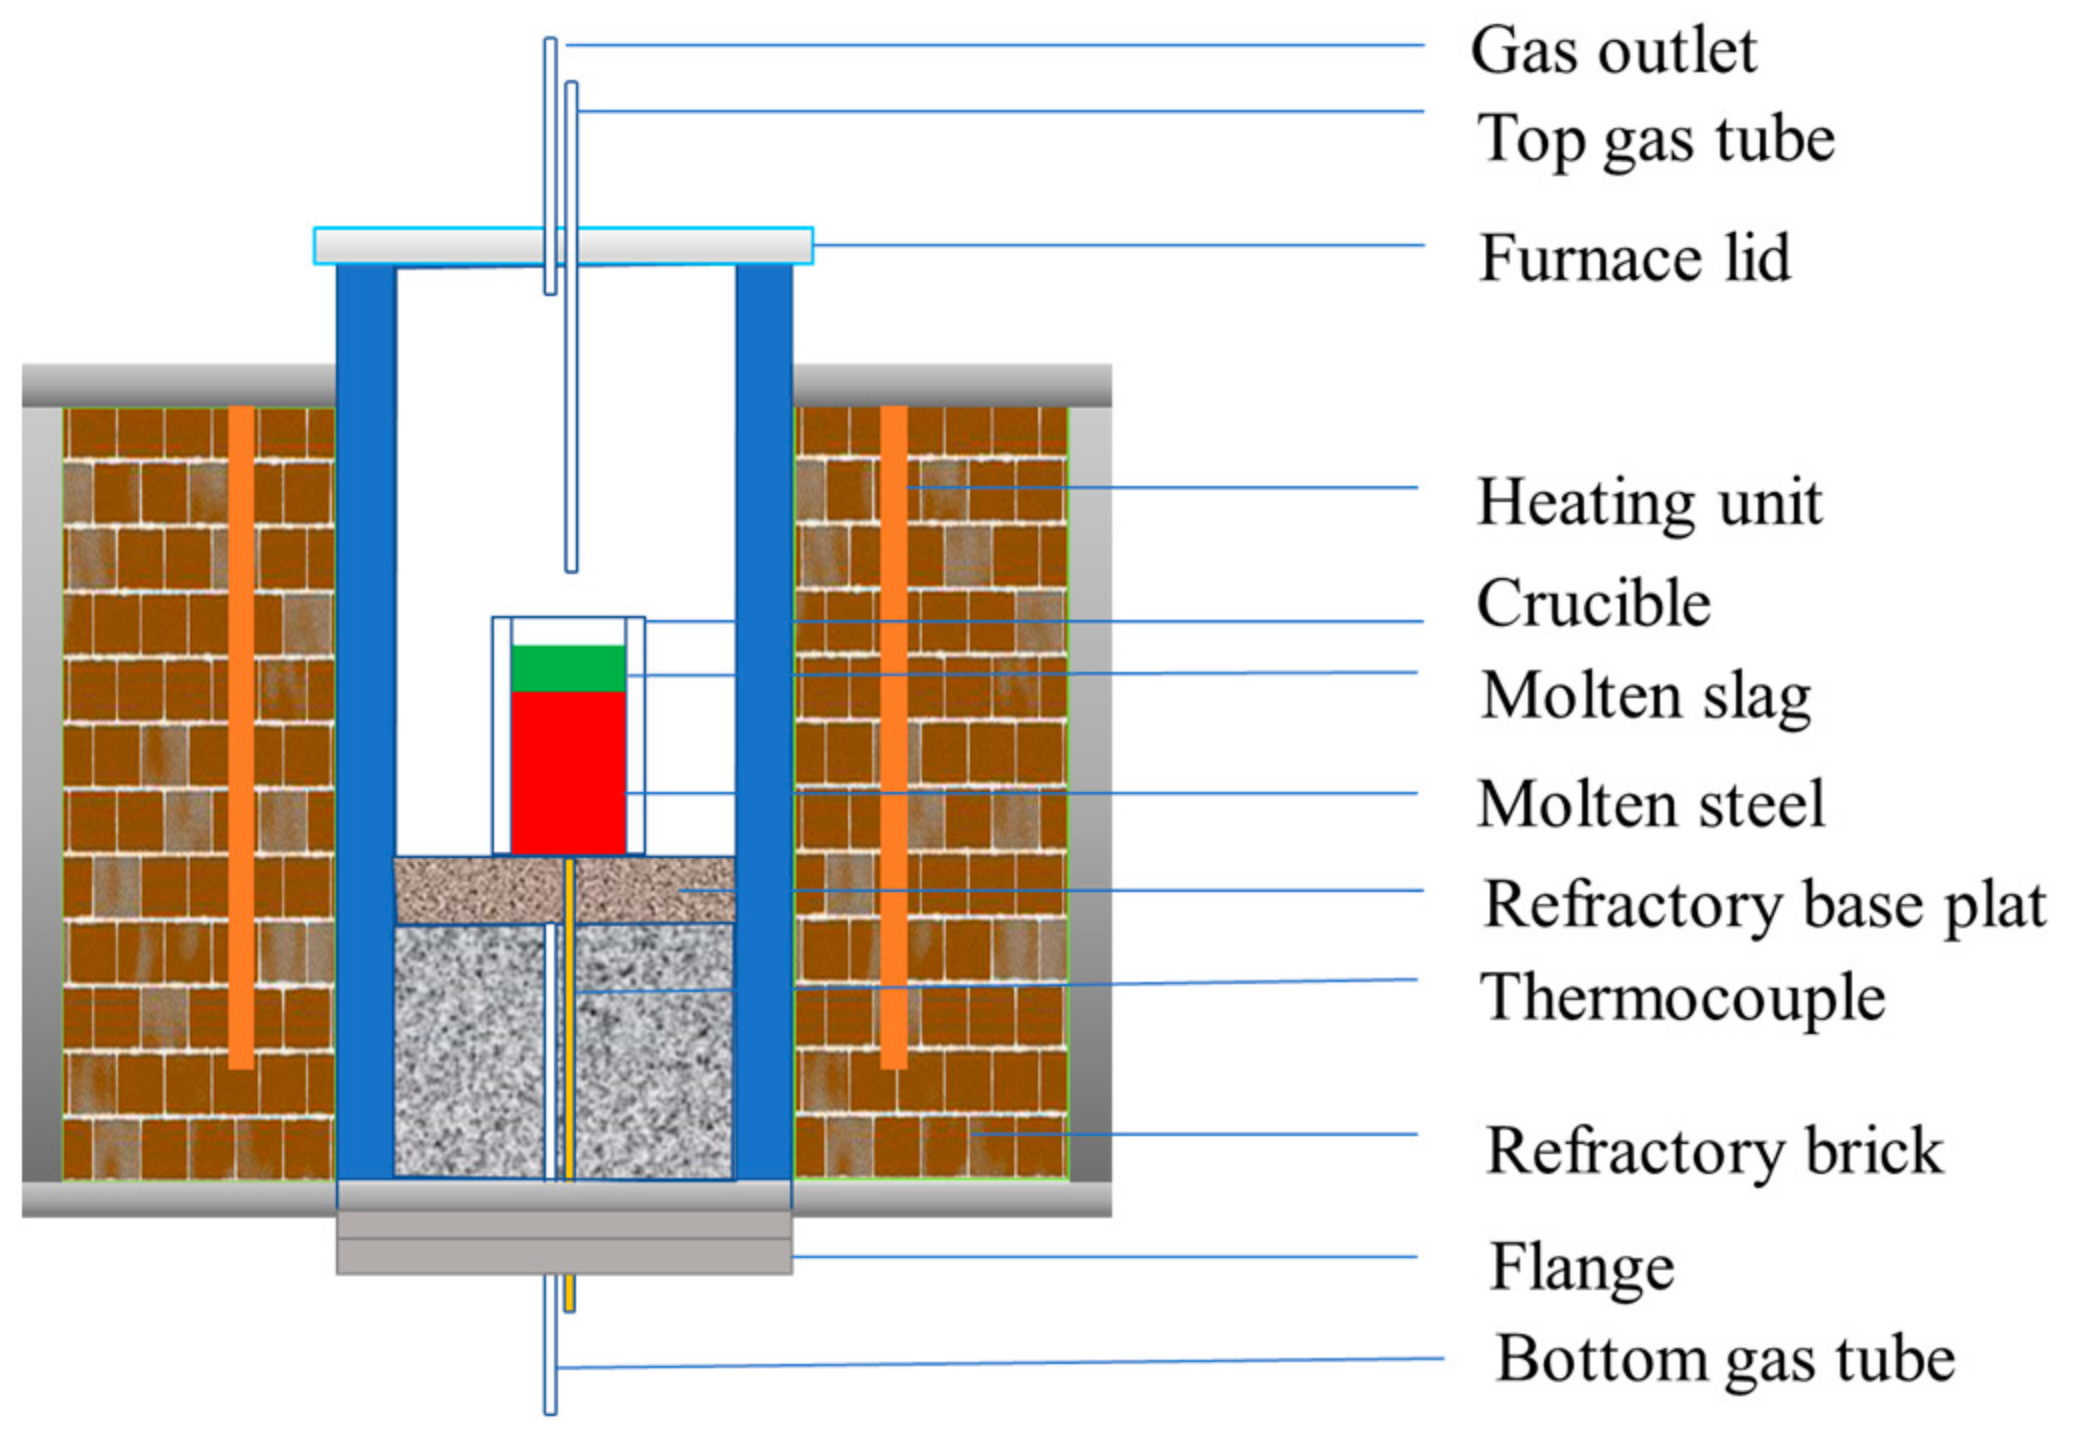
2.1. Slag Sample Preparation
2.2. DSC Measurement
2.3. Analysis of the Crystalline Phases
2.4. Thermodynamic Equilibrium Calculations
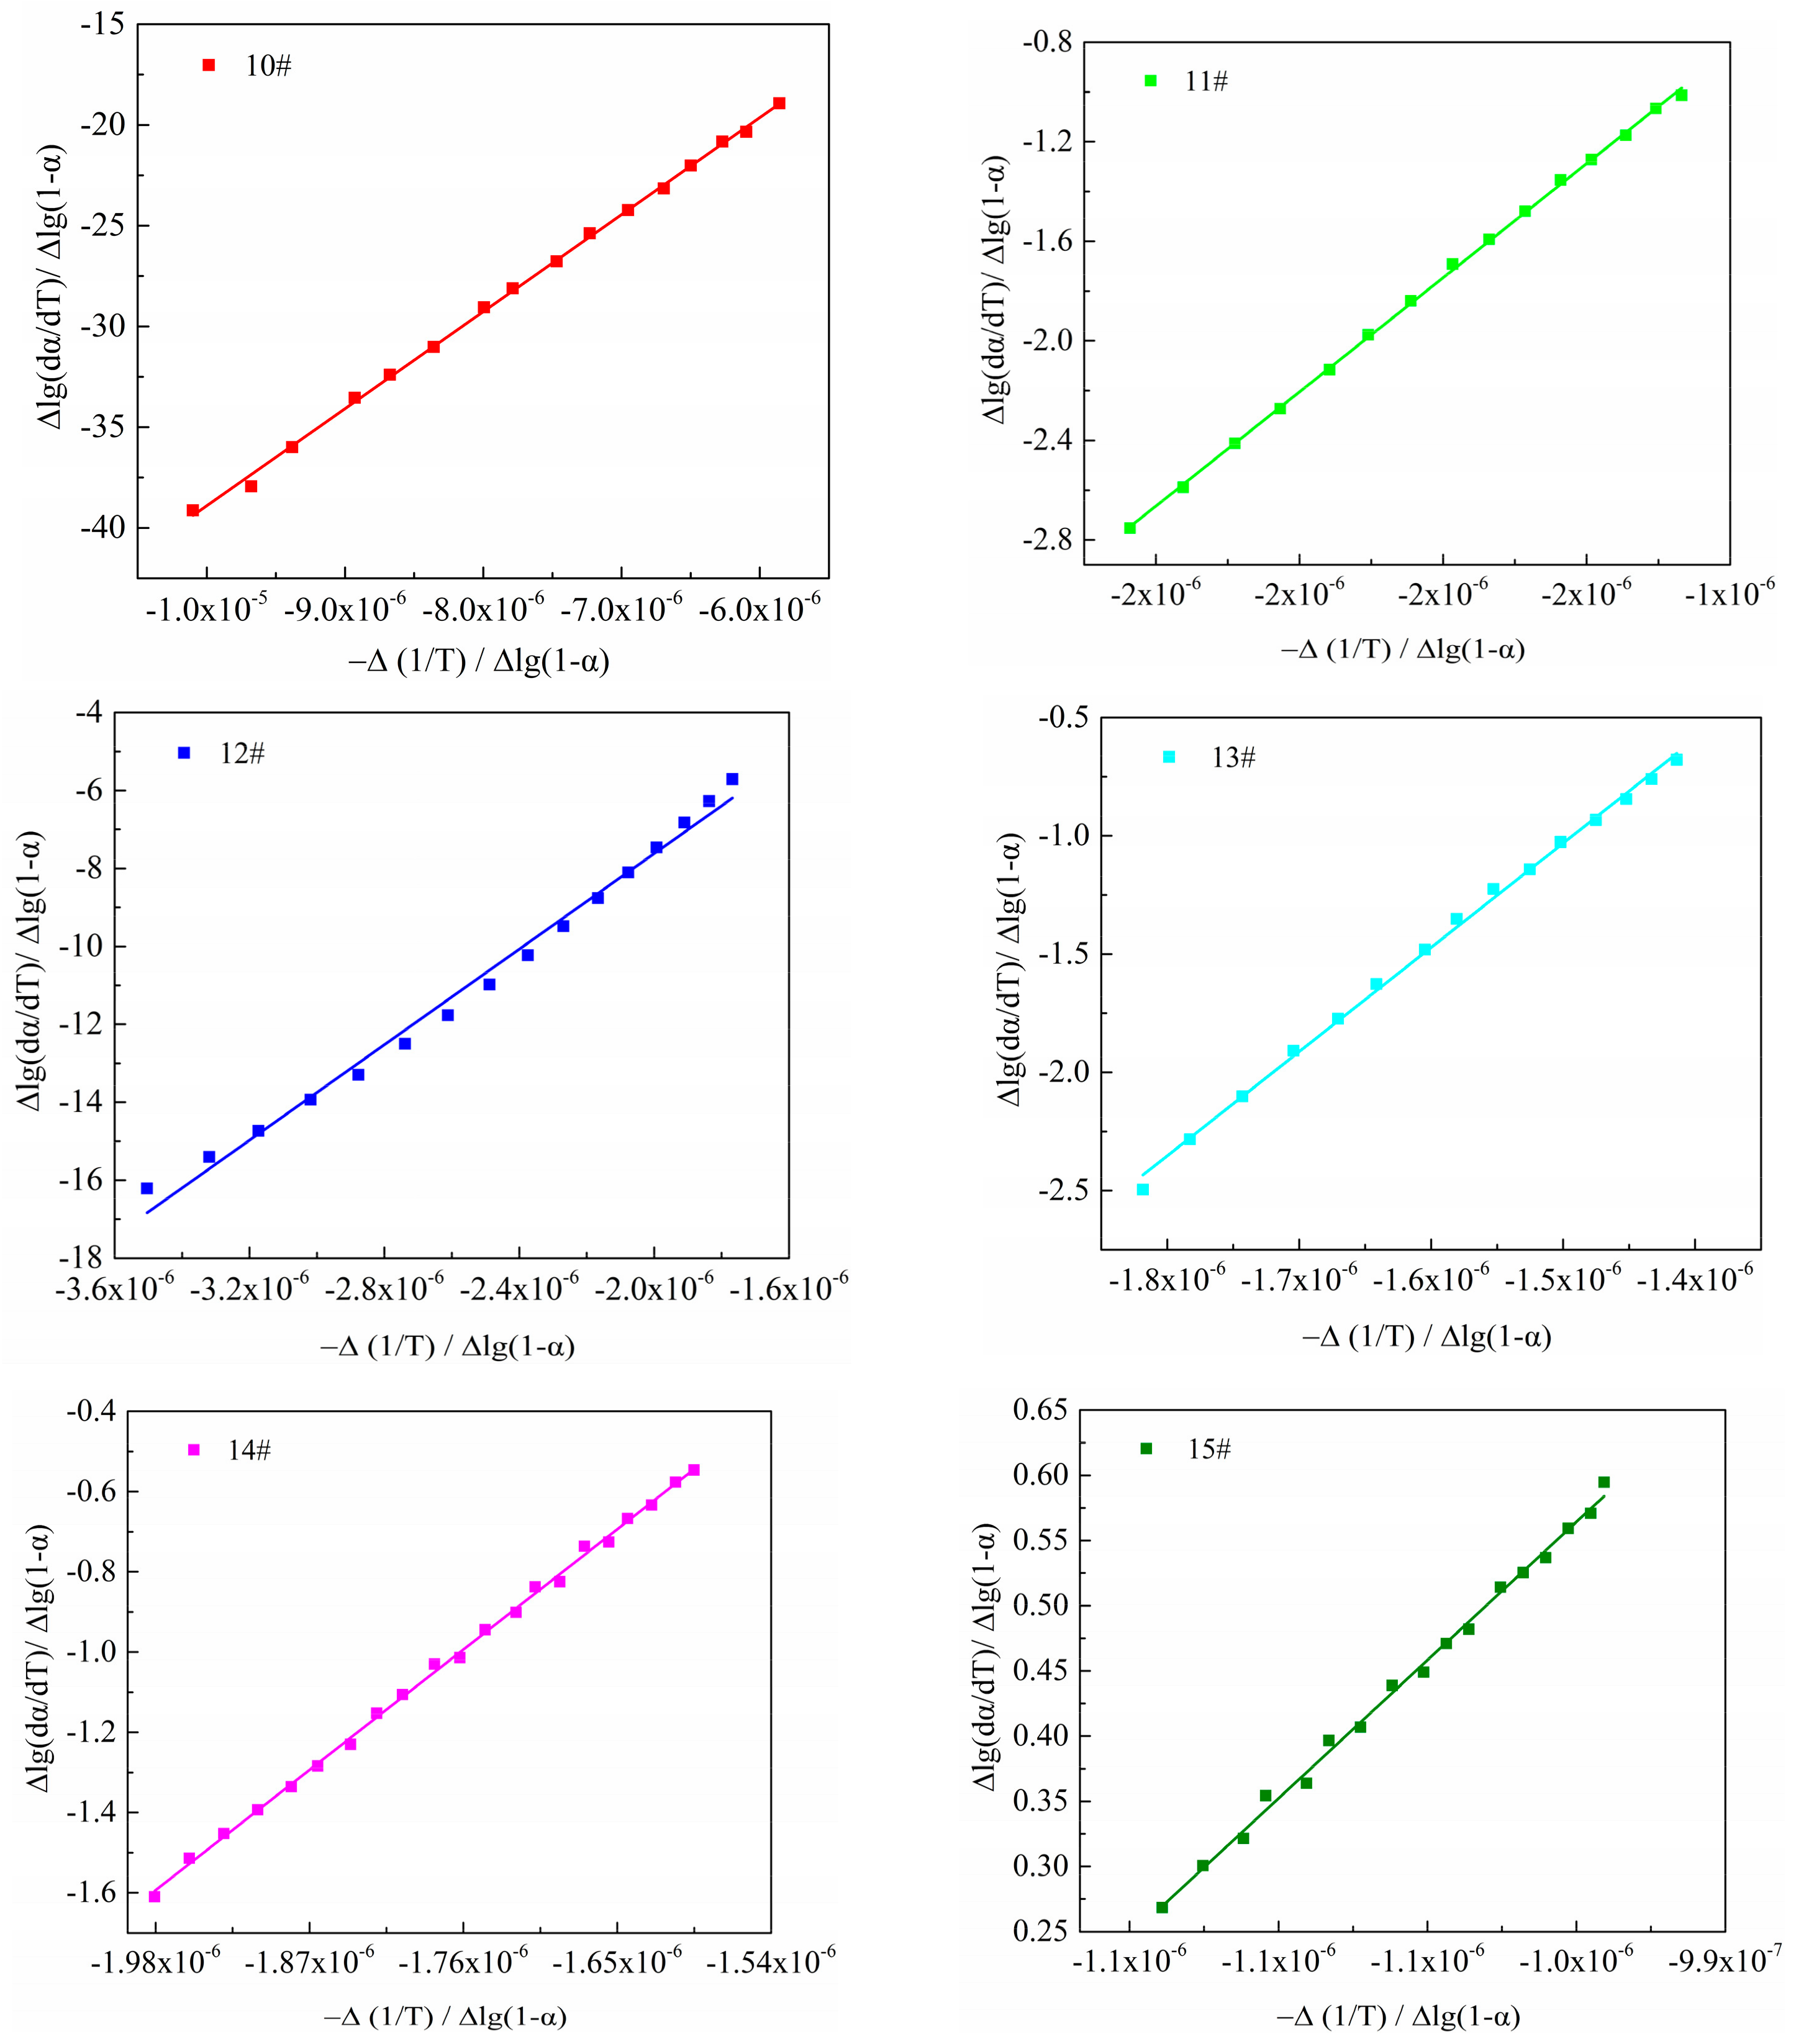
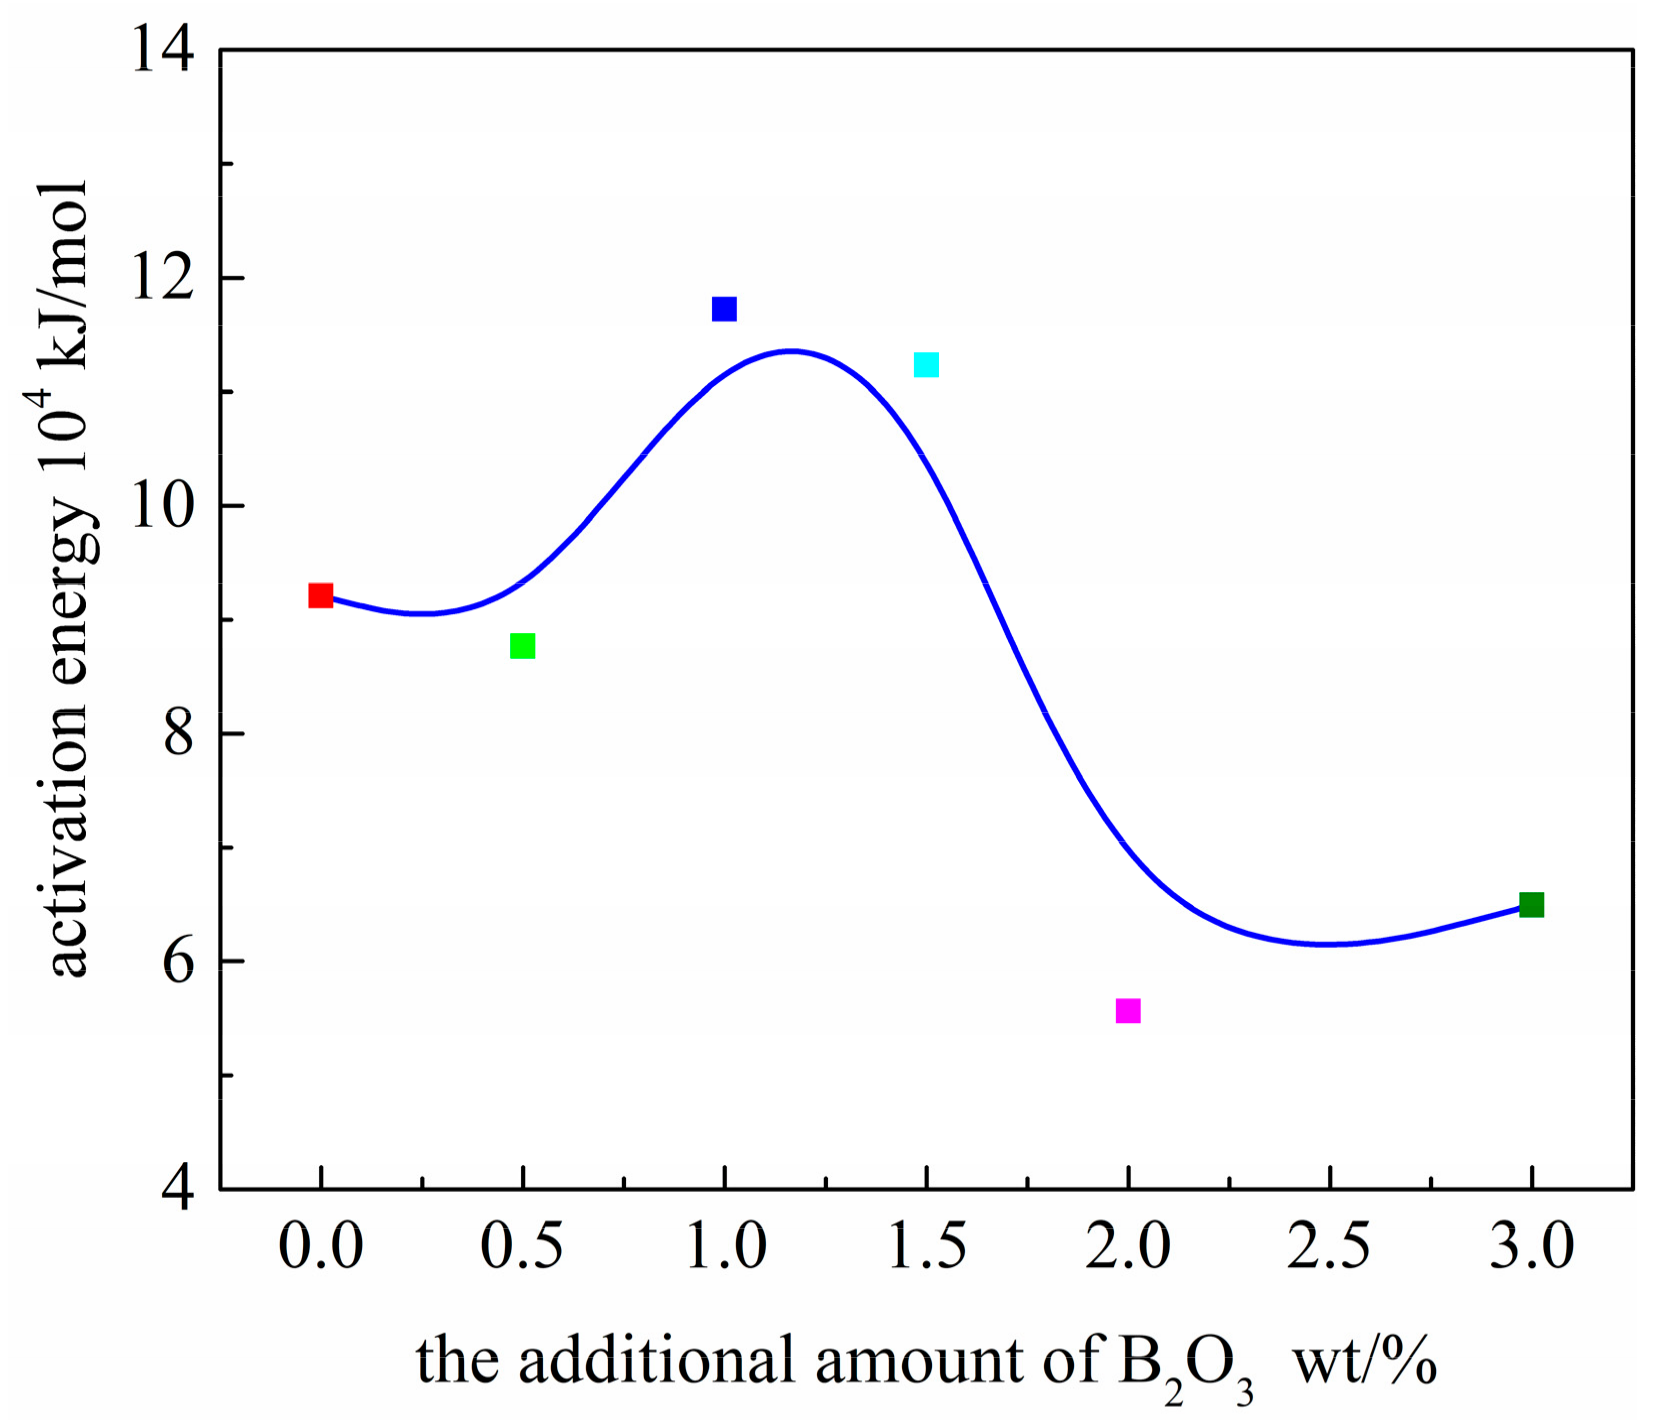
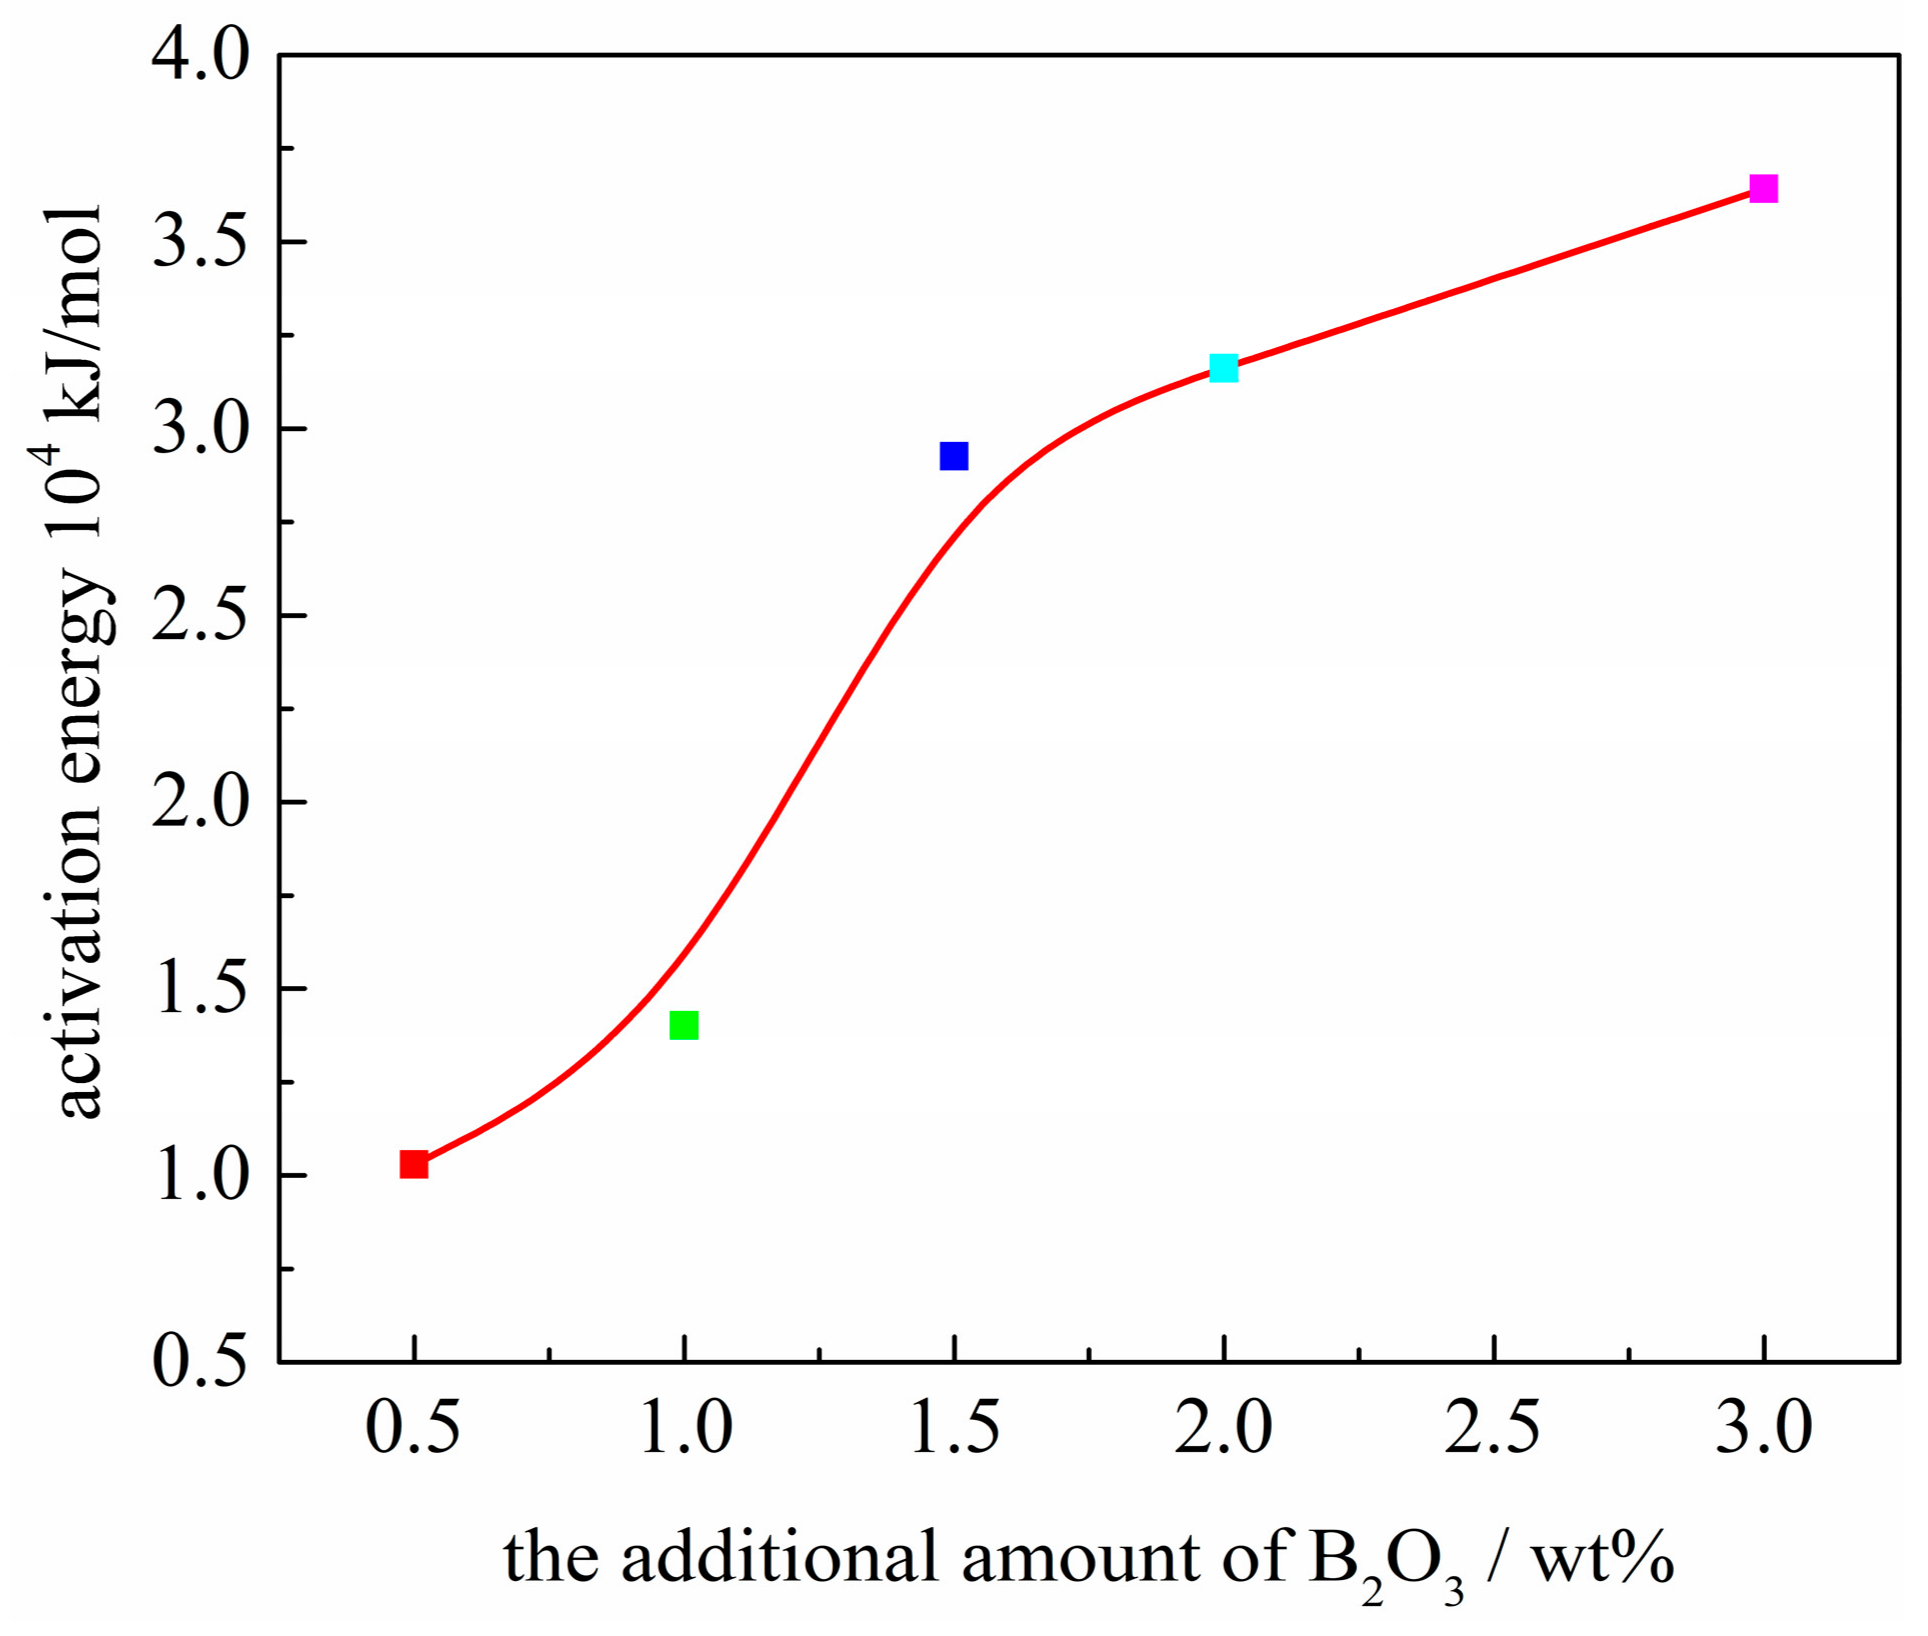
2.5. Activation Energy of Crystallization
3. Results and Discussion
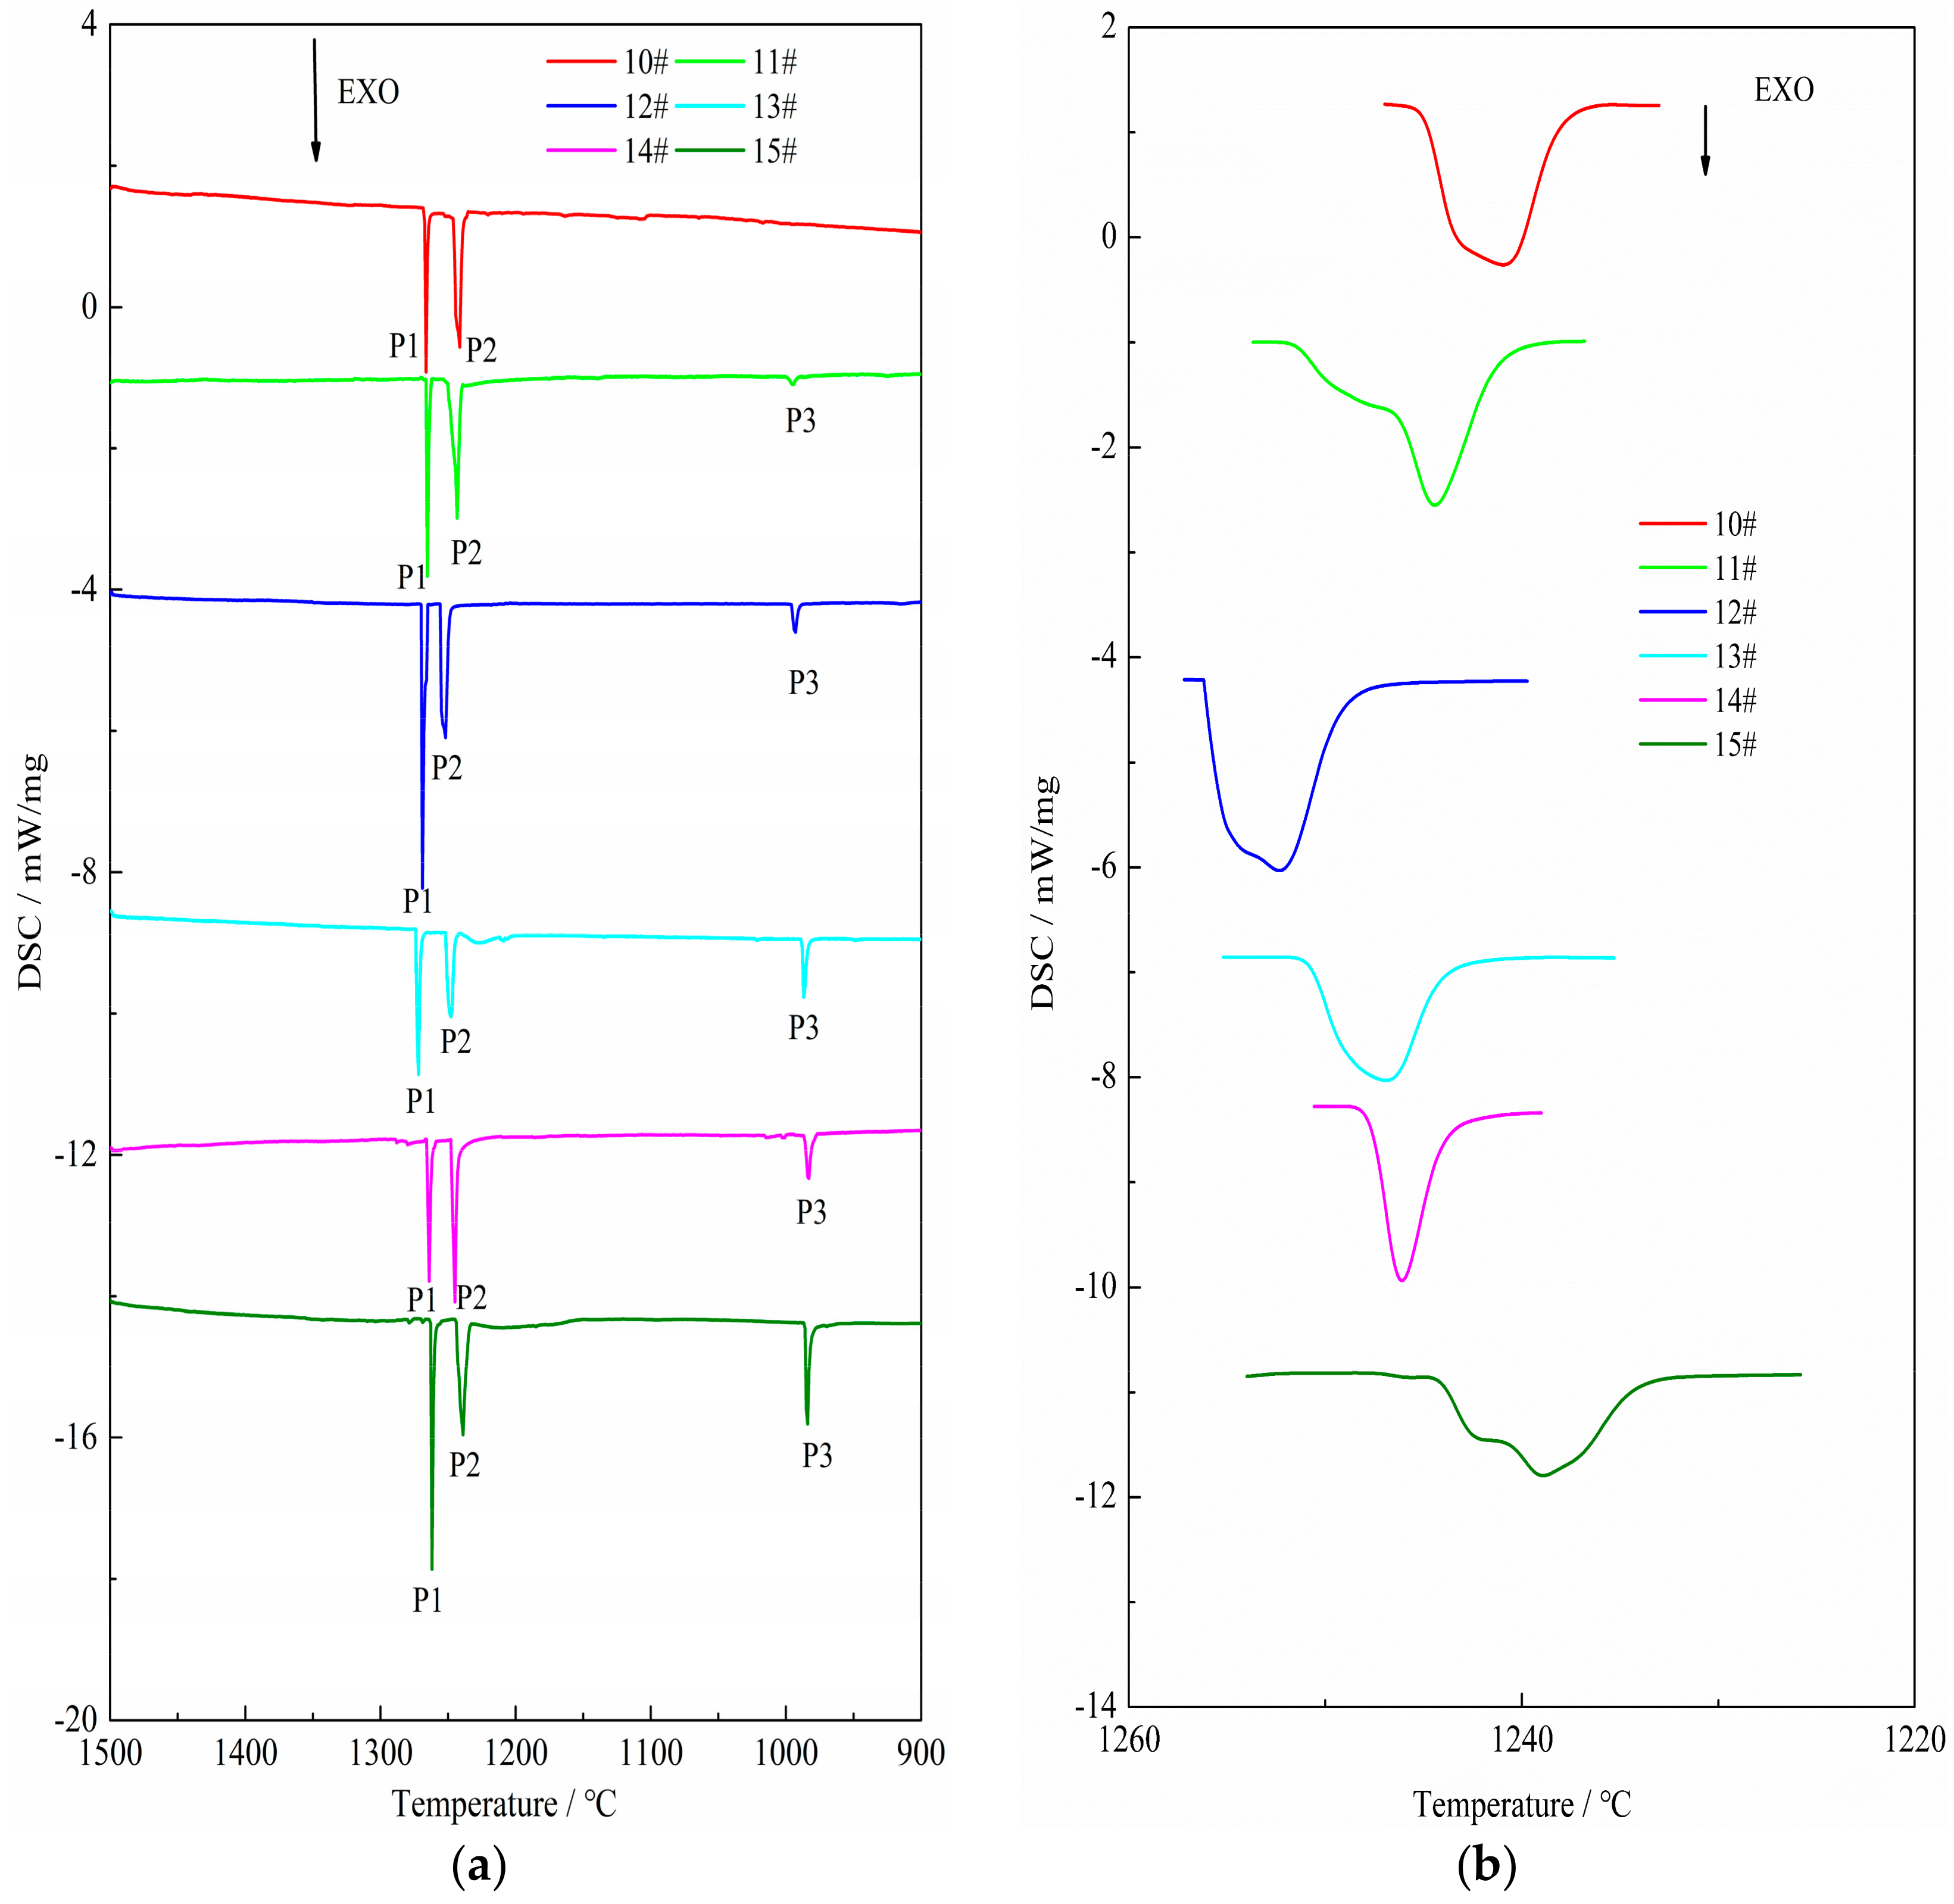
3.1. The Results of DSC Analysis
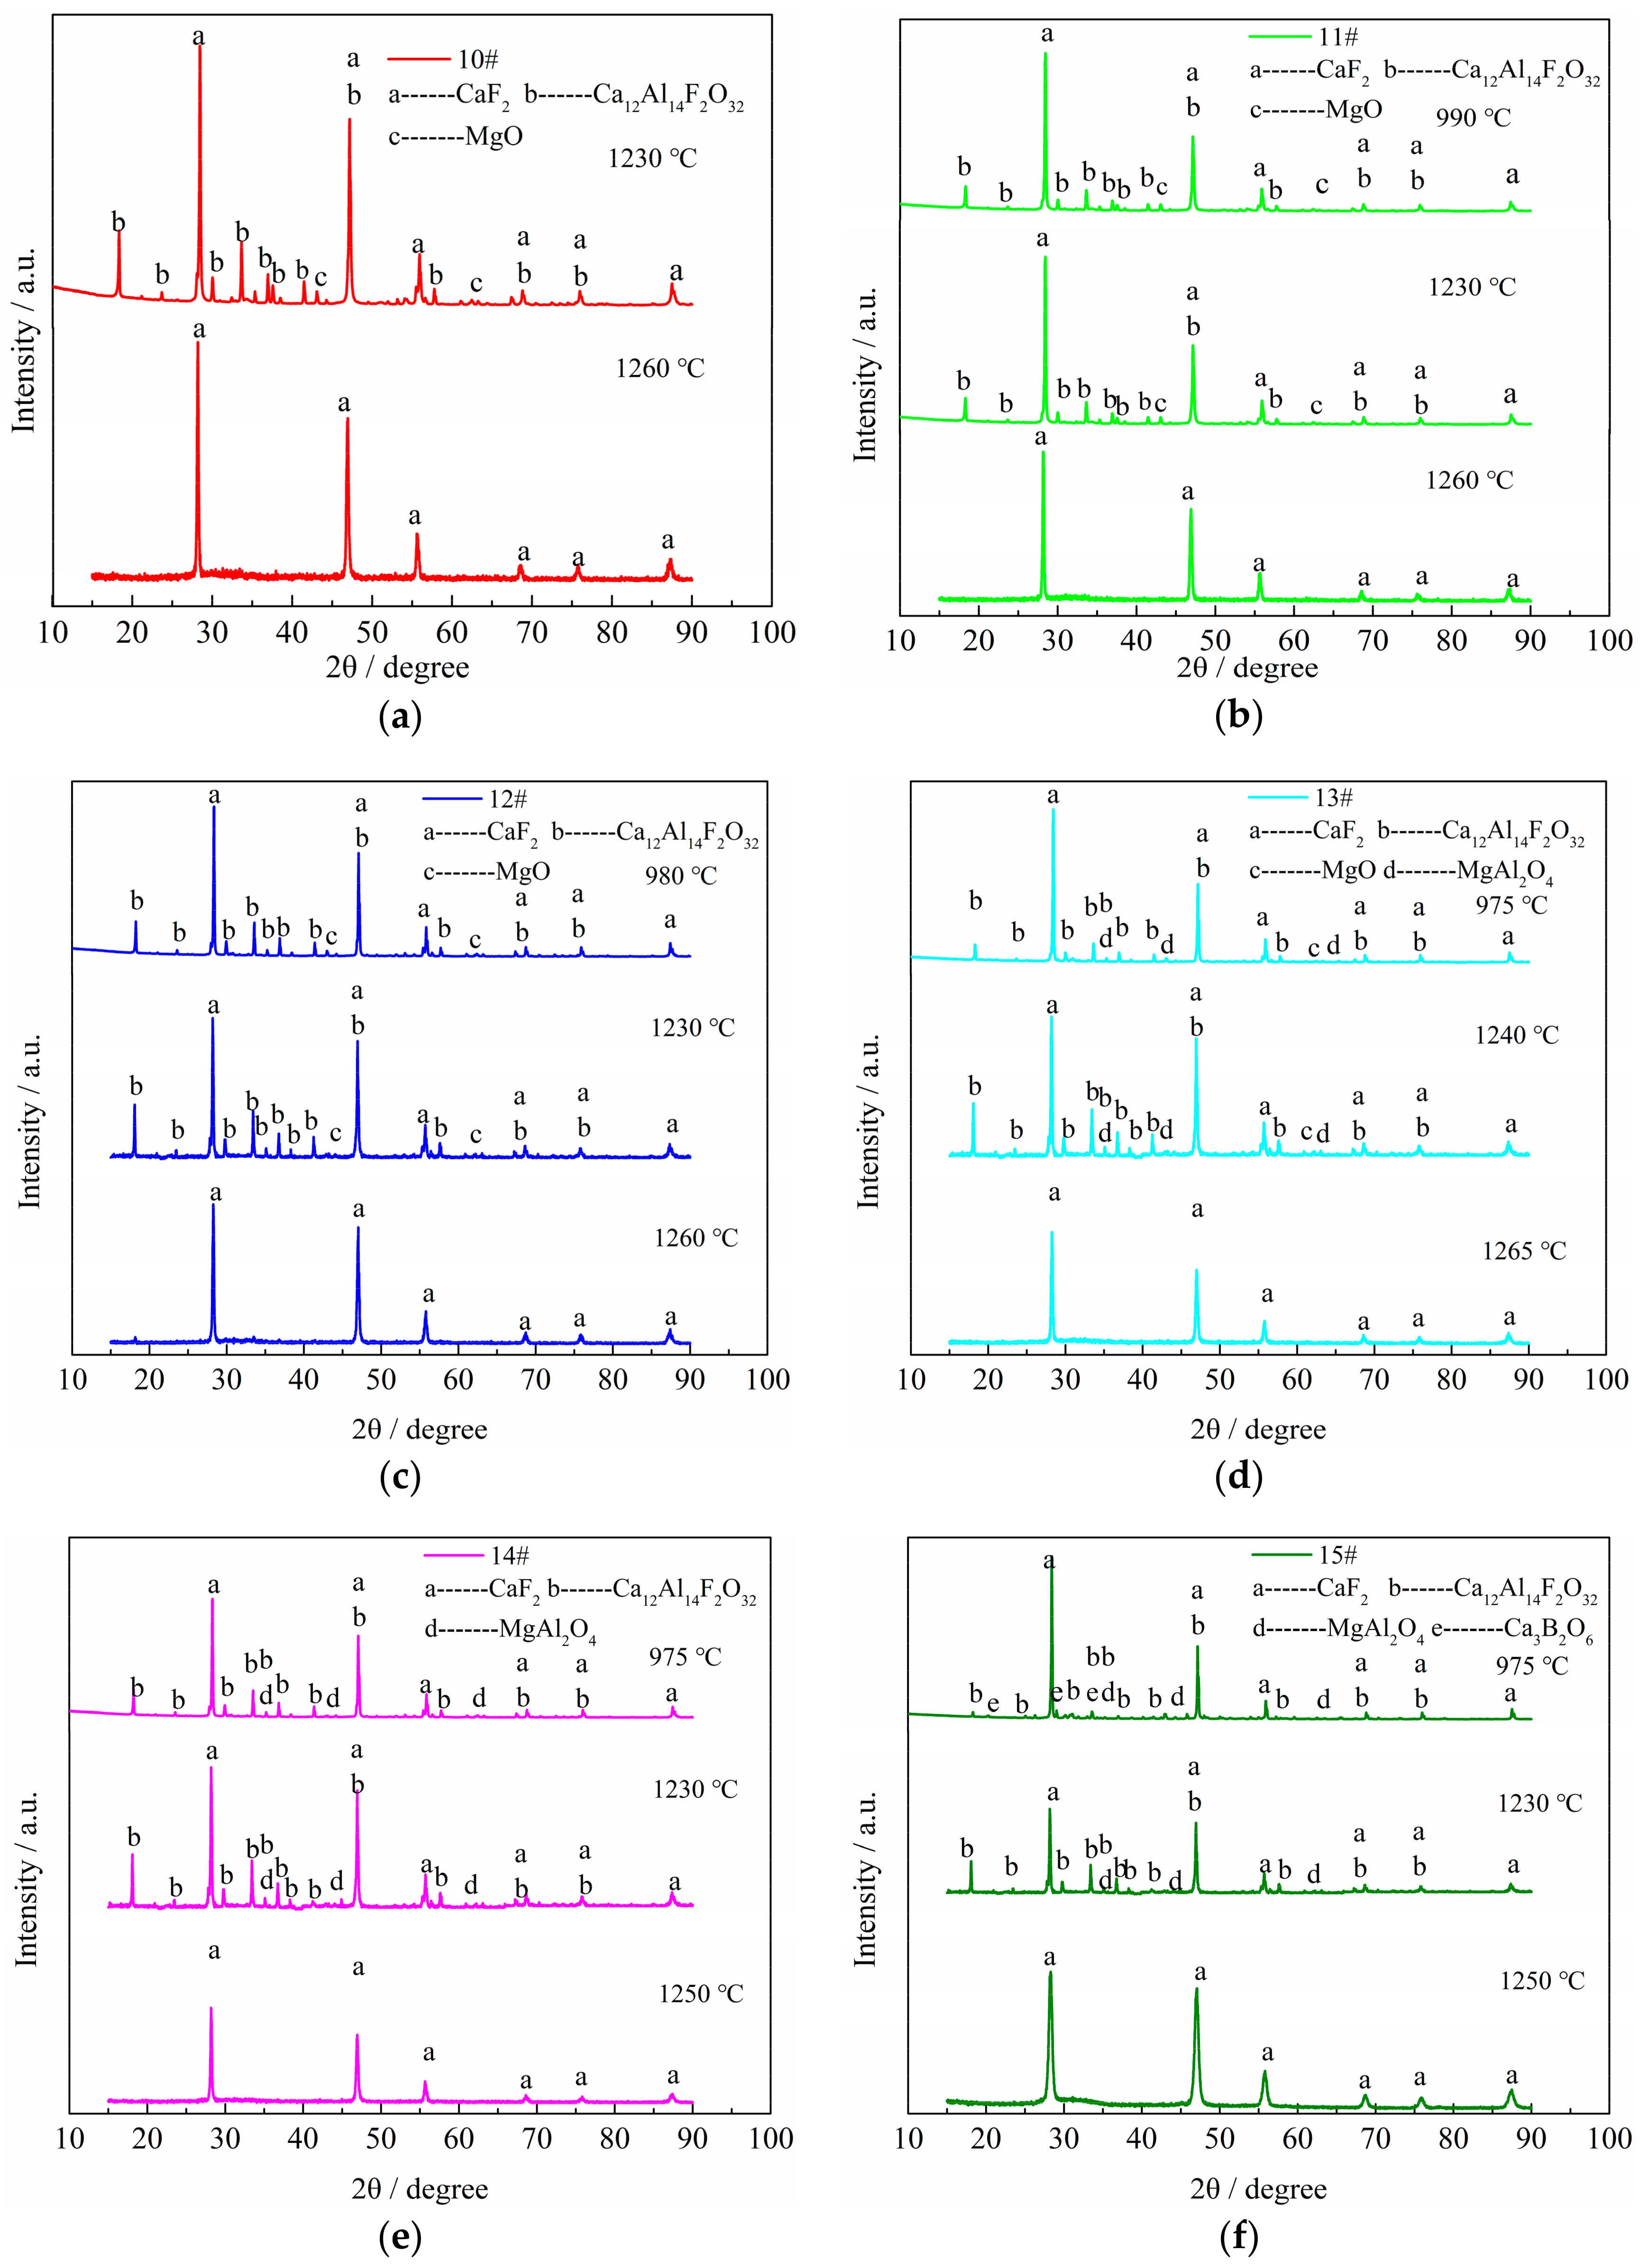
3.2. XRD Identification
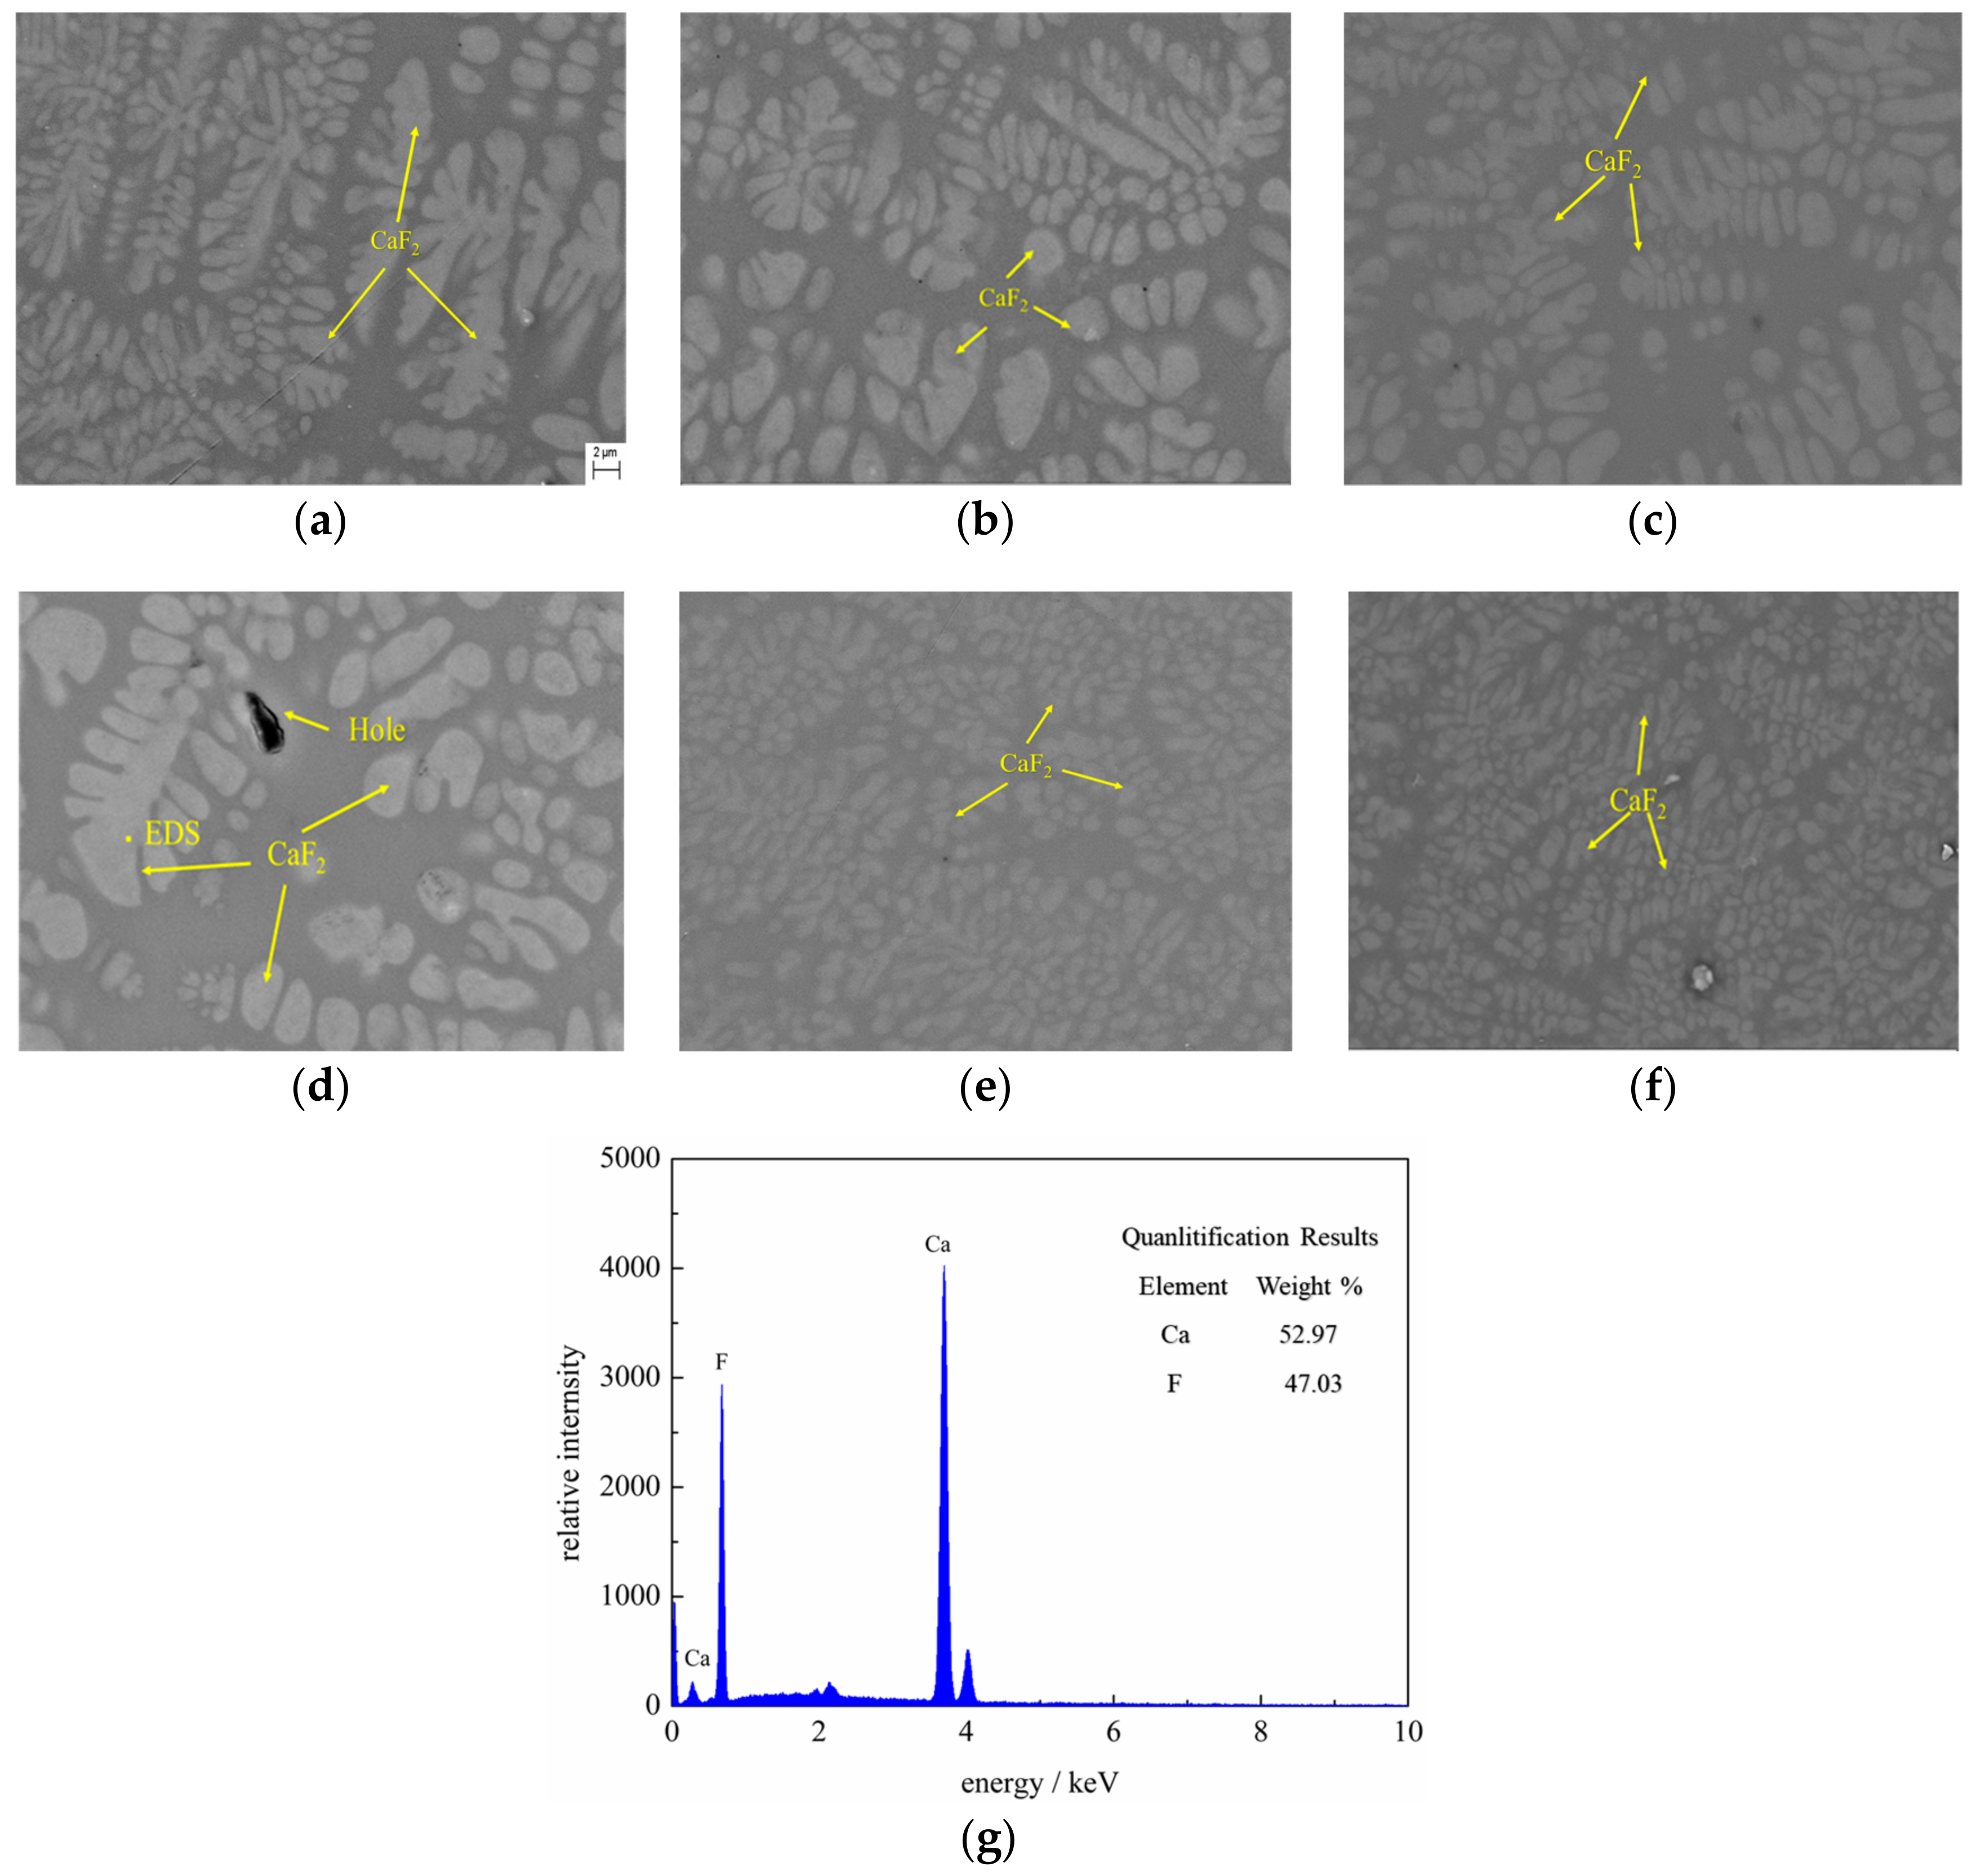
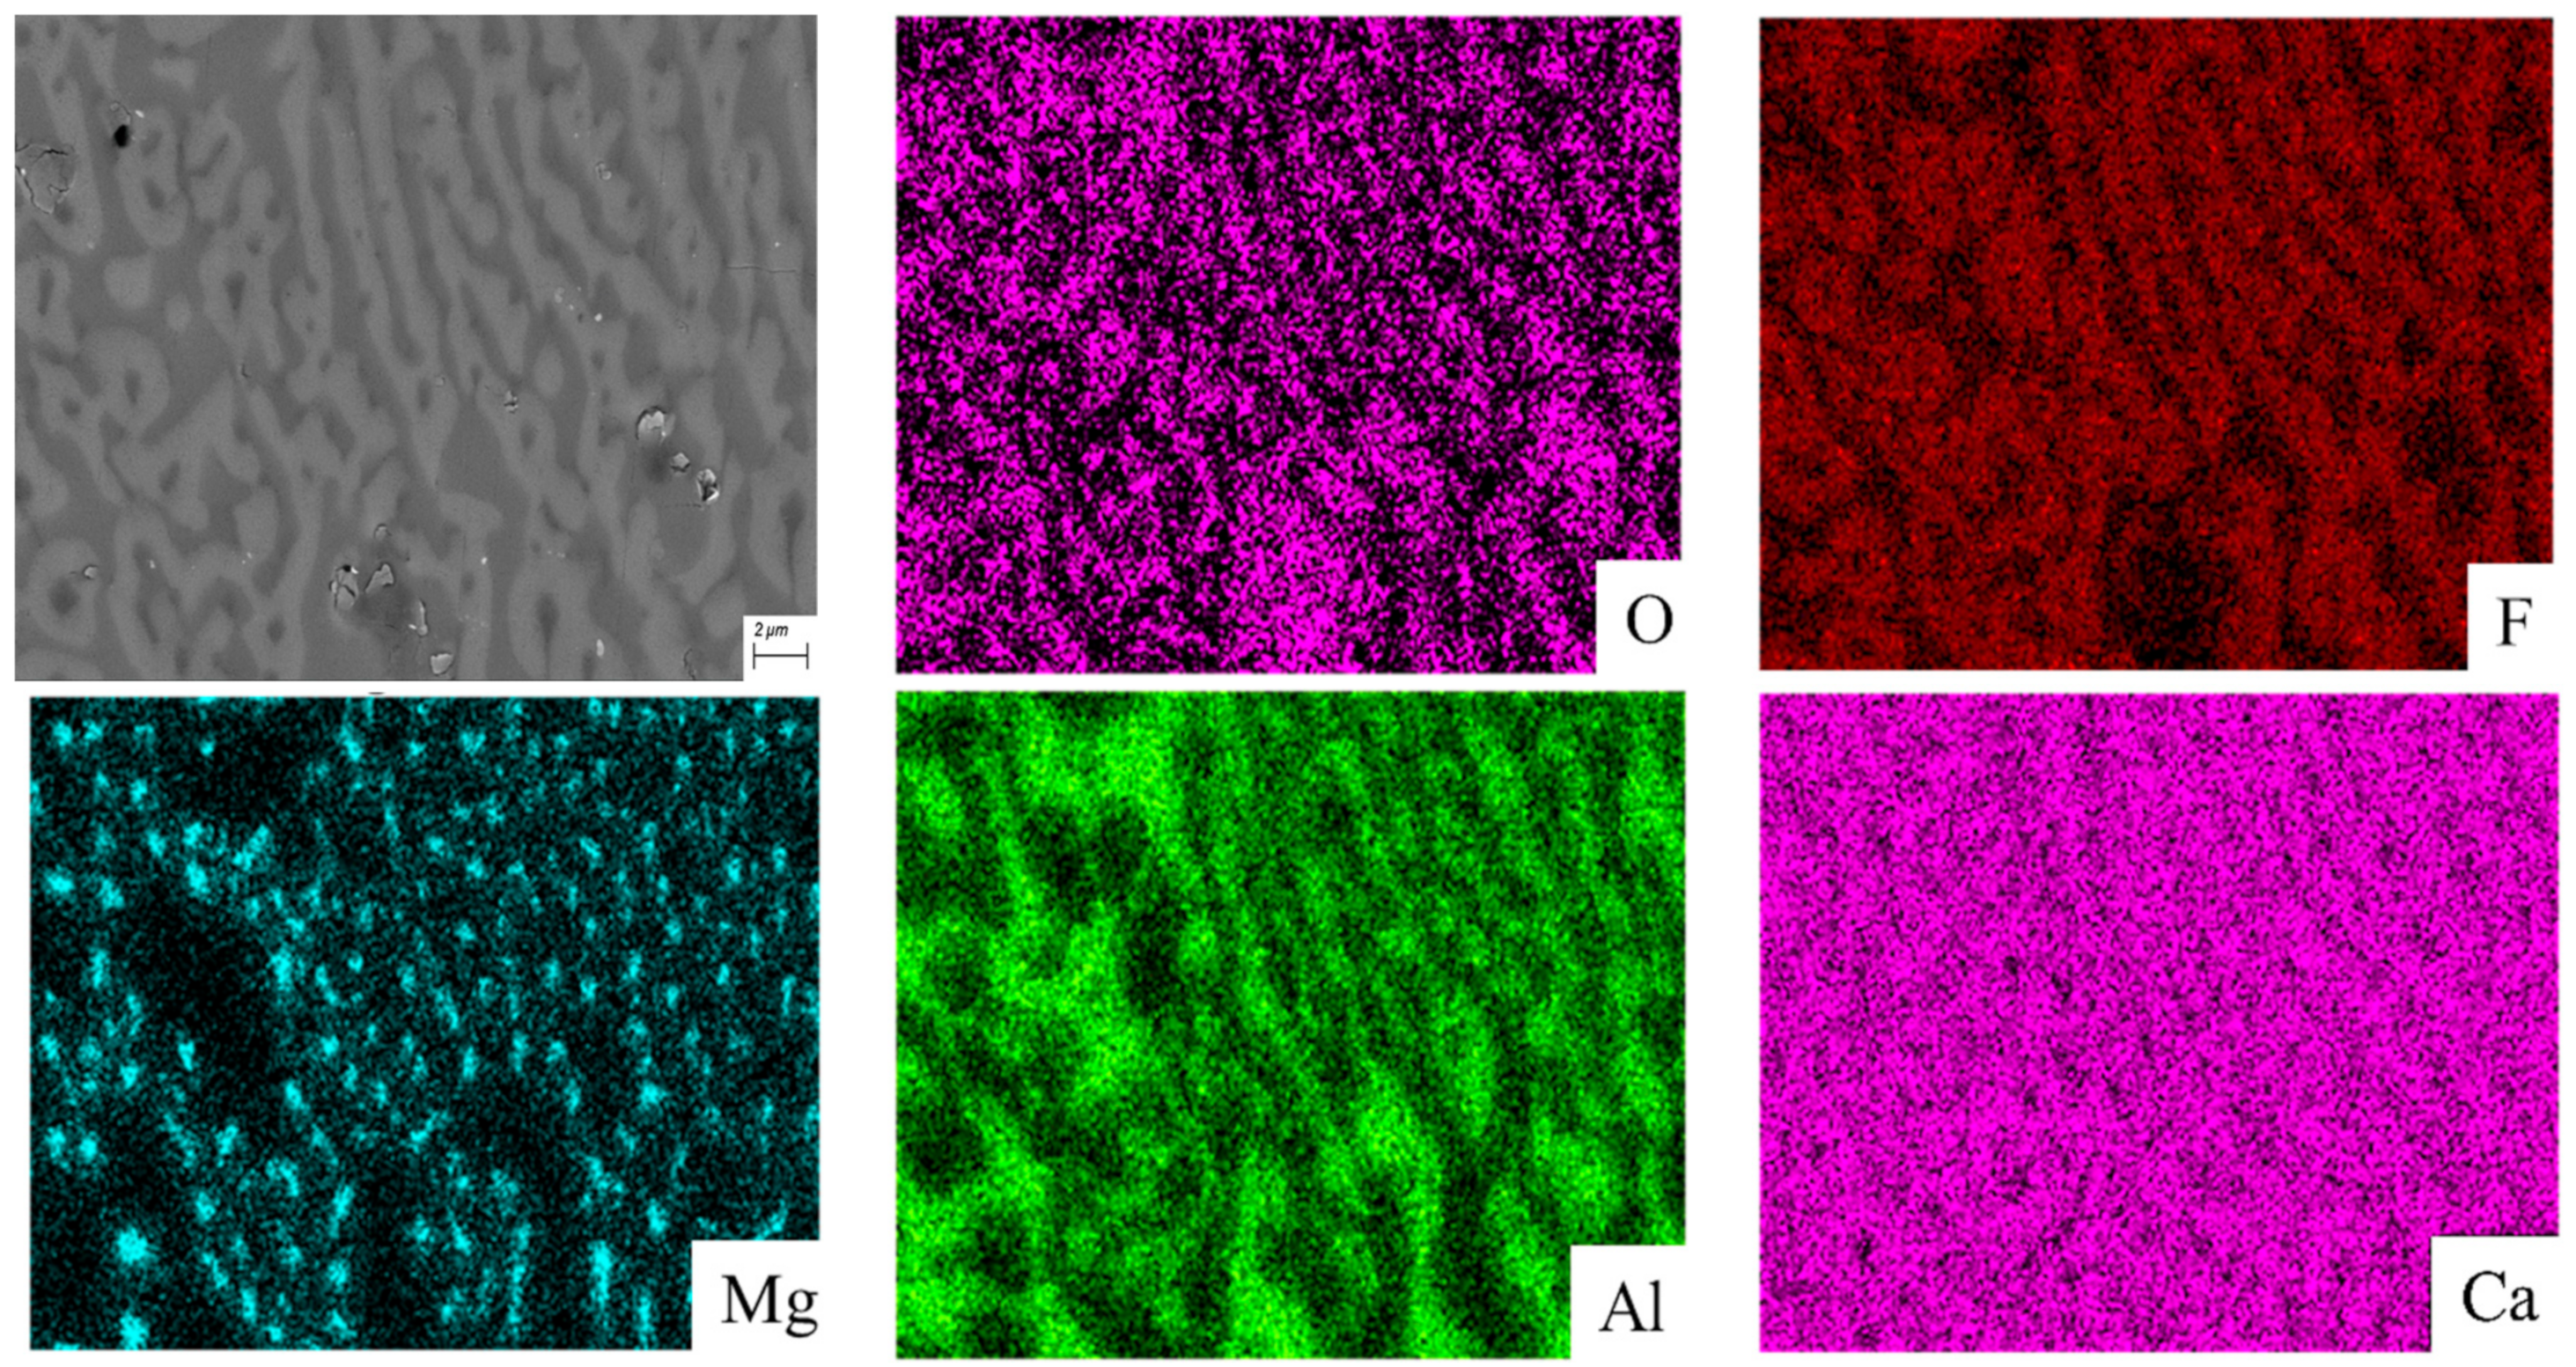
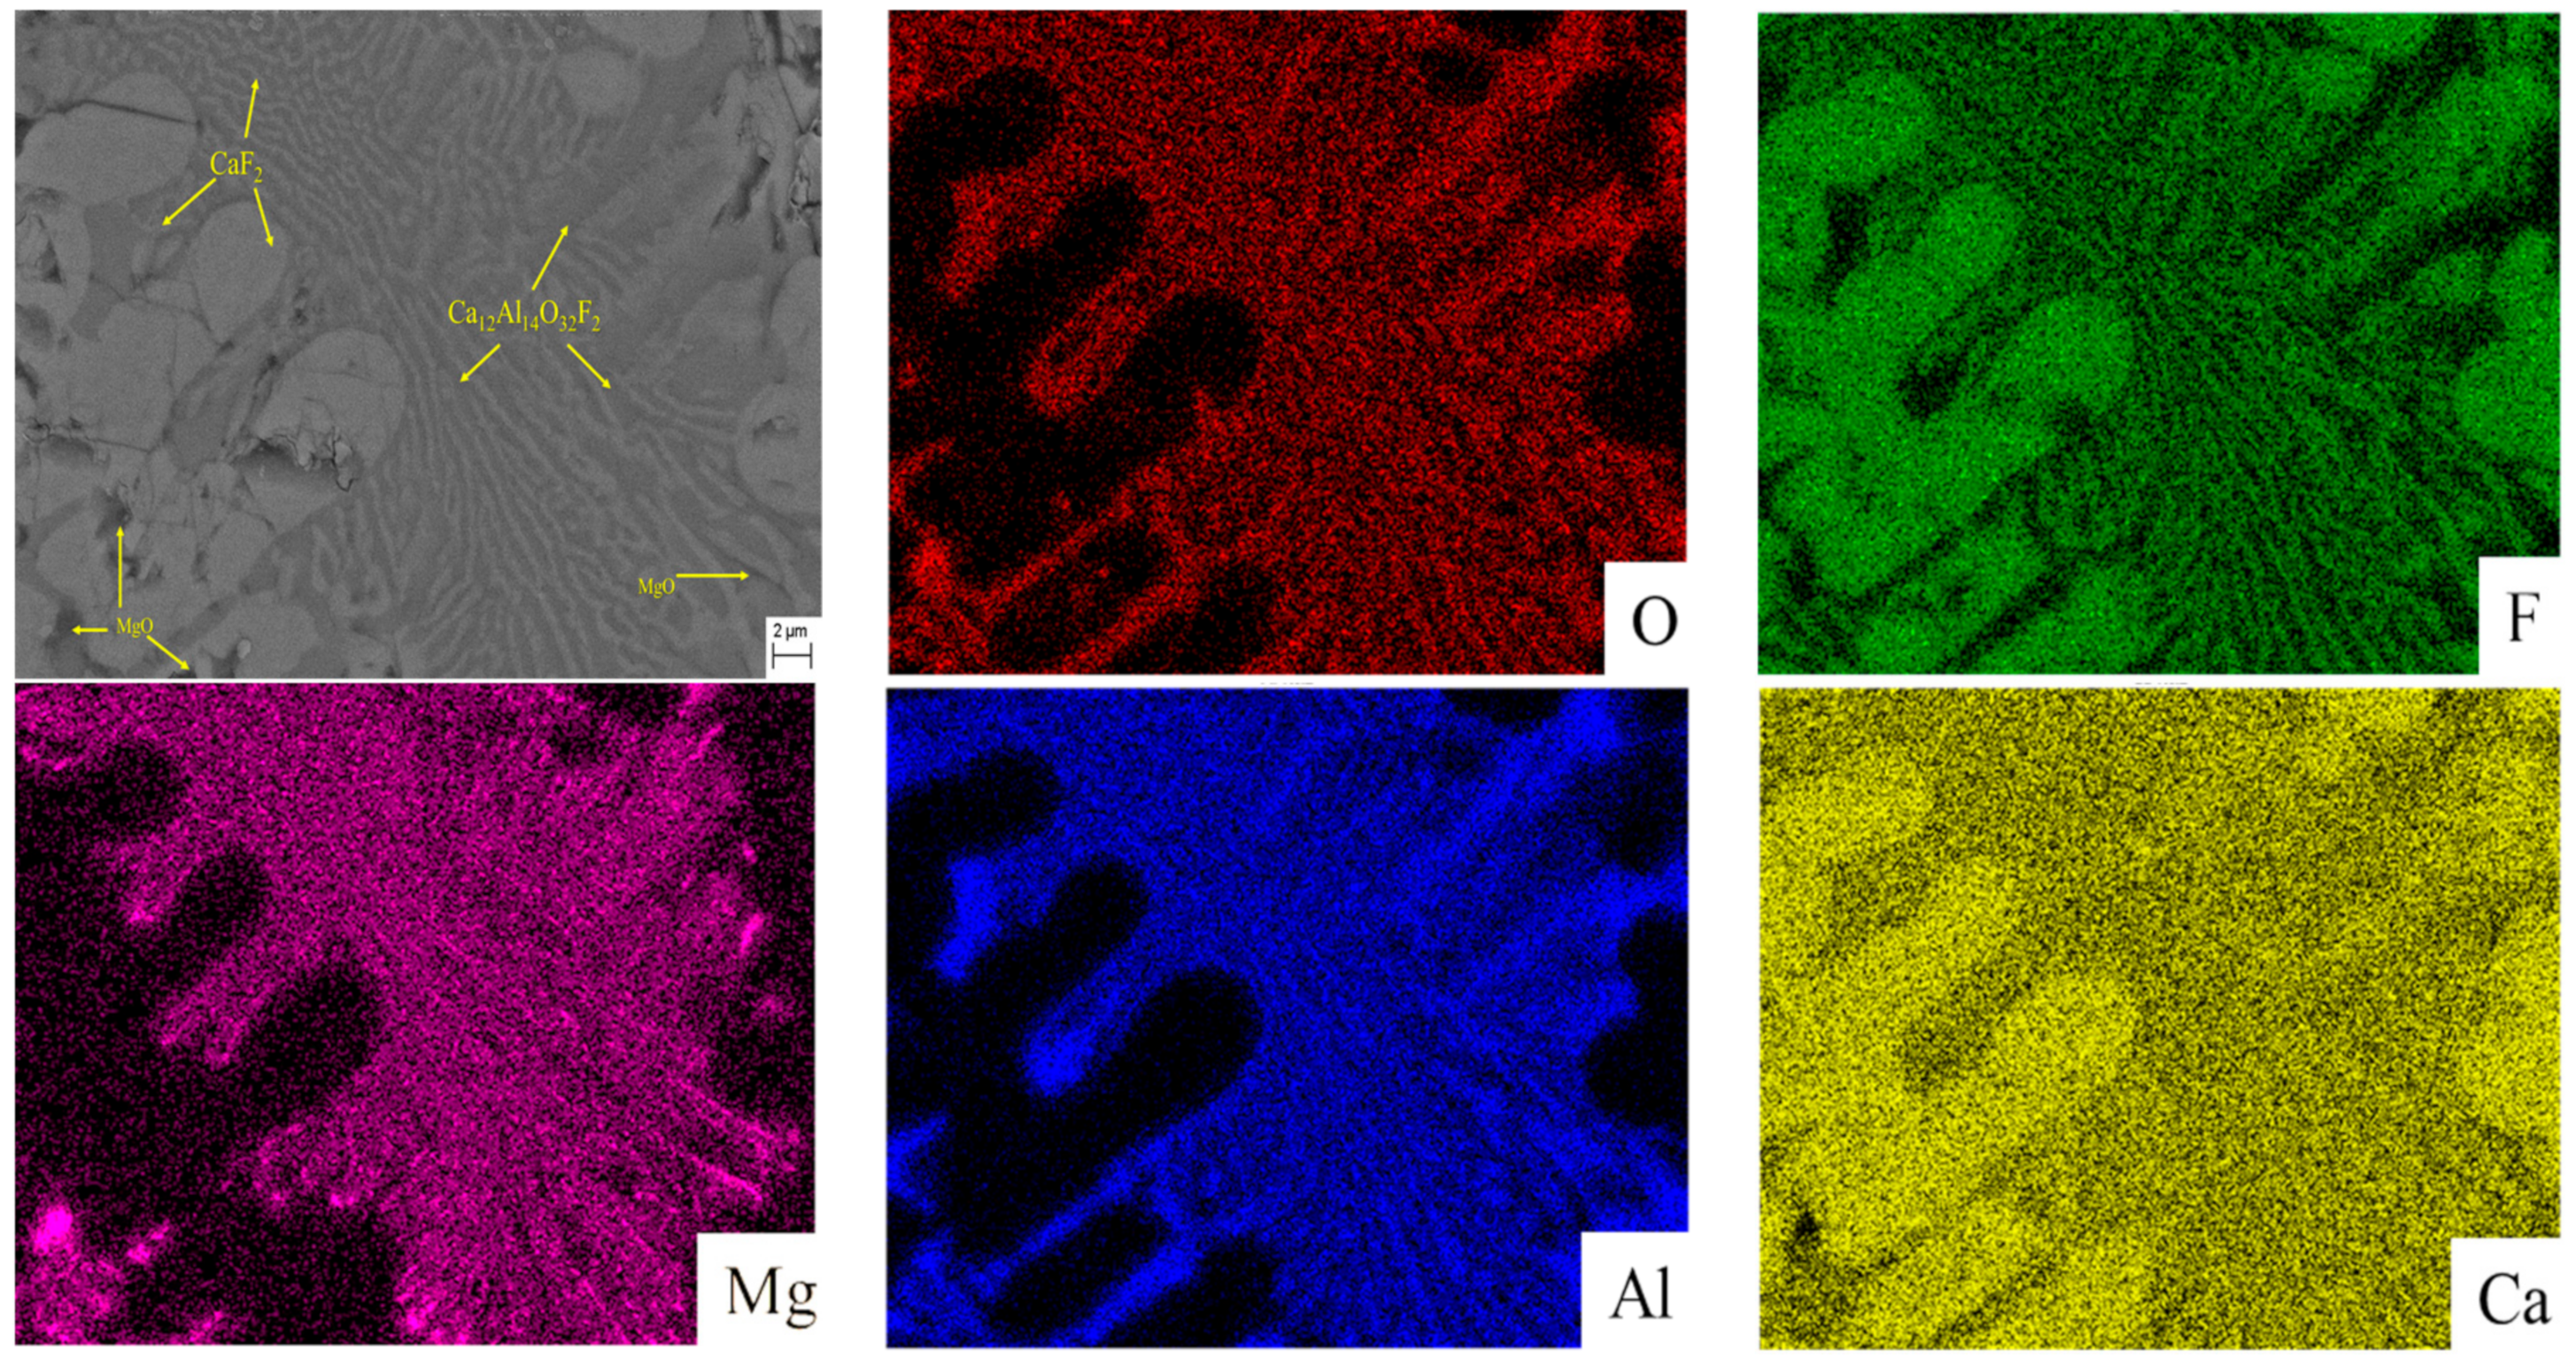
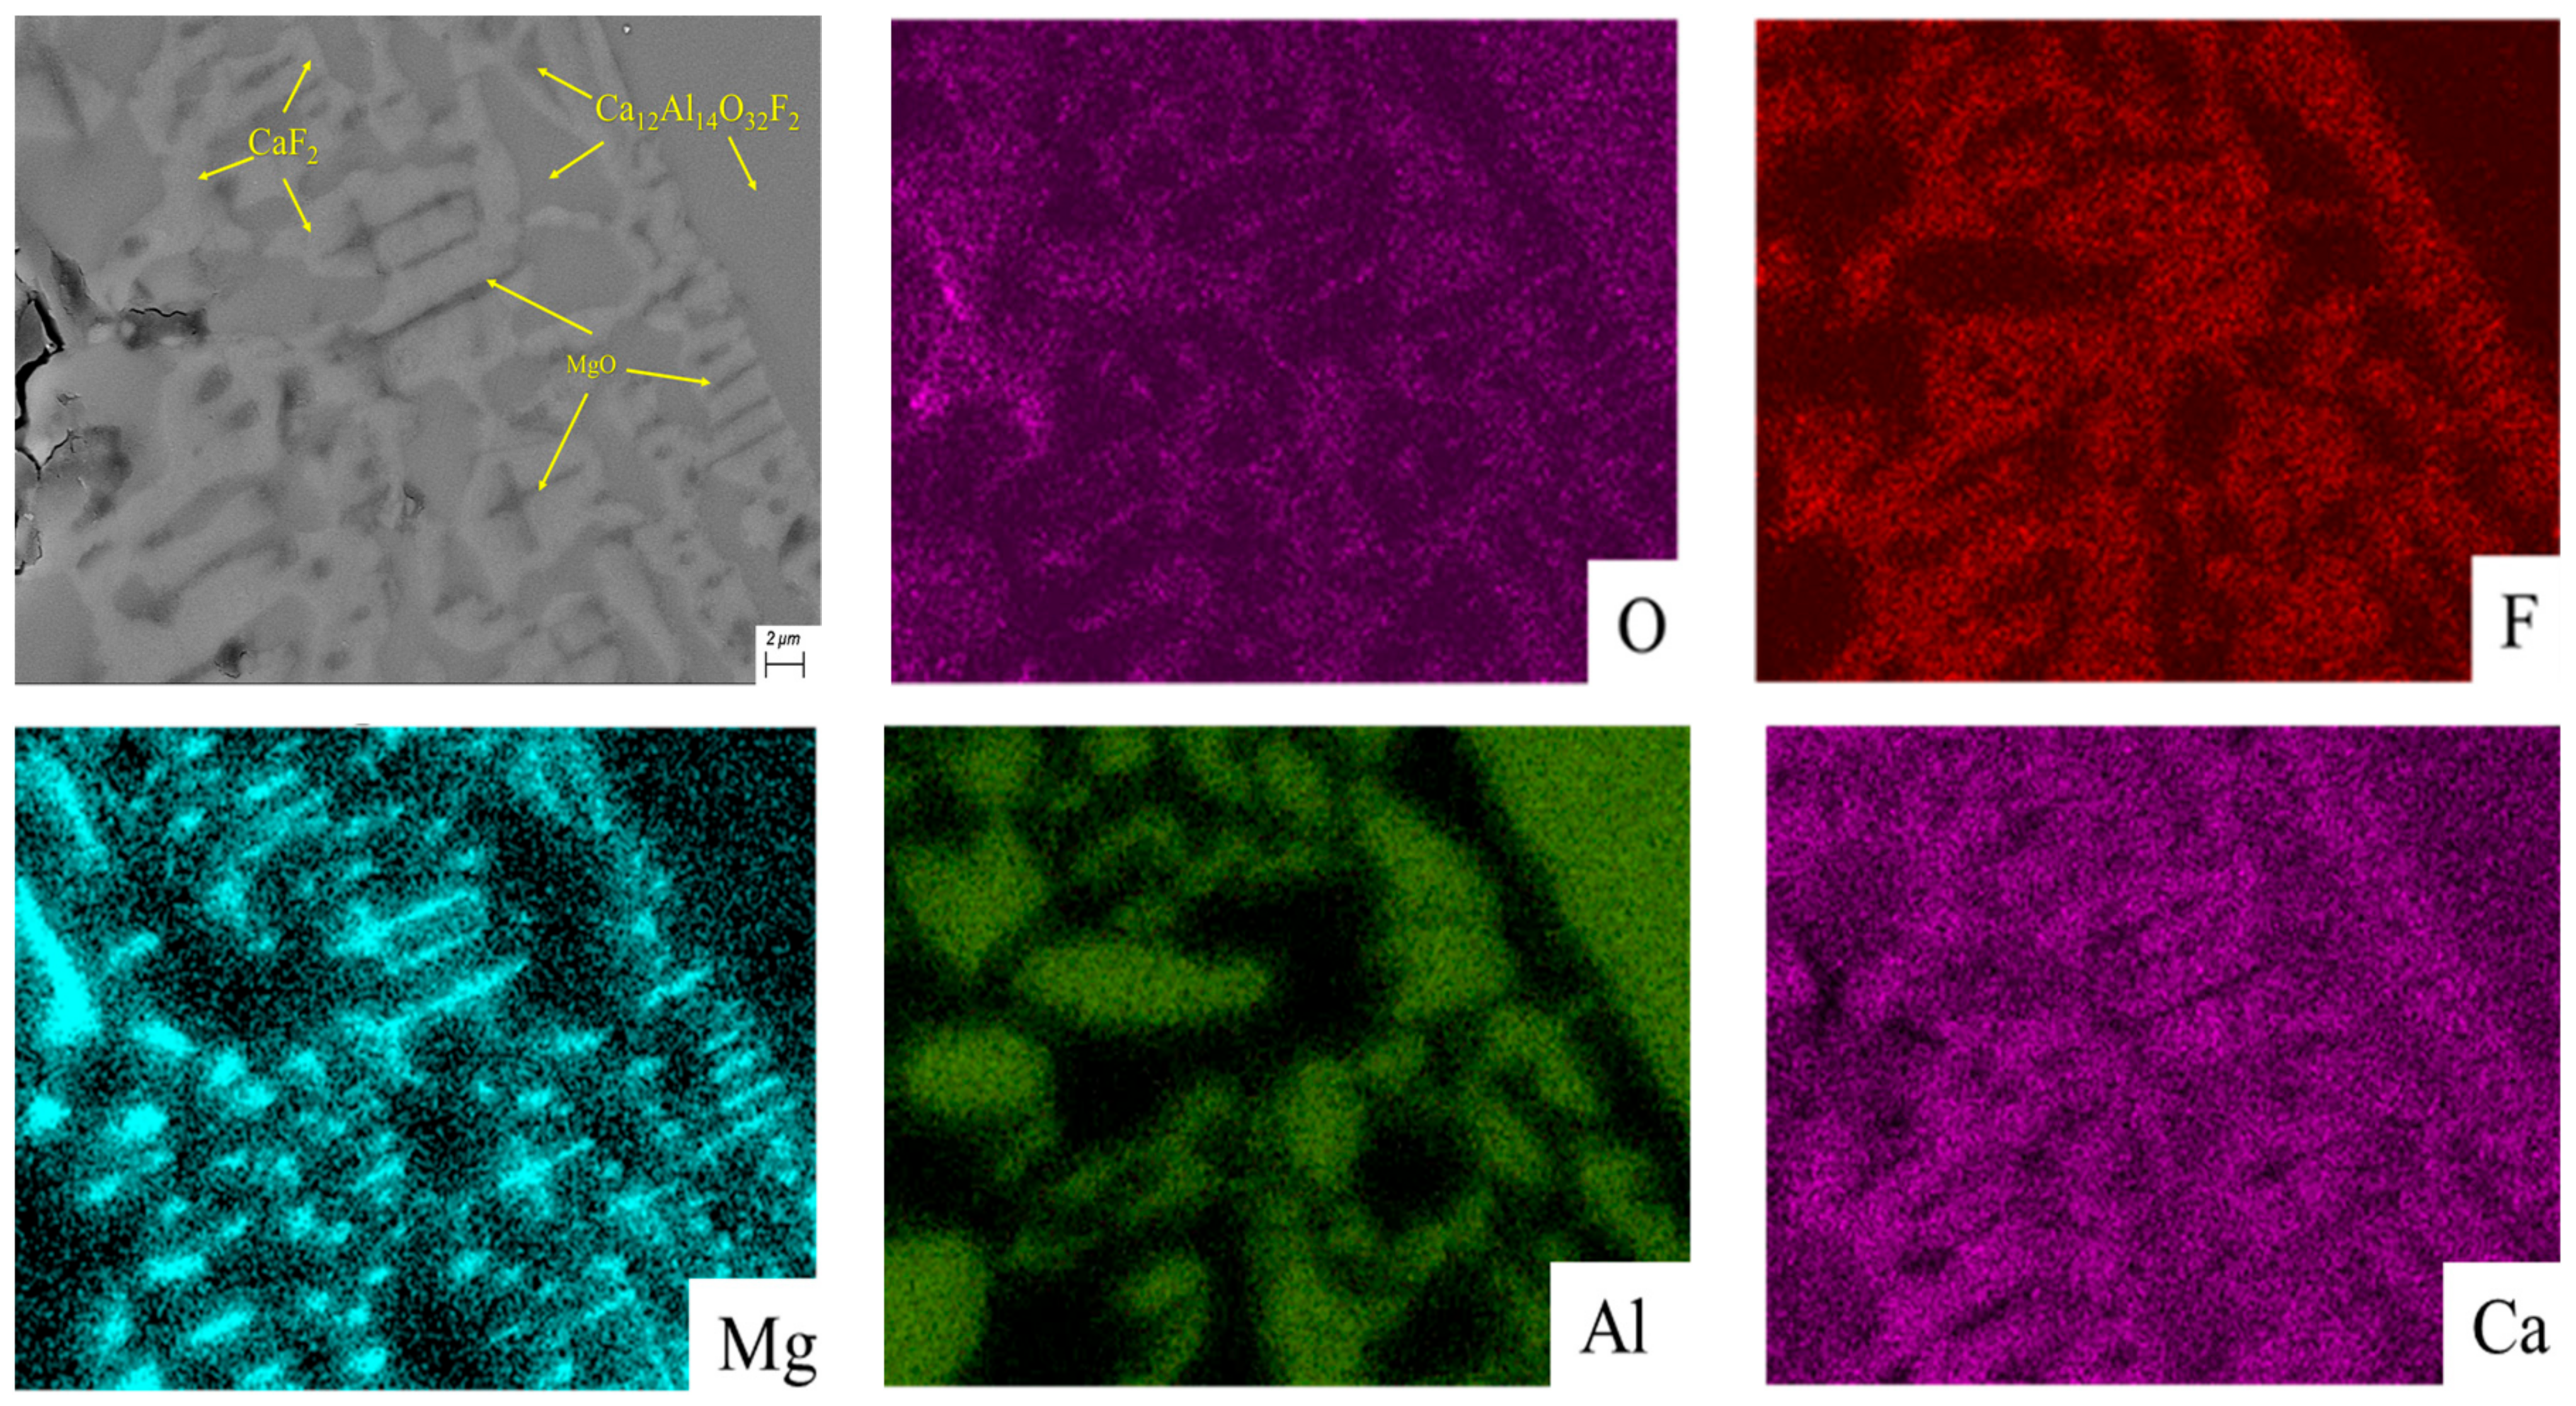
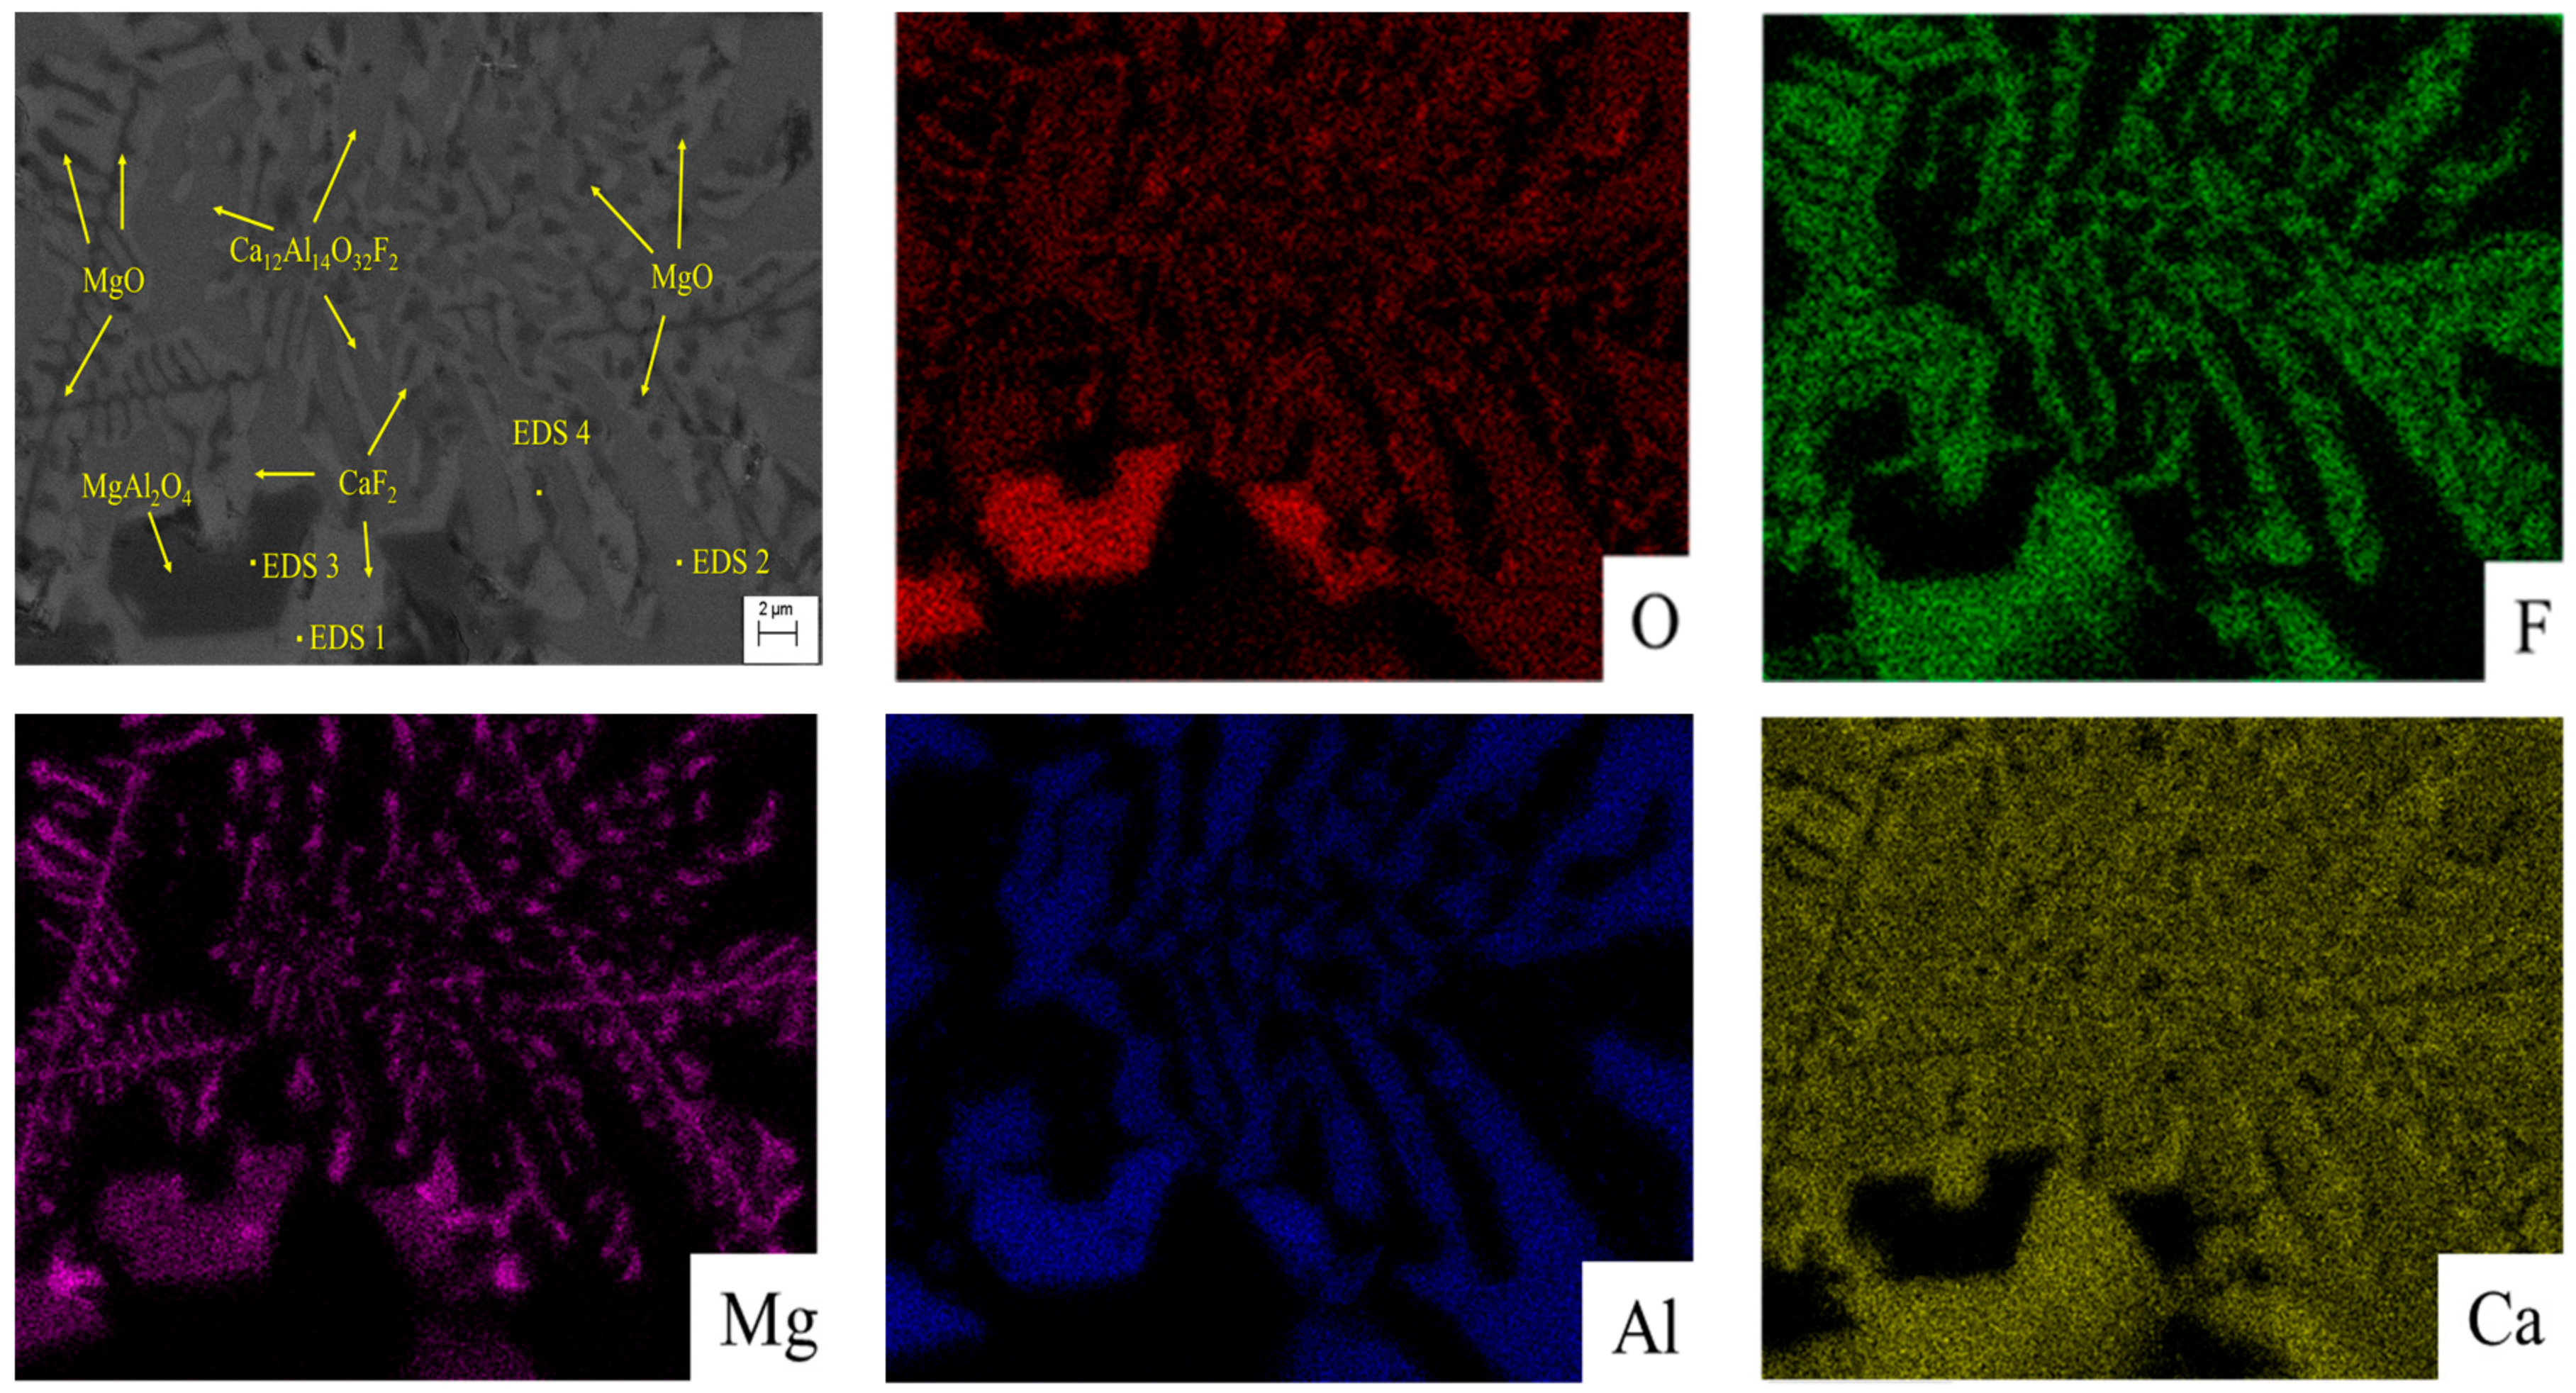
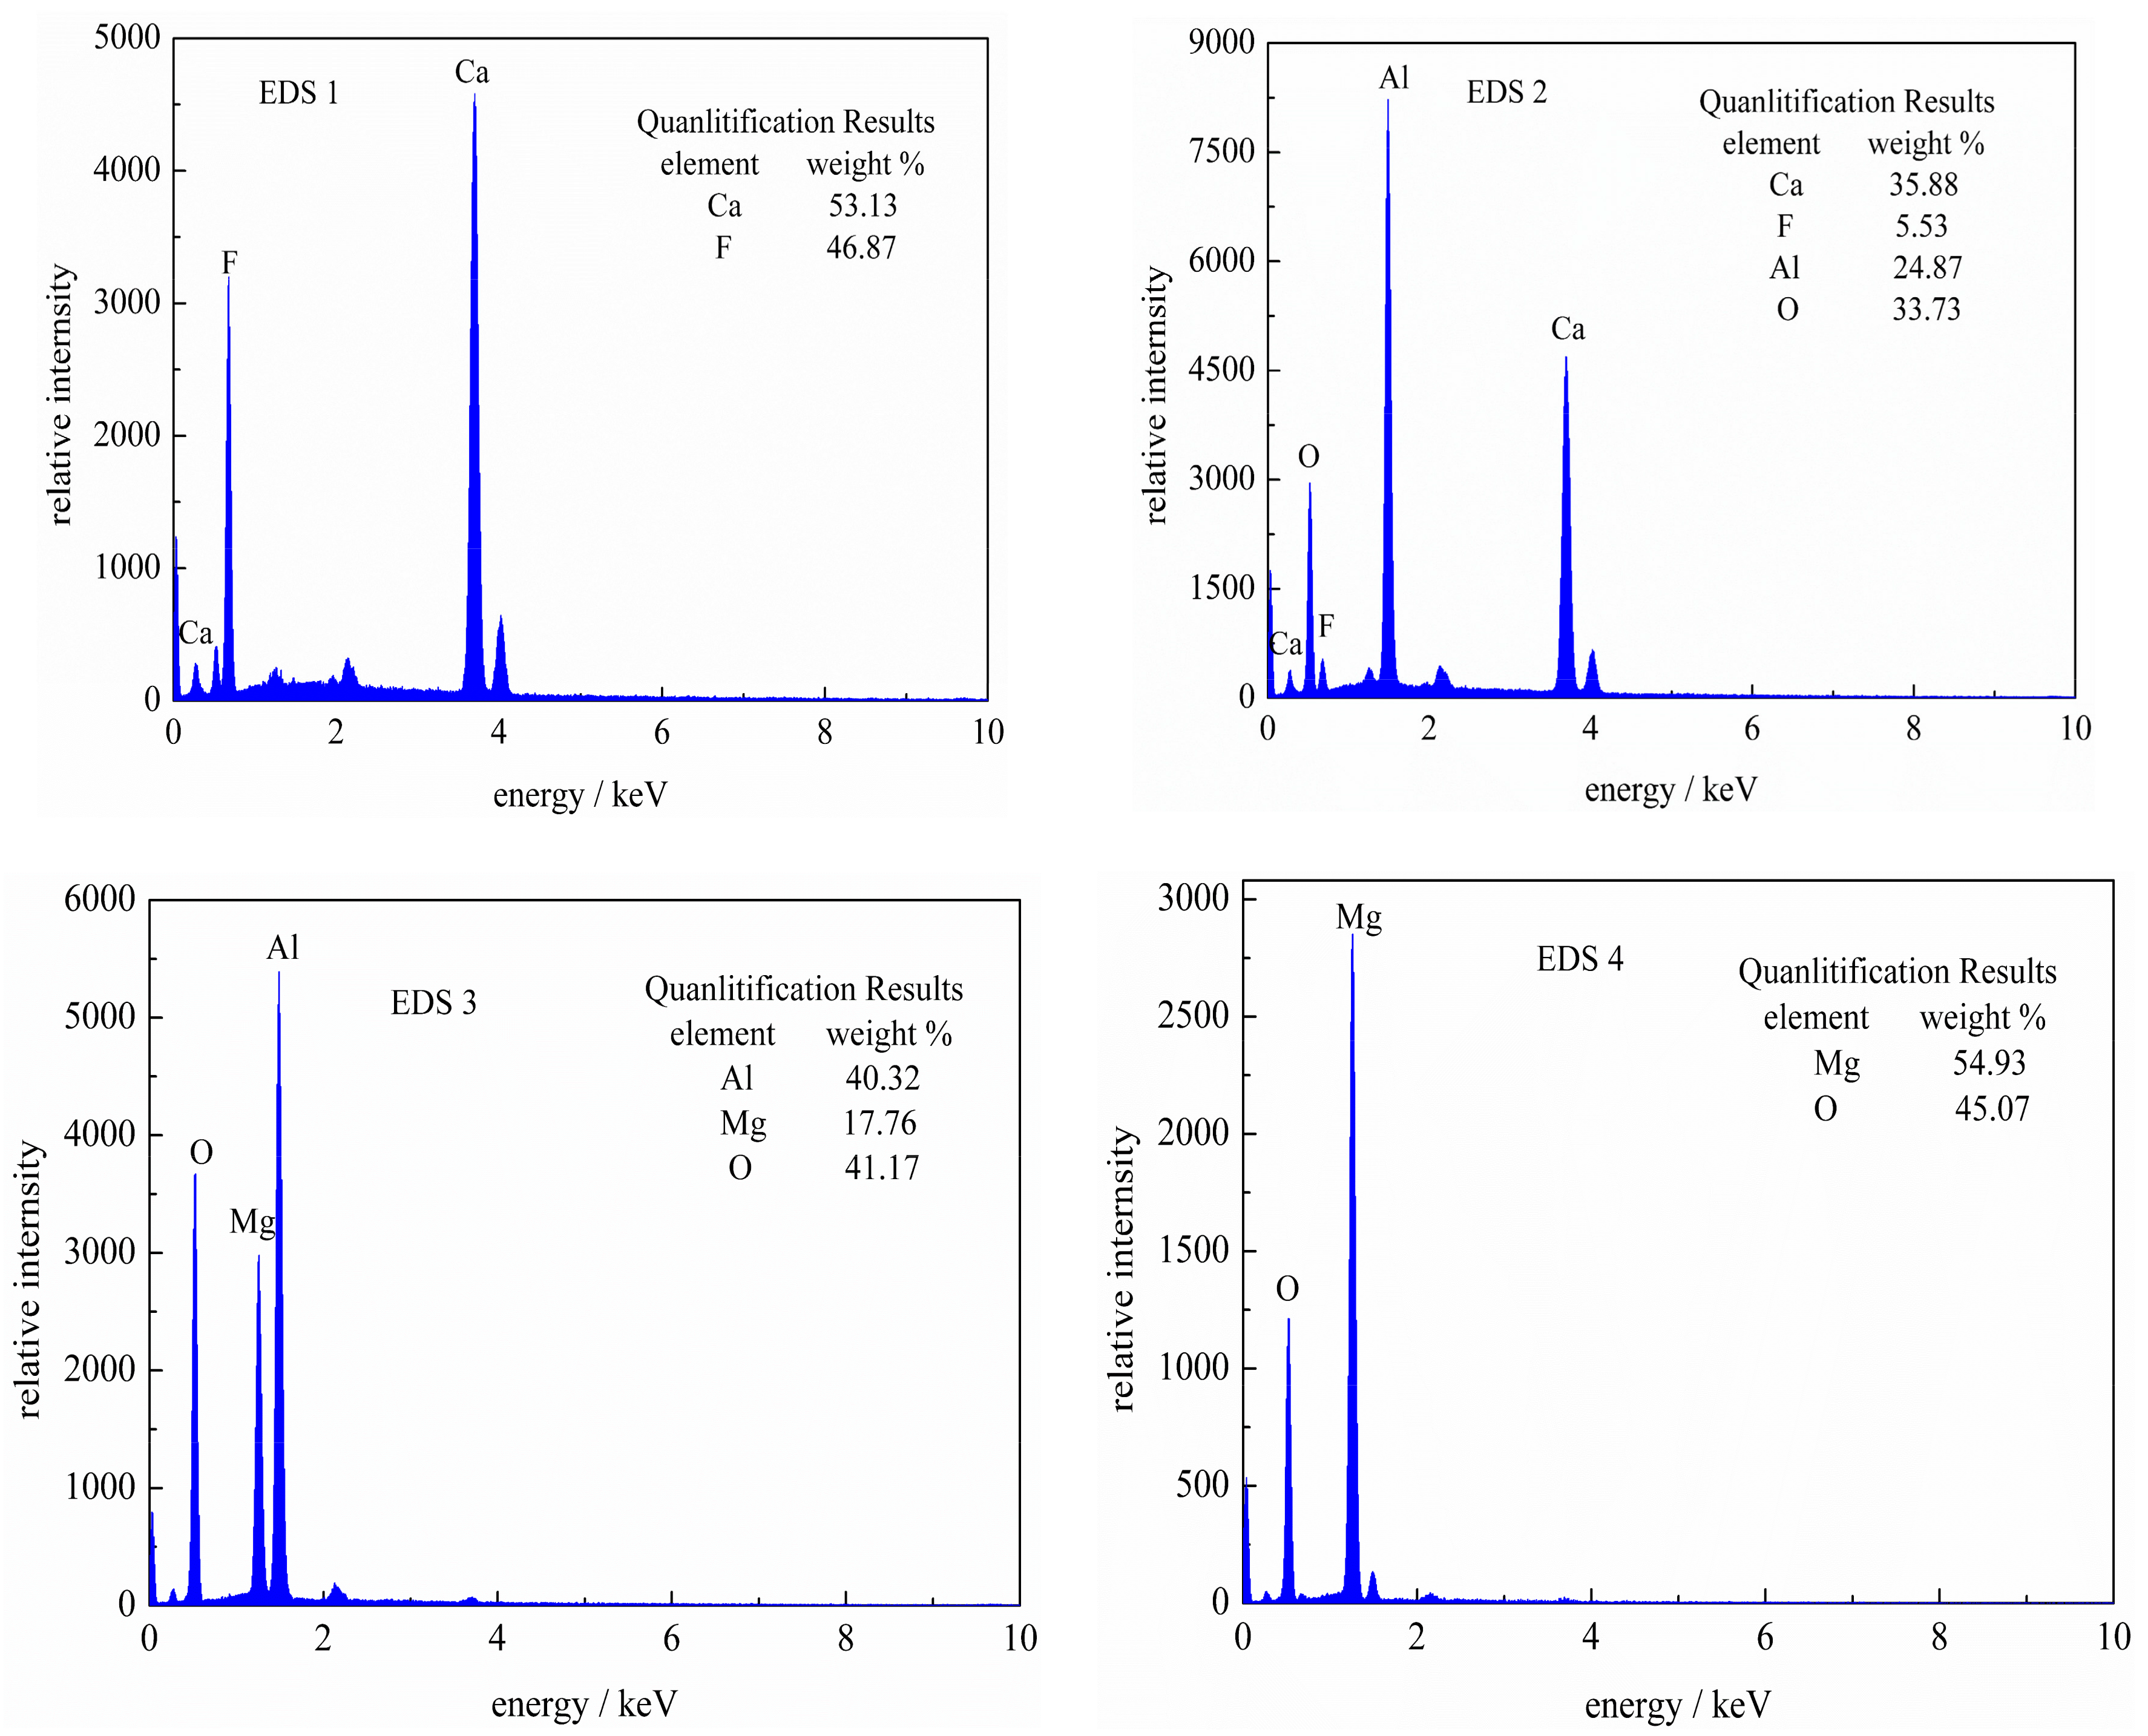
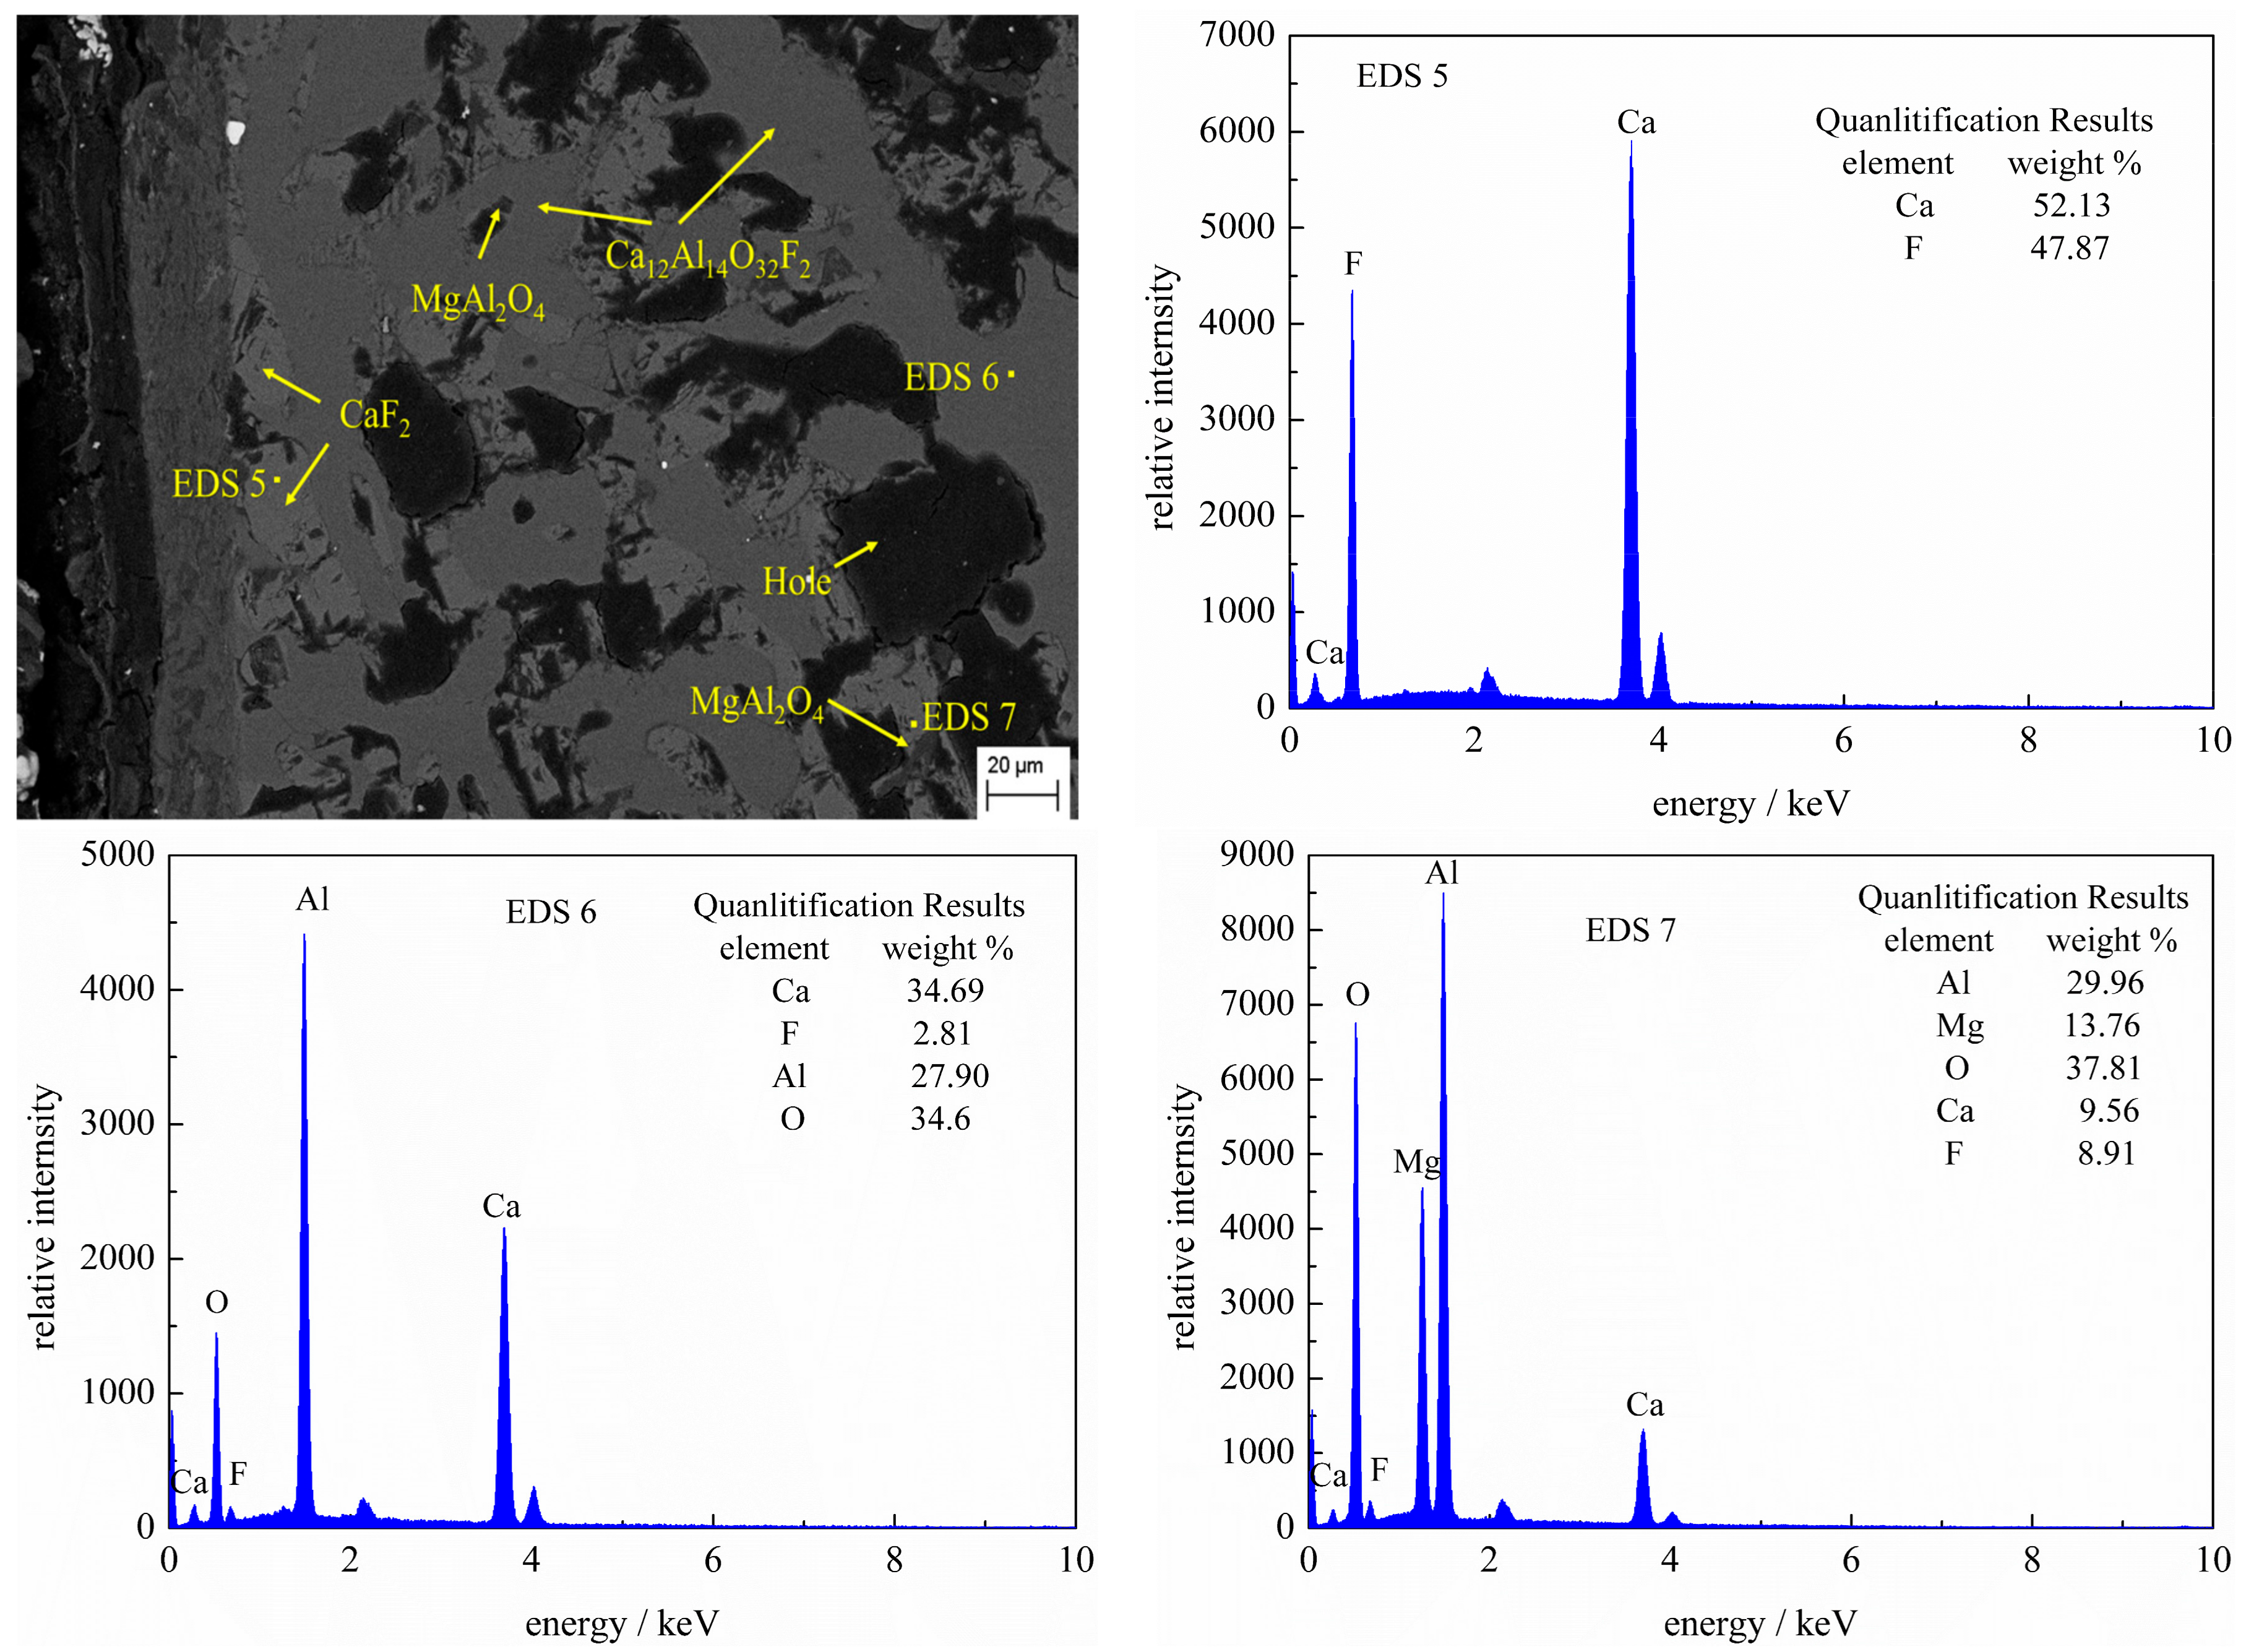
3.3. SEM-EDS Analysis
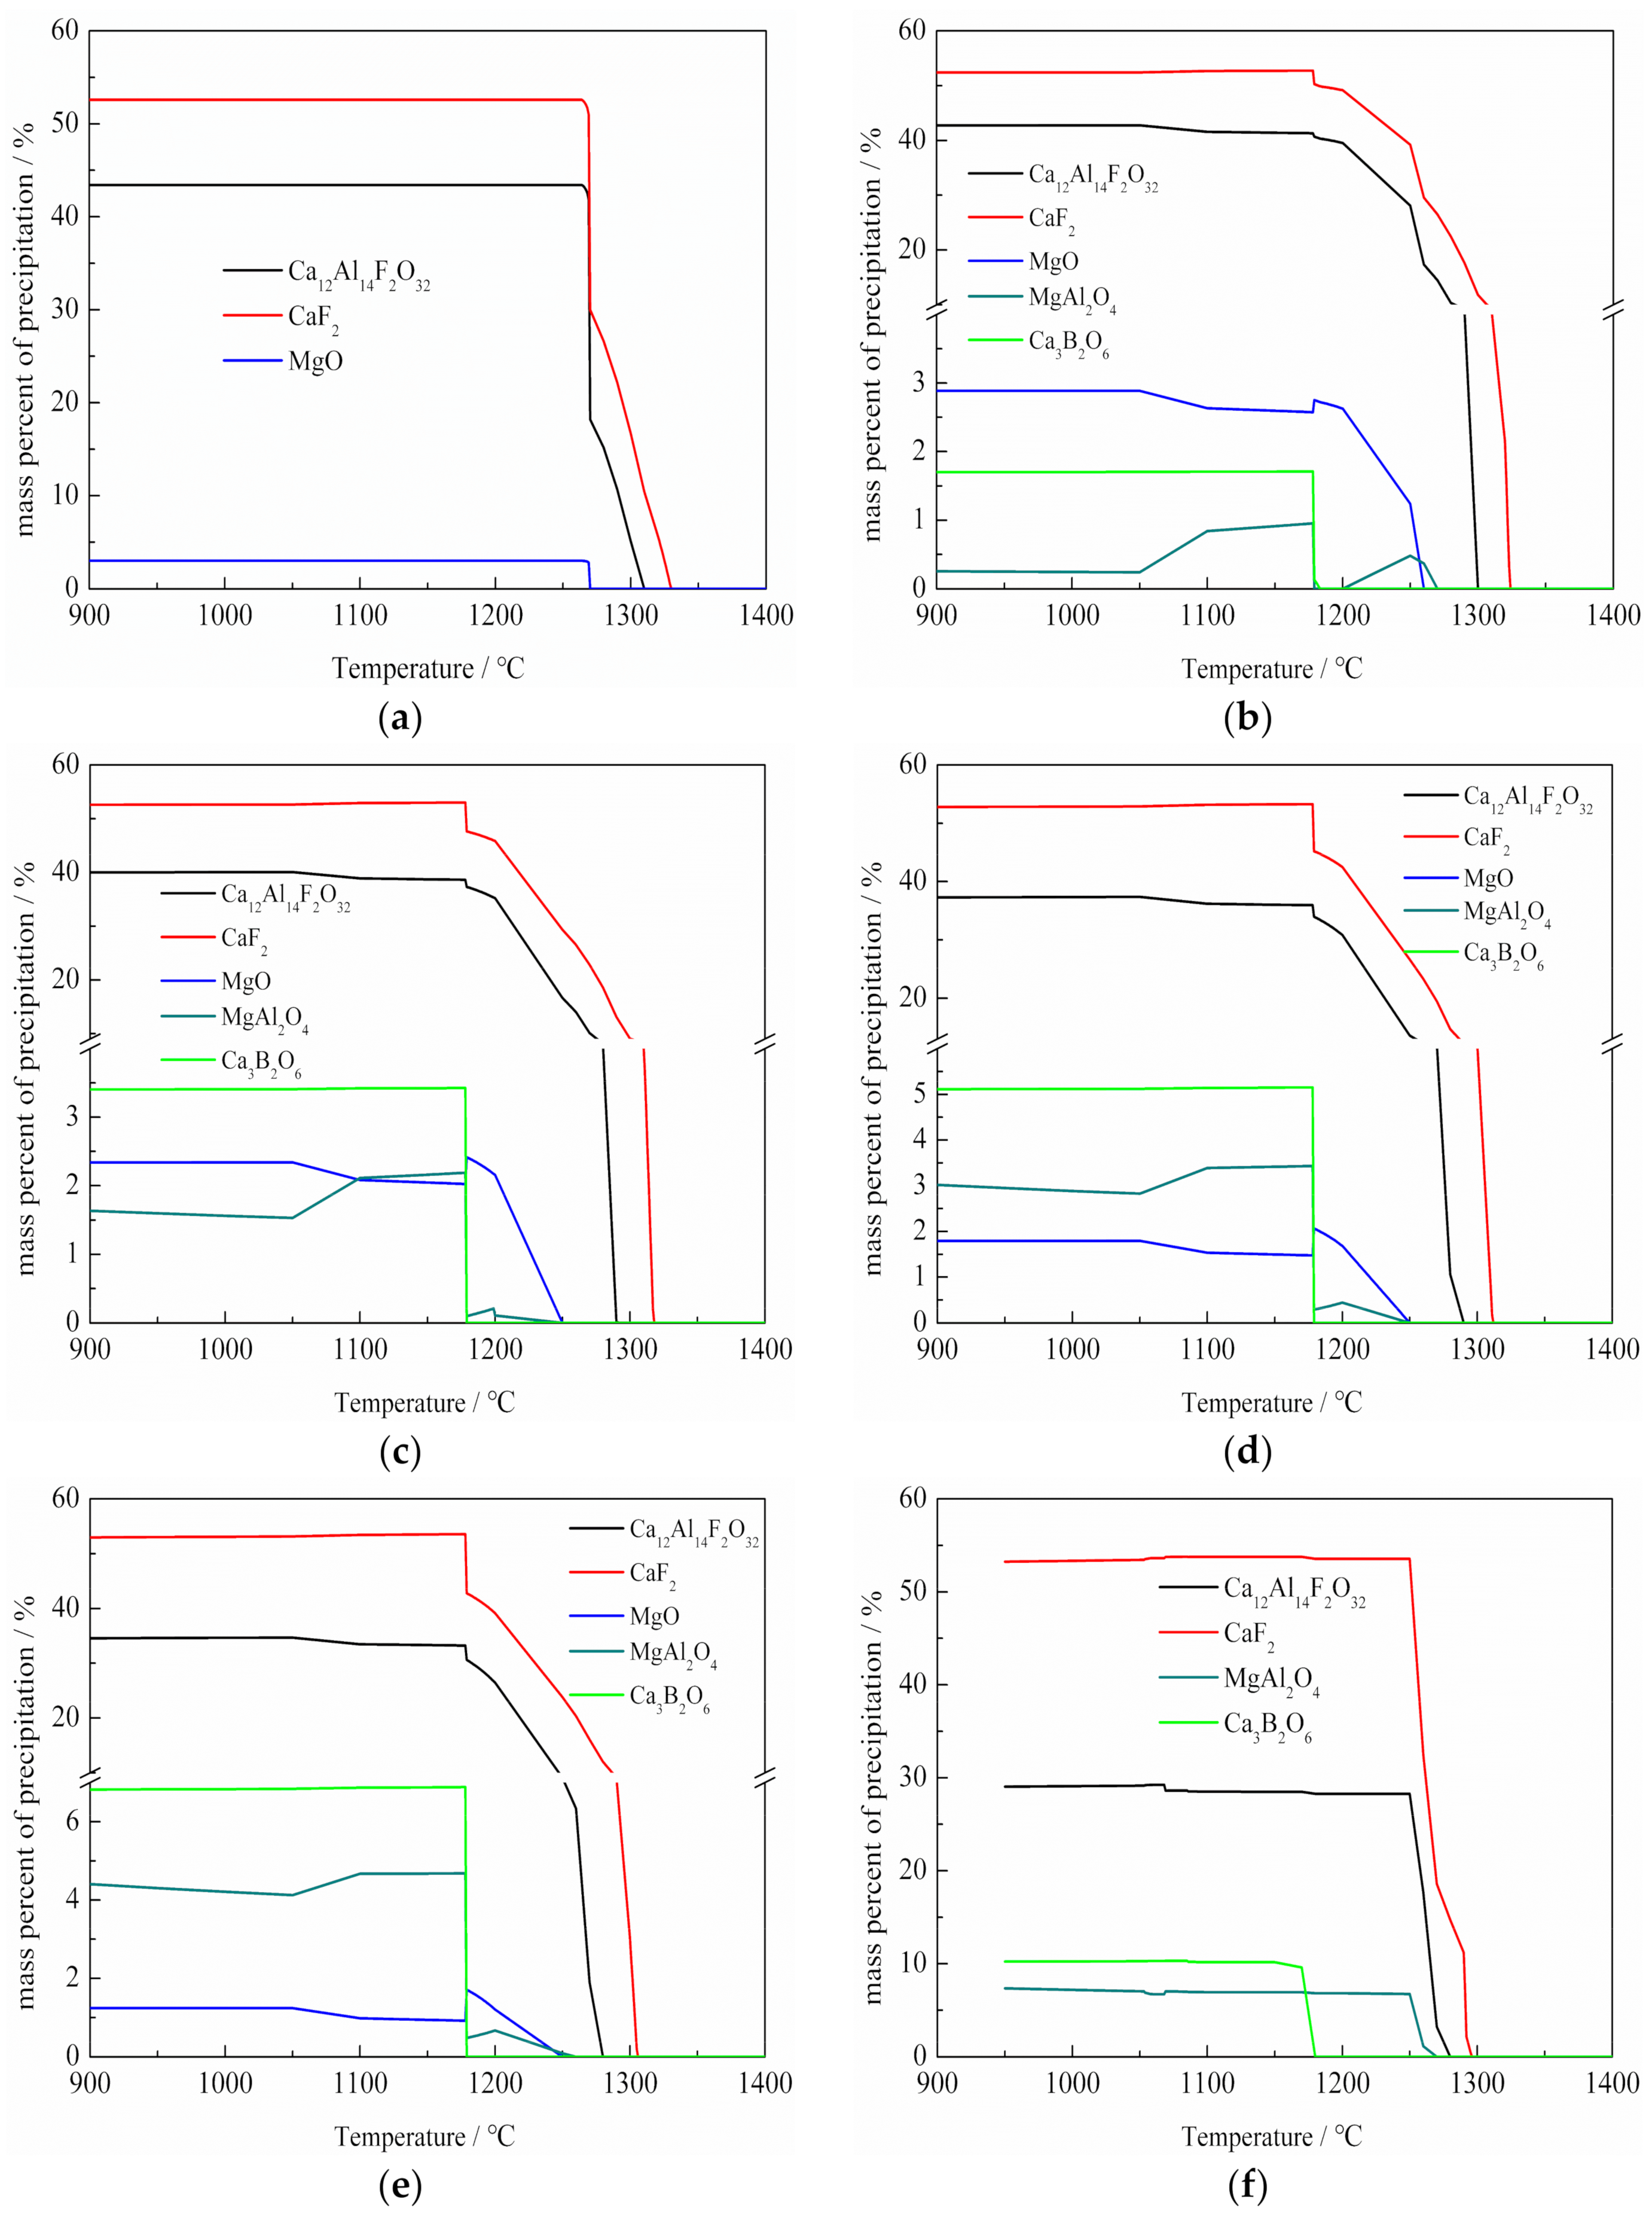
3.4. The Calculated Results by Using FACTSAGE
3.5. Activation Energy of Crystallization
4. Conclusions
Author Contributions
Funding
Conflicts of Interest
References
- Blaes, N.; Donth, B.; Bokelmann, D. High chromium steel forgings for steam turbines at elevated temperatures. Energy Mater. 2007, 2, 207–213. [Google Scholar] [CrossRef]
- Kim, J.T.; Kong, B.G. Materials Technology for PC-TPP in Green Economic Era. Mater. Sci. Forum 2010, 654, 398–403. [Google Scholar] [CrossRef]
- Masuyama, F. History of Power Plants and Progress in Heat Resistant Steels. ISIJ Int. 2001, 41, 612–625. [Google Scholar] [CrossRef]
- Knabl, M.; Eynatten, K.V.; Kubin, M.; Scheriau, A.; Holzgruber, H. Supersized ESR—strategies for a further optimization and size increase of the process. BHM 2018, 163, 355–360. [Google Scholar] [CrossRef]
- Van Den Avyle, J.A.; Brooks, J.A.; Powell, A.C. Reducing defects in remelting processes for high-performance alloys. JOM 1998, 50, 22–25. [Google Scholar] [CrossRef]
- Mitchell, A.; Reyes-Carmona, F.; Samuelsson, E. The Deoxidation of Low-alloy Steel Ingots during ESR. ISIJ Int. 1984, 24, 547–556. [Google Scholar] [CrossRef]
- Sawa, S.; Shibuya, S.; Kinbara, S. On the behavior of active elements during electroslag remelting process of Ni-base alloy. Tetsu-to-Hagane 1977, 63, 2198–2207. [Google Scholar] [CrossRef]
- Jiang, Z.H.; Geng, X. Research on the Surface Quality of ESR Large Slab Ingots. Adv. Mater. Res. 2011, 146, 670–673. [Google Scholar] [CrossRef]
- Shi, C.B.; Li, J.; Cho, J.W.; Jiang, F.; Jung, I.H. Effect of SiO2 on the crystallization behaviors and in-mold performance of CaF2-CaO-Al2O3 slags for drawing-ingot-type electroslag remelting. Metall. Mater. Trans. B 2015, 46, 2110–2120. [Google Scholar] [CrossRef]
- Li, W.Z.; Wang, W.Y.; Hu, Y.C.; Chen, Y.X. The Estimation and Control of the Electroslag Remelting Melt Rate by Mechanism-Based Modeling. Metall. Mater. Trans. B 2012, 43, 276–289. [Google Scholar] [CrossRef]
- Nakada, H.; Susa, M.; Seko, Y.; Hayashi, M.; Nagata, K. Mechanism of heat transfer reduction by crystallization of mold flux for continuous casting. ISIJ Int. 2008, 48, 446–453. [Google Scholar] [CrossRef]
- Hayashi, M.; Abas, R.A.; Seetharaman, S. Effect of crystallinity on thermal diffusivities of mould fluxes for the continuous casting of steels. ISIJ Int. 2004, 44, 691–697. [Google Scholar] [CrossRef]
- Yan, W.; Chen, W.; Yang, Y.; Lippold, C.; Mclean, A. Evaluation of B2O3 as replacement for CaF2 in CaO–Al2O3 based mould flux. Ironmak. Steelmak. 2016, 43, 316–323. [Google Scholar] [CrossRef]
- Park, J.H. The effect of boron oxide on the crystallization behavior of MgAl2O4 spinel phase during the cooling of the CaO-SiO2-10 mass% MgO-30 mass%Al2O3 systems. Met. Mater. Int. 2010, 16, 987–992. [Google Scholar] [CrossRef]
- Wei, J.; Wang, W.L.; Zhou, L.J.; Huang, D.Y.; Zhao, H.; Ma, F.J. Effect of Na2O and B2O3 on the crystallization behavior of low fluorine mold fluxes for casting medium carbon steels. Metall. Mater. Trans. B 2014, 45, 643–652. [Google Scholar] [CrossRef]
- Eskandari, M.; Zarei Hanzaki, A.; Szpunar, J.A.; Mohtadi Bonab, M.A.; Kamail, M.; Nazarian Samani, M. Microstructure evolution and mechanical behavior of a new microalloyed high Mn austenitic steel during compressive deformation. Mater. Sci. Eng. A 2014, 615, 424–435. [Google Scholar] [CrossRef]
- Jamaati, R.; Toroghinejad, M.R.; Mohtadi Bonab, M.A.; Edris, H.; Szpunar, J.A.; Salmani, M.R. Texture development of ARB-processed steel-based nanocomposite. J. Mater. Eng. Perform. 2014, 23, 4436–4445. [Google Scholar] [CrossRef]
- Song, W.J.; Tang, L.H.; Zhu, X.D.; Wu, Y.Q.; Zhu, Z.B.; Koyama, S. Effect of coal ash composition on ash fusion temperature. Energe Fuels 2009, 24, 182–189. [Google Scholar] [CrossRef]
- Jak, E. Prediction of coal ash fusion temperatures with the F∗A∗C∗T thermodynamic computer package. Fuels 2002, 81, 1655–1668. [Google Scholar] [CrossRef]
- Freeman, E.S.; Carroll, B. The application of thermoanalytical techniques to reaction kinetics: The thermogravimetric evaluation of the kinetics of the decomposition of calcium oxalate monohydrate. J. Phys. Chem. 1958, 62, 394–397. [Google Scholar] [CrossRef]
- Jerez, A. A modification to the Freeman and Carroll method for the analysis of the kinetics of non-isothermal processes. J. Therm. Anal. Calorim. 1983, 26, 315–318. [Google Scholar] [CrossRef]
- Gu, S.P.; Wen, G.H.; Ding, Z.Q.; Guo, J.L.; Tang, P.; Liu, Q. Effect of bubbles on crystallization behavior of CaO-SiO2 Based Slags. Metals 2019, 9, 193. [Google Scholar] [CrossRef]
- Van Dooren, A.A.; Müller, B.W. Effects of experimental variables on the determination of kinetic parameters with differential scanning calorimetry. II. Calculation procedure of Freeman and Carroll. Thermochim. Acta 1983, 65, 269–284. [Google Scholar] [CrossRef]
- Francis, A.A. Non-isothermal crystallization kinetics of a blast furnace slag glass. J. Am. Ceram. Soc. 2005, 88, 1859–1863. [Google Scholar] [CrossRef]
- Ewais, E.M.M.; Grathwohl, G.; Ahmed, Y.M.Z. Crystallization of mixer slag-derived glass–ceramic composites. J. Am. Ceram. Soc. 2010, 93, 671–678. [Google Scholar] [CrossRef]
- Wang, Z.J.; Ni, W.; Jia, Y.; Zhu, L.P.; Huang, X.Y. Crystallization behavior of glass ceramics prepared from the mixture of nickel slag, blast furnace slag and quartz sand. J. Non-Cryst. Solids 2010, 356, 1554–1558. [Google Scholar] [CrossRef]
- Borchardt, H.J.; Daniels, F. The application of differential thermal analysis to the study of reaction kinetics. J. Am. Chem. Soc. 1957, 79, 41–46. [Google Scholar] [CrossRef]
- Jung, S.S.; Sohn, I. Crystallization Control for Remediation of an FetO rich CaO–SiO2–Al2O3–MgO EAF Waste Slag. Environ. Sci. Technol. 2014, 48, 1886–1892. [Google Scholar] [CrossRef]
- Abdel-Hameed, S.A.M.; El-Kheshen, A.A. Thermal and chemical properties of diopside wollastonite glass-ceramics in the SiO2–CaO–MgO system from raw materials. Ceram. Int. 2003, 29, 265–269. [Google Scholar] [CrossRef]
- Kashiwaya, Y.; Nakauchi, T.; Pham, K.S.; Akiyama, S.; Ishii, K. Crystallization behaviors concerned with TTT and CCT diagrams of blast furnace slag using hot thermocouple technique. ISIJ Int. 2007, 47, 44–52. [Google Scholar] [CrossRef]
- Kalmanovitch, D.P. Crystallization of coal ash melts. In Mineral Matter and Ash in Coal; Williamson, J., Vorres, K.S., Eds.; American Chemical Society: Washington, DC, USA, 1986; pp. 234–255. [Google Scholar]
- Zheng, D.L.; Li, J.; Shi, C.B.; Ju, J.T. Crystallization characteristics and in-mold performance of electroslag remelting-type TiO2-bearing slag. Metall. Mater. Trans. B 2019, 50, 1148–1160. [Google Scholar] [CrossRef]
- Seo, M.D.; Shi, C.B.; Baek, J.Y.; Cho, J.W.; Kim, S.H. Kinetics of isothermal melt crystallization in CaO-SiO2-CaF2-based mold fluxes. Metall. Mater. Trans. B 2015, 46, 2374–2383. [Google Scholar] [CrossRef]


| Before Premelted | After Premelted | ||||||||||
|---|---|---|---|---|---|---|---|---|---|---|---|
| Slags number | CaF2 | CaO | Al2O3 | MgO | B2O3 | CaF2 | CaO | Al2O3 | MgO | B2O3 | SiO2 |
| #10 | 55 | 20 | 22 | 3.0 | 0.0 | 53.10 | 21.32 | 21.83 | 3.10 | 0.00 | 0.15 |
| #11 | 55 | 20 | 22 | 3.0 | 0.5 | 52.90 | 21.15 | 21.71 | 3.08 | 0.47 | 0.18 |
| #12 | 55 | 20 | 22 | 3.0 | 1.0 | 52.68 | 21.02 | 21.62 | 3.07 | 0.97 | 0.16 |
| #13 | 55 | 20 | 22 | 3.0 | 1.5 | 52.42 | 20.92 | 21.54 | 3.05 | 1.45 | 0.18 |
| #14 | 55 | 20 | 22 | 3.0 | 2.0 | 52.18 | 20.79 | 21.43 | 3.03 | 1.94 | 0.15 |
| #15 | 55 | 20 | 22 | 3.0 | 3.0 | 51.69 | 20.59 | 21.23 | 3.02 | 2.89 | 0.18 |
© 2019 by the authors. Licensee MDPI, Basel, Switzerland. This article is an open access article distributed under the terms and conditions of the Creative Commons Attribution (CC BY) license (http://creativecommons.org/licenses/by/4.0/).
Share and Cite
Peng, L.; Jiang, Z.; Geng, X.; Liu, F.; Li, H. Effect of B2O3 on the Crystallization Behavior of CaF2-Based Slag for Electroslag Remelting 9CrMoCoB Steel. Metals 2019, 9, 1331. https://doi.org/10.3390/met9121331
Peng L, Jiang Z, Geng X, Liu F, Li H. Effect of B2O3 on the Crystallization Behavior of CaF2-Based Slag for Electroslag Remelting 9CrMoCoB Steel. Metals. 2019; 9(12):1331. https://doi.org/10.3390/met9121331
Chicago/Turabian StylePeng, Leizhen, Zhouhua Jiang, Xin Geng, Fubin Liu, and Huabing Li. 2019. "Effect of B2O3 on the Crystallization Behavior of CaF2-Based Slag for Electroslag Remelting 9CrMoCoB Steel" Metals 9, no. 12: 1331. https://doi.org/10.3390/met9121331
APA StylePeng, L., Jiang, Z., Geng, X., Liu, F., & Li, H. (2019). Effect of B2O3 on the Crystallization Behavior of CaF2-Based Slag for Electroslag Remelting 9CrMoCoB Steel. Metals, 9(12), 1331. https://doi.org/10.3390/met9121331