Article

Formation Process of the Passivating Products from Arsenopyrite Bioleaching by Acidithiobacillus ferrooxidans in 9K Culture Medium

School of Minerals Processing and Bioengineering, Central South University, Changsha 410083, China
*
Authors to whom correspondence should be addressed.
Metals 2019, 9(12), 1320; https://doi.org/10.3390/met9121320
Submission received: 19 November 2019 / Revised: 28 November 2019 / Accepted: 3 December 2019 / Published: 6 December 2019

Abstract

:
Arsenopyrite is a common sulphide mineral occurring in deposits of gold ore that makes the extraction of gold difficult and, thus, pre-treatment is necessary prior to gold leaching. Bioleaching pre-treatment of arsenopyrite has drawn significant attention owing to its environmental friendliness, low cost and simple operation. A critical impedance of bioleaching to its large-scale industrial application is the slow leaching kinetics. Various passivating products on the surface of arsenopyrite have been found to limit the bioleaching process. This paper reports results from an in-depth investigation into the formation process of passivating products from arsenopyrite bioleaching by Acidithiobacillus ferrooxidans in 9K culture medium including bioleaching experiments and physicochemical analyses of the materials as well as thermodynamic analyses of the leaching system. The results of phase transformation and morphological change of the solid products suggest that the passivation occurring in the bioleaching of arsenopyrite is largely attributed to an initially formed passivating film consisting mainly of realgar (As2S2), orpiment (As2S3) and elemental sulphur (S0) on the arsenopyrite surface. Based on the results, the paper also proposes possible passivation mechanisms to allow for a better understanding on the passivation behaviour of the bioleaching of arsenopyrite.

1. Introduction

Arsenopyrite (FeAsS) is often associated with significant amounts of gold and is an important auriferous mineral. However, most of arsenopyrite gold ores are refractory due mainly to the encapsulation of gold in the FeAsS matrix [1]. Pre-treatment of these ores before leaching is necessary for the extraction of gold. Oxidative roasting, pressure oxidation, chemical oxidation and biological oxidation are currently the four commonly adopted pre-treatment methods [2,3]. Although the first three methods can improve the extraction of gold from the refractory ores efficiently, they also suffer from having high energy consumptions, requiring a variety and large amount of chemical reagents, and yielding high levels of environmental pollutions [4,5]. Biological oxidation pre-treatment, in contrast, is a green, low-cost, and simple technology for leaching valuable metals from a range of minerals, ores/concentrates and waste materials. With the increasingly stringent requirements for environmental protection, bioleaching technology, representing a successful application of environmentally friendly bio-hydrometallurgy, has attracted much attention in the past decade and its applications have been on the rise [2].
While bioleaching technology provides many advantages, the slow leaching kinetics has been discouraging its large-scale application [2,6,7,8,9]. As demonstrated in previous studies [1,10,11,12,13,14,15], various surface deposits can be generated on arsenopyrite during the bioleaching process, and, thus, forming passive layers that would severely impede the further bioleaching of arsenopyrite. The formation of these passive layers is believed to be the main cause for the slow dissolution kinetics and, thus, long bioleaching periods [16].
The chemical and phase compositions of the passive layers, however, have been shown to be complex, with little agreement among published researches mainly due to the differences in mineral purity, bacteria species and experimental methods as well as characterisation methods. The overlayers were reported to consist mainly of three kinds of passivating products that include (i) Fe-containing species such as jarosite [1,11,14], ferric sulphate [10], goethite [11], scorodite [14], pyrite (FeS2)-like [15] and ferric phosphate [12], (ii) As- and/or S-containing species such as orpiment [1,13,15] and elemental sulphur [1,15,17], and (iii) organic matter associated with cells such as extracellular polymeric substance [10,11]. Consequently, the passivation process and relevant mechanisms of the bioleaching of arsenopyrite remain unclear.
This paper reports results from an in-depth study on the formation process of passivating products from the bioleaching of a typical pure arsenopyrite by Acidithiobacillus ferrooxidans (A. ferrooxidans) in 9K culture medium. A series of bioleaching experiments were performed on natural high-purity arsenopyrite samples. The leachate was analysed with ICP-AES and a counting chamber with phase contrast microscope for the As and Fe concentrations and bacteria counts. The leached solid samples were analysed with XRD and SEM-EDS for mineralogical phases, morphology and chemical compositions. Thermodynamic analyses were also conducted to elucidate the phase transformations occurring in the bioleaching of arsenopyrite. In this paper, a possible passivation mechanism was also proposed to give a better understanding on how the passivation of arsenopyrite occurs during its bioleaching process.

2. Thermodynamic Calculations

Eh−pH diagrams for FeAsS–H2O system were constructed using HSC Chemistry 6.0 for Windows software [18]. The temperature and pressure in the construction of diagrams were all set at 25 °C and 1 atm. Under the typical leaching conditions of [FeAsS] 0.06 M (i.e., 10 g/L) and [Fe2+] 0.16 M, the thermodynamical predominance regions of Fe, S and As species were presented in Eh−pH diagrams on relevant pH and Eh (vs. SHE) scales. The relevant thermodynamic data are listed in Appendix A, which were used to conduct the construction of Eh−pH diagrams.

3. Experimental

3.1. Minerals, Strain and Media

The natural sample of high-purity arsenopyrite investigated was from Yaogangxian in Hunan province of China, with a composition of Fe1.00As0.99S0.97 and only containing Si 0.132%, Co 0.034% and Ni 0.062% as impurities determined by X-ray fluorescence analysis. Either particles (over 90%, -74 μm) or cubes (~15 mm × ~15 mm × ~5 mm) of the arsenopyrite samples were used in this study. The arsenopyrite particles were prepared by wet-milling in a ball mill while the cubes were obtained using a cutter. The samples were stored in air-tight plastic bags in a refrigerator to minimise oxidation.
A. ferrooxidans and 9K culture medium containing (NH4)2SO4 3.0 g/L, K2HPO4·3H2O 0.50 g/L, KCl 0.1 g/L, MgSO4·7H2O 0.5 g/L, Ca(NO3)2·4H2O 0.01 g/L and FeSO4·7H2O 44.8 g/L were used in the bioleaching of arsenopyrite. 250 mL Erlenmeyer flasks containing 100 mL 9K culture medium and 15 mL inoculum were shaken at 160 rpm in an orbital thermostat shaker at 30 °C to culture and sub-culture A. ferrooxidans. The initial pH value of the medium was adjusted to 1.8 by careful addition of ~3 M H2SO4 solution. The bacteria had been sub-cultured in the presence of 10 g/L arsenopyrite particles for three months before the bioleaching experiments.
The reagents used in the cultivation of bacteria and the bioleaching experiments were all analytically pure. De-ionised water was used throughout all experiments.

3.2. Bioleaching Experiment

The bioleaching of arsenopyrite samples proceeded in parallel with the growth of bacteria using the identical experimental method and conditions for cultivating bacteria. In each bioleaching experiment for arsenopyrite particles, the pulp density was 10 g/L of FeAsS. During the bioleaching process, samples were withdrawn at regular intervals from the supernatant for chemical and bacterial analyses. The values of pH and solution potential were also recorded, and all solution potential values were reported with respect to the standard hydrogen electrode (SHE). The pulp from the bioleaching experiments conducted in parallel was filtered, washed at least ten times with copious de-ionised water and dried in a vacuum oven at 35 °C overnight to obtain the residue for the subsequent quantitative phase analysis (QPA) using X-ray diffractometry (XRD). The arsenopyrite cubes were used to perform the morphological study. Before each bioleaching test, the cubes were first polished sequentially using silicon carbide papers of 800, 1500 and 3000 grit, and then cleaned ultrasonically in alternate baths of 5 M HCl, methanol and water for 5 min to remove the surface contaminants [13,17]. At the end of the bioleaching experiments, the leached cubes were fixed in a glutaraldehyde solution of 2.5% for 3–4 h, rinsed using 0.1 M phosphate buffered saline (PBS) of pH 7.2–7.4, and then dehydrated sequentially in graded ethanol solutions of 50%, 70%, 85%, 95% and 100% to maintain cell structure and secure attached cells to the surface.

3.3. Analytical Methods

The concentrations of As and Fe in leachate were determined by ICP-AES (PS-6, Baird). The Fe2+ concentration in solution was determined by titration with potassium dichromate, and the Fe3+ concentration was obtained from the difference between the total Fe concentration and Fe2+ concentration. The bacteria number in solution was determined using a counting chamber (Neubauer) with phase contrast microscope (LEICA DMI 3000B, Wetzlar, Germany). The pH and solution potential values were measured using a pH meter (PHSJ-4A, Shanghai Leici, Shanghai, China) equipped with a Pt electrode and Ag/AgCl (saturated KCl) reference electrode. The mineralogical phases of the leached residue were determined with an X-ray diffractometer (D/Max 2500, Rigaku, Hiroshima, Tokyo, Japan). The diffraction data were collected from 10° to 80° (2θ) with a step-size of 0.02° (2θ) and counting time of 1 s/step. The quantitative phase analysis (QPA) was performed using MDI Jade 6.5 software by the Rietveld method. The morphology of leached cubes was examined using an SEM equipped with EDS (Helios NanoLab G3 UC or Quanta FEG 250, FEI, Hillsboro, OR, USA).

4. Results and Discussion

4.1. Bioleaching Behaviour of Arsenopyrite

4.1.1. Bioleaching Kinetics of Arsenopyrite

The kinetic results from the bioleaching of arsenopyrite are shown in Figure 1. Figure 1a shows the leaching behaviour of As that can act as a significant indicator for arsenopyrite bioleaching. The leaching of As from arsenopyrite would be significantly limited once the so-called “passivation” occurred. The leaching ratio of As, however, increased almost linearly with the leaching time (≤19 days (d)), without showing an obvious sign of the passivation. The As leaching ratio reached a maximum of 30.4% ([As]total = 1.3 g/L) after bioleaching 19 days (i.e., the bioleaching period) and then remained stable (>19 d).
The bioleaching process is closely related to the reproduction of bacteria. As shown in Figure 1b–d, the bacteria grew rapidly in the initial two to three days with an obvious rise in the pH value and Fe3+ concentration as well as an evident drop in the Fe2+ concentration. This is due to the fact that the bio-oxidation of Fe2+ to Fe3+ and simultaneous reduction of O2 to H2O with a consumption of H+ provide energy for the growth of bacteria [12]. The pH decreased after 3 days due mainly to the generation of H+ from the arsenopyrite oxidation. Figure 1c also shows the variation of solution potential with time, which is strongly influenced by the Fe3+/Fe2+ redox couple. As shown in Figure 1c,d, the solution potential has a similar variation trend to the Fe3+ concentration. A stronger driving force for the leaching of arsenopyrite can be offered by a higher solution potential.
In contrast with the significant growth of bacteria particularly in the initial leaching three days (Figure 1b) as well as the noticeable increase in Fe3+ concentration (Figure 1d) and solution potential (Figure 1c) in 10 days, the nearly linear increase in As leaching ratio in the bioleaching period of 19 days shown in Figure 1a implies that the passivation likely occurred from the beginning of the bioleaching process.

4.1.2. Phase Transformation of Arsenopyrite During Bioleaching

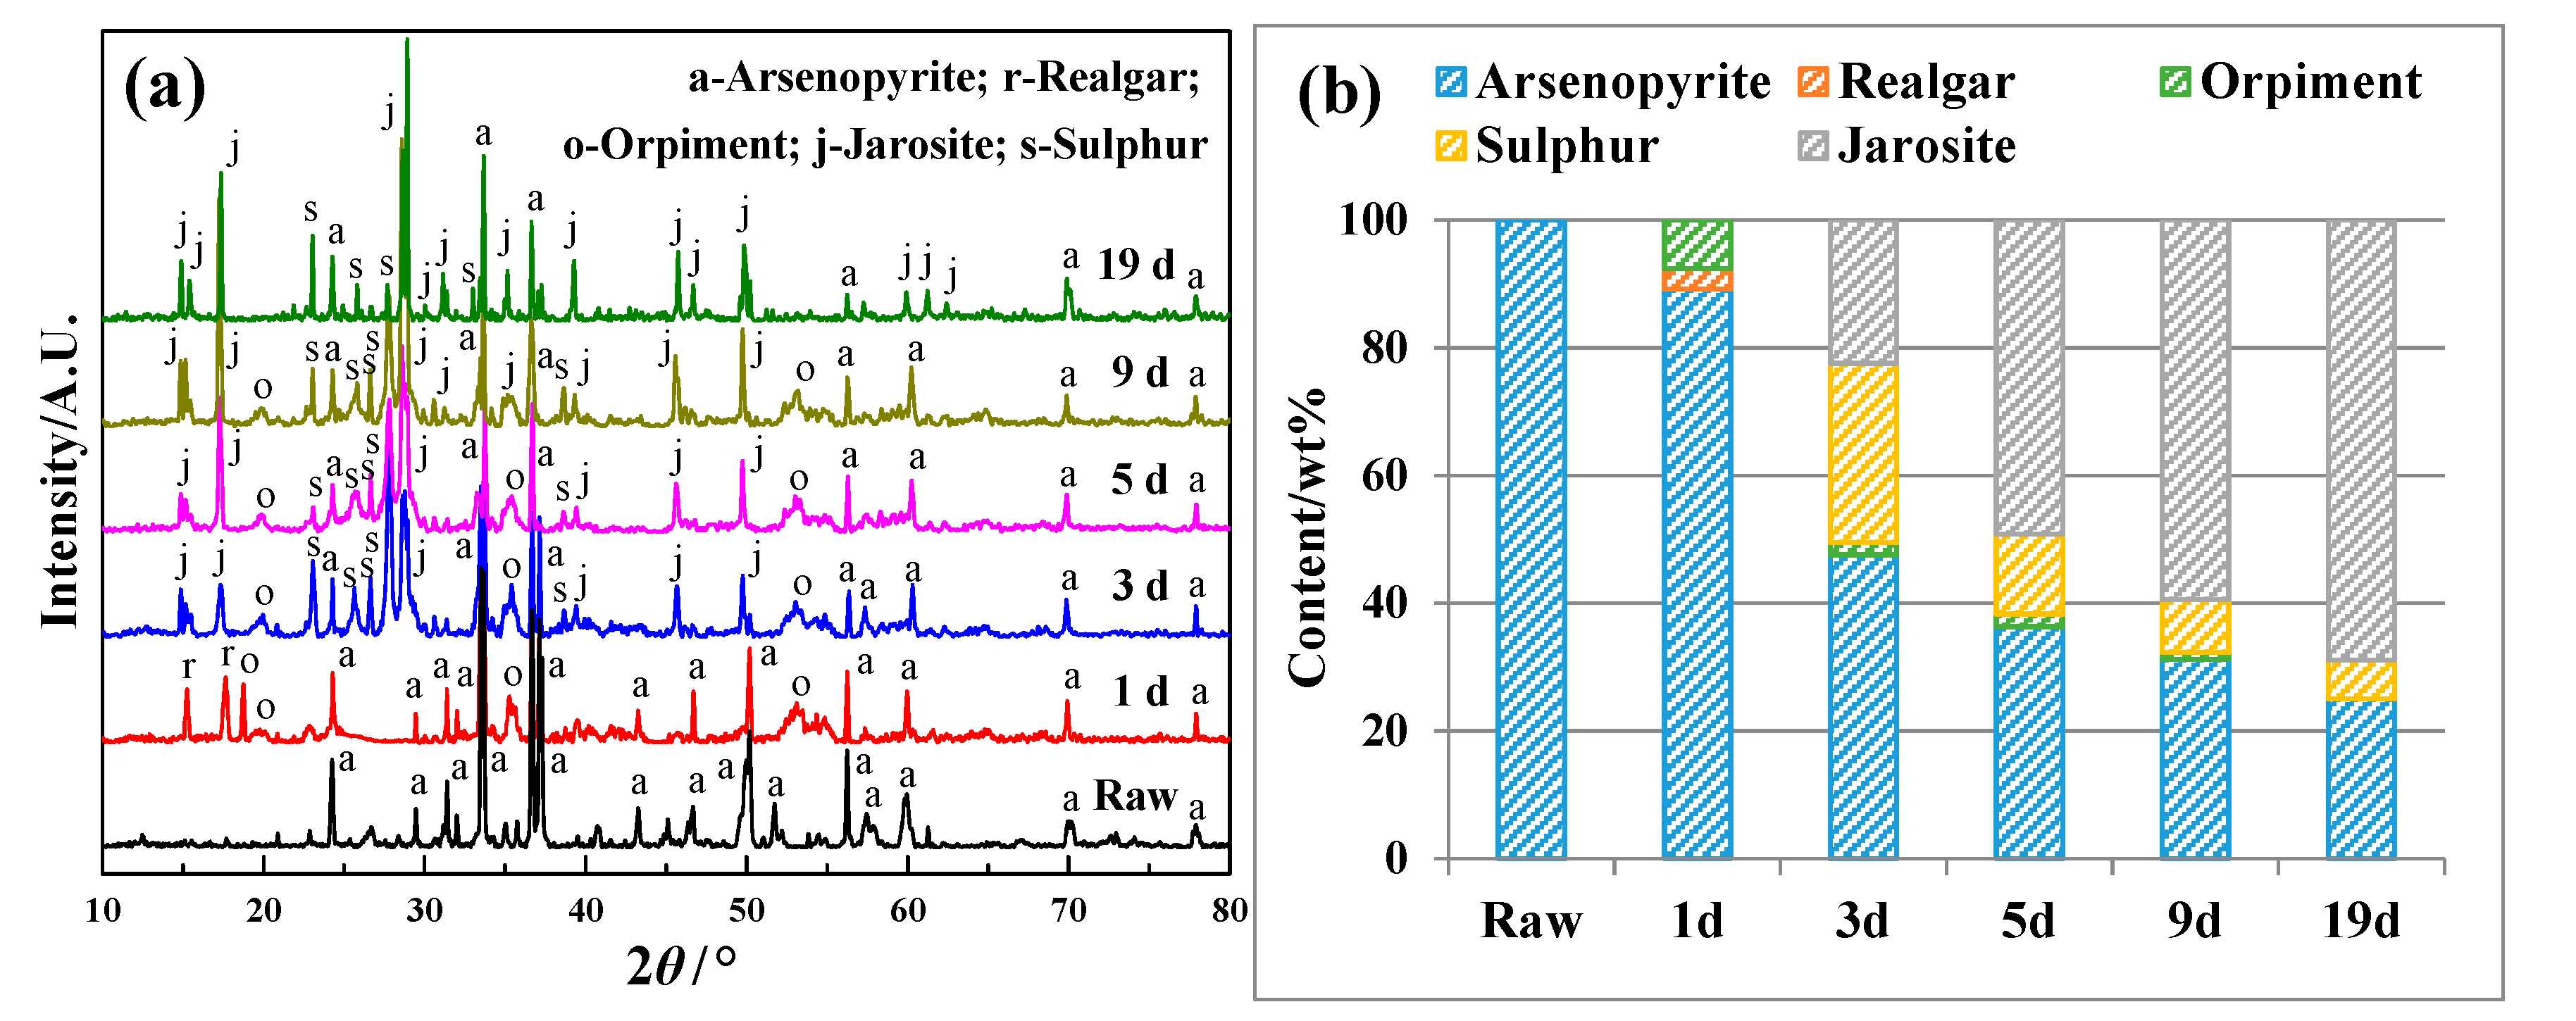
To quantitatively determine the phases, XRD surveys were conducted on the bioleached arsenopyrite particles after different days and their diffractograms (Figure 2a) with the corresponding QPA results (Figure 2b) are shown in Figure 2.
Consistent with the bioleaching behaviour of As (Figure 1a), the content of the FeAsS phase decreased constantly as the bioleaching of arsenopyrite proceeded. In addition, as reported before [1,11,13,14,15,17], mainly four new solid phases of realgar (As2S2), orpiment (As2S3), elemental sulphur (S0) and jarosite [KFe3(SO4)2(OH)6] occurred with the oxidative dissolution of FeAsS. The contents of the first three phases were reduced with the leaching time, but they could be formed in the initial stage of leaching (≤3 d). Although the content of KFe3(SO4)2(OH)6 phase increased with the time, its significant formation, in contrast, appeared to take place only after three days, consistent with the noticeable decrease in the total Fe concentration as shown in Figure 1d. This suggests that it is likely that the formation of As2S2, As2S3 and S0 rather than KFe3(SO4)2(OH)6 caused the initial passivation for the arsenopyrite bioleaching. To further ascertain the phase transformation occurring in the bioleaching of arsenopyrite, detailed thermodynamic analyses were conducted.

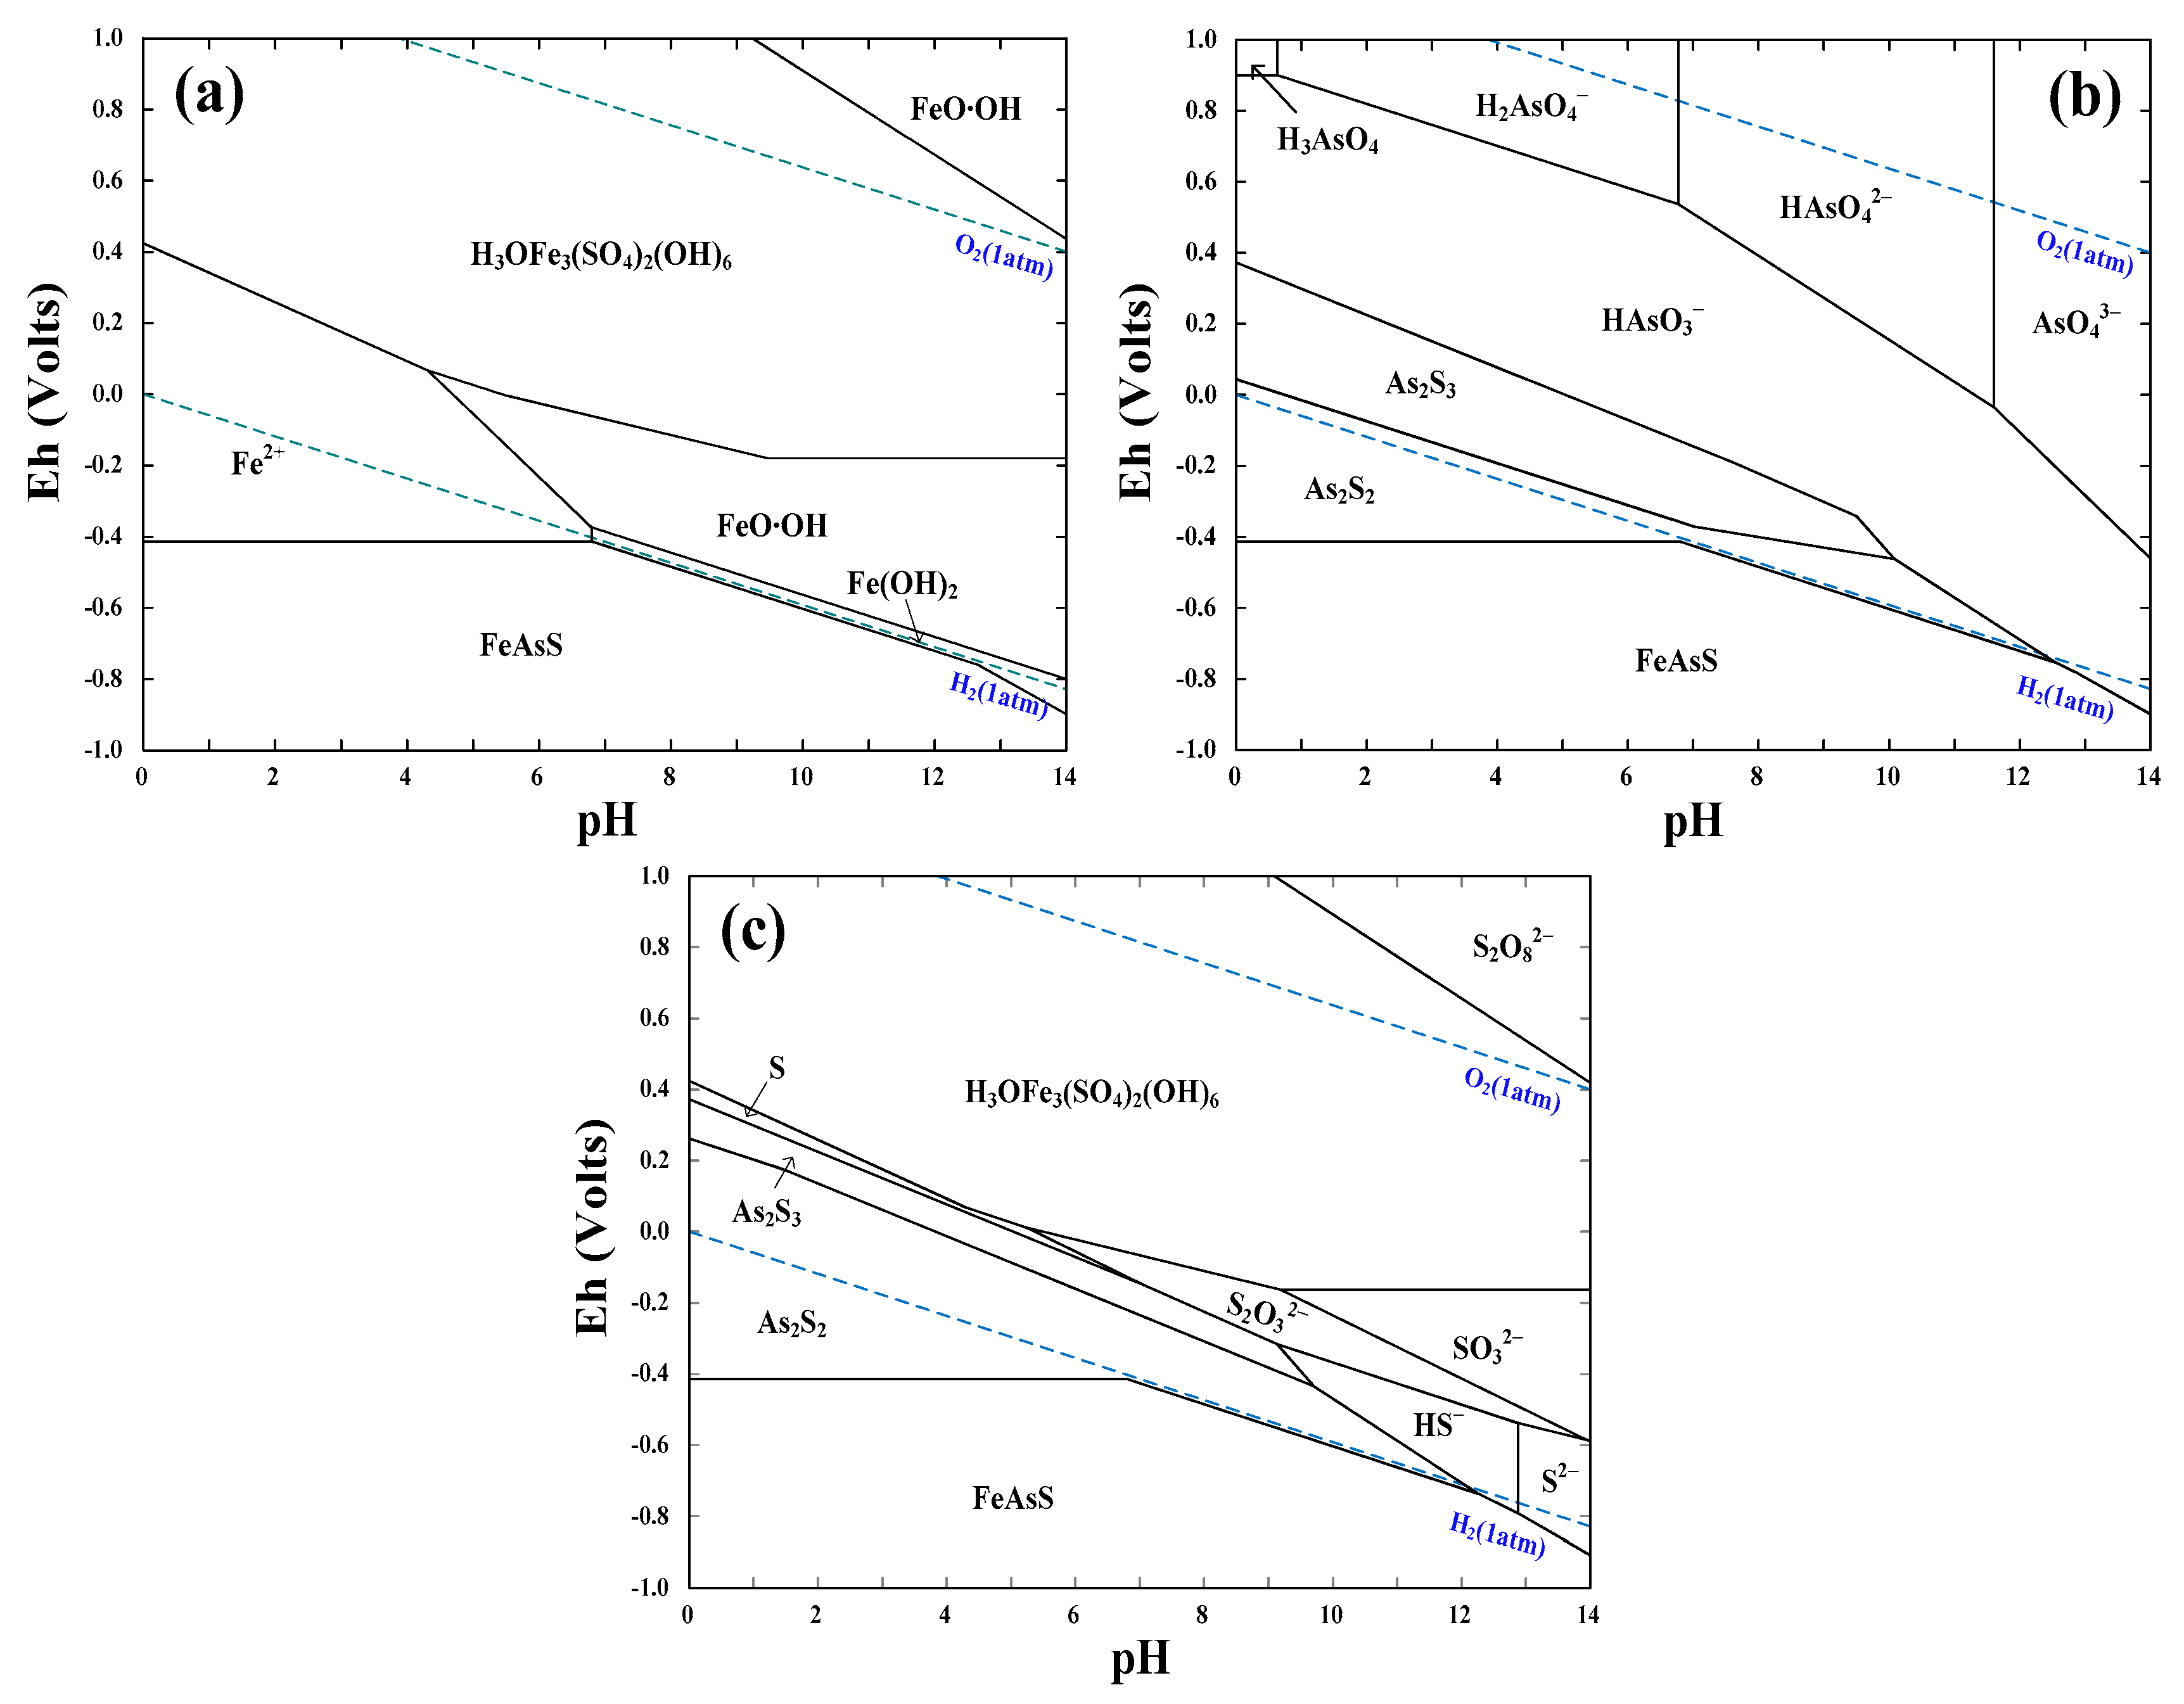
4.1.3. Thermodynamics of Arsenopyrite Dissolution

The Eh–pH diagrams of FeAsS–H2O system are presented in Figure 3. Under the typical acidic bioleaching condition (pH = 0–3), arsenopyrite can be oxidised at Eh > −0.4 V. Thermodynamically, the oxidative dissolution of FeAsS can change itself to As2S2, As2S3 and S0 as well as KFe3(SO4)2(OH)6, consistent with the XRD-QPA results presented in Section 4.1.2. The predominant species for Fe (Figure 3a), As (Figure 3b) and S (Figure 3c) in the region of pH 0–3 and Eh −0.4–0.4 V are Fe2+, As2S2/As2S3 and As2S2/As2S3/S0, respectively. At an Eh greater than 0.2–0.4 V, the predominant Fe and S species are converted to H3OFe3(SO4)2(OH)6 whilst the as species become HAsO3 and H2AsO4. Jarosite [KFe3(SO4)2(OH)6] can readily be formed between H3OFe3(SO4)2(OH)6 and K+ in the 9K culture [19,20], as shown in Figure 2 and will be presented in Figure 4. If bioleaching occurred in the above pH and Eh ranges, insoluble solids of As2S2, As2S3 and S0 as well as KFe3(SO4)2(OH)6 would form and likely result in the passivation of the arsenopyrite surface.
Figure 1c shows that the pH and solution potential values during the bioleaching of arsenopyrite particles were found to vary in the range of 1.8–2.5 and 540–640 mV, respectively. As shown in Figure 3, KFe3(SO4)2(OH)6 is predicted to be the main insoluble product from the oxidative leaching of FeAsS. This thermodynamic prediction agrees well with the XRD-QPA results for bioleaching >3 d but is inconsistent with those for bioleaching ≤3 d. The inconsistency can be explained by the fact that the concentration of Fe3+ in solutions was low and almost no reduction of the total Fe concentration took place in the initial bioleaching stage of 3 days (Figure 1d), and, thus, it is difficult to generate adequate amounts of KFe3(SO4)2(OH)6 that can be detected by XRD. In addition, based on the Eh required for the formation of species, thermodynamically, the ease of the formation of the above-mentioned insoluble species follows the descending order of As2S2 > As2S3 > S0 > KFe3(SO4)2(OH)6. This is also in agreement with the XRD-QPA results showing that As2S2, As2S3 and S0 were easily formed initially with KFe3(SO4)2(OH)6 being formed later. It can be expected that these insoluble products would form overlayers on the surface of arsenopyrite, and, thus, resulting in the passivation.

4.2. Formation of Surface Overlayers on Arsenopyrite

To examine the morphology of overlayers and determine the chemical compositions of the passivating film, SEM-EDS was used to analyse the surface of arsenopyrite cubes after bioleaching different times.
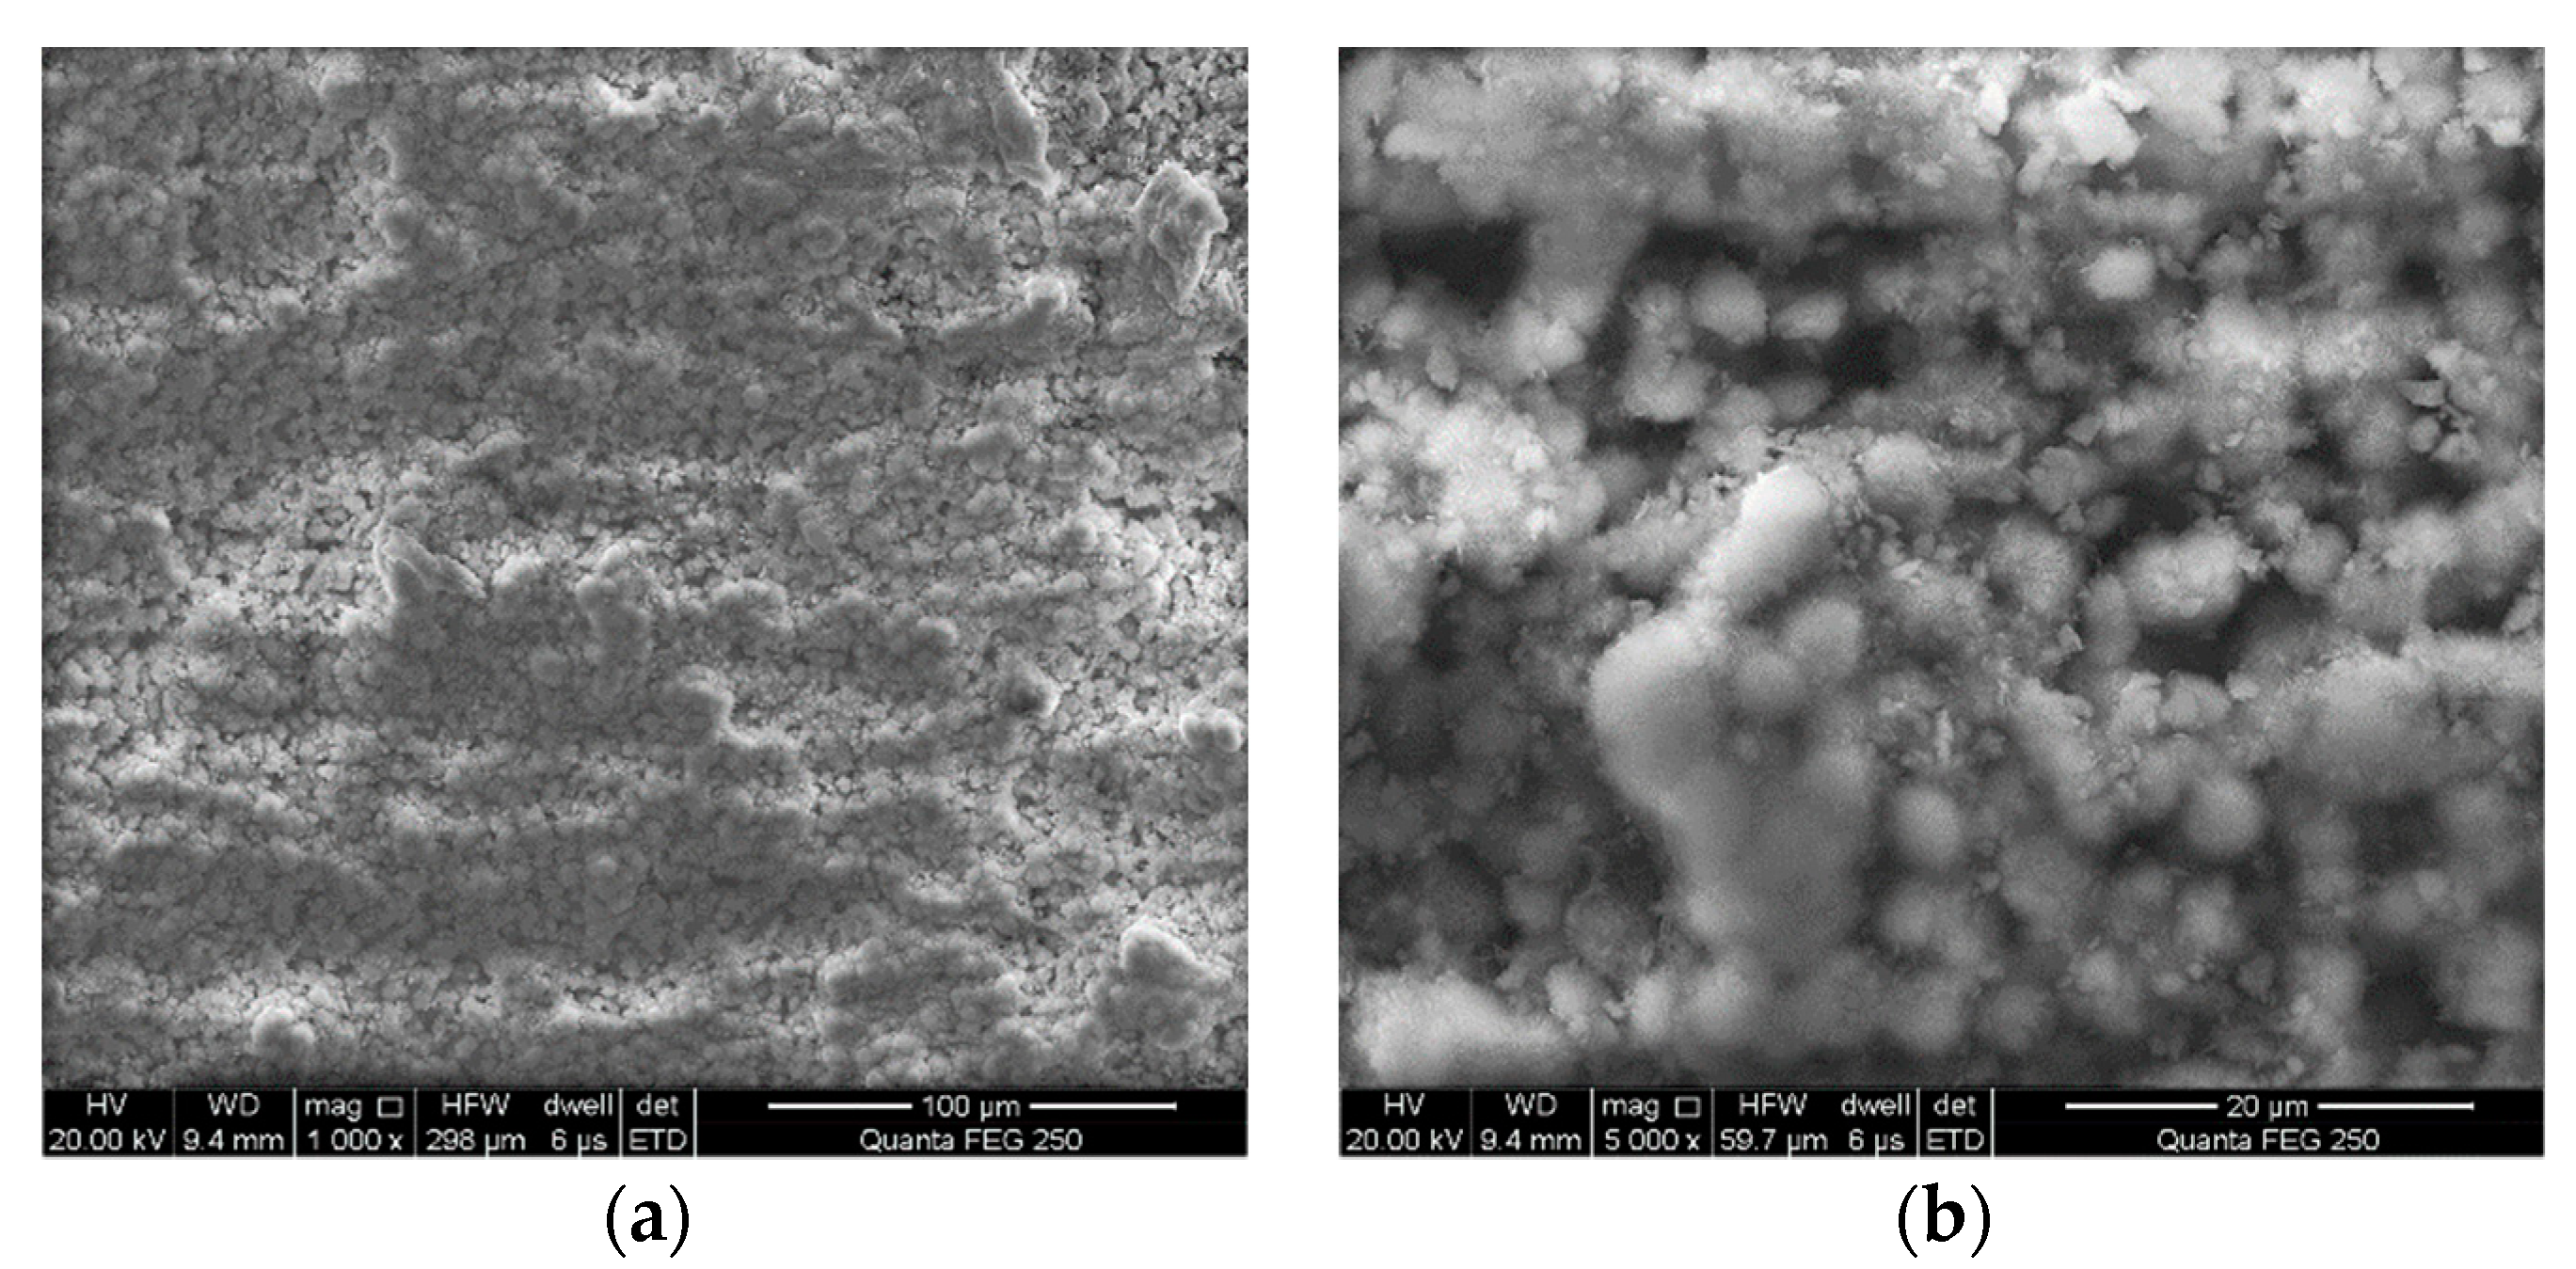
Considerable amounts of jarosite were found to be produced during the bioleaching process particularly in the later stage. The SEM images of jarosite on the arsenopyrite cube surface after bioleaching 8 days are clearly presented in Figure 4a,b. Visually, Figure 4a (magnification 1000×) shows that an obvious overlayer of jarosite was formed on the surface of arsenopyrite. As further seen from Figure 4b (magnification 5000×), jarosite appeared as fluffy or woolly spherical particles, and they were loosely packed forming a porous structure of the overlayer, as reported previously [20]. It is, thus, unlikely that the jarosite overlayer was the passivating film.
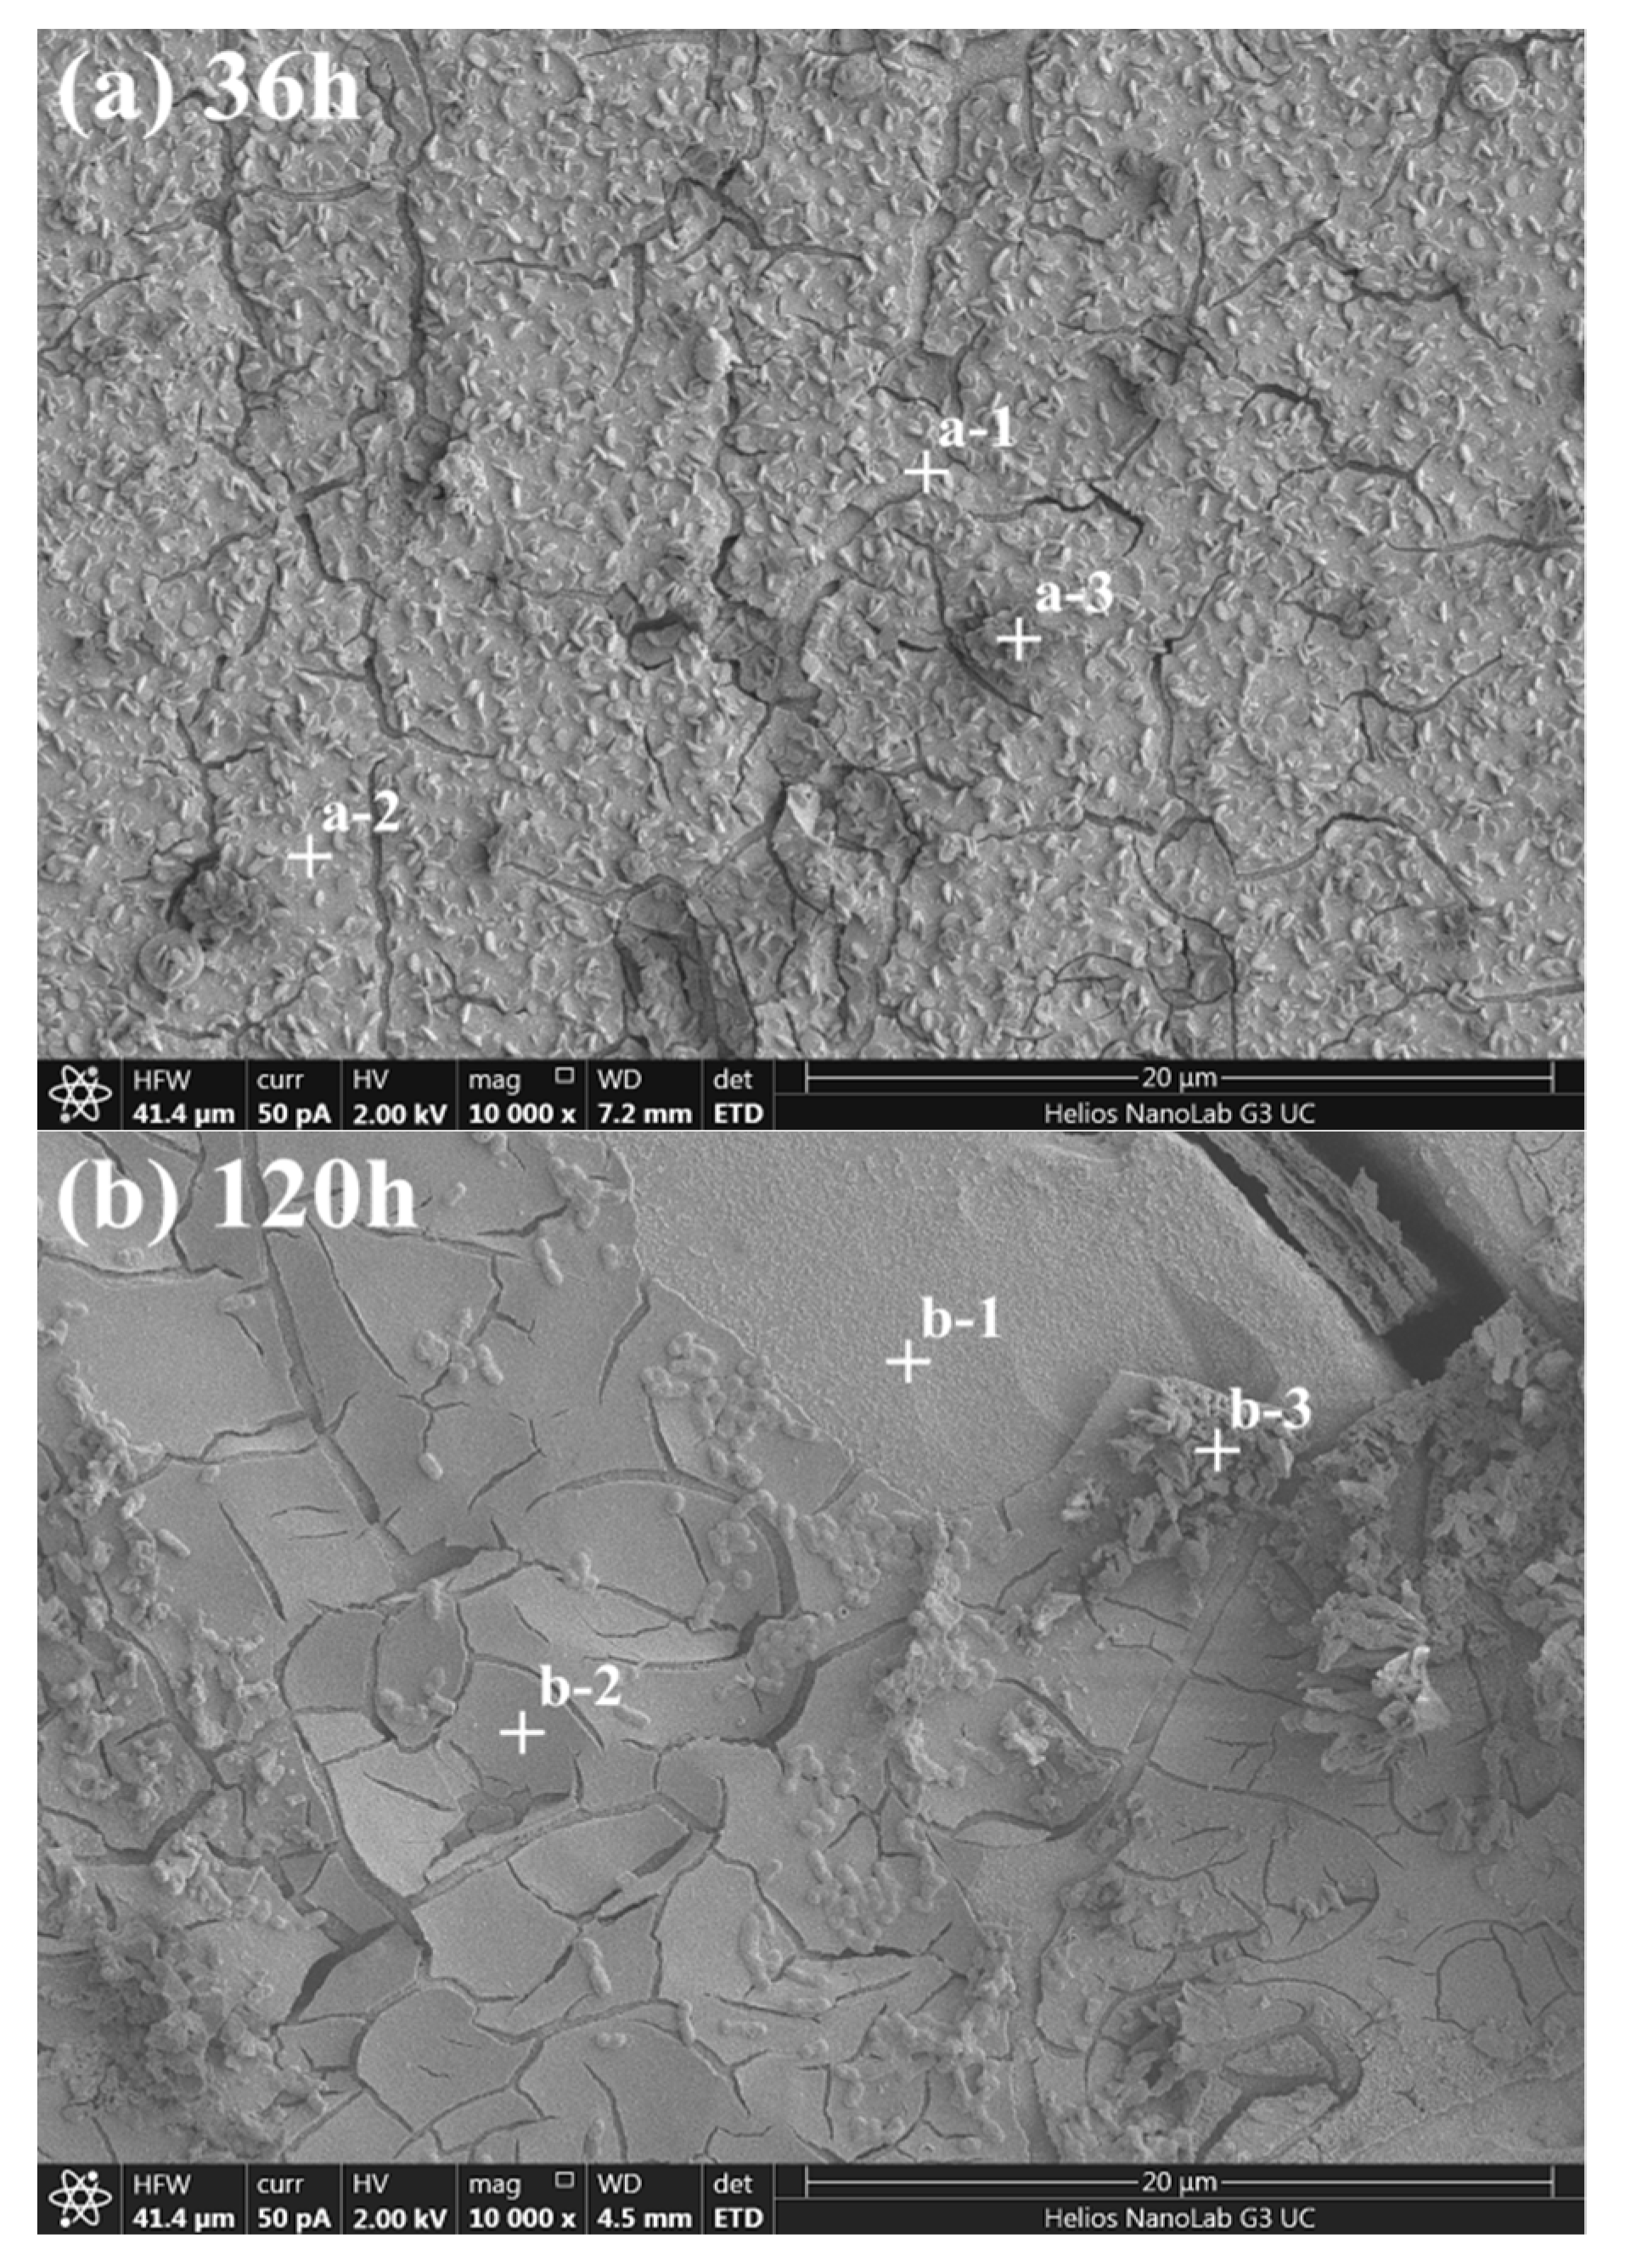
To avoid the interference from jarosite, the surface of arsenopyrite cube was investigated for the initial stage of leaching (≤5 d). Figure 5 shows the SEM images and Table 1 lists the EDS data for the bioleached arsenopyrite cube after leaching 36 h and 120 h. A clear overlayer was also formed on the surface after just leaching 36 h as seen in Figure 5a, and it still existed after 120 h (Figure 5b). This overlayer was structurally dense as a film and was intact in the solution, which is in deep contrast with the porous jarosite overlayer as presented in Figure 4. It should be noted that the cracks appeared only after drying. As shown from the EDS data, on the surface below the film (i.e., spots a-1 and b-1), an atom fraction of nearly 1:1:1 for Fe:As:S and low O contents were detected, indicating that little oxidative dissolution occurred beneath the film. This suggests that the film has passivated the bulk arsenopyrite. The EDS data for spots a-2 and b-2 show that, in addition to O, the film contained much higher contents of as and S than Fe. Consistent with the phase analyses presented in Section 4.1.2 and 4.1.3, it is likely that the passivating film mainly consisted of As2S2, As2S3 and S0. Above the film, large amounts of crystal particles (e.g., spots a-3 and b-3) were visible to the naked eyes in amber yellow or dark brown. EDS analyses show that they have a very similar element composition of jarosite, suggesting that the jarosite overlayer as presented in Figure 4 would form on this passivating film. Although the content of As2S2, As2S3 and S0 decreased while that of KFe3(SO4)2(OH)6 increased with time as shown in Figure 2, the passivation action of the films on the arsenopyrite surface as presented in Figure 4 and Figure 5 obviously depends much more on the time when the film is formed and the structure of the film rather than the content of the above solid products that form the film.
In summary, the bioleaching test results presented in Section 4.1.1 demonstrated that the passivation phenomenon occurred from the onset of arsenopyrite bioleaching. The XRD-QPA, SEM-EDS and thermodynamic results indicate that a passivating film consisting mainly of As2S2, As2S3 and S0 was formed on the arsenopyrite surface initially (<36 h), which would severely limit the subsequent bioleaching process.

4.3. Possible Passivation Mechanisms for the Bioleaching of Arsenopyrite

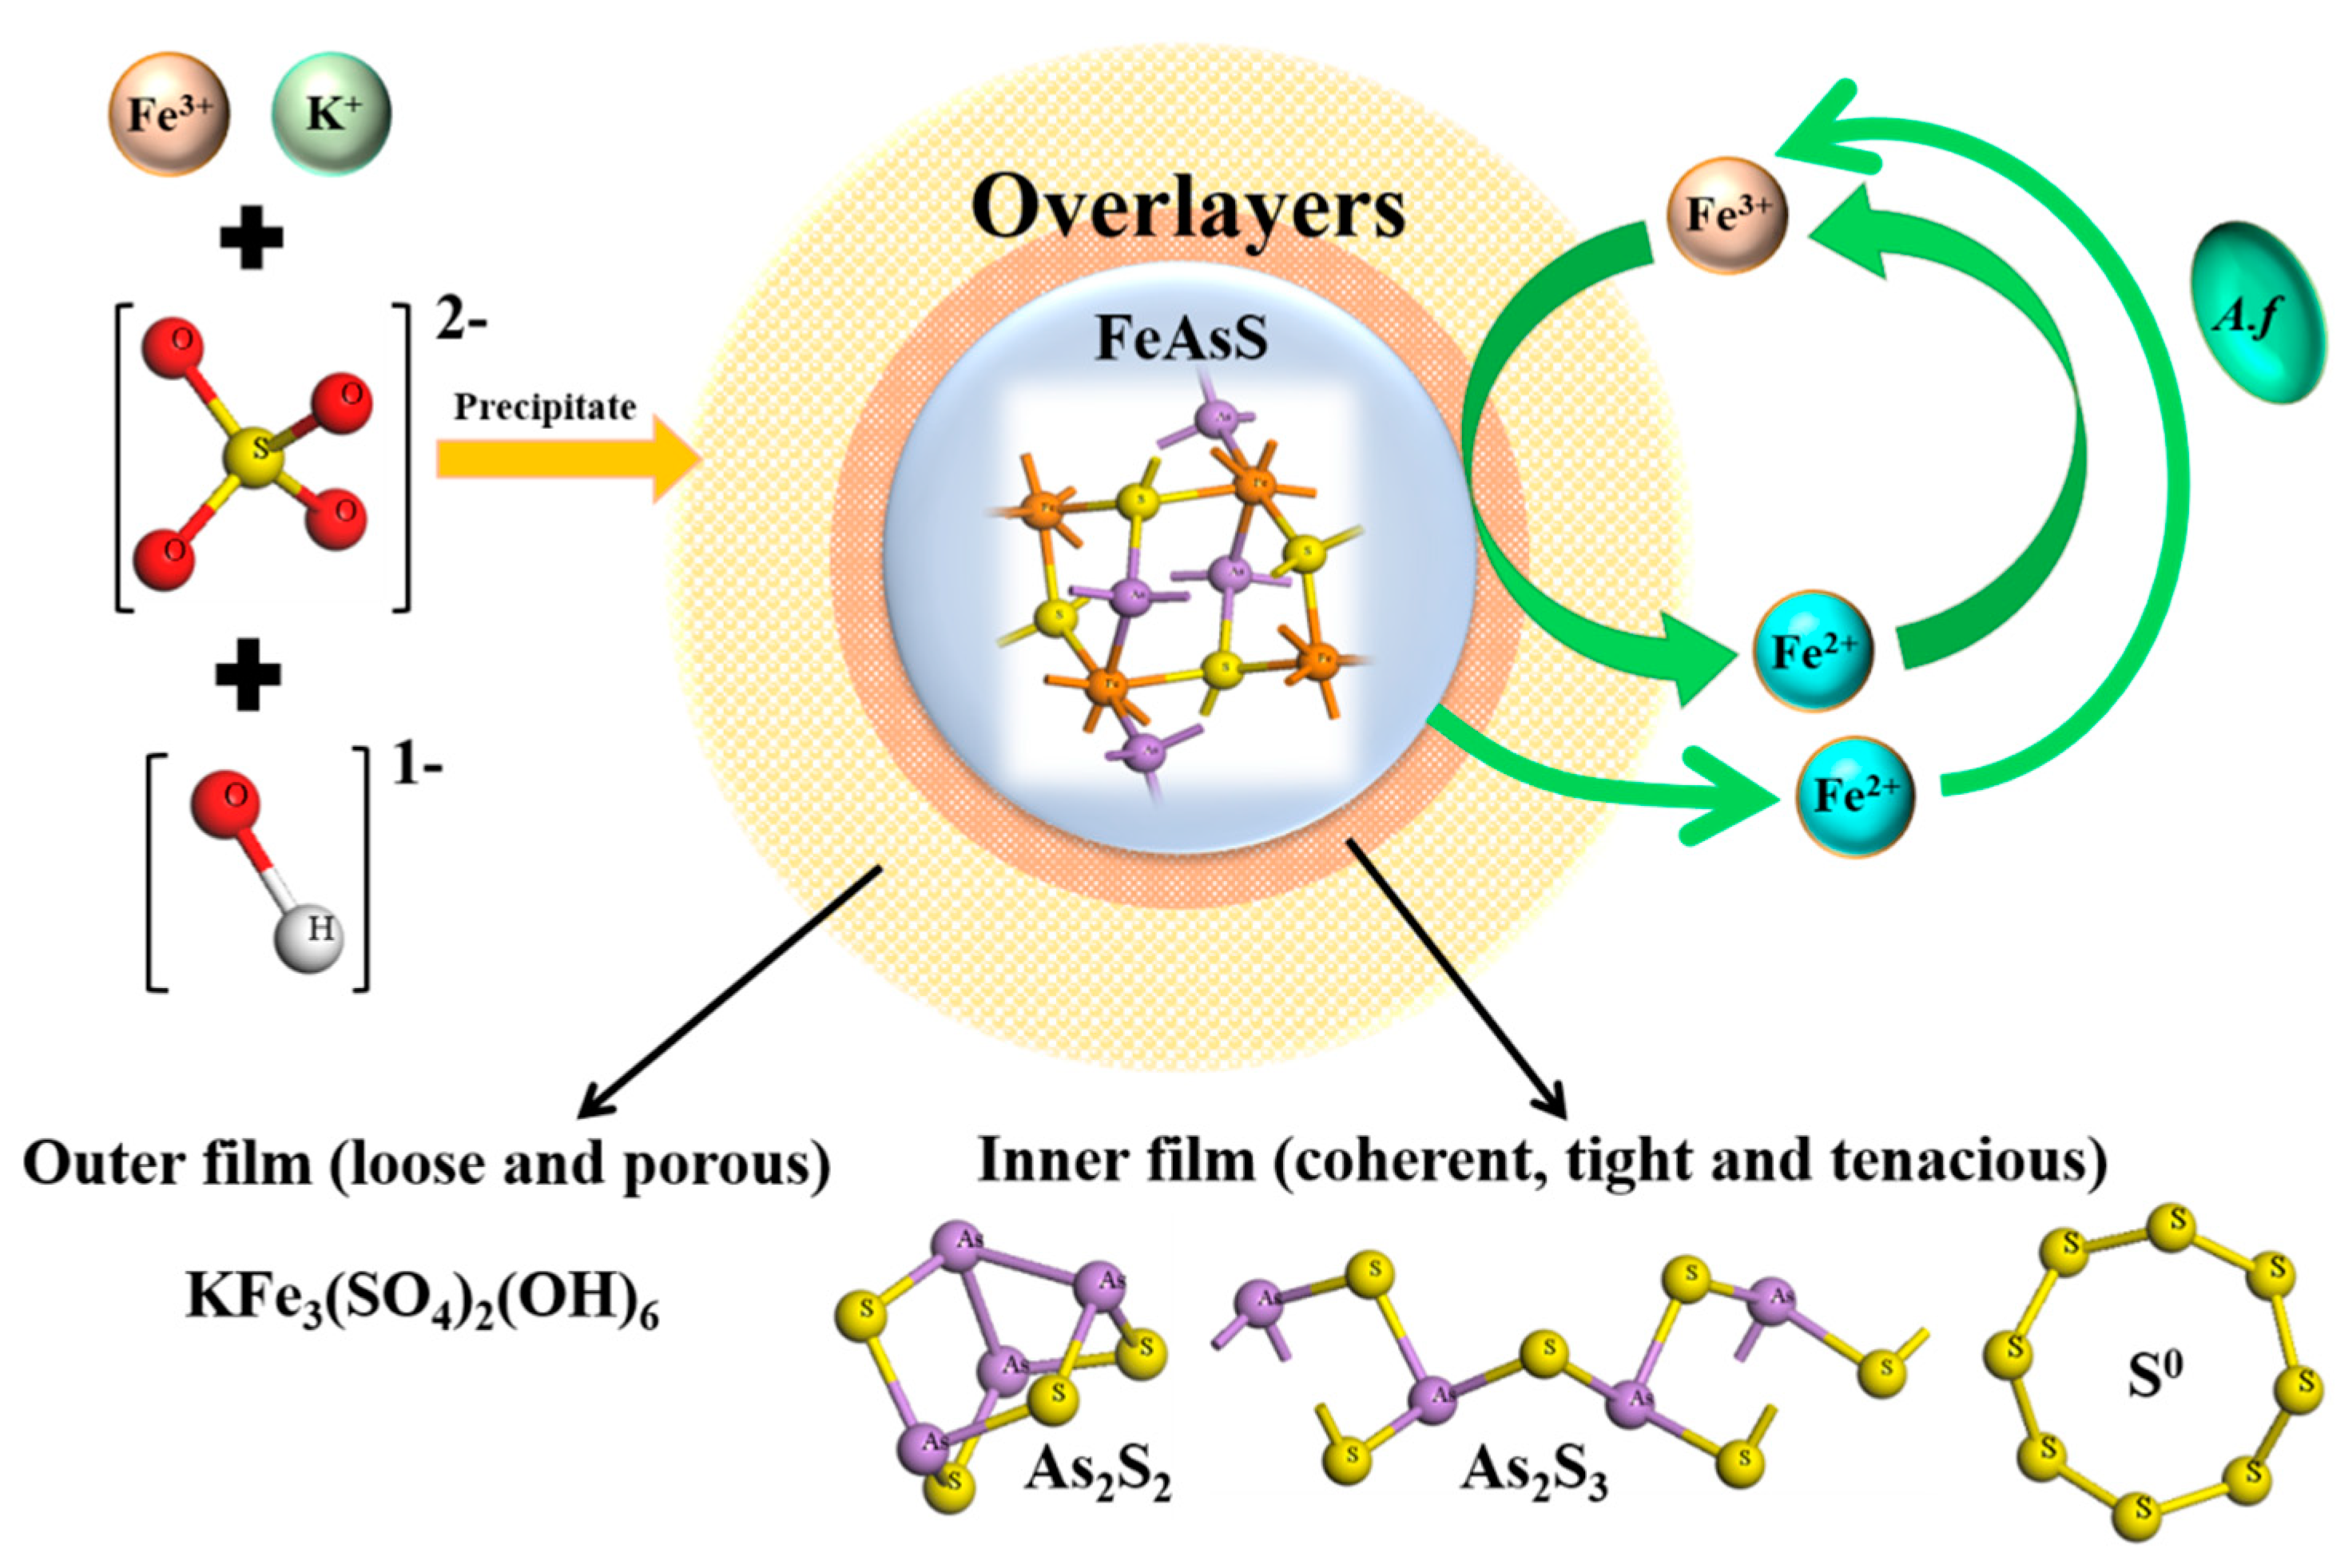
Based on the above results, the possible passivation mechanisms and reactions involved in the bioleaching of arsenopyrite can be proposed and are shown in Figure 6 and Table 2.
Figure 6 shows that, during the bioleaching process, the Fe2+ is oxidised by the bacteria to Fe3+, which in turn reacts with the arsenopyrite according to No. 1–3 in Table 2. In the initial stage of bioleaching, the solid products of As2S2, As2S3 and S0 were formed in situ on the surface of the particles, of which As2S2 or As2S3 could be further converted to As2S3 and/or S0 as shown by oxidation reactions 4–6 in Table 2 as the bioleaching proceeded. These solid products can accumulate on the arsenopyrite surface, forming an inner film that is coherent, tight and tenacious, as evidenced by the XRD-QPA and SEM-EDS results. At the later bioleaching stage, large amounts of solid precipitates of jarosite were generated from the solution according to No. 7 in Table 2. The deposition of these jarosite precipitates on the arsenopyrite surface as well as the inner film can form an outer film, which however is loose and porous as evidenced by the SEM images. Obviously, the initially formed inner film, instead of the later-formed outer jarosite film, is the passivating film that can severely impede the bioleaching of arsenopyrite from the initial stage, and, thus, leading to the slow leaching kinetics throughout the bioleaching process.

5. Conclusions

Experimental results from bioleaching of arsenopyrite by A. ferrooxidans showed that the leaching kinetics was slow throughout the bioleaching process. XRD-QPA results and thermodynamic analyses suggested that, during the bioleaching, FeAsS could be converted to the solid phases of As2S2, As2S3 and S0 initially but to [KFe3(SO4)2(OH)6] later. Morphological studies showed that a compact passivating film had been formed before the formation of a porous overlayer of jarosite on the arsenopyrite surface. XRD-QPA and EDS analyses indicated that this passivating film consisted mainly of As2S2, As2S3 and S0. Based on the combined results from bioleaching, phase and thermodynamic analyses, and surface characterisation, a possible passivation mechanism for the bioleaching of arsenopyrite is proposed that the passivating products of As2S2, As2S3 and S0 were generated in situ on the arsenopyrite surface where they accumulated and formed a passivating film in the initial stage of bioleaching that would severely restrict the subsequent bioleaching of arsenopyrite.

Author Contributions

Y.Z. and Q.L. conceived and designed the study; Q.L., Y.Y., B.X. and T.J. contributed reagents/materials/analysis tools; Y.Z. performed the experiments; X.L. and Y.Z. analysed the data; X.L. wrote the paper.

Funding

This research was funded by the National Natural Science Foundation of China (grant no. 51574284), the Fundamental Research Funds for the Central Universities of Central South University (grant no. 2017zzts194), the China Scholarship Council (grant nos. 201706370222 and 201606370128) and the National Key Research and Development Program of China (grant no. SQ2018YFE011066).

Acknowledgments

Financial supports from the National Natural Science Foundation of China, the Fundamental Research Funds for the Central Universities of Central South University, the China Scholarship Council and the National Key Research and Development Program of China are all gratefully acknowledged.

Conflicts of Interest

The authors declare no conflict of interest.

Appendix A

Table A1. Free energies of formation (kJ/mol) for relevant species a.
SpeciesΔG°298 (kJ/mol)SpeciesΔG°298 (kJ/mol)SpeciesΔG°298 (kJ/mol)
FeAsS−49.7616As2S2−68.5508S0
FeAsO4−772.727As2S3−91.4907S286.00982
Fe3(AsO4)2−1766.73As2O3−576.899S2279.76167
Fe(OH)2−492.158As2O4−701.161SO32−486.755
Fe(OH)3−705.885As2O5−782.437S2O32−518.87
FeO OH−489.439As4O6−1152.42S2O42−600.825
Fe3+−17.1907AsO2−349.991S2O52−791.217
Fe2+−91.5644AsO43-648.477S2O62−969.453
FeOH2+−242.064As(OH)4−824.457S2O72−795.432
FeOH+−275.615HAsO3−606.638S2O82−1115.35
Fe(OH)2+−452.391HAsO42−714.732HS211.51053
Fe2(OH)24+−467.733H2AsO3−587.149HSO3−527.84
H3OFe3(SO4)2(OH)6 b−3230.36H2AsO4−753.399HS12.44438
H3AsO3 (a)−638.142HS2O3−532.363
H2O−237.177H3AsO4 (a)−764.001H2S (a)−27.656
HAsO2 (a)−402.951
a Data from HSC database 6.0 [18] and Thermochemical Data of Pure Substances [21]. b ΔG°298 value was calculated using equation of ΔGr° = –RT ln K = ∑ [νiΔGf°(i)], of which relevant ΔGf° values are listed in Appendix A and ln K was from the Hydrochemical log K Database of HYDRA/MEDUSA software [22].

References

  1. Márquez, M.A.; Ospina, J.D.; Morales, A.L. New insights about the bacterial oxidation of arsenopyrite: A mineralogical scope. Miner. Eng. 2012, 39, 248–254. [Google Scholar] [CrossRef]
  2. Miller, P.; Brown, A.R.G. Bacterial Oxidation of Refractory Gold Concentrates. In Gold Ore Processing: Project Development and Operations; Adams, M.D., Ed.; Elsevier: Amsterdam, The Netherlands, 2016; pp. 359–372. [Google Scholar]
  3. Rawlings, D.E. High level arsenic resistance in bacteria present in biooxidation tanks used to treat gold-bearing arsenopyrite concentrates: A review. Trans. Nonferrous Met. Soc. China 2008, 18, 1311–1318. [Google Scholar] [CrossRef]
  4. Climo, M.; Watling, H.R.; Bronswijk, W.V. Biooxidation as pre-treatment for a telluride-rich refractory gold concentrate. Miner. Eng. 2000, 13, 1219–1229. [Google Scholar] [CrossRef]
  5. Espitia, S.L.M.; Lapidus, G.T. Pretreatment of a refractory arsenopyritic gold ore using hydroxyl ion. Hydrometallurgy 2015, 153, 106–113. [Google Scholar] [CrossRef]
  6. Espitia, S.L.M.; Lapidus, G.T. Improved gold extraction from a refractory arsenopyritic ore by chemical pretreatments. Hydrometallurgy 2014, 1, 573–580. [Google Scholar]
  7. Kaksonen, A.H.; Mudunuru, B.M.; Hackl, R. The role of microorganisms in gold processing and recovery—A review. Hydrometallurgy 2014, 142, 70–83. [Google Scholar] [CrossRef]
  8. Nguyen, V.K.; Lee, M.H.; Park, H.J.; Lee, J.U. Bioleaching of arsenic and heavy metals from mine tailings by pure and mixed cultures of Acidithiobacillus spp. J. Ind. Eng. Chem. 2015, 21, 451–458. [Google Scholar] [CrossRef]
  9. Park, J.; Han, Y.; Lee, E.; Choi, U.; Yoo, K.; Song, Y.; Kim, H. Bioleaching of highly concentrated arsenic mine tailings by Acidithiobacillus ferrooxidans. Sep. Purif. Technol. 2014, 133, 291–296. [Google Scholar] [CrossRef]
  10. Corkhill, C.L.; Wincott, P.L.; Lloyd, J.R.; Vaughan, D.J. The oxidative dissolution of arsenopyrite (FeAsS) and enargite (Cu3AsS4) by Leptospirillum ferrooxidans. Geochim. Cosmochim. Acta 2008, 72, 5616–5633. [Google Scholar] [CrossRef]
  11. Fantauzzi, M.; Licheri, C.; Atzei, D.; Loi, G.; Elsener, B.; Rossi, G.; Rossi, A. Arsenopyrite and pyrite bioleaching: Evidence from XPS, XRD and ICP techniques. Anal. Bioanal. Chem. 2011, 401, 2237–2248. [Google Scholar] [CrossRef] [PubMed]
  12. Jones, R.A.; Koval, S.F.; Nesbitt, H.W. Surface alteration of arsenopyrite (FeAsS) by Thiobacillus ferrooxidans. Geochim. Cosmochim. Acta 2003, 67, 955–965. [Google Scholar] [CrossRef]
  13. Lázaro, I.; Cruz, R.; González, I.; Monroy, M. Electrochemical oxidation of arsenopyrite in acidic media. Int. J. Miner. Process. 1997, 50, 63–75. [Google Scholar] [CrossRef]
  14. Min, X.; Cai, L.; Chen, W.; Zhang, C.; Zhong, H.; Kuang, Z. Bioleaching of refractory gold ore (II)—Mechanism on bioleaching of arsenopyrite by Thiobacillus ferrooxidans. Trans. Nonferrous Met. Soc. China 2002, 12, 142–146. [Google Scholar]
  15. Ramírez-Aldaba, H.; Valles, O.P.; Vazquez-Arenas, J.; Rojas-Contreras, J.A.; Valdez-Pérez, D.; Ruiz-Baca, E.; Meraz-Rodríguez, M.; Sosa-Rodríguez, F.S.; Rodríguez, Á.G.; Lara, R.H. Chemical and surface analysis during evolution of arsenopyrite oxidation by Acidithiobacillus thiooxidans in the presence and absence of supplementary arsenic. Sci. Total. Environ. 2016, 566, 1106–1119. [Google Scholar] [CrossRef] [PubMed]
  16. Corkhill, C.L.; Vaughan, D.J. Arsenopyrite oxidation—A review. Appl. Geochem. 2009, 24, 2342–2361. [Google Scholar] [CrossRef]
  17. Cruz, R.; Lázaro, I.; Rodríguez, J.M.; Monroy, M.; González, I. Surface characterization of arsenopyrite in acidic medium by triangular scan voltammetry on carbon paste electrodes. Hydrometallurgy 1997, 46, 303–319. [Google Scholar] [CrossRef]
  18. Roine, A. Outokumpu HSC Chemistry for Windows: Chemical reaction and equilibrium software with extensive thermochemical database. In User’s Guide, Version 6.0; Outokumpu Research Oy: Pori, Finland, 2006. [Google Scholar]
  19. Liu, J.Y.; Tao, X.X.; Cai, P. Study of formation of jarosite mediated by Thiobacillus ferrooxidans in 9K medium. Proc. Earth Planet. Sci. 2009, 1, 706–712. [Google Scholar] [CrossRef] [Green Version]
  20. Wang, H.; Bigham, J.M.; Jones, F.S.; Tuovinen, O.H. Synthesis and properties of ammoniojarosites prepared with iron-oxidizing acidophilic microorganisms at 22–65 °C. Geochim. Cosmochim. Acta 2007, 71, 155–164. [Google Scholar] [CrossRef]
  21. Barin, I. Thermochemical Data of Pure Substances, 3rd ed.; VCH: Weinheim, Germany, 1995. [Google Scholar]
  22. Puigdomenech, I. Make equilibrium diagrams using sophisticated algorithms (MEDUSA). In Inorganic Chemistry; Royal Institute of Technology: Stockholm, Sweden, 2004. [Google Scholar]
Figure 1. Variation of the (a) As leaching ratio, (b) bacteria number, (c) pH and solution potential and (d) Fe2+, Fe3+ and total Fe concentrations with time during the bioleaching of arsenopyrite particles.
Metals 09 01320 g001
Figure 2. (a) XRD diffractograms and (b) QPA results of the bioleached arsenopyrite particles after leaching different days.
Metals 09 01320 g002
Figure 3. Eh−pH diagrams of FeAsS−H2O system for (a) Fe species, (b) As species. (c) S species. Conditions: [Fe2+] 0.16 M, [FeAsS] 0.06 M.
Metals 09 01320 g003
Figure 4. SEM images of jarosite on the surface of arsenopyrite cube after bioleaching 8 d in 9K culture medium. Conditions: (a) Magnification 1000×; (b) Magnification 5000×.
Metals 09 01320 g004
Figure 5. SEM images for the surface of arsenopyrite cube after bioleaching (a) 36 h and (b) 120 h in 9K culture.
Metals 09 01320 g005
Figure 6. Schematic diagram of the passivation mechanisms of arsenopyrite bioleaching.
Metals 09 01320 g006
Table 1. EDS data for the surface of arsenopyrite cube in Figure 5.
Bioleaching Time/hSpots aContent/at%
FeAsSO
36a-133.1234.9627.144.78
36a-210.7932.9731.6924.55
36a-334.1610.7017.1138.03
120b-131.8030.1231.976.11
120b-212.2121.4322.7843.58
120b-321.626.1715.6856.53
a Analysed spots are in correlation with those in Figure 5.
Table 2. Possible reactions involved in the leaching of arsenopyrite.
Reaction Equations∆Gr0/(kJ/mol) aNo.
6FeAsS + 7H2O + 22Fe3+ = 28Fe2+ + 2As2S2 + 2AsO2 + S2O32– + 14H+−1582.7531
3FeAsS + 2H2O + 9Fe3+ = 12Fe2+ + As2S3 + AsO2 + 4H+−761.9002
FeAsS + 3H2O + 6Fe3+= 7Fe2+ + S0 + HAsO3 + 5H+−383.1523
3As2S2 + 4H2O + 6Fe3+ = 6Fe2++ 2As2S3+ 2AsO2 + 8H+−174.8464
As2S2 + 6H2O + 8Fe3+ = 8Fe2++ 2S0 + 2HAsO3 + 10H+−316.6525
As2S3 + 6H2O + 8Fe3+ = 8Fe2++ 3S0 + 2HAsO3 + 10H+−293.7126
3Fe3+ + K+ + 2SO42– + 6OH = KFe3(SO4)2(OH)6<0 b7
a Values were calculated using equation of ΔGr0 = ∑ [νiΔGf0(i)], where ΔGf0 values are listed in Appendix A. b The ΔGr0 value cannot be calculated due to lack of the ΔGf0 value of KFe3(SO4)2(OH)6.