Article

Laser Powder Bed Fusion of Inconel 718: Residual Stress Analysis Before and After Heat Treatment

1
ISEP—School of Engineering, Polytechnic of Porto, Rua Dr. António Bernardino de Almeida, 431, 4249—015 Porto, Portugal
2
Department of Applied Science and Technology (DISAT), Politecnico di Torino, Corso Duca degli Abruzzi, 24, 10129 Torino (TO), Italy
3
Department of Management and Production Engineering (DIGEP), Politecnico di Torino, Corso Duca degli Abruzzi, 24, 10129 Torino (TO), Italy
*
Author to whom correspondence should be addressed.
Metals 2019, 9(12), 1290; https://doi.org/10.3390/met9121290
Submission received: 28 October 2019 / Revised: 23 November 2019 / Accepted: 26 November 2019 / Published: 30 November 2019

Abstract

:
Residual stresses (RS) of great magnitude are usually present in parts produced by Laser Powder Bed Fusion (PBF-LB), mainly owing to the extreme temperature gradients and high cooling rates involved in the process. Those “hidden” stresses can be detrimental to a part’s mechanical properties and fatigue life; therefore, it is crucial to know their magnitude and orientation. The hole-drilling strain-gage method was used to determine the RS magnitude and direction-depth profiles. Cuboid specimens in the as-built state, and after standard solution annealing and ageing heat treatment conditions, were prepared to study the RS evolution throughout the heat treatment stages. Measurements were performed on the top and lateral surfaces. In the as-built specimens, tensile stresses of ~400 MPa on the top and above 600 MPa on the lateral surface were obtained. On the lateral surface, RS anisotropy was noticed, with the horizontally aligned stresses being three times lower than the vertically aligned. RS decreased markedly after the first heat treatment. On heat-treated specimens, magnitude oscillations were observed. By microstructure analysis, the presence of carbides was verified, which is a probable root for the oscillations. Furthermore, compressive stresses immediate to the surface were obtained in heat-treated specimens, which is not in agreement with the typical characteristics of parts fabricated by PBF-LB, i.e., tensile stresses at the surface and compressive stresses in the part’s core.

1. Introduction

Metals additive manufacturing (AM) is a flourishing technology, as it is growing rapidly and with great success. AM terminologies and general principles are standardized by the ISO/ASTM 52900 (2015) international standard. Dissimilar from other manufacturing technologies, AM produces parts by a layer-by-layer stacking approach [1,2,3,4,5]. The process starts from a three-dimensional (3D) computer-aided design (CAD) model of the part to be built, which is sliced in several thin layers by a appropriate software [6]. Then, in the AM equipment, thin layers of material are selectively melted and joined on the top of each other progressively with the help of an energy source [6,7]. This is a generic principle usually adopted for AM technology, among the different AM techniques it can be slightly distinct. Metals AM is currently widely used in the production of prototypes, tools, and semifinished or finished products in the aerospace, automotive, biomedical/medical, and energy industries [6,7,8,9,10].
Diverse metals AM techniques exist, and the most adopted in the industry are Powder Bed Fusion (PBF) and Directed Energy Deposition (DED), as for the classification by the ISO/ASTM 52900 (2015) international standard. These two techniques use a laser or an electron beam as a high energy density source to selectively melt the material and build the parts [3,4,5,6,7]. Actually, different nomenclatures are used for the same process. Laser Powder Bed Fusion (PBF-LB) is also known as Selective Laser Melting (SLM), Direct Metal Laser Sintering (DMLS), and Laser Cusing [7,8,11], depending mostly on the AM systems supplier.
Focusing on PBF-LB, a micro-size powder is spread in thin layers of 20 and 50 µm [3], and then a laser beam guided by a galvanometric mirror selectively melts the deposited material according to the CAD model. The parts are built progressively from bottom to top, also known as the building direction (vertical) [7,11]. The use of support structures is common, either to support down-facing surfaces or to prevent part distortion. Part distortion occurs due to the large residual stresses (RS) generated during material solidification layer-by-layer, owing to the extreme temperature gradients and high cooling rates [12].
New feedstock materials dedicated to AM systems have been developed; thereby, new opportunities will arise in the near future of AM [13]. Stainless steel; tool steel; and Ni-, Al-, Ti-, Co-Cr-, and Cu-based alloys are just a few of the metallic materials currently available for AM [7,14,15]. Introduction of intermetallic compounds and Metal Matrix Composites in AM is under research [13].
Ni-based alloys, also known as superalloys, have been developed to work on a large range of temperatures (cryogenic to high temperatures) in harsh environments, exhibiting exceptional properties (good corrosion resistance and high strength) when compared with other alloys [7,14]. Inconel® 718 (IN718) is among the most used superalloys in AM. It is widely used for high performance components, for example, turbine blades, aerospace parts, and energy power plants. [12,16,17].
The microstructure is extremely dependent on the chemical composition and thermal history. IN718 is a complex material to be processed with AM processes, as it has a wide number of alloying elements (UNS N07718) [3]. IN718 is a precipitation strengthening alloy. Its microstructure consists of a ɣ matrix (ɣ phase) rich in Ni, Cr, and Fe, which is strengthened by the precipitation of metastable ɣ’’ phase, Ni3Nb, and stable ɣ’ phase, Ni3(Al, Ti) [18]. δ has the same chemical formula of the ɣ’’ phase, Ni3Nb, however, it is incoherent with the ɣ matrix [12]. Large amounts of δ phase are detrimental to the mechanical properties, while moderate amounts can be beneficial to the notch sensitivity of the material [19]. Large carbides and Laves phases negatively affect the mechanical performance of the part. These phases can also exist in the as-built state and therefore to dissolve them a further heat treatment is required [18,20,21].
To dissolve the undesired phases, precipitate the strengthening phases, and consequently improve the mechanical properties of the material, a solid solution annealing (SA) plus double ageing (DA) heat treatment is required [22]. The standards for heat treatments report: SA should be performed per SAE AMS 5662 (2016) at 980 °C, or per SAE AMS 5664 (2017) at 1065 °C, and DA per SAE AMS 5662 (2016) at 720 °C and 620 °C.
Melt pool characteristics of parts fabricated by PBF-LB are usually observed at lower magnification. They are characterized by an arc-shaped or “fish-scale” patterns in the vertical plane, corresponding to the melt pool profile influenced by the Gaussian distribution of the laser energy. In the horizontal plane, the scanning tracks are usually observed as continuous lines [18,19,22,23,24,25]. The microstructure in the as-built condition usually exhibits epitaxial growth of columnar grains including fine columnar or cellular dendrites along the built direction, owing to the high cooling rates of the PBF-LB process (106 K/s [19,26]) and the heat dissipation direction, i.e., vertically through the substrate [13,21,27].
Calandri et al. [25,28] studied the microstructure of IN718 parts fabricated by PBF-LB in as-built and post-heat treated conditions, revealing carbides, Laves phases, and segregations; therefore, heat treatments are crucial to homogenize the microstructure. Li et al. [13] studied the microstructure of an IN718 sample after SA plus DA heat treatments, varying the SA temperature from 940 °C to 1060 °C. In the as-built condition, ɣ’’ and ɣ’ phases precipitated and no δ phase was identified. Zhang et al. [19] observed a similar microstructure, moreover, carbides were found at the grain boundaries. Li et al. [23], Deng et al. [12], and Zhang et al. [27] observed Laves phase in the interdendritic zone of as-built specimens and no strengthening phases were revealed. Therefore, the microstructure in the as-built condition is highly dependent on the PBF-LB process parameters.
In heat-treated specimens, δ phase was identified, plate-like at the grain boundaries and needle-like heterogeneously distributed in the grains. For heat-treated with SA temperature above 1020 °C, the δ phase dissolved completely into the ɣ matrix [13]. However, Cao et al. [21] investigated the formation of ɣ’’, ɣ’, and δ precipitates in the heat-treated condition, and observed the presence of δ phase in heat-treated condition with SA at 1065 °C. Furthermore, ɣ’’ phases with precipitates size between 10 and 50 nm were identified. Nevertheless, different SA cooling methods were used in those experiments, water cooled [13], and air cooled [21]. The standard SA plus DA heat treatment is performed with the intention to improve the mechanical properties and tailor the microstructure [18]. Although the high temperatures of the heat treatment affect the RS magnitude, they are not high enough to promote the full recrystallization of the microstructure and suppress the RS [27].
Heterogeneous plastic strains are the source for the RS, and these strains can be induced by thermal or mechanical principles [29]. RS are spatially nonuniform in AM, which can be detrimental to the mechanical properties and fatigue life of the built parts; moreover, it can have an impact during the building process [6]. Thus, it is crucial to know the expected magnitude and orientation of the RS in order to carry out safe and accurate predictions of the final part properties [30]. Zhang et al. [27] stated that RS provide impetus for grain growth, being beneficial for the recrystallization during the heat treatment.
The scan vector length can influence the magnitude and distribution of the RS, as shorter scan vectors result in a lower temperature gradient owing to the remaining temperature from the previous melted track [31]. Thus, smaller scan vectors generate lower RS; therefore, “island” or “striping” scan strategies are usually adopted [32]. Usually, in parts fabricated by PBF-LB, the vertical oriented RS are of higher magnitude than the horizontal (layer plane), owing to the bending forces induced by the melted material on top of the much colder previous layer [29]. Typically, tensile stresses near the surface and compressive stresses on the middle regions are expected [6,29,30]. Notwithstanding, contrary results were obtained for a specific material, H13 tool steel, by Cottam et al. [33] and Ghosh et al. [34] on experimental and simulation works, respectively.
Yi et al. [35] studied the RS indirectly through the deformation of sectioned IN718 specimens produced by PBF-LB, built under different linear energy density (LED) values. Higher LED resulted in larger deformations, therefore higher RS were installed. Ahmad et al. [36] applied the contour method to determine the RS in as-built condition. Near the surface, tensile stresses above 800 MPa were verified and, in the middle of the specimen, compressive stresses over 400 MPa. Deng et al. [12] analyzed the RS of an IN718 sample by X-ray diffraction (XRD) method and found the same magnitude near the surface, ~800 MPa and ~750 MPa on horizontal built and vertically built specimens, respectively.
Nadammal et al. [37] studied the scan vector length influence on RS by neutron diffraction of IN718 parts fabricated by PBF-LB. Constant compressive stresses from approximately 200 to 400 MPa were measured in specimens built with short scan vectors, mainly in the build direction. Lu et al. [38] used Vickers micro-indentation to determine the RS magnitude of IN718 specimens, produced by PBF-LB, built with different “island” scanning strategy sizes. The lower RS was observed for the “island” scanning strategy with 5 × 5 mm2 size.
The hole-drilling strain-gage method is a distinct technique from the ones used in those works. It is a semidestructive method and has been used to measure the RS and determine the RS depth profile of specimens produced by PBF-LB with different materials, for example, Salmi & Atzeni [39,40,41] used this technique for AlSi10Mg and Casavola et al. [42] for AISI Marage 300 steel.
Residual stresses can be computed using computational models, but these models must be validated through quantitative measurements, including destructive and nondestructive experimental techniques [43]. Wang et al. [43] presented a method to validate RS prediction thermomechanical models by the neutron diffraction technique. Prediction of the induced RS is one of the main motivations for developing process simulation methods, but the RS state is complex to determine as the thermal history is characterized by layer upon layer overlapping, which results in repeated partial heating, melting, and solidification [44]. The RS and distortions on AM processes are not well understood yet [45].
Matsumoto et al. [46] proposed a method based on finite element analysis (FEA) for calculating temperature and stress distribution of a single layer produced by PBF-LB. Hussein et al. [47] investigated the temperature and stress fields of a single layer built in loose powder. Through simulation, it was predicted that higher cooling rates occur when scanning over a solid structure than on loose powder. However, by scanning on loose powder the material is free to deform and is favorable to lead to defects, such as shrinkage and cracks [47].
Fergani et al. [48] presented and validated an analytical model to predict the RS along the depth, using as material 316L stainless steel. Andreotta et al. [49] presented a sophisticated model, which simultaneously simulate the thermal transport and fluid flow to predict melt pool and final bead geometry of IN718 fabricated by PBF-LB. This model is based on a single track (no full layer). Ning et al. [50] proposed an analytical model to predict the temperature using an absolute coordinate system at the part boundary. Unidirectional and bidirectional scan strategies are approached in this study. With the predicted temperatures, part distortions and RS state can be further investigated [50].
To reduce computation costs, Paul et al. [51] proposed a model assuming that the un-melted powder is a perfect insulator. However, the feature of the PBF-LB process of the powder being preplaced will affect the thermal response, part of the heat dissipation will occur through the powder compacted particles. Denlinger et al. [52] developed a finite element model for prediction of temperature history in PBF-LB process using IN718. Using the proposed method, it was determined that assuming the powder as an insulator over predicts the peak temperature by 30% [52].
Developing improved FEM and analytical models is crucial in order to facilitate the task of choosing the optimized process parameters, reducing the need of costly and time-consuming experimental works. Furthermore, such models may allow prediction of the microstructure evolution, RS, and part distortions [45]. Ideally, the models need to be accurate, high computationally efficient and intuitive; however, PBF-LB is a multi-physics complex problem to analyze [53]. The high computational cost is the main drawback to the development of more accurate models and methods of predicting and simulating the AM processes [50]. Validation of models that can accurately simulate and predict the RS of full complex parts built by AM have rarely been accomplished [45].
In terms of literature there is a lack of research related to the study of the RS evolution of IN718 parts fabricated by PBF-LB. Thereby, it is crucial to understand RS evolution from the as-built condition to the heat-treated condition. Moreover, this work approaches a technique for RS measurements not yet reported in the literature for IN718 produced by PBF-LB, allowing a different point of view for the RS analysis, i.e., the study of the RS depth profile (transversal to a surface). Also, this experimental work may be useful hereafter to validate under development computational models related to RS predicting of IN718 components.

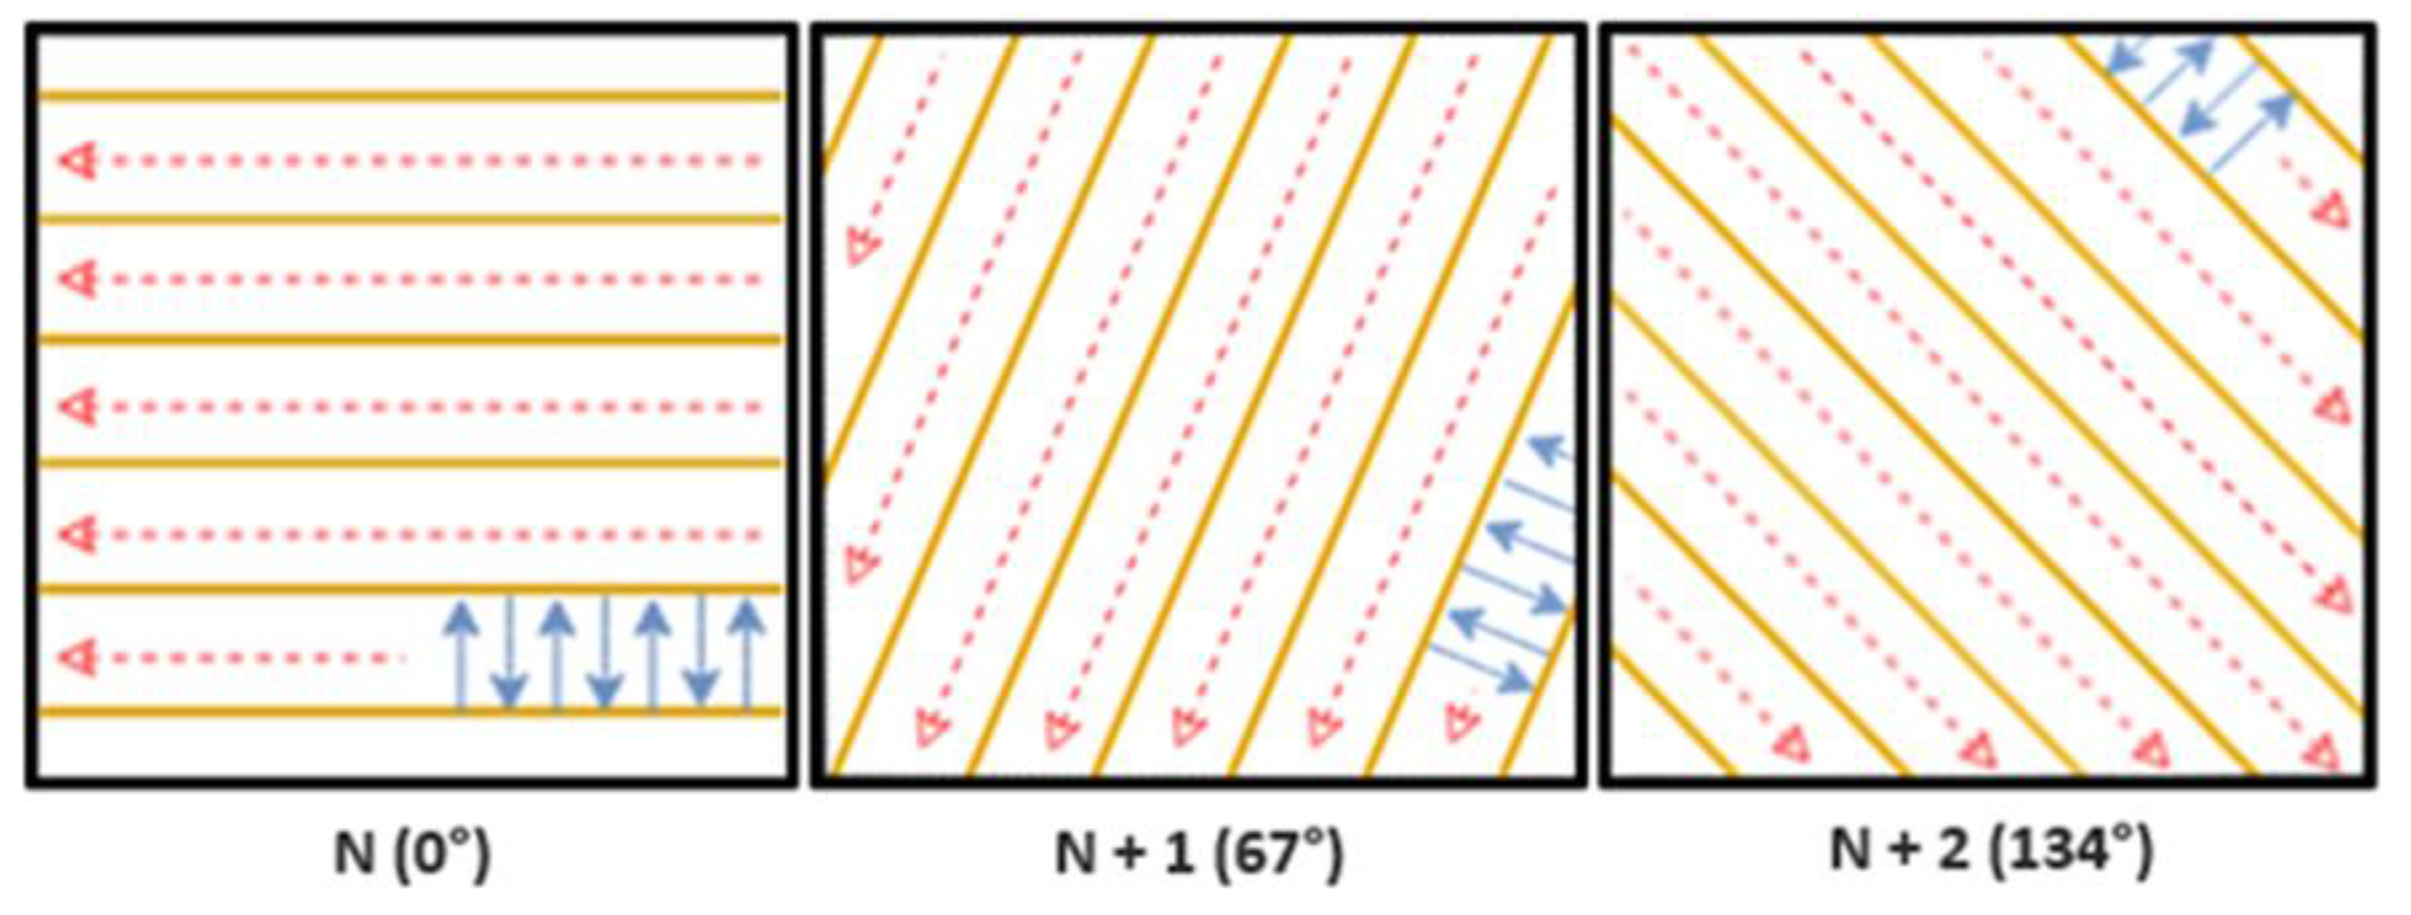
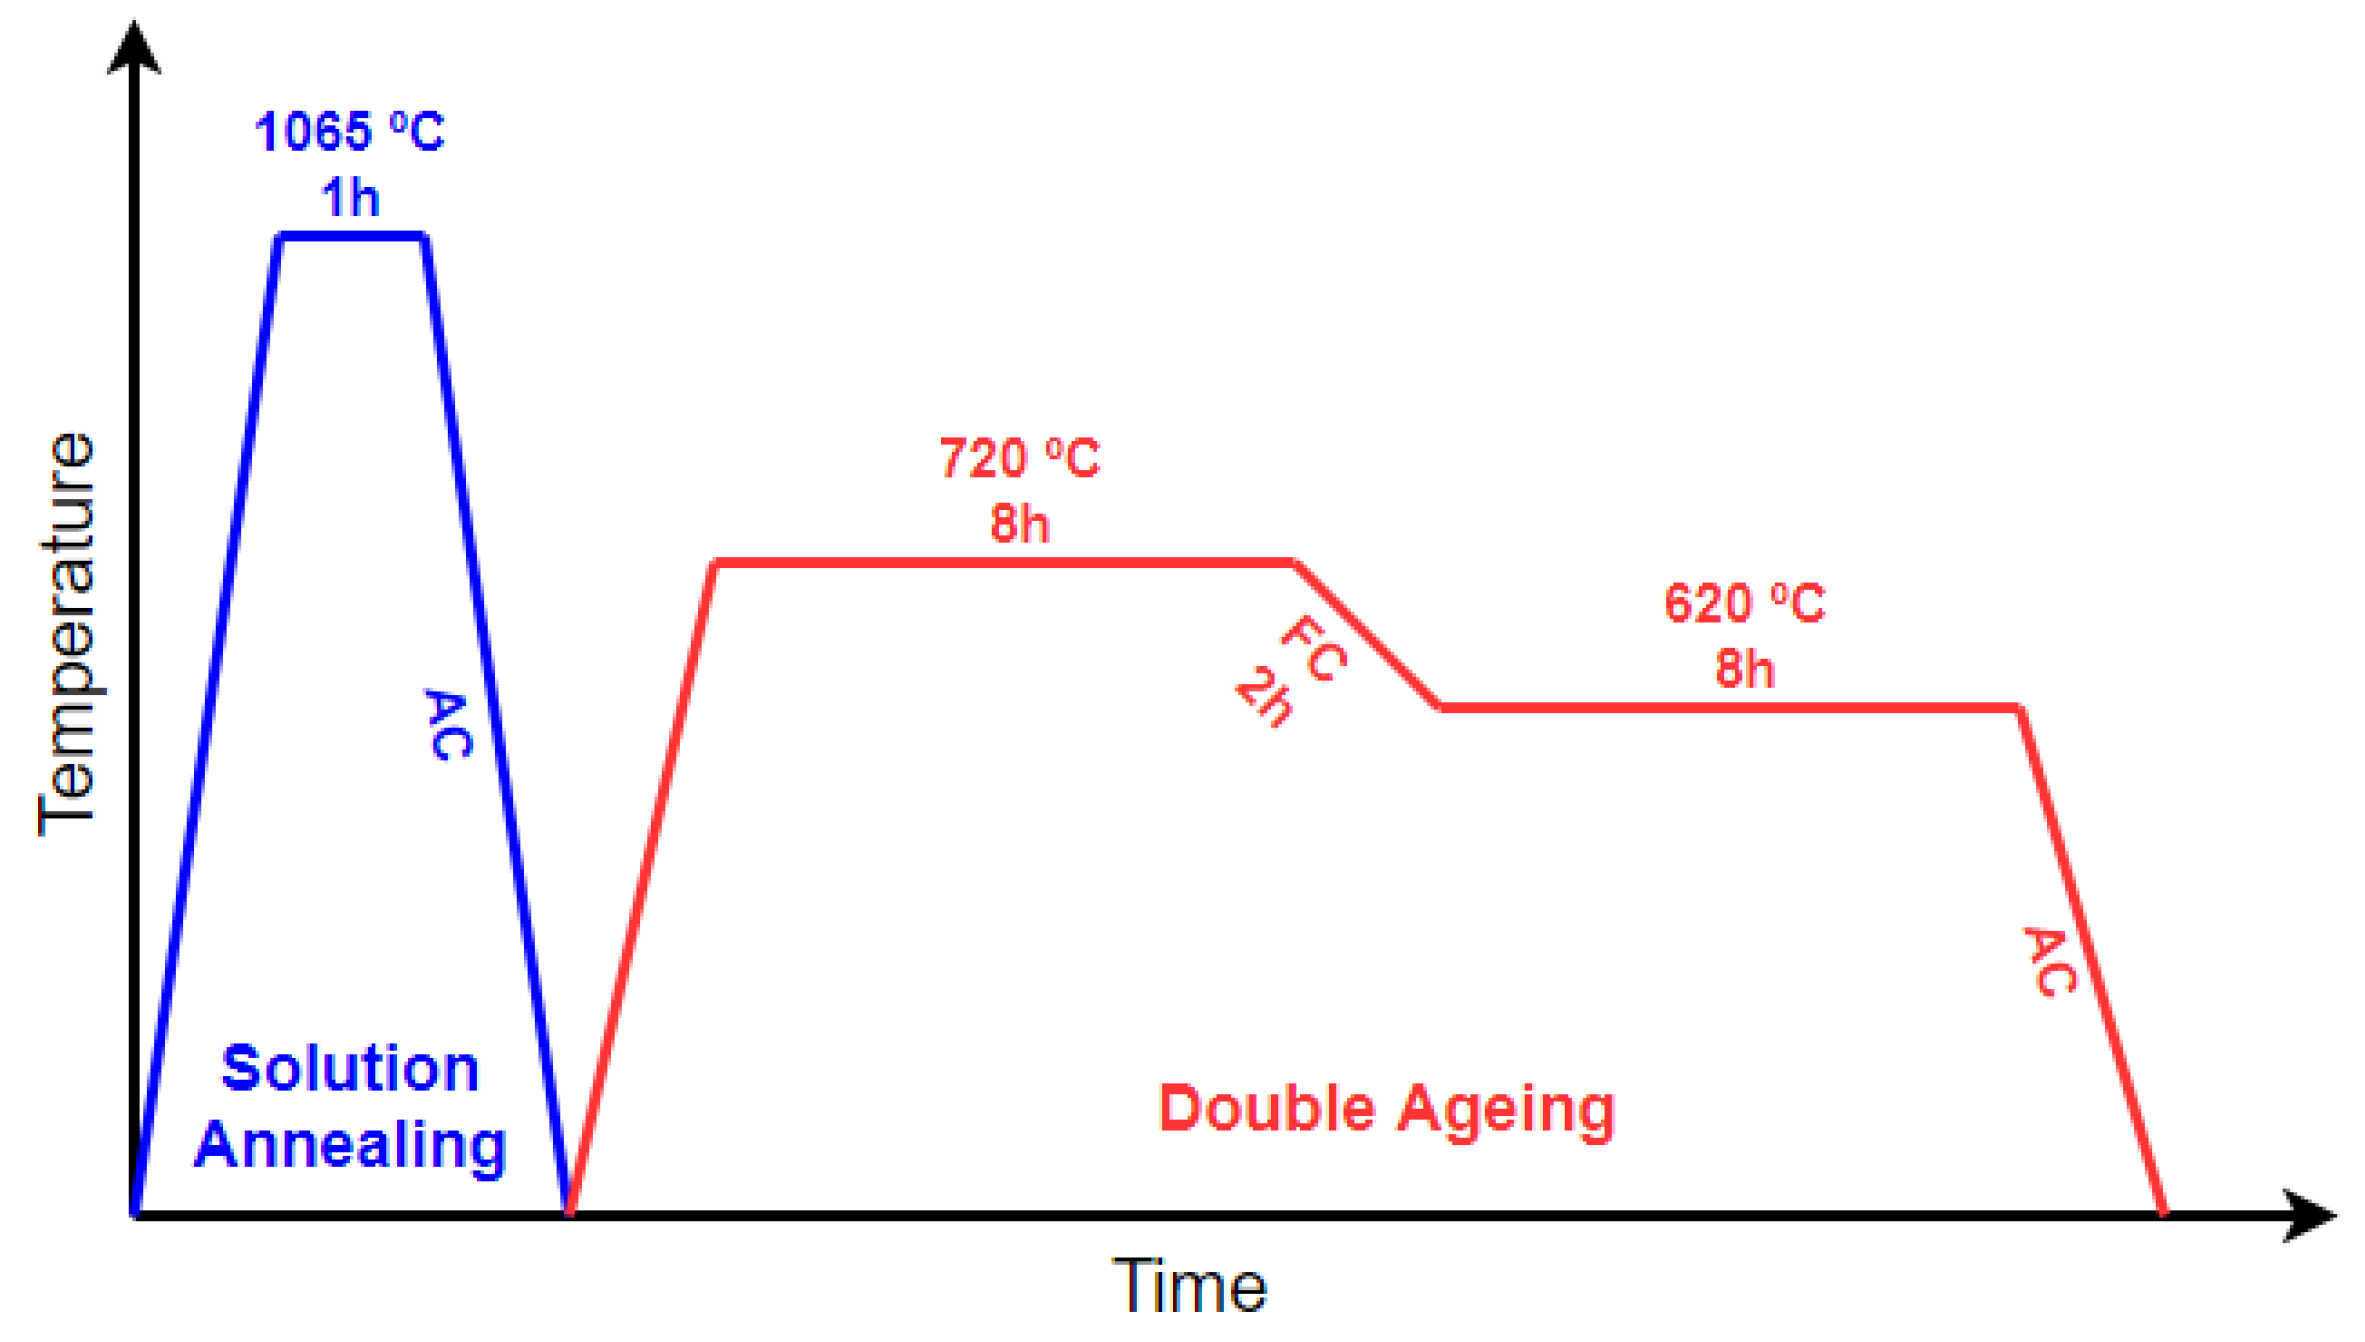
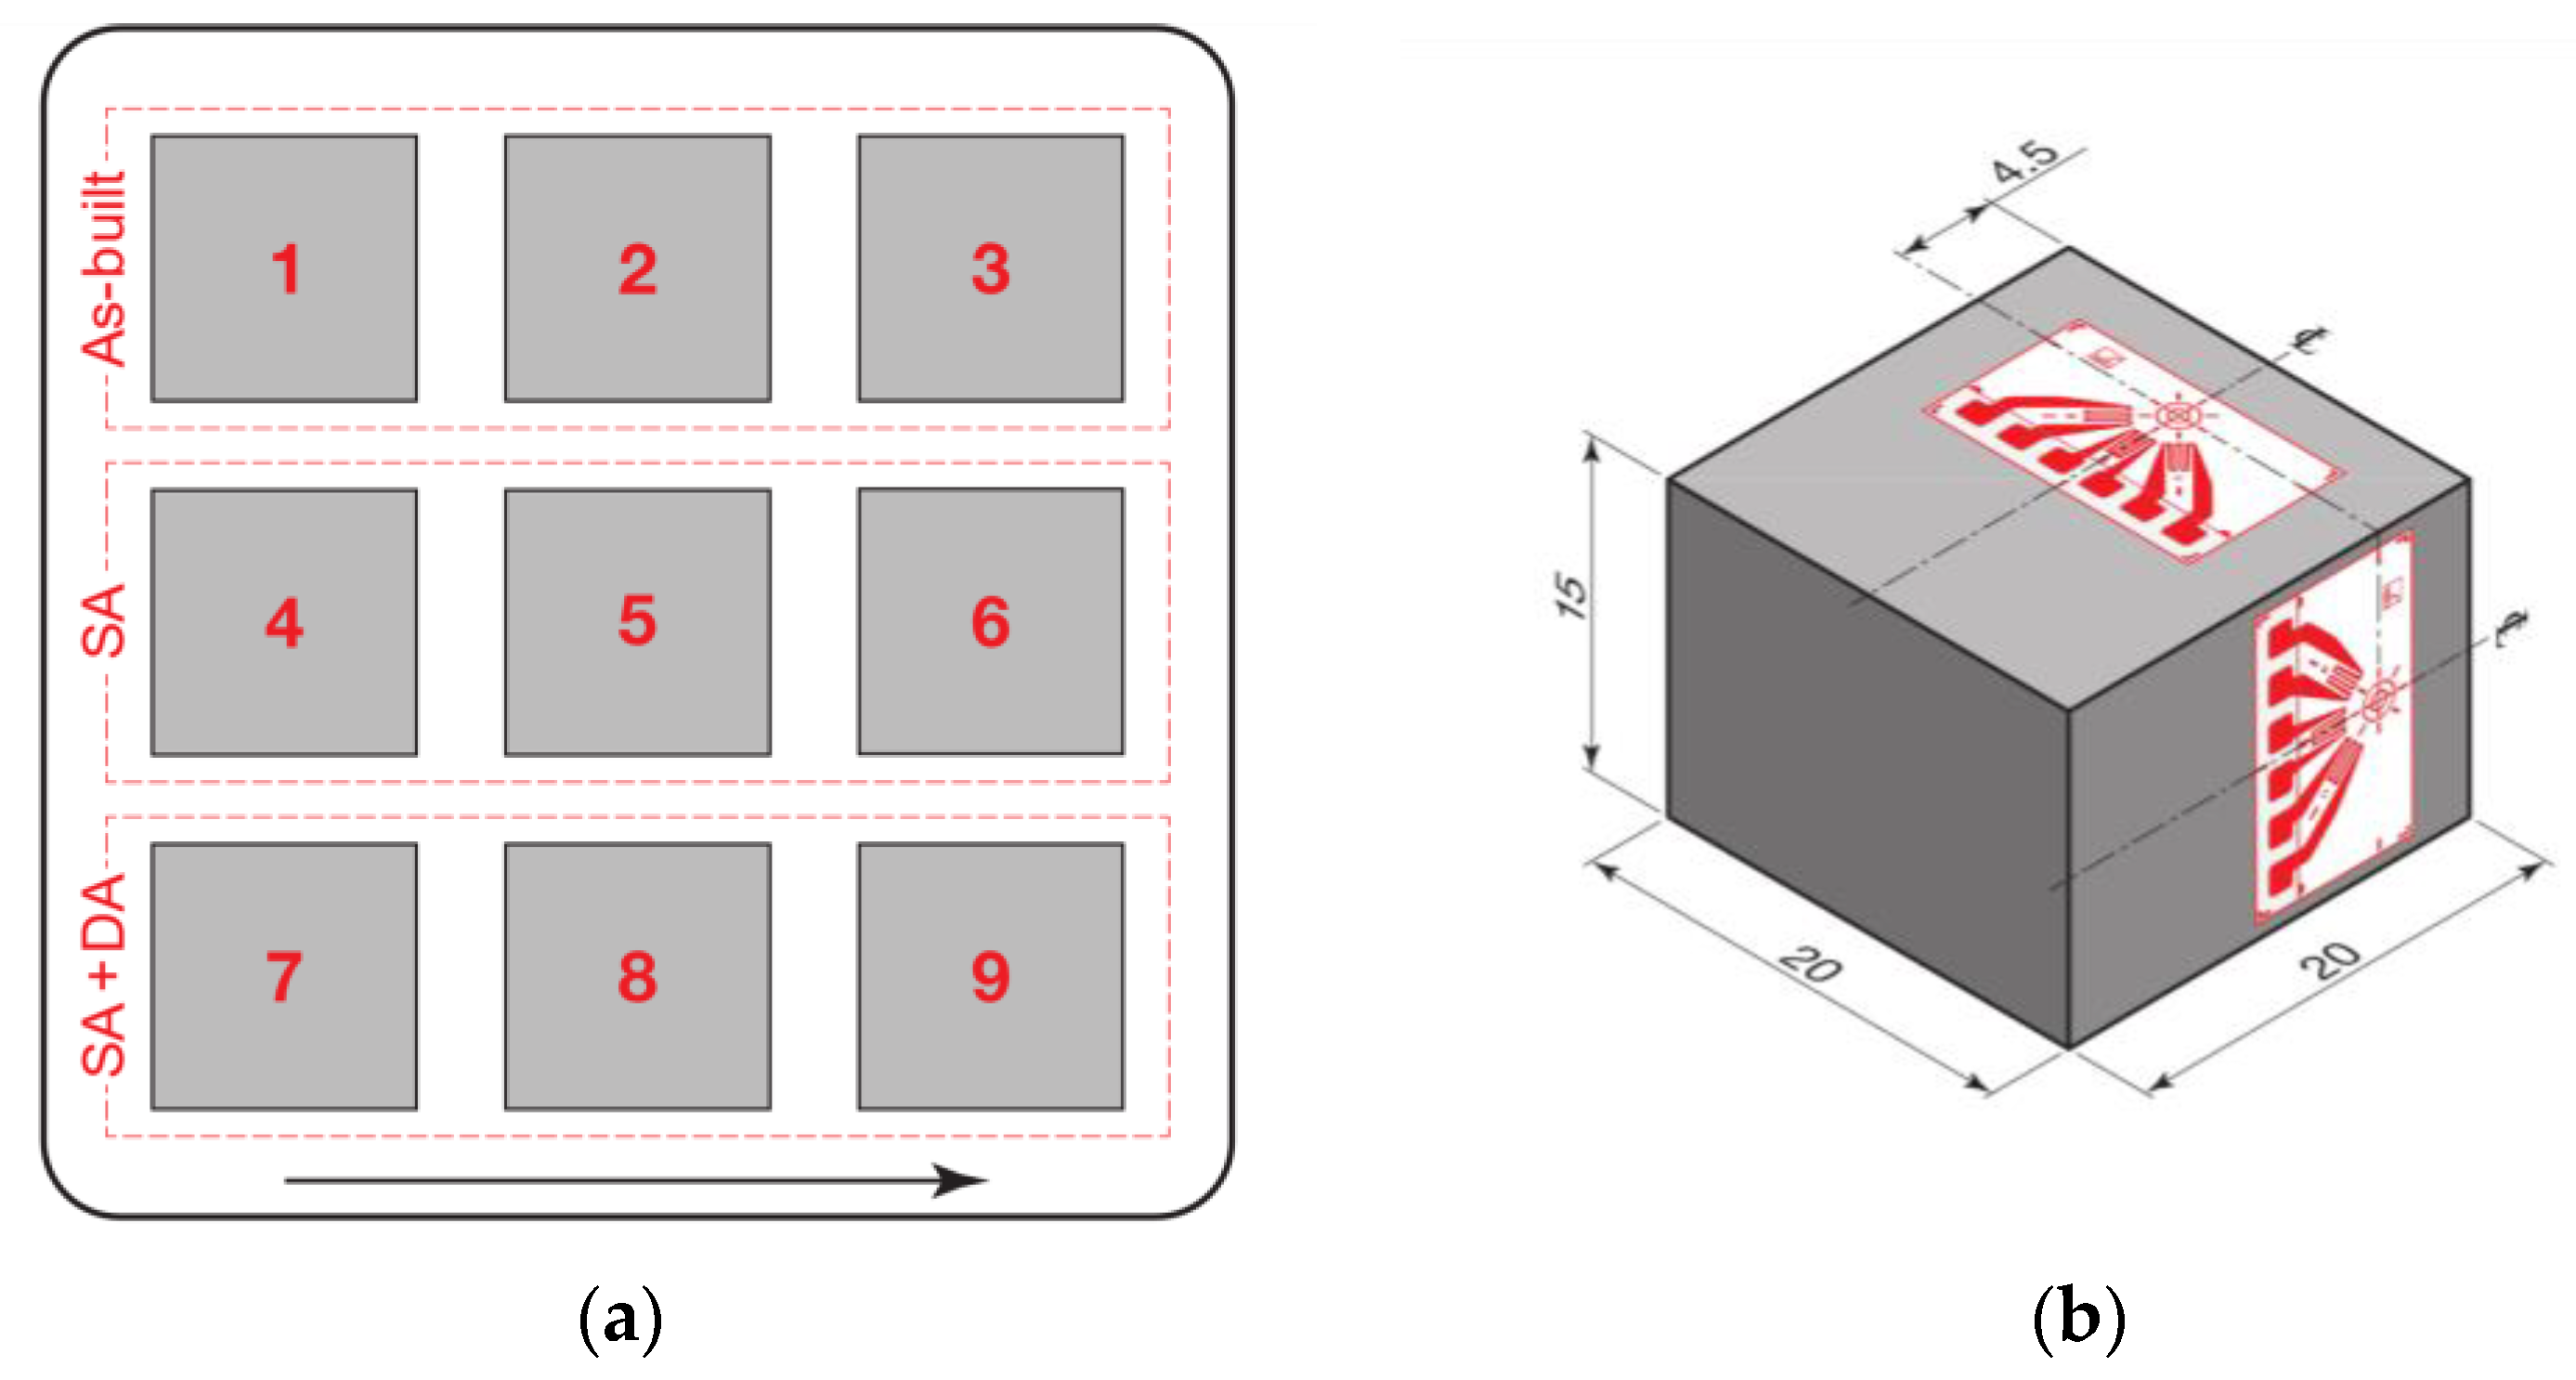
2. Materials and Methods
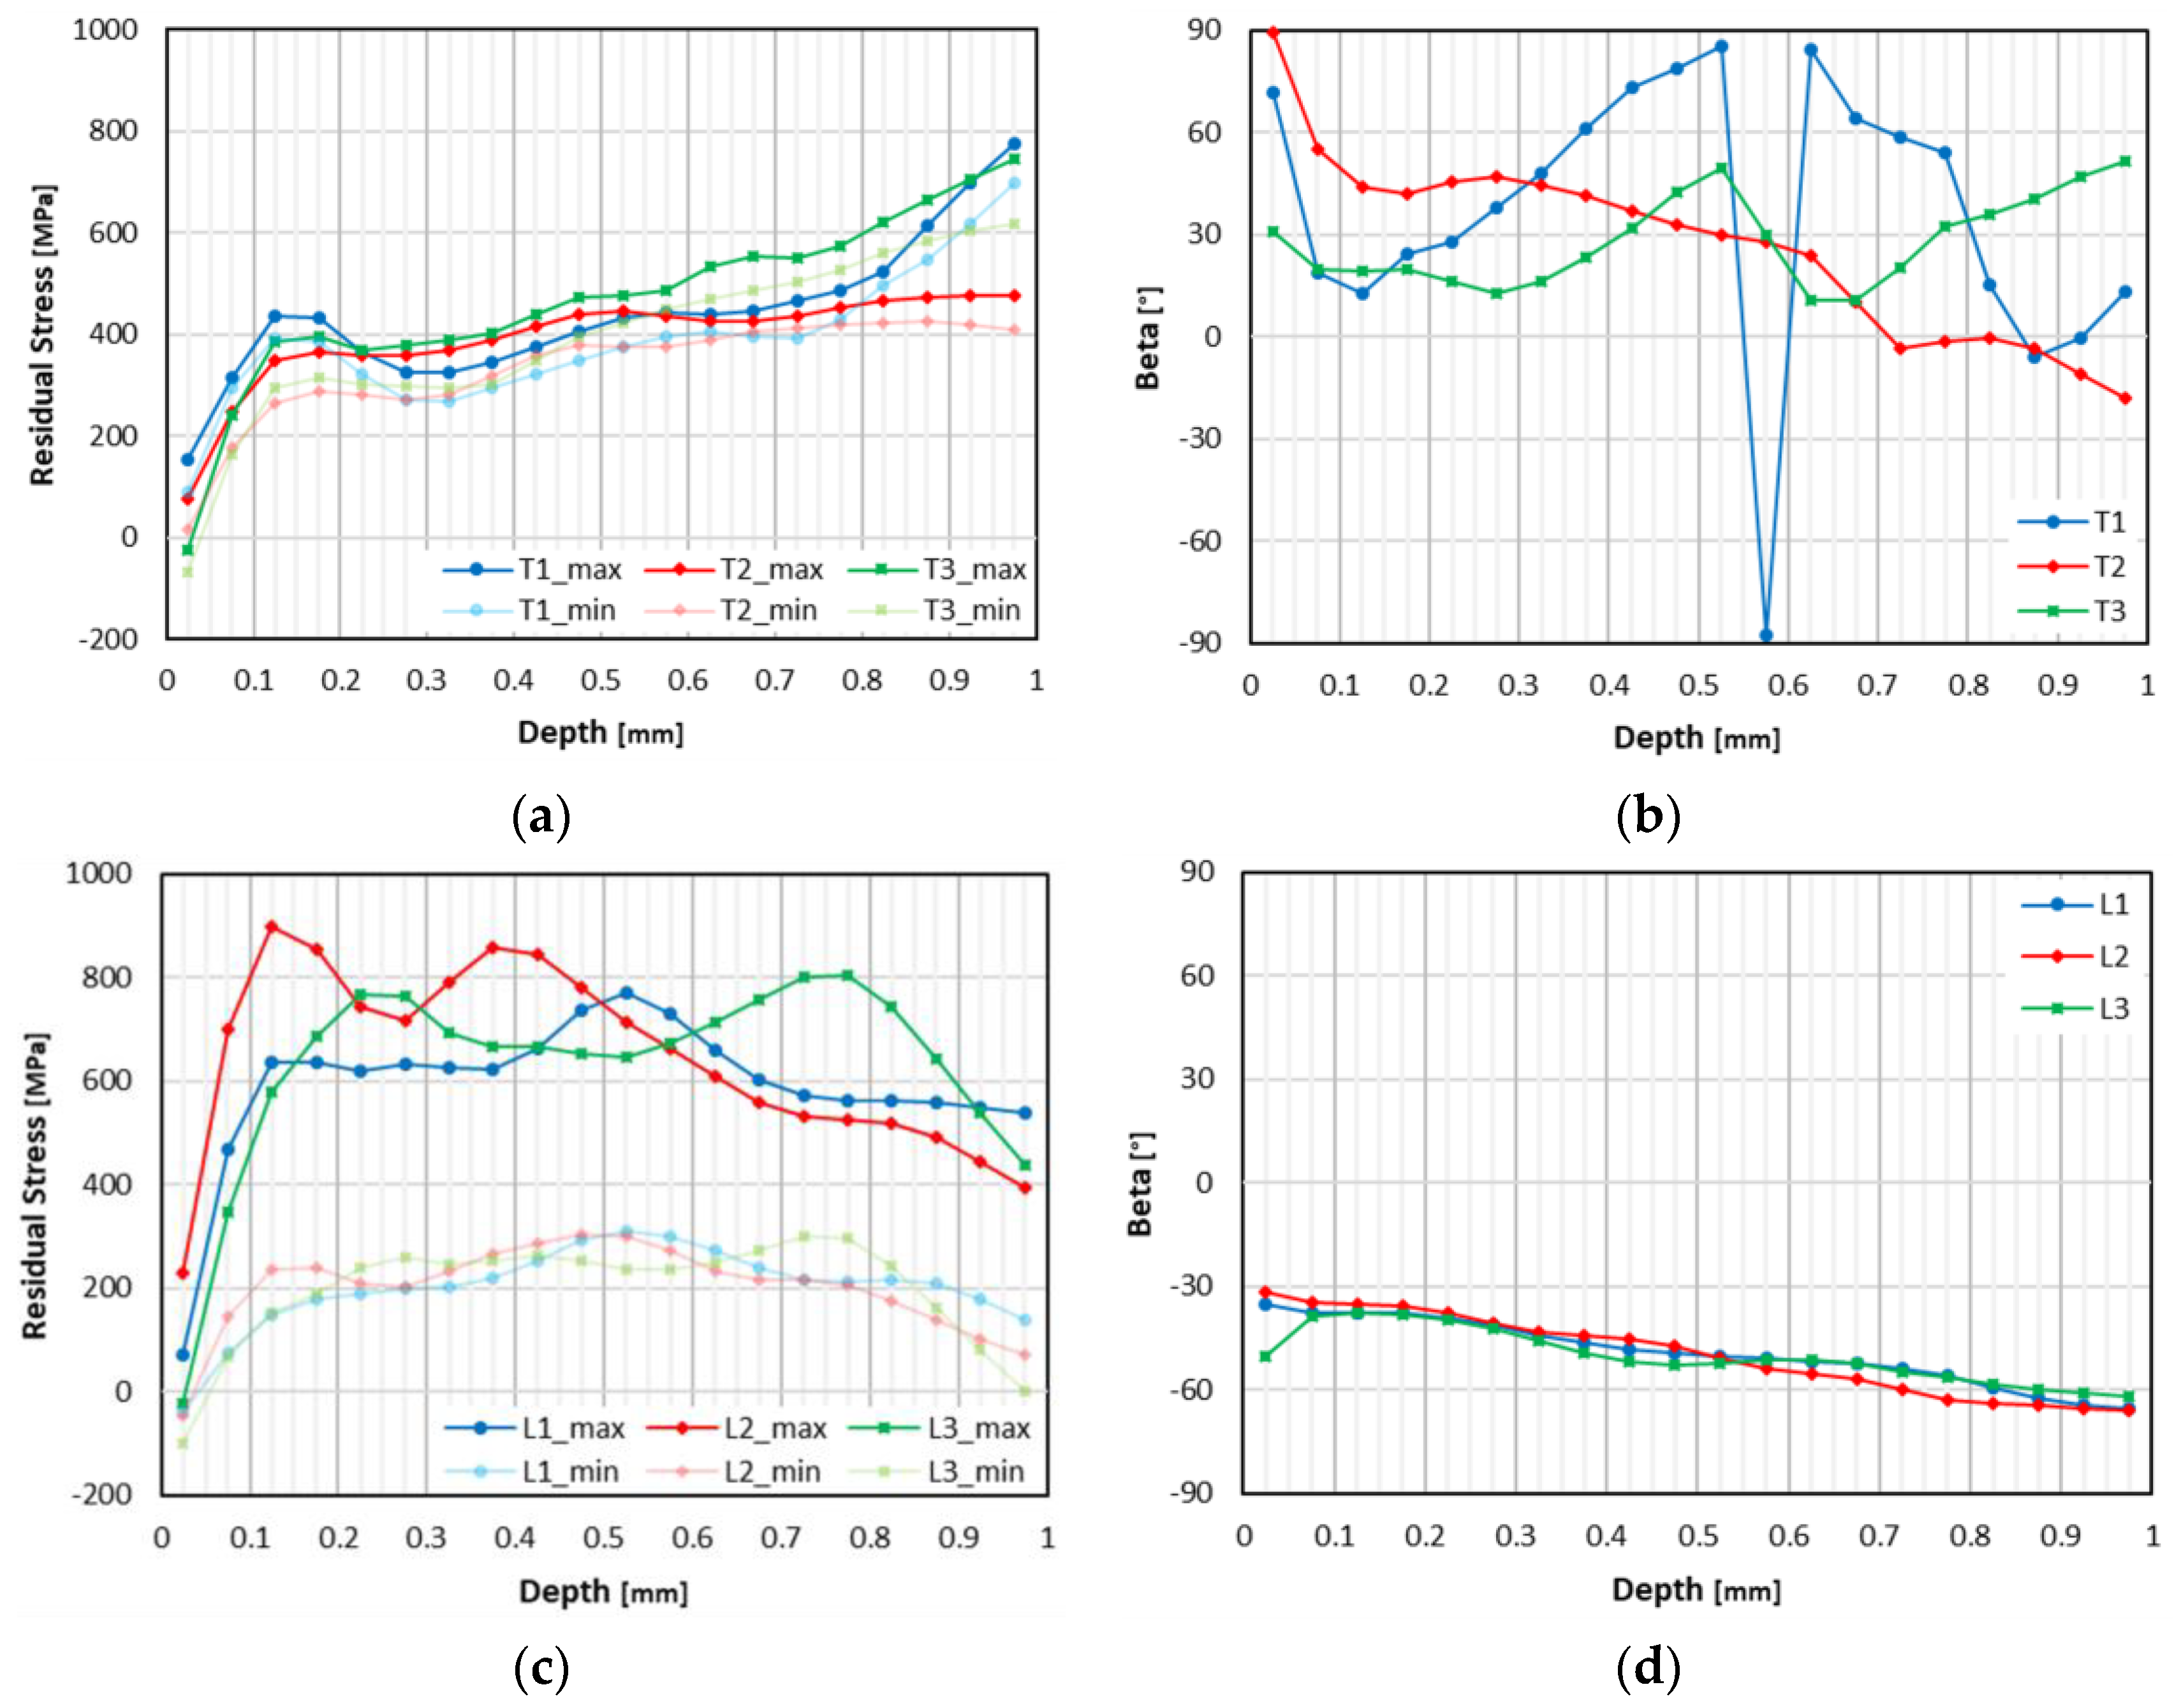
A total of nine 20 × 20 × 15 mm3 cuboid specimens were produced using a MLab Cusing R machine (Concept Laser GmbH, Lichtenfels, Germany). The machine is equipped with a 100 W fiber laser. The feedstock material used to produce the samples was the gas atomized powder EOS Nickel Alloy IN718 (EOS GmbH, Krailling, Germany), which has a chemical composition in accordance with UNS N07718. The powder was sieved so as to use powder particles less than 50 µm. The particle size distribution was determined using Scanning Electron Microscopy (SEM, Phenom-World BV, Eindhoven, Netherlands) by post-image analysis, revealing a d50 of ~25 µm and a d90 of ~45 µm, where d50 and d90 correspond to the cumulative frequency in percentage of particles size distribution (d stands for diameter). All the specimens were produced in a single job using a constant flow of Argon. At the start of the job the build chamber and the substrate were at the room temperature, no preheating was used.
PBF-LB process parameters used to produce specimens: laser power: 95 W; layer thickness: 20 µm; scanning speed: 800 mm/s; hatching distance: 0.05 mm. The set of process parameters employed guarantee high densification level with the formation of a reduced level of pores. The “striping” scanning strategy was adopted, with a strip width of 5 mm. Every subsequent layer the scanning pattern was rotated 67°. Figure 1 illustrates the scanning strategy (rough example): N is the first layer and N + 1 the subsequent one, after the 67° rotation; the yellow lines represent the “striping” boundaries; the blue arrows represent the laser scan vectors; the red arrows correspond to the movement along the stripes length; and, after finishing the first stripe, the laser moves to the beginning of the next stripe.
The RS measurements and analysis were carried out on specimens in as-built and heat-treated conditions. The heat treatment was performed in a P330 tube furnace (Nabertherm GmbH, Lilienthal, Germany). The time-temperature profile of the heat treatment is represented in Figure 2. The description of the heat treatment is SA at 1065 °C for 1 h followed by air cooling (AC), per SAE AMS 5664 (2017), plus DA at 720 °C for 8 h followed by furnace cooling (FC) for 2 h to 620 °C, maintained for 8 h followed by AC, per SAE AMS 5662 (2016). Specimens in SA and SA plus DA conditions were chosen to study the evolution along the heat treatment stages.
The specimen disposition on the substrate is illustrated in Figure 3a, the arrow indicates the re-coater travel direction. Three specimens were selected for each analysis: 1–3 for the as-built condition, 4–6 for SA heat-treatment, and 7–9 for SA plus DA heat-treatments. The specimens were cut from the substrate by Wire-Electrical Discharge Machining (W-EDM).
The RS measurements were performed by the hole-drilling strain-gage method, standardized by the ASTM E837 (2013) standard. The method was carried out in a MTS3000-RESTAN equipment (SINT Technology s.r.l., Calenzano, Italy) and a SINT RSM software (SINT Technology s.r.l., Calenzano, Italy). K-RY61-1.5/120R rosettes (HBM GmbH, Darmstadt, Germany) were used, designated as counterclockwise type B in accordance with the standard (illustration of the rosette configuration in Figure 3b).
The surfaces for RS measurement were polished with 200 and 400 grit sandpaper and cleaned with an RMS spray solvent (HBM GmbH, Darmstadt, Germany), then the rosettes were attached with a Z70 glue (HBM GmbH, Darmstadt, Germany). A X60 cold-curing adhesive (HBM GmbH, Darmstadt, Germany) was used to glue the wires on the specimen and prevent wire fracture. The same adhesive was used to fix the specimens on the working base before starting the measurement.
The RS measurements were performed on top (drilling parallel to the build direction) and lateral surfaces (drilling perpendicular to the build direction). Figure 3b illustrates the positioning of the rosettes. The drilling center was positioned at a distance of 4.5 mm from the border of the specimen. A 1.8 mm diameter coated carbide end mill with an inverted cone shape was used with a feed rate of 0.1 mm/min. A hole with 1.2 mm depth was made progressively in 48 drilling steps of 25 µm.
The hole-drilling strain-gage method measures the in-plane strains (driven by the installed RS) near the surface of a part to a certain depth and determine by calculation the corresponding average RS, even if the stresses are nonuniform along the depth. This method allows determining the RS magnitude (maximum and minimum) and direction. The maximum principal stress corresponds to the higher tensile stress or in case of compressive stresses, the lower compressive stress. In contrast, the minimum principal stress corresponds to the lower tensile stress or higher compressive stress and is deflected 90° in relation to the maximum stress. The direction of the maximum principal stress is characterized by the beta (β) angle, which is measured from the strain-gage A (further details in ASTM E837 (2013)).
The SINT EVAL software (SINT Technology s.r.l., Calenzano, Italy) was used to process the strain data and calculate the average RS, determining the RS depth profiles. A Young’s modulus of 170 GPa [54] and a Poisson’s ratio of 0.29 [55] were used to determine the RS. The calculation method to transform the measured strains in RS values was the extended nonuniform, described in the ASTM E837 (2013) standard. The calculations were made to a depth of 1 mm in 20 calculation steps with a linear distribution of calculation steps, as defined in the standard. The hole was made to a depth of 1.2 mm to improve the analysis at 1 mm depth, thus more data is available for the interpolation of the strain. A polynomial interpolation (degree 20) was used to filter the strain data. Tikhonov regularization was used to minimize strain measuring errors resulting from a large number of drilling steps (48 steps).
Posteriorly to the measurements, the microstructure of the as-built and heat-treated condition was analyzed by SEM. The specimens were sectioned along the center of the top and lateral holes resultant from the RS measurements. The microstructure was analyzed mainly on the borders of the holes. The surface was prepared with 320, 500, 800, 2000 and 4000 grit sandpaper and, posteriorly, with 3 µm and 1 µm diamond paste. Next, all the samples were chemically etched via immersing the samples for 30 s in a Kalling’s No. 2 etchant.
To simplify the identification of the specimens in the results section, the following codification was adopted; “T” corresponds to measurements made on the top surface and “L” on the lateral surface; the numbering from 1 to 9 corresponds to the specimen number (see Figure 3a and respective caption to relate the number to the specimen condition); “max” corresponds to the maximum principal stress and “min” to the minimum principal stress.

3. Results

3.1. As-Built Condition

Line graphs were created to facilitate the processing and discussion of results, residual stress-depth graphs for RS magnitude and beta-depth graphs for RS direction. Figure 4 shows the graphs for the as-built condition. On the top surface, the magnitude profiles are similar for all 3 specimens (Figure 4a). Immediately near the surface the tensile stresses are relatively low when compared with the values at greater depth. From 0.1 mm and deeper, the RS values are ~400 MPa or higher. A slight increasing trend is observed after a depth of 0.4 mm, reaching almost 800 MPa at 1 mm depth.
Maximum and minimum principal stresses are very close in terms of magnitude values and have an identical trend. Regarding the RS direction (Figure 4b), a small deviation exists between the three specimens; nevertheless, almost all values are between 0° and 90°.
The same behavior (low RS) was noticed immediately near the surface on the as-built lateral surface (Figure 4c). However, for deeper depths, high RS values were obtained, and tensile stresses were between 600 and 900 MPa from 0.1 to 0.6 mm depth. After a depth of 0.6 mm, a decreasing trend is observed, with magnitudes of approximately 400 and 600 MPa for specimens 1 and 2.
In addition, significant oscillations are identified for all 3 specimens. The oscillations are of approximately 200 MPa magnitude, for example, specimen 2 shows a tensile stress of 900 MPa at 0.125 mm depth, which decreases to 720 MPa at 0.275 mm and increases again at 0.375 mm to around 850 MPa.
In this case, on the as-built lateral surface, a substantial difference between the maximum and minimum principal stresses exists. The minimum stress does not exceed 308 MPa (specimen 1) and has a trend between 200 and 300 MPa for all the specimens. The direction graph (Figure 4d) shows a steady decreasing trend, from −30° at immediately near the surface to −60° at 1 mm depth.

3.2. SA Heat-Treated Condition

A decrease in RS magnitude from the as-built condition (Figure 4a,c) to the SA heat-treated condition (Figure 5a,c) is noticeable (caution with the different graph scales), of four times less for top surface and eight times less for lateral surface. In SA heat-treated specimens, compressive stresses were measured immediately near the surface (Figure 5a,c).
On the SA heat-treated top surface, the magnitude immediately near the surface is from 100 to 300 MPa compressive stresses (Figure 5a). At 0.2 mm depth the magnitude stabilizes between 50 and 100 MPa tensile stresses to a depth of 0.6 mm. After that depth, the values for each specimen are distinct. Specimen 4 raises to odd tensile stress values of almost 800 MPa, specimen 5 has a slight increase to approximately 170 Mpa, and specimen 6 decreases to 100 MPa compressive stresses and abruptly rises to over 200 MPa tensile stresses. Regarding the RS direction, no results can be withdrawn, as the angle values are incoherent and present no trend (Figure 5b).
Immediately near the surface on lateral measurements, compressive stresses range from approximately 150 to 250 MPa (Figure 5c). The majority of the RS values are between 50 and 100 MPa tensile stresses. Despite the much lower RS in contrast to the as-built condition, the oscillations are also observed. With these oscillations, specimen 4 reached 200 MPa of tensile stress and specimen 6 presents compressive stresses at middle depth (0.2 to 0.5 mm).
At a greater depth, odd values were obtained for specimen 4 and 6. Both RS magnitudes decrease considerably to compressive stresses of 300–400 MPa. For both top and lateral surfaces (Figure 5a,c, respectively), the maximum and minimum principal stresses are almost equivalent however, the lateral surface presents higher deviation. In regard to the direction, only values up to a depth of 0.2 mm can be considered, ranging between −30° and −60°. At greater depths, direction values are incoherent.

3.3. SA Plus DA Heat-Treated Condition

For SA plus DA condition the RS are even lower as shown in Figure 6a,c (graph scales vary among the different specimen conditions). As in the SA heat-treated condition, compressive stresses of relevant magnitude are observed for both top and lateral surfaces, above 170 MPa for the top surface of specimen 8. From 0.1 to 0.4 mm depth the magnitude is between 10 and 50 MPA on the top surface (Figure 6a).
Oscillations are noticeable after 0.4 mm depth, with specimens 8 and 9 showing practically no RS at some depths and at other depths above 50 MPa. At a depth of 0.8 mm and beyond, distinct behaviors are presented, as specimens 7 and 8 exceed 120 MPa (tensile) and specimen 9 decreases to a compressive stress of 70 MPa. As with the SA heat-treated top surface, no results can be withdrawn from the direction graph (Figure 6b).
For SA plus DA heat-treated lateral surface, the oscillations are of lower magnitude when compared with the top surface and all the specimens follow a similar increasing trend (Figure 6c). The range of magnitude values is in accordance with the top surface values. The maximum tensile stress is of 112 MPa at 1 mm depth. However, the compressive stress of 132 MPa is observed immediately near the surface for specimen 7. Nevertheless, the other specimens show compressive stresses of approximately 50 MPa for the same measurement point.
The values of maximum and minimum principal stresses are very close to each other. Despite the deviations in the RS direction graph (Figure 6d), the majority of the values are between −30° and −60°. On the lateral surface of as-built and SA heat-treated specimens, directions ranging from −30° to −60° were also observed.
A comparison among all the conditions (as-built, SA and SA plus DA) is shown in Figure 7a for the top surface and in Figure 7b for the lateral surface. Figure 7 represents the average values from the three specimens of each condition. The decrease in the RS after performing the first heat treatment is clearly observed. Comparing the SA and SA plus DA conditions, immediately near the surface, the SA condition results show higher compressive stresses. At middle depths, the RS of SA condition specimens are slightly higher than the RS of the SA plus DA condition. A common observation is the augmentation of the error bars at near the final depth of 1 mm.

4. Discussion

4.1. As-Build Condition

A marked increasing trend of the RS magnitude was observed from the surface to a depth of 0.1 mm, for both top and lateral surfaces. This behavior can be attributed to the expansion of the molten material constrained by the surrounding colder material during heating and material shrinkage during the cooling, resulting in plastic deformations that will remain as RS on the material [6,29]. Moreover, by adding new layers, the deposited material experiences several thermal cycles that will affect the microstructure. On the boundary of the surfaces and on the deposition of the last layers, the material displacement is not restricted in the same level as the material in the core; therefore, less RS are accumulated immediately near the surface.
The yield strength determined by Deng et al. [12] and Zhang et al. [27] for specimens in as-built condition was of 790 and 849 MPa, respectively. These values will be used as reference; however, mechanical properties can vary greatly with the selected PBF-LB process parameters. Regarding the top surfaces, the RS are approximately half the yield strength, 400 MPa, and on the lateral surfaces, the RS are on the same level as the yield strength, 600–900 MPa.
The ASTM E837 (2013) standard specifies that RS above 80% of the yield strength may be poorly measured by this method, and therefore the highest RS measured on the lateral surface could be inflated [56]. Additionally, the standard also refers that the reliability of the results decreases as deeper the measure is thus, depth may be the reason for the observed RS odd trends on all specimen conditions at greater depth.
The difference between the top and lateral RS magnitudes and the causes have been already reported [29] and described in the introduction section, regarding the bending effect originated during the building process. The maximum RS on the lateral surface (Figure 4c) are almost the double of the top surface RS (Figure 4a).
However, RS anisotropy was observed on the lateral surface, with minimum stresses in the range of 200 to 300 MPa, lower than the maximum stresses by three times. From the direction results (Figure 4d) of −30° to −60° and the rosette position on the lateral surface, it was determined that the maximum stresses are vertically aligned. Therefore, the minimum stresses are horizontally orientated on the lateral surface plane. By progressively adding a new layer, the vertical RS magnitude also increases progressively layer after layer thus, the RS accumulation induces a relief of the transversal RS (horizontal).
On the top surface, the RS are of similar magnitude in all directions owing to the rotation scanning strategy. The rotation strategy produces overlapped melt pools preventing the formation of patterns, this way, the RS are distributed uniformly. The overlapping of the melt pools can be confirmed by the microstructure image of Figure 8a, where the “fish-scale” presents varied sizes and shapes, and a transversal cut melt pool is shown (delimited by the red lines).

4.2. Heat-Treated Condition (SA and SA Plus DA)

The RS magnitude decreased markedly from the as-built to the SA heat-treated condition. The SA temperature of 1065 °C contributed significantly to the relief of RS. Moreover, it is expected that the Laves phases get largely dissolved after SA heat treatment [18,20,21], which are detrimental to the mechanical properties of the material. Partial recrystallisation has occurred, the grain growth can be observed on Figure 8a,b. Zhang et al. [27] reported that RS provide an impetus for grain growth; however, the temperature of the SA heat treatment is not high enough for the full recrystallisation.
Oscillations in the RS magnitude were noticed for diverse heat-treated specimens. Near the holes produced for the RS measurements, in SA condition, series of carbides along the grain boundaries with different sizes were found. Figure 9a,b shows series of carbides (inside the red circle) along the grain boundaries detected near the top and lateral surface holes, respectively. These carbides may be generated by the segregations within the grain boundaries; therefore, areas with higher segregation concentrations can be subjected to more significant carbides precipitations. This phenomenon could be the reason for the oscillations in terms of RS magnitude. Moreover, it may have contributed to the odd values at the final depth; notwithstanding, those odd values may have also been influenced by measurement errors, as it reaches almost 800 MPa (specimen 4). The carbides should have been dissolved in the SA heat treatment [18,20,21].
Carbides enriched in Nb, Mo, and Ti were detected, see Figure 10a,c. The composition of those carbides is shown in Figure 10b,d, respectively. In the SA plus DA heat-treated specimens, the same type of carbides was identified by particle composition analysis, as shown in Figure 11a (identified by the red arrows). Also, the needle-like δ phase was detected at the grain boundaries (Figure 11b, identified by the red arrow). The identification of δ phase in the heat-treated condition follows the conclusions of Cao et al. [21], which found δ phase after SA heat treatment at 1065 °C, on the contrary of the findings of Li et al. [13]. Moderate amounts of δ phase at the grain boundaries was found to be beneficial to the notch sensitivity of the material, whereas the high amounts of δ phase can be detrimental to the mechanical properties, decreasing the strength and plasticity of the material [19].
A common observation in the SA and SA plus DA heat-treated specimens was the compressive stresses immediately near the surface, which contradicts the typical tensile stresses near the surface of specimens produced by PBF-LB [6,29,30]. For the same depth of measurement, specimens in the as-built condition present tensile stresses; therefore, this change of RS magnitude can be as a consequence of the heat treatment.

5. Conclusions

The RS magnitude and direction, before and after a SA plus DA standard heat treatment, were determined and analyzed in IN718 specimens produced by PBF-LB. The hole-drilling strain-gage method was used to measure the strains and determine the RS. Posteriorly, the microstructure was analyzed by SEM near the measurement areas. The main conclusions are summarized below.
(1) A marked increasing trend of the RS was observed immediately near the surface of as-built specimens, as the material displacement on the specimen boundaries is not restricted in the same level as the material in the core.
(2) In the as-built condition, the RS were approximately half of the yield strength on the top surface and near the yield strength on the lateral surface vertically oriented (the yield strength was retrieved from other works).
(3) RS anisotropy was noticed on the lateral surface in the as-built condition, with tensile stresses of 600–900 MPa vertically oriented and of 200–300 MPa horizontally oriented, three times lower. This anisotropy behavior is attributed to the bending effect induced during the building process.
(4) The RS decreased significantly from the as-built to the SA heat-treated condition, mainly owing to the high temperature of the heat treatment (1065 °C).
(5) Oscillations in RS magnitude were verified in heat-treated specimens, which were attributed to the high concentration of carbides along the grain boundaries. These carbides, rich in Nb, Mo, and Ti, generated due to the presence of segregations observed by the microstructure analysis near the produced holes.
(6) Needle-like δ phase was identified at the grain boundaries of SA plus DA heat-treated specimens.
(7) In both heat-treated conditions, compressive stresses immediately near the surface were measured, contradicting the typical RS characteristics of specimens produced by PBF-LB. This behavior is related to the heat treatment, since for the specimens in as-built condition at the same depth the RS were tensile stresses.
The experimental work presented here made it possible to better understand the near surface RS evolution in IN718 parts fabricated by LPBF after performing a standardized SA plus DA heat treatment. Moreover, it provided understanding of the expected microstructure and its evolution from the as-built to the SA plus DA heat-treated condition using the specified parameters, which can aid in the validation of future computational models. Possible future works could involve additional experiments using different process parameters and/or conditions; study of the RS evolution under other heat treatments, e.g., homogenization or hot isostatic pressing; and characterization of the carbides detected in the heat-treated conditions.

Author Contributions

Writing—original draft and investigation, R.B.; writing—review & editing, F.J.G.S., R.M.G., E.A., A.S. (Abdollah Saboori), G.M., and A.S. (Alessandro Salmi); supervision, E.A. and S.B.; methodology, E.A. and S.B.; validation, E.A., A.S. (Abdollah Saboori), and G.M.

Funding

The present research has been partially supported by resources provided by the Interdepartmental Centre for Integrated Additive Manufacturing IAM@PoliTo at the Politecnico di Torino, Torino, Italy and by MIUR (Ministero dell’Istruzione, dell’Università e della Ricerca, i.e. Ministry of Education, University and Research) grant Dipartimento di Eccellenza 2018-2022.

Conflicts of Interest

The authors declare no conflicts of interest.

References

  1. Gibson, I.; Rosen, D.W.; Stucker, B. Additive Manufacturing Technologies—Rapid Prototyping to Direct Digital Manufacturing; Springer: New York, NY, USA, 2010; ISBN 978-1-4419-1119-3. [Google Scholar]
  2. Tofail, S.A.M.; Koumoulos, E.P.; Bandyopadhyay, A.; Bose, S.; O’Donoghue, L.; Charitidis, C. Additive manufacturing: Scientific and technological challenges, market uptake and opportunities. Mater. Today 2018, 21, 22–37. [Google Scholar] [CrossRef]
  3. Zuback, J.S.; DebRoy, T. The hardness of additively manufactured alloys. Materials 2018, 11, 2070. [Google Scholar] [CrossRef] [PubMed]
  4. Schmidt, M.; Merklein, M.; Bourell, D.; Dimitrov, D.; Hausotte, T.; Wegener, K.; Overmeyer, L.; Vollertsen, F.; Levy, G.N. Laser based additive manufacturing in industry and academia. CIRP Ann. Manuf. Technol. 2017, 66, 561–583. [Google Scholar] [CrossRef]
  5. Bandyopadhyay, A.; Traxel, K.D. Invited review article: Metal-additive manufacturing-modeling strategies for application-optimized designs. Addit. Manuf. 2018, 22, 758–774. [Google Scholar] [CrossRef]
  6. DebRoy, T.; Wei, H.L.; Zuback, J.S.; Mukherjee, T.; Elmer, J.W.; Milewski, J.O.; Beese, A.M.; Wilson-Heid, A.; De, A.; Zhang, W. Additive manufacturing of metallic components—Process, structure and properties. Prog. Mater. Sci. 2018, 92, 112–224. [Google Scholar] [CrossRef]
  7. Ngo, T.D.; Kashani, A.; Imbalzano, G.; Nguyen, K.T.Q.; Hui, D. Additive manufacturing (3D printing): A review of materials, methods, applications and challenges. Compos. Part B 2018, 143, 172–196. [Google Scholar] [CrossRef]
  8. Gibson, I.; Khorasani, A.M. Metallic additive manufacturing: Design, process, and post-processing. Metals 2019, 9, 137. [Google Scholar] [CrossRef]
  9. Niaki, M.K.; Torabi, S.A.; Nonino, F. Why manufacturers adopt additive manufacturing technologies: The role of sustainability. J. Clean. Prod. 2019, 222, 381–392. [Google Scholar] [CrossRef]
  10. Salmi, A.; Calignano, F.; Galati, M.; Atzeni, E. An integrated design methodology for components produced by Laser Powder Bed Fusion (L-PBF) process. Virtual Phys. Prototyp. 2018, 13, 191–202. [Google Scholar] [CrossRef]
  11. Zhao, X.; Liu, J.; Shi, Y.; Wei, Q.; Han, C.; Song, B.; Li, S.; Wen, S. Differences in microstructure and properties between selective laser melting and traditional manufacturing for fabrication of metal parts: A review. Front. Mech. Eng. 2015, 10, 111–125. [Google Scholar]
  12. Deng, D.; Peng, R.L.; Brodin, H.; Moverare, J. Microstructure and mechanical properties of inconel 718 produced by selective laser melting: Sample orientation dependence and effects of post heat treatments. Mater. Sci. Eng. A 2018, 713, 294–306. [Google Scholar] [CrossRef]
  13. Li, N.; Huang, S.; Zhang, G.; Qin, R.; Liu, W.; Xiong, H.; Shi, G.; Blackburn, J. Progress in additive manufacturing on new materials: A review. J. Mater. Sci. Technol. 2019, 35, 242–269. [Google Scholar] [CrossRef]
  14. Herzog, D.; Seyda, V.; Wycisk, E.; Emmelmann, C. Additive manufacturing of metals. Acta Mater. 2016, 117, 371–392. [Google Scholar] [CrossRef]
  15. Bourell, D.; Kruth, J.P.; Leu, M.; Levy, G.; Rosen, D.; Beese, A.M.; Clare, A. Materials for additive manufacturing. CIRP Ann. Manuf. Technol. 2017, 66, 659–681. [Google Scholar] [CrossRef]
  16. Solberg, K.; Berto, F. Notch-defect interaction in additively manufactured inconel 718. Int. J. Fatigue 2019, 122, 35–45. [Google Scholar] [CrossRef]
  17. Yu, H.; Hayashi, S.; Kakehi, K.; Kuo, Y.-L. Study of formed oxides in IN718 alloy during the fabrication by selective laser melting and electron beam melting. Metals 2018, 9, 19. [Google Scholar] [CrossRef]
  18. Tucho, W.M.; Cuvillier, P.; Sjolyst-Kverneland, A.; Hansen, V. Microstructure and hardness studies of inconel 718 manufactured by selective laser melting before and after solution heat treatment. Mater. Sci. Eng. A 2017, 689, 220–232. [Google Scholar] [CrossRef]
  19. Zhang, D.; Feng, Z.; Wang, C.; Wang, W.; Liu, Z.; Niu, W. Comparison of microstructures and mechanical properties of inconel 718 alloy processed by selective laser melting and casting. Mater. Sci. Eng. A 2018, 724, 357–367. [Google Scholar] [CrossRef]
  20. Wang, X.; Gong, X.; Chou, K. Review on powder-bed laser additive manufacturing of inconel 718 parts. J. Eng. Manuf. 2017, 231, 1890–1903. [Google Scholar] [CrossRef]
  21. Cao, G.H.; Sun, T.Y.; Wang, C.H.; Li, X.; Liu, M.; Zhang, Z.X.; Hu, P.F.; Russell, A.M. Investigations of γ′, γ′′and δ precipitates in heat-treated inconel 718 alloy fabricated by selective laser melting. Mater. Charact. 2018, 136, 398–406. [Google Scholar] [CrossRef]
  22. Zhou, L.; Mehta, A.; Mcwilliams, B.; Cho, K.; Sohn, Y. Microstructure, precipitates and mechanical properties of powder bed fused inconel 718 before and after heat treatment. J. Mater. Sci. Technol. 2019, 35, 1153–1164. [Google Scholar] [CrossRef]
  23. Li, X.; Shi, J.J.; Wang, C.H.; Cao, G.H.; Russell, A.M.; Zhou, Z.J.; Li, C.P.; Chen, G.F. Effect of heat treatment on microstructure evolution of inconel 718 alloy fabricated by selective laser melting. J. Alloy. Compd. 2018, 764, 639–649. [Google Scholar] [CrossRef]
  24. Tao, P.; Li, H.; Huang, B.; Hu, Q.; Gong, S.; Xu, Q. The crystal growth, intercellular spacing and microsegregation of selective laser melted inconel 718 superalloy. Vacuum 2019, 159, 382–390. [Google Scholar] [CrossRef]
  25. Calandri, M.; Yin, S.; Aldwell, B.; Calignano, F.; Lupoi, R.; Ugues, D. Texture and microstructural features at different length scales in inconel 718 produced by selective laser melting. Materials 2019, 12, 1293. [Google Scholar] [CrossRef] [PubMed]
  26. Yadroitsev, I.; Yadroitsava, I. Evaluation of residual stress in stainless steel 316L and Ti6Al4V samples produced by selective laser melting. Virtual Phys. Prototyp. 2015, 10, 67–76. [Google Scholar] [CrossRef]
  27. Zhang, D.; Niu, W.; Cao, X.; Liu, Z. Effect of standard heat treatment on the microstructure and mechanical properties of selective laser melting manufactured inconel 718 superalloy. Mater. Sci. Eng. A 2015, 644, 32–40. [Google Scholar] [CrossRef]
  28. Calandri, M.; Manfredi, D.; Calignano, F.; Ambrosio, E.P.; Biamino, S.; Lupoi, R.; Ugues, D. Solution treatment study of inconel 718 produced by SLM additive technique in view of the oxidation resistance. Adv. Eng. Mater. 2018, 20, 1800351. [Google Scholar] [CrossRef]
  29. Vrancken, B. Study of Residual Stresses in Selective Laser Melting. Ph.D. Thesis, Faculty of Engineering Science, Arenberg Doctoral School, Leuven, Belgium, 2016. [Google Scholar]
  30. Bartlett, J.L.; Li, X. An overview of residual stresses in metal powder bed fusion. Addit. Manuf. 2019, 27, 131–149. [Google Scholar] [CrossRef]
  31. Kruth, J.P.; Deckers, J.; Yasa, E.; Wauthlé, R. Assessing and comparing influencing factors of residual stresses in selective laser melting using a novel analysis method. Proc. Inst. Mech. Eng. Part B J. Eng. Manuf. 2012, 226, 980–991. [Google Scholar] [CrossRef]
  32. Ali, H.; Ghadbeigi, H.; Mumtaz, K. Effect of scanning strategies on residual stress and mechanical properties of selective laser melted Ti6Al4V. Mater. Sci. Eng. A 2018, 712, 175–187. [Google Scholar] [CrossRef]
  33. Cottam, R.; Wang, J. Characterization of microstructure and residual stress in a 3D H13 tool steel component produced by additive manufacturing. Mater. Res. Soc. 2014, 29, 1978–1986. [Google Scholar] [CrossRef]
  34. Ghosh, S.; Choi, J. Deposition pattern based thermal stresses in single-layer laser aided direct material deposition process. J. Manuf. Sci. Eng. 2007, 129, 319–332. [Google Scholar] [CrossRef]
  35. Yi, J.H.; Kang, J.W.; Wang, T.J.; Wang, X.; Hu, Y.Y.; Feng, T.; Feng, Y.L.; Wu, P.Y.; Kang, J.W.; Wang, T.J.; et al. Effect of laser energy density on the microstructure, mechanical properties, and deformation of inconel 718 samples fabricated by selective laser melting. J. Alloy. Compd. 2019, 786, 481–488. [Google Scholar] [CrossRef]
  36. Ahmad, B.; van der Veen, S.O.; Fitzpatrick, M.E.; Guo, H. Residual stress evaluation in selective-laser-melting additively manufactured titanium (Ti-6Al-4V) and inconel 718 using the contour method and numerical simulation. Addit. Manuf. 2018, 22, 571–582. [Google Scholar] [CrossRef]
  37. Nadammal, N.; Cabeza, S.; Mishurova, T.; Thiede, T.; Kromm, A.; Seyfert, C.; Farahbod, L.; Haberland, C.; Ann, J.; Dolabella, P.; et al. Effect of hatch length on the development of microstructure, texture and residual stresses in selective laser melted superalloy inconel 718. Mater. Des. 2017, 134, 139–150. [Google Scholar] [CrossRef]
  38. Lu, Y.; Wu, S.; Gan, Y.; Huang, T.; Yang, C.; Junjie, L.; Lin, J. Study on the microstructure, mechanical property and residual stress of SLM inconel-718 alloy manufactured by differing island scanning strategy. Opt. Laser Technol. 2015, 75, 197–206. [Google Scholar] [CrossRef]
  39. Salmi, A.; Atzeni, E. History of residual stresses during the production phases of AlSi10Mg parts processed by powder bed additive manufacturing technology. Virtual Phys. Prototyp. 2017, 12, 153–160. [Google Scholar] [CrossRef]
  40. Salmi, A.; Atzeni, E. Residual stress analysis of thin AlSi10Mg parts produced by laser powder bed fusion. Virtual Phys. Prototyp. 2019, 1–13. [Google Scholar] [CrossRef]
  41. Salmi, A.; Atzeni, E.; Iuliano, L.; Galati, M. Experimental analysis of residual stresses on AlSi10Mg parts produced by means of Selective Laser Melting (SLM). Procedia CIRP 2017, 62, 458–463. [Google Scholar] [CrossRef]
  42. Casavola, C.; Campanelli, S.L.; Pappalettere, C. Preliminary investigation on distribution of residual stress generated by the selective laser melting process. J. Strain Anal. Eng. Des. 2009, 44, 93–104. [Google Scholar] [CrossRef]
  43. Wang, Z.; Denlinger, E.; Michaleris, P.; Stoica, A.D.; Ma, D.; Beese, A.M. Residual stress mapping in inconel 625 fabricated through additive manufacturing: Method for neutron diffraction measurements to validate thermomechanical model predictions. Mater. Des. 2017, 113, 169–177. [Google Scholar] [CrossRef] [Green Version]
  44. Zhang, W.; Tong, M.; Harrison, N.M. Resolution, energy and time dependency on layer scaling in finite element modelling of laser beam powder bed fusion additive manufacturing. Addit. Manuf. 2019, 28, 610–620. [Google Scholar] [CrossRef]
  45. Cao, J.; Gharghouri, M.A.; Nash, P. Finite-element analysis and experimental validation of thermal residual stress and distortion in electron beam additive manufactured Ti-6Al-4V build plates. J. Mater. Process. Technol. 2016, 237, 409–419. [Google Scholar] [CrossRef]
  46. Matsumoto, M.; Shiomi, M.; Osakada, K.; Abe, F. Finite element analysis of single layer forming on metallic powder bed in rapid prototyping by selective laser processing. Int. J. Mach. Tools Manuf. 2002, 42, 61–67. [Google Scholar] [CrossRef]
  47. Hussein, A.; Hao, L.; Yan, C.; Everson, R. Finite element simulation of the temperature and stress fields in single layers built without-support in selective laser melting. Mater. Des. 2013, 52, 638–647. [Google Scholar] [CrossRef]
  48. Fergani, O.; Berto, F.; Welo, T.; Liang, S.Y. Analytical modelling of residual stress in additive manufacturing. Fatigue Fract. Eng. Mater. Struct. 2017, 40, 971–978. [Google Scholar] [CrossRef]
  49. Andreotta, R.; Ladani, L.; Brindley, W. Finite element simulation of laser additive melting and solidification of inconel 718 with experimentally tested thermal properties. Finite Elem. Anal. Des. 2017, 135, 36–43. [Google Scholar] [CrossRef]
  50. Ning, J.; Sievers, D.E.; Garmestani, H.; Liang, S.Y. Analytical modeling of in-process temperature in powder bed additive manufacturing considering laser power absorption, latent-heat, scanning strategy, and powder packing. Materials 2019, 12, 808. [Google Scholar] [CrossRef] [Green Version]
  51. Paul, R.; Anand, S.; Gerner, F. Effect of thermal deformation on part errors in metal powder based additive manufacturing processes. J. Manuf. Sci. Eng. Trans. ASME 2014, 136, 031009. [Google Scholar] [CrossRef]
  52. Denlinger, E.R.; Jagdale, V.; Srinivasan, G.V.; El-Wardany, T.; Michaleris, P. Thermal modeling of inconel 718 processed with powder bed fusion and experimental validation using in situ measurements. Addit. Manuf. 2016, 11, 7–15. [Google Scholar] [CrossRef]
  53. Yang, Y.; Knol, M.F.; van Keulen, F.; Ayas, C. A semi-analytical thermal modelling approach for selective laser melting. Addit. Manuf. 2018, 21, 284–297. [Google Scholar] [CrossRef] [Green Version]
  54. EOS NickelAlloy IN718 (Datasheet). Available online: https://www.eos.info/eos-nickelalloy-in718-nickel-alloy-for-aerospace-and-industry-d64f5c43276f3673 (accessed on 20 November 2019).
  55. Special Metals INCONEL® Alloy 718 (Datasheet). Available online: https://www.specialmetals.com/assets/smc/documents/inconel_alloy_718.pdf (accessed on 20 November 2019).
  56. ASTM International. Standard test method for determining residual stresses by the hole-drilling strain-gage method (E837-13a). ASTM Int. 2013, 03.01. [Google Scholar] [CrossRef]
Figure 1. Illustration of the scan strategy adopted: 67° rotation and “striping” (rough example).
Metals 09 01290 g001
Figure 2. Time–temperature profile of the solution annealing plus double ageing heat treatments.
Metals 09 01290 g002
Figure 3. Specimen configurations: (a) disposition on the substrate and respective assignment: 1–3 for as-built, 4–6 for SA heat-treatment, and 7–9 for SA plus DA heat-treatments; (b) illustration of the top and lateral positioning of the rosettes at 4.5 mm from the border (all dimensions in mm).
Metals 09 01290 g003
Figure 4. RS results (depth profiles) for as-built condition: (a) magnitude on the top surface; (b) direction on the top surface; (c) magnitude on the lateral surface; (d) direction on the lateral surface.
Metals 09 01290 g004
Figure 5. RS results (depth profiles) for SA heat-treated condition: (a) magnitude on the top surface; (b) direction on the top surface; (c) magnitude on the lateral surface; (d) direction on the lateral surface.
Metals 09 01290 g005
Figure 6. RS results (depth profiles) for SA plus DA condition: (a) magnitude on the top surface; (b) direction on the top surface; (c) magnitude on the lateral surface; (d) direction on the lateral surface.
Metals 09 01290 g006
Figure 7. RS magnitude comparison among all the three conditions: as-built (AB on the graphs), SA and SA plus DA, (a) top surface, and (b) lateral surface.
Metals 09 01290 g007
Figure 8. Microstructure analysis: (a) “fish-scale” and grain distribution in as-built condition (specimen 3); (b) grain distribution in SA heat-treated condition (specimen 4).
Metals 09 01290 g008
Figure 9. Microstructure analysis of SA heat-treated condition (specimen 4): (a) series of intergranular carbides near the top surface hole; (b) series of carbides near the lateral hole (the black area on the bottom of the image is part of the hole from the measurements).
Metals 09 01290 g009
Figure 10. SA heat-treated condition (specimen 4) particle composition analysis: (a,c) carbides enriched in Nb, Mo, and Ti; (b,d) chemical composition of the respective carbides.
Metals 09 01290 g010
Figure 11. SA plus DA heat-treated condition (specimen 8) microstructure analysis: (a) carbides enriched in Nb, Mo, and Ti; (b) δ phase at the grain boundaries.
Metals 09 01290 g011

