Article

Image Processing-Based Analysis of Temperature Dependent Interlayer in Brazed Fe-Cr-Al Alloy (Fecralloy®) with Ni-Based Filler Metal

1
Department of Thermal Systems, Korea Institute of Machinery and Materials (KIMM), 156 Gajeongbuk-ro, Daejeon 34103, Korea
2
Plant System and Machinery, University of Science and Technology, 217 Gajeong-ro, Daejeon 34113, Korea
*
Author to whom correspondence should be addressed.
Metals 2019, 9(11), 1139; https://doi.org/10.3390/met9111139
Submission received: 10 September 2019 / Revised: 17 October 2019 / Accepted: 23 October 2019 / Published: 24 October 2019

Abstract

:
This paper presents the result of the brazed Iron-chromium-aluminum alloy (Fecralloy) with nickel filler metal (MBF20). The heat plates with the machined 2 mm diameter channels were brazed using 60 μm thick MBF20. In the experiment, the brazing bonding was performed at three different temperatures, and the SEM-EDS images of the cross sections were acquired to analyze. By performing image processing, the change of the filler metal thickness was estimated, and the thickness increased from 53.8 μm, 64.1 μm, and 115.8 μm at 900 °C, 950 °C and 1000 °C, respectively. In addition, the image-processed distributions of CrxBy and NixAly phases with the change of bonding temperatures were quantified. The image processing methods in this work are proposed to be used for quantitative analysis.

1. Introduction

Microreactors contribute to intensifying the chemical process with their advanced heat and mass transfer properties [1]. Microreactors are able to offer solutions to raise the efficiency for heat and mass transfer in confined space since they provide a large surface area per unit volume. With the advantages, microreactors have attracted attention as reactors with various reactions related to hydrogen production or synthesis gas production, e.g., steam reforming [2,3,4,5], oxidative steam reforming [3,6,7], partial oxidation [7,8,9], and water gas shift [10]. For designing reactors, Fe-Cr-Al alloy (Fecralloy) is often introduced as the substrate material for the high temperature microreactors as it has advantages in its application to a high temperature catalytic reactor [7,9,11,12]. In particular, the alumina layer formed on the calcinated Fecralloy surface provides stronger binding sites to the catalysts, and thereby providing the more stable catalyst surface [13]. Therefore, Fecralloy is one of attractive metal alloys for designing and fabricating micro channeled reactors.
To make microchannel reactor cores, brazing bonding is one of applicable ways to bond micro channeled heat plates. There are several advantages on brazing bonding in that it is possible to control tight tolerance and provide clean joint. In addition, by using brazing bonding, the bonding between metal and non-metal, less thermal distortion, and cost-effective complex bonding are possible [14]. There have been various research on brazing bonding for metal and metal [15,16,17,18,19]. Metal and non-metal brazing was also performed that Al2O3 and 304 stainless steel brazed using 97(Ag28Cu)3Ti filler [20,21], Fecralloy/copper foil/silicon nitride brazing bonding [22], and boron nitride with steel bonding [23] were performed. As such, there have been many studies on brazed bonding, but there have been no studies on the brazing of Fecralloy using MBF20. For manufacturing Fecralloy reactor cores, only electron beam welding was introduced [7,9,12]; however, the welding method is limited to preventing the fluid from flowing across the microchannels, which can reduce the overall heat and mass transfer efficiency. Therefore, applying to brazing bonding is one of adjustable bonding method to make Fecralloy reactors.
To evaluate the bonding quality for brazing bonding, there were studies [15,16,18,19,20,21,22] that analyzed the materials of the bonding cross section by varying bonding temperatures and the rates of temperature rise, which are important factors determining bonding quality. Most of those studies showed the results of the relationship between the changing factors (e.g., bonding temperature, the rate of temperature rise, or bonding duration time) and tensile strength at the junctions. In addition, in order to investigate the distribution of constituents at the inter layer of bonding cross sections depending on variation conditions, X-ray diffraction (XRD), scanning electron microscopy with energy dispersive spectroscopy (SEM-EDS), electron probe micro-analyzer (EPMA), or transmission electron microscopy (TEM) were used. The acquired images showed the intensities of the constituent of materials across the bonding layers, and they were used to investigate bonding qualities. However, the research to quantify the penetration depth of materials in the bonding process by analyzing the change of the border line of filler metal and the distribution of newly formed phase distribution has been rare even though they are important factors to determine the bonding characteristic and quality [19,24]. In addition, there have been few attempts to analyze the CrxBy and NixAly phases that determine the bonding quality by quantifying the distribution of materials using image processing of SEM-EDS images.
In this paper, we performed the SEM-EDS material analysis on the cross section by performing brazing of channeled Fecralloy heat plates at three different temperatures, 900 °C, 950 °C, and 1000 °C. In the SEM-EDS images, the change of filler metal thickness, and CrxBy, and NixAly phase distribution according to bonding temperatures were analyzed and quantified through image processing. This work would be used to analyze the bonding quality of Fecralloy brazing bonding with following future studies.

2. Experimental Procedure

The material of the plates was Fecralloy (72.3 Fe, 22.0 Cr, 5.0 Al, 0.3 Al, 0.2 Mn, 0.2 C, 0.1 Y, 0.1 Zn wt. %) supplied by Goodfellow Ltd., Huntingdon, UK. The Fecralloy plates with channels were prepared as Figure 1. The size of the plate was 49 mm × 24 mm × 2 mm thick, and the channels with a width of 2 mm, depth of 1 mm, and 49 mm length, which is half the cross section, was milled. The MBF20, used as a filler metal, was 60 μm thick and was cut to length and width equal to the Fecralloy used as the base metal. The compositions of both materials are as in Table 1.
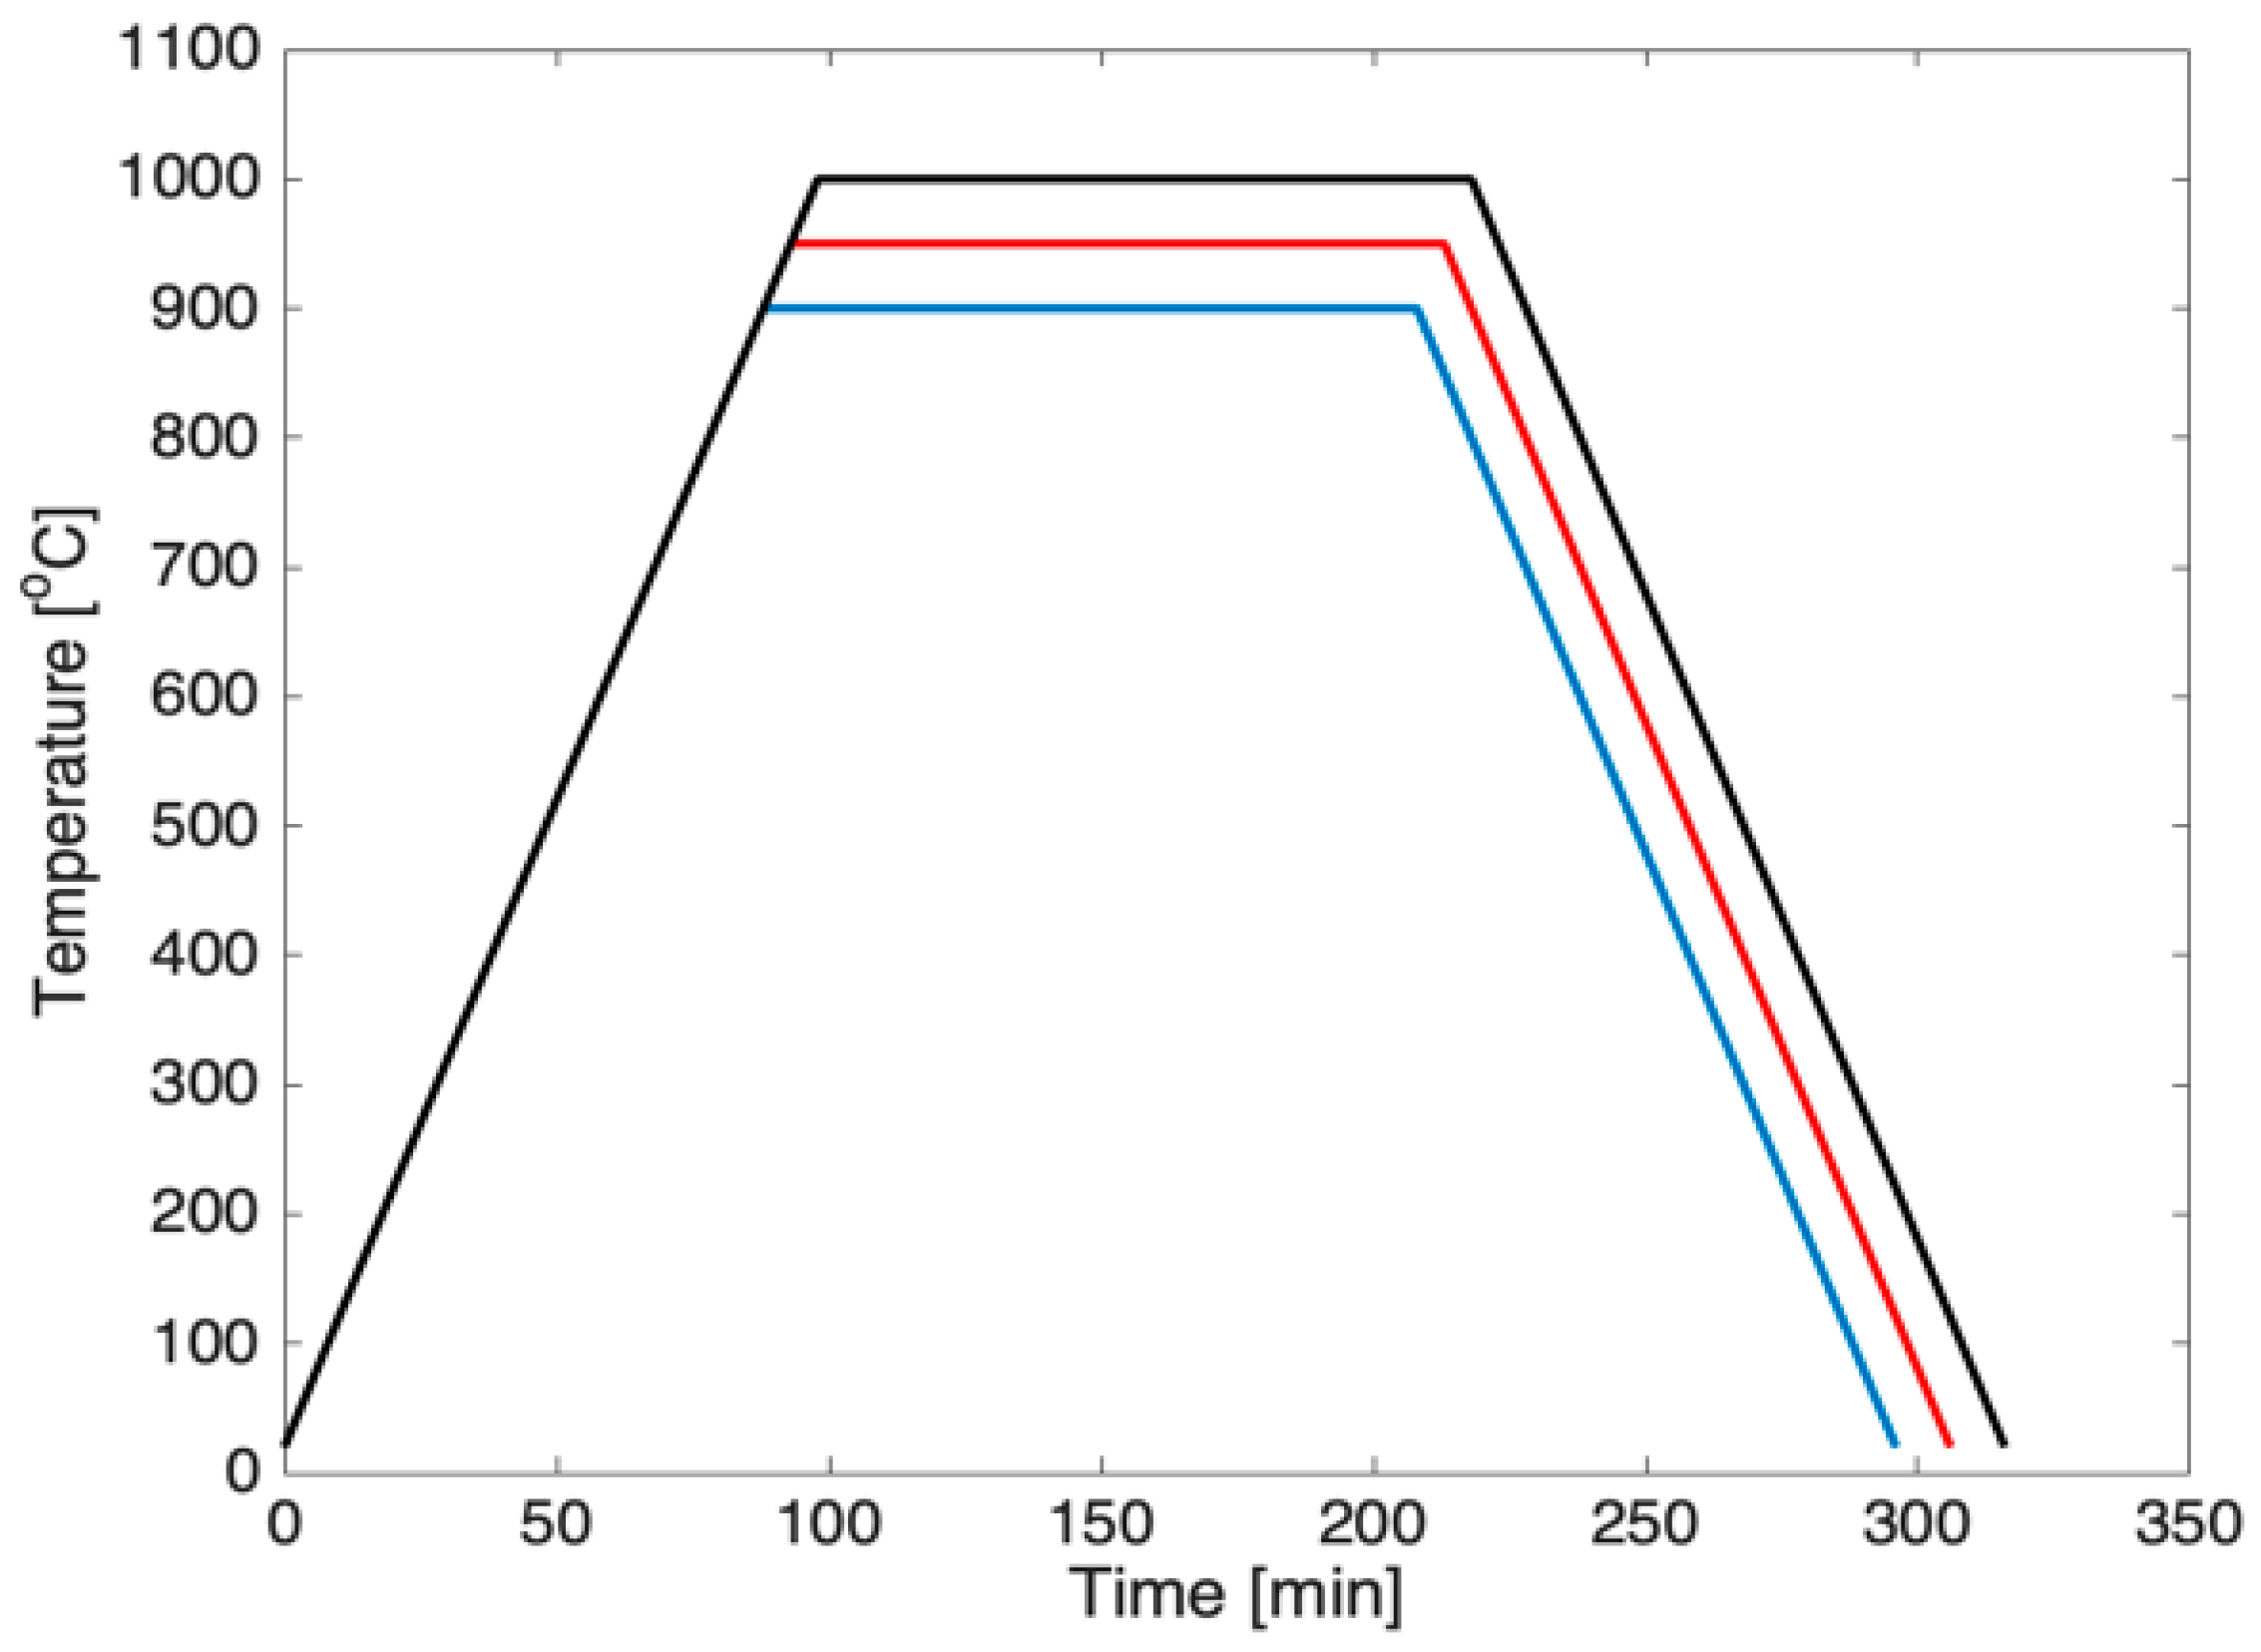
The specimens were cleaned with acetone and ethanol using ultrasonic cleaner for 30 min. Three Fecralloy channeled plates were stacked and two MBF20 sheets were inserted between the Fecralloy plates in a vacuum chamber. A fixed load ~ 2 kg was kept over the sample to keep aligned. The load made the plates and filler metal sheets contact between surfaces properly. The vacuum chamber was maintained, 1 × 10⁻⁵ Torr. or lower during the brazing. The furnace was heated at the rate of 10 °C/min. until to reach Max. temperatures, i) 900 °C, ii) 950 °C, and iii) 1000 °C. After reaching the temperatures, it was maintained for 2 h at those temperatures, then cooled down at the rate of about 10 °C/min. The thermal process was as shown in Figure 2.
The brazed specimens were cut with wire cutting, and the cut sections were processed with 2000 silk sands for microscope and SEM-EDS. SEM images of the junctions around the channels were taken and images were compared with the SEM-EDS mapping images. In particular, mapping of the distribution of constituents of iron, chromium and aluminum, and nickel and boron which are main components of Fecralloy and MBF20, respectively, was performed. The image processing was developed to figure out the thickness of the interlayer between Fecralloy and MBF20 using MATLAB.

3. Image Processing Analysis

To understand the distribution of the components of materials from Fecralloy and MBF20, image processing method was developed. The images from SEM-EDS were for Al, B, C, Cr, Si, Fe, Ni and Cu, and out of the components, we focused on the components, Cr, B, Ni, Al, and Fe. In addition, image processing was performed by two methods, a method of measuring the thickness of the filler metal, and a superimposing method to confirm that the chromium and boron, and aluminum and nickel form, CrxBy and AlxNiy, respectively.
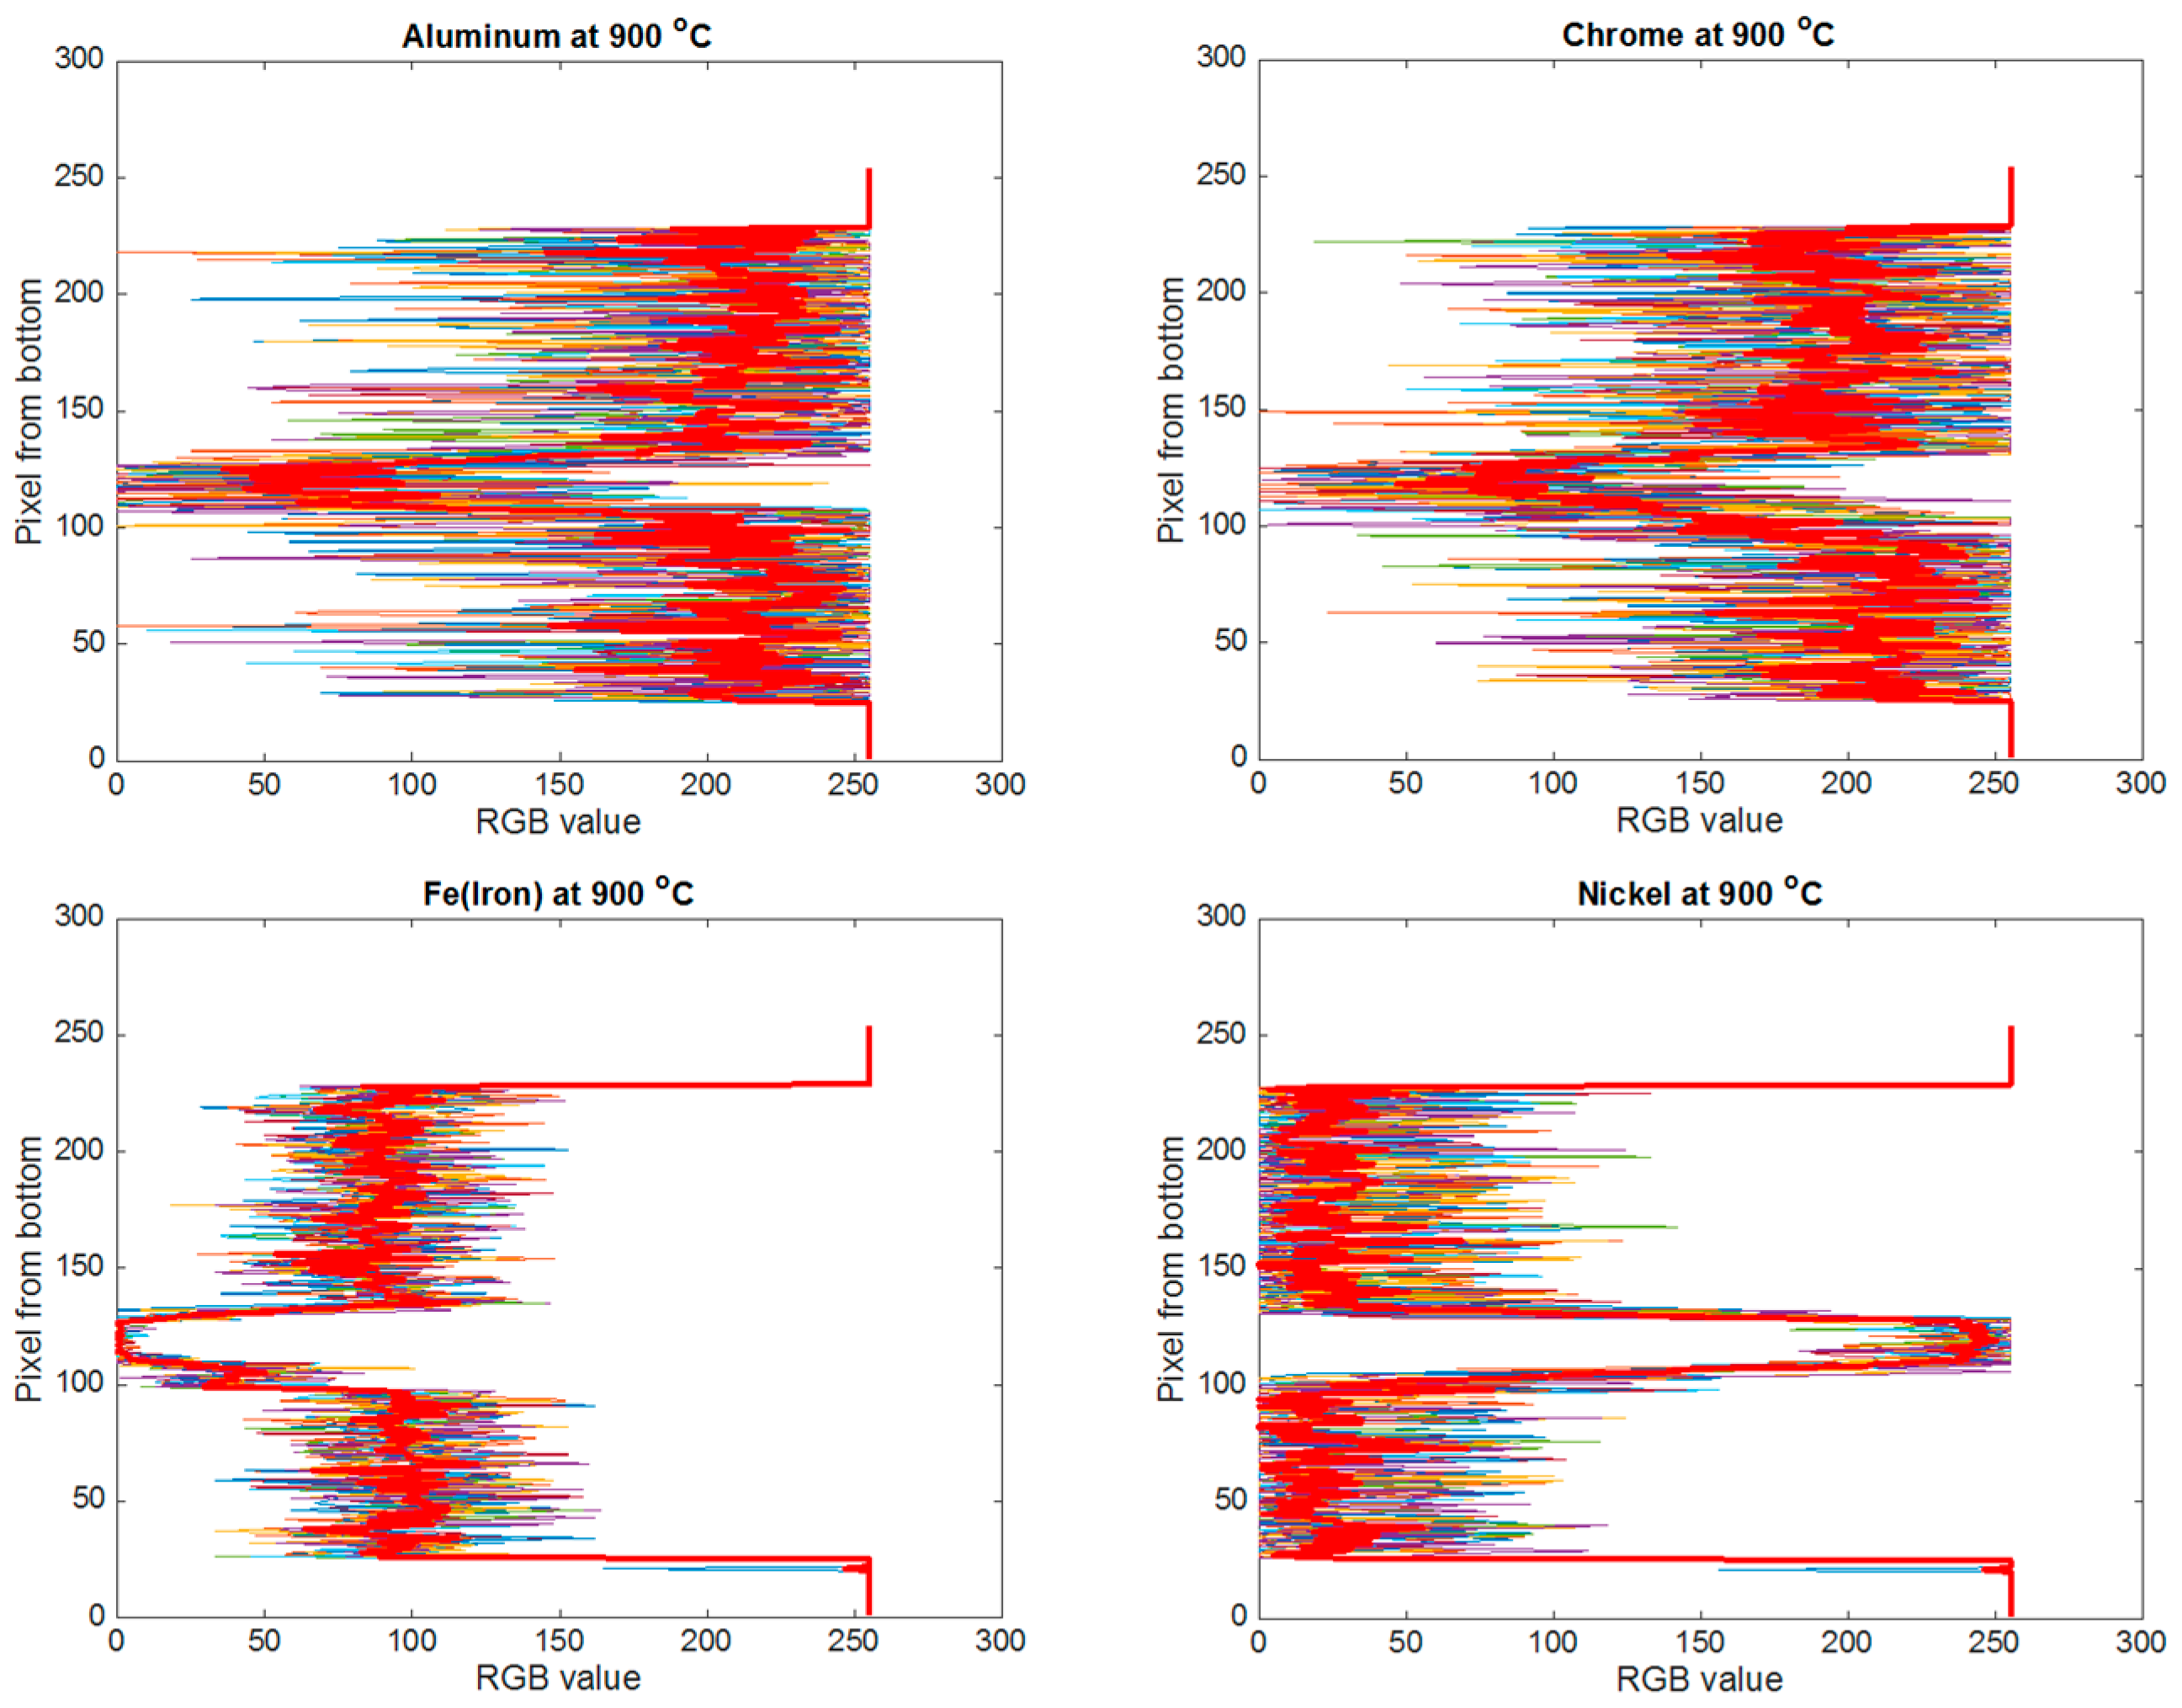
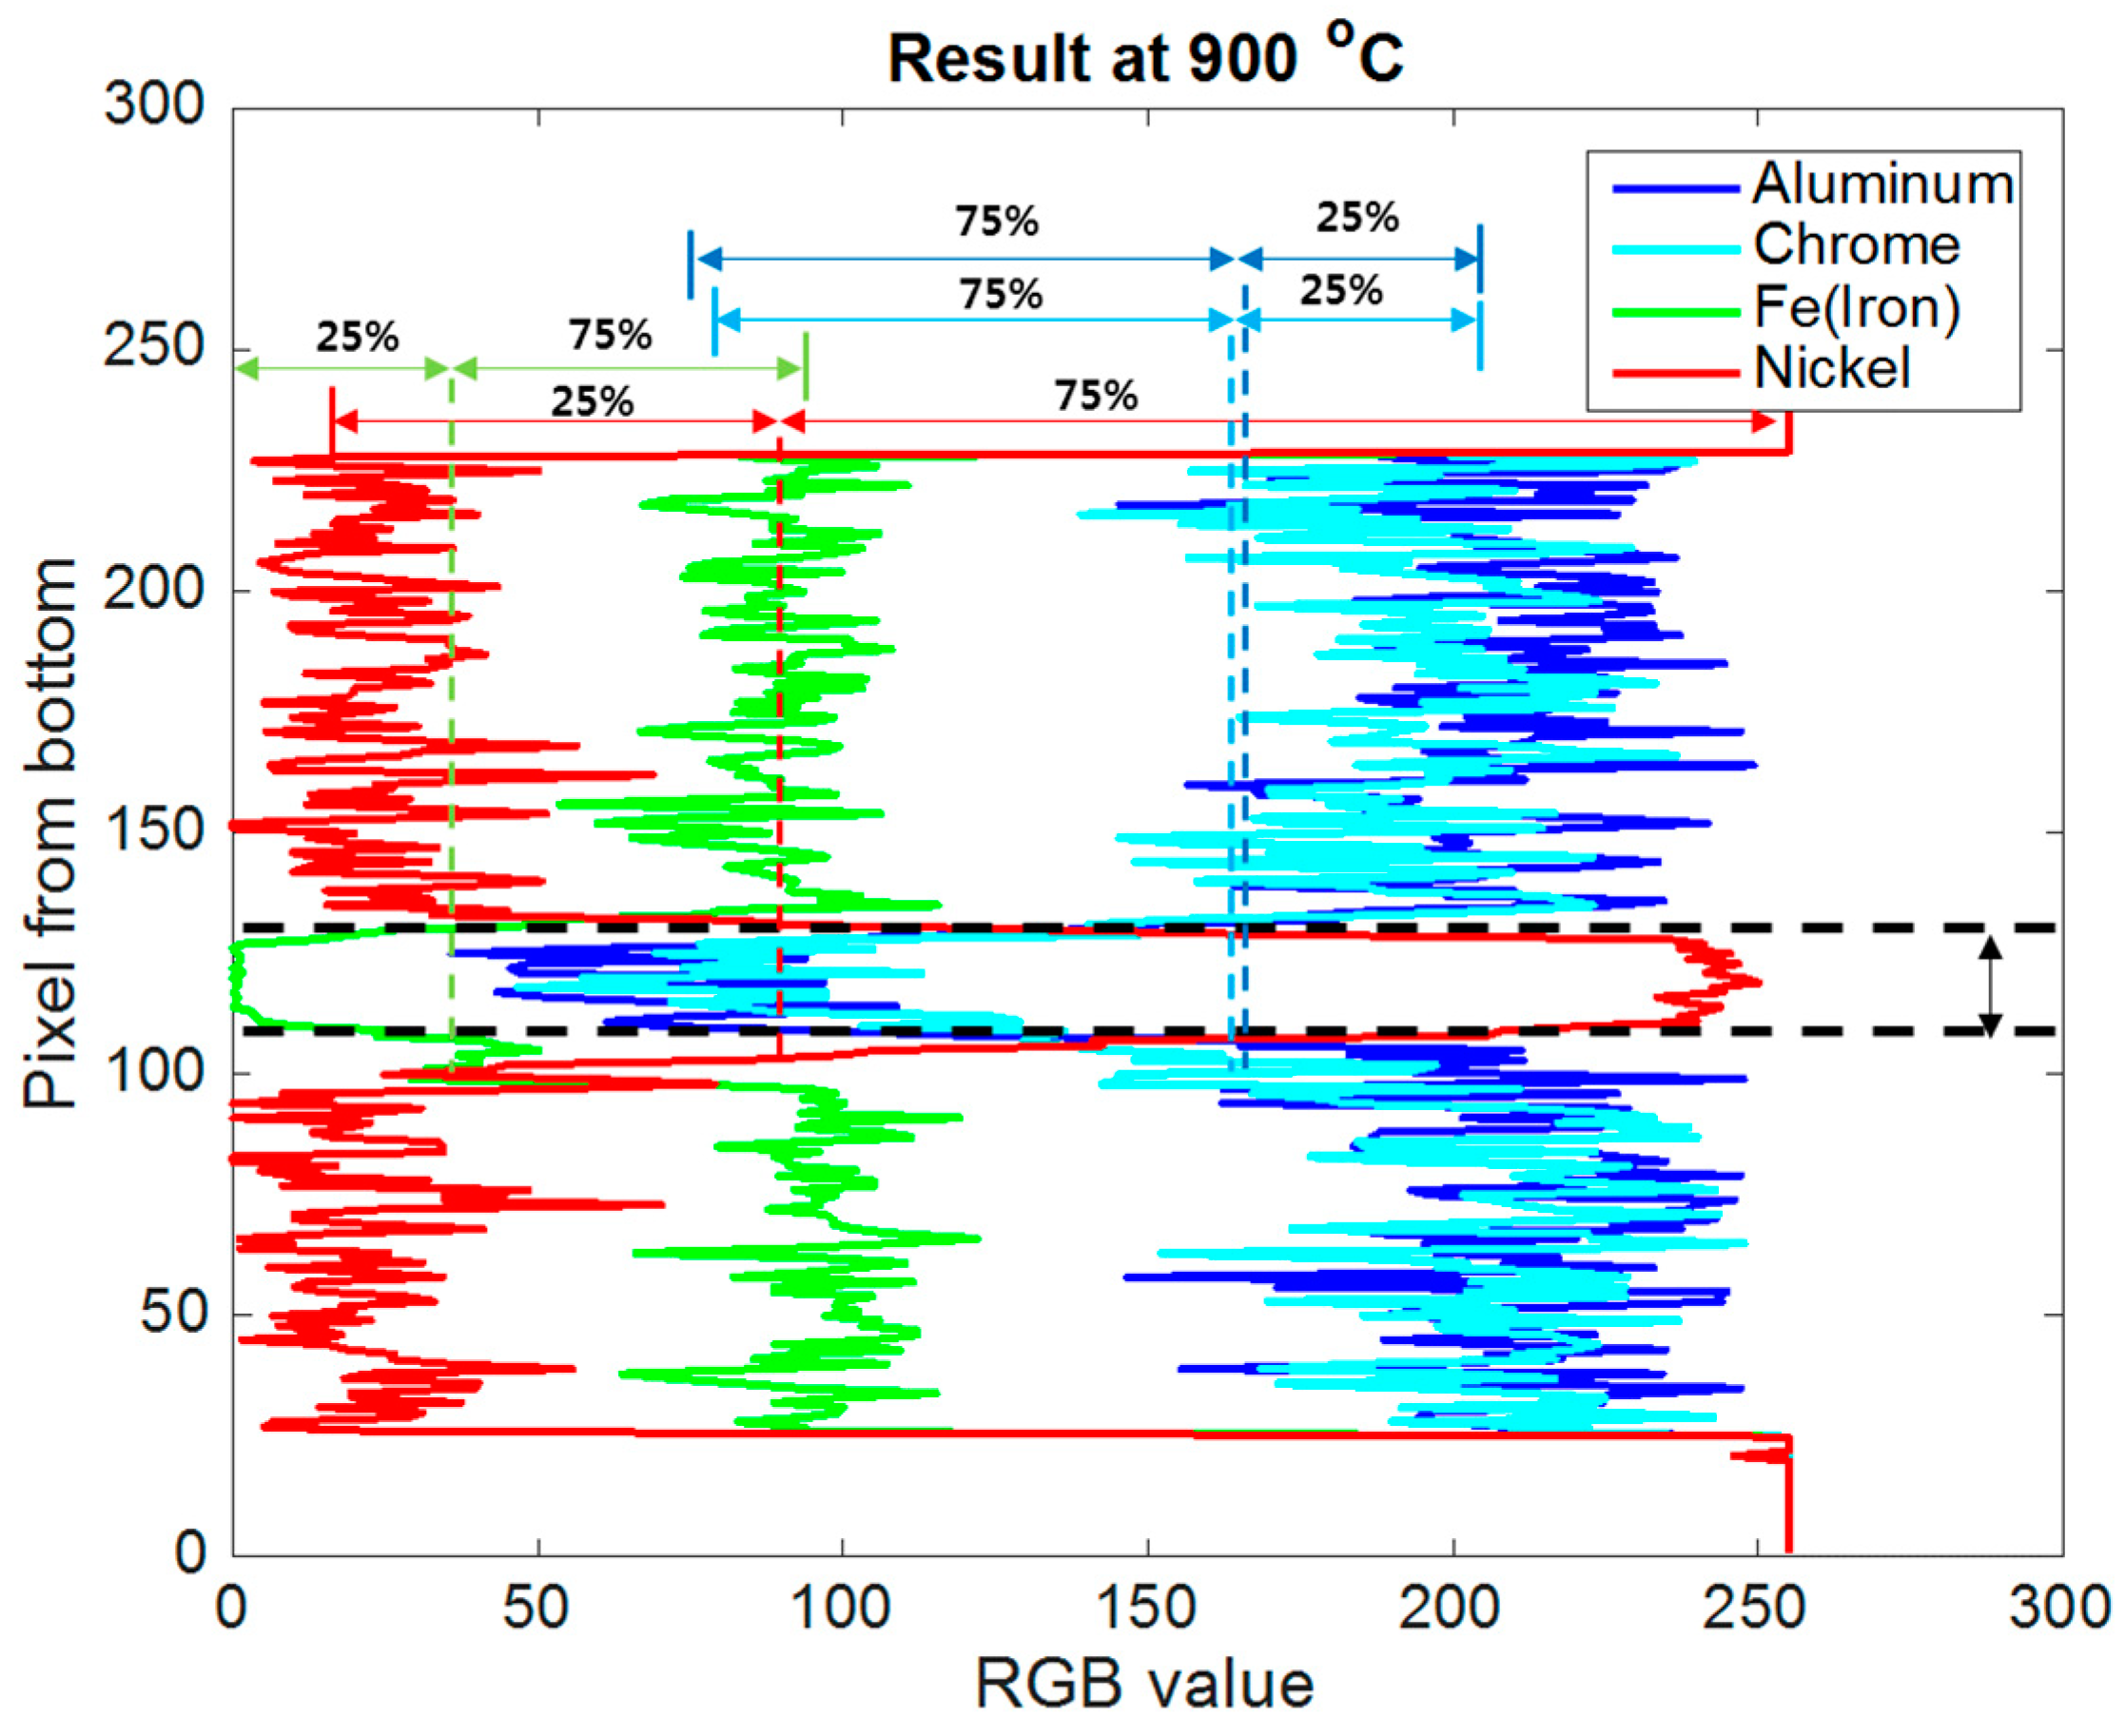
Firstly, the distribution of each component was calculated by thickness calculation. The images of Al, Cr, Ni, and Fe were read among the images that were mapped at each bonding temperature using MATLAB, and the interested area to measure degree of bonding was selected. Then, the intensities expressed by RGB values of the pixels were acquired by reading the selected area. Figure 3 shows SEM-EDS images for the components, Al, Cr, Fe, and Ni, with the lines, boundaries for the region where the thickness of the filler to be measured. Then, the RGB values of each image were graphed for each pixel column, and then the averaged values at each row were drawn in thicker red lines as shown in Figure 4. Figure 4 shows the graphs of ten pixel columns, and their row-averaged column in thicker red line. Superimposing the averaged RGB value lines for each component showed the variations of the component intensities as shown in Figure 5, and the abrupt change was inferred as the boundary between base and filler metals. An abrupt change of RGB value was defined as the changes of 25% drop or jump of the maximum or minimum RGB value for each component. In addition, the number of pixels between the boundaries where the abrupt change occurred was counted to estimate the thickness of the filler metal. The thickness was calculated by inversely calculating the number of pixels between the two boundaries. Same analysis was applied to the images of 950 and 1000 °C, and they are presented in the following results paragraph.
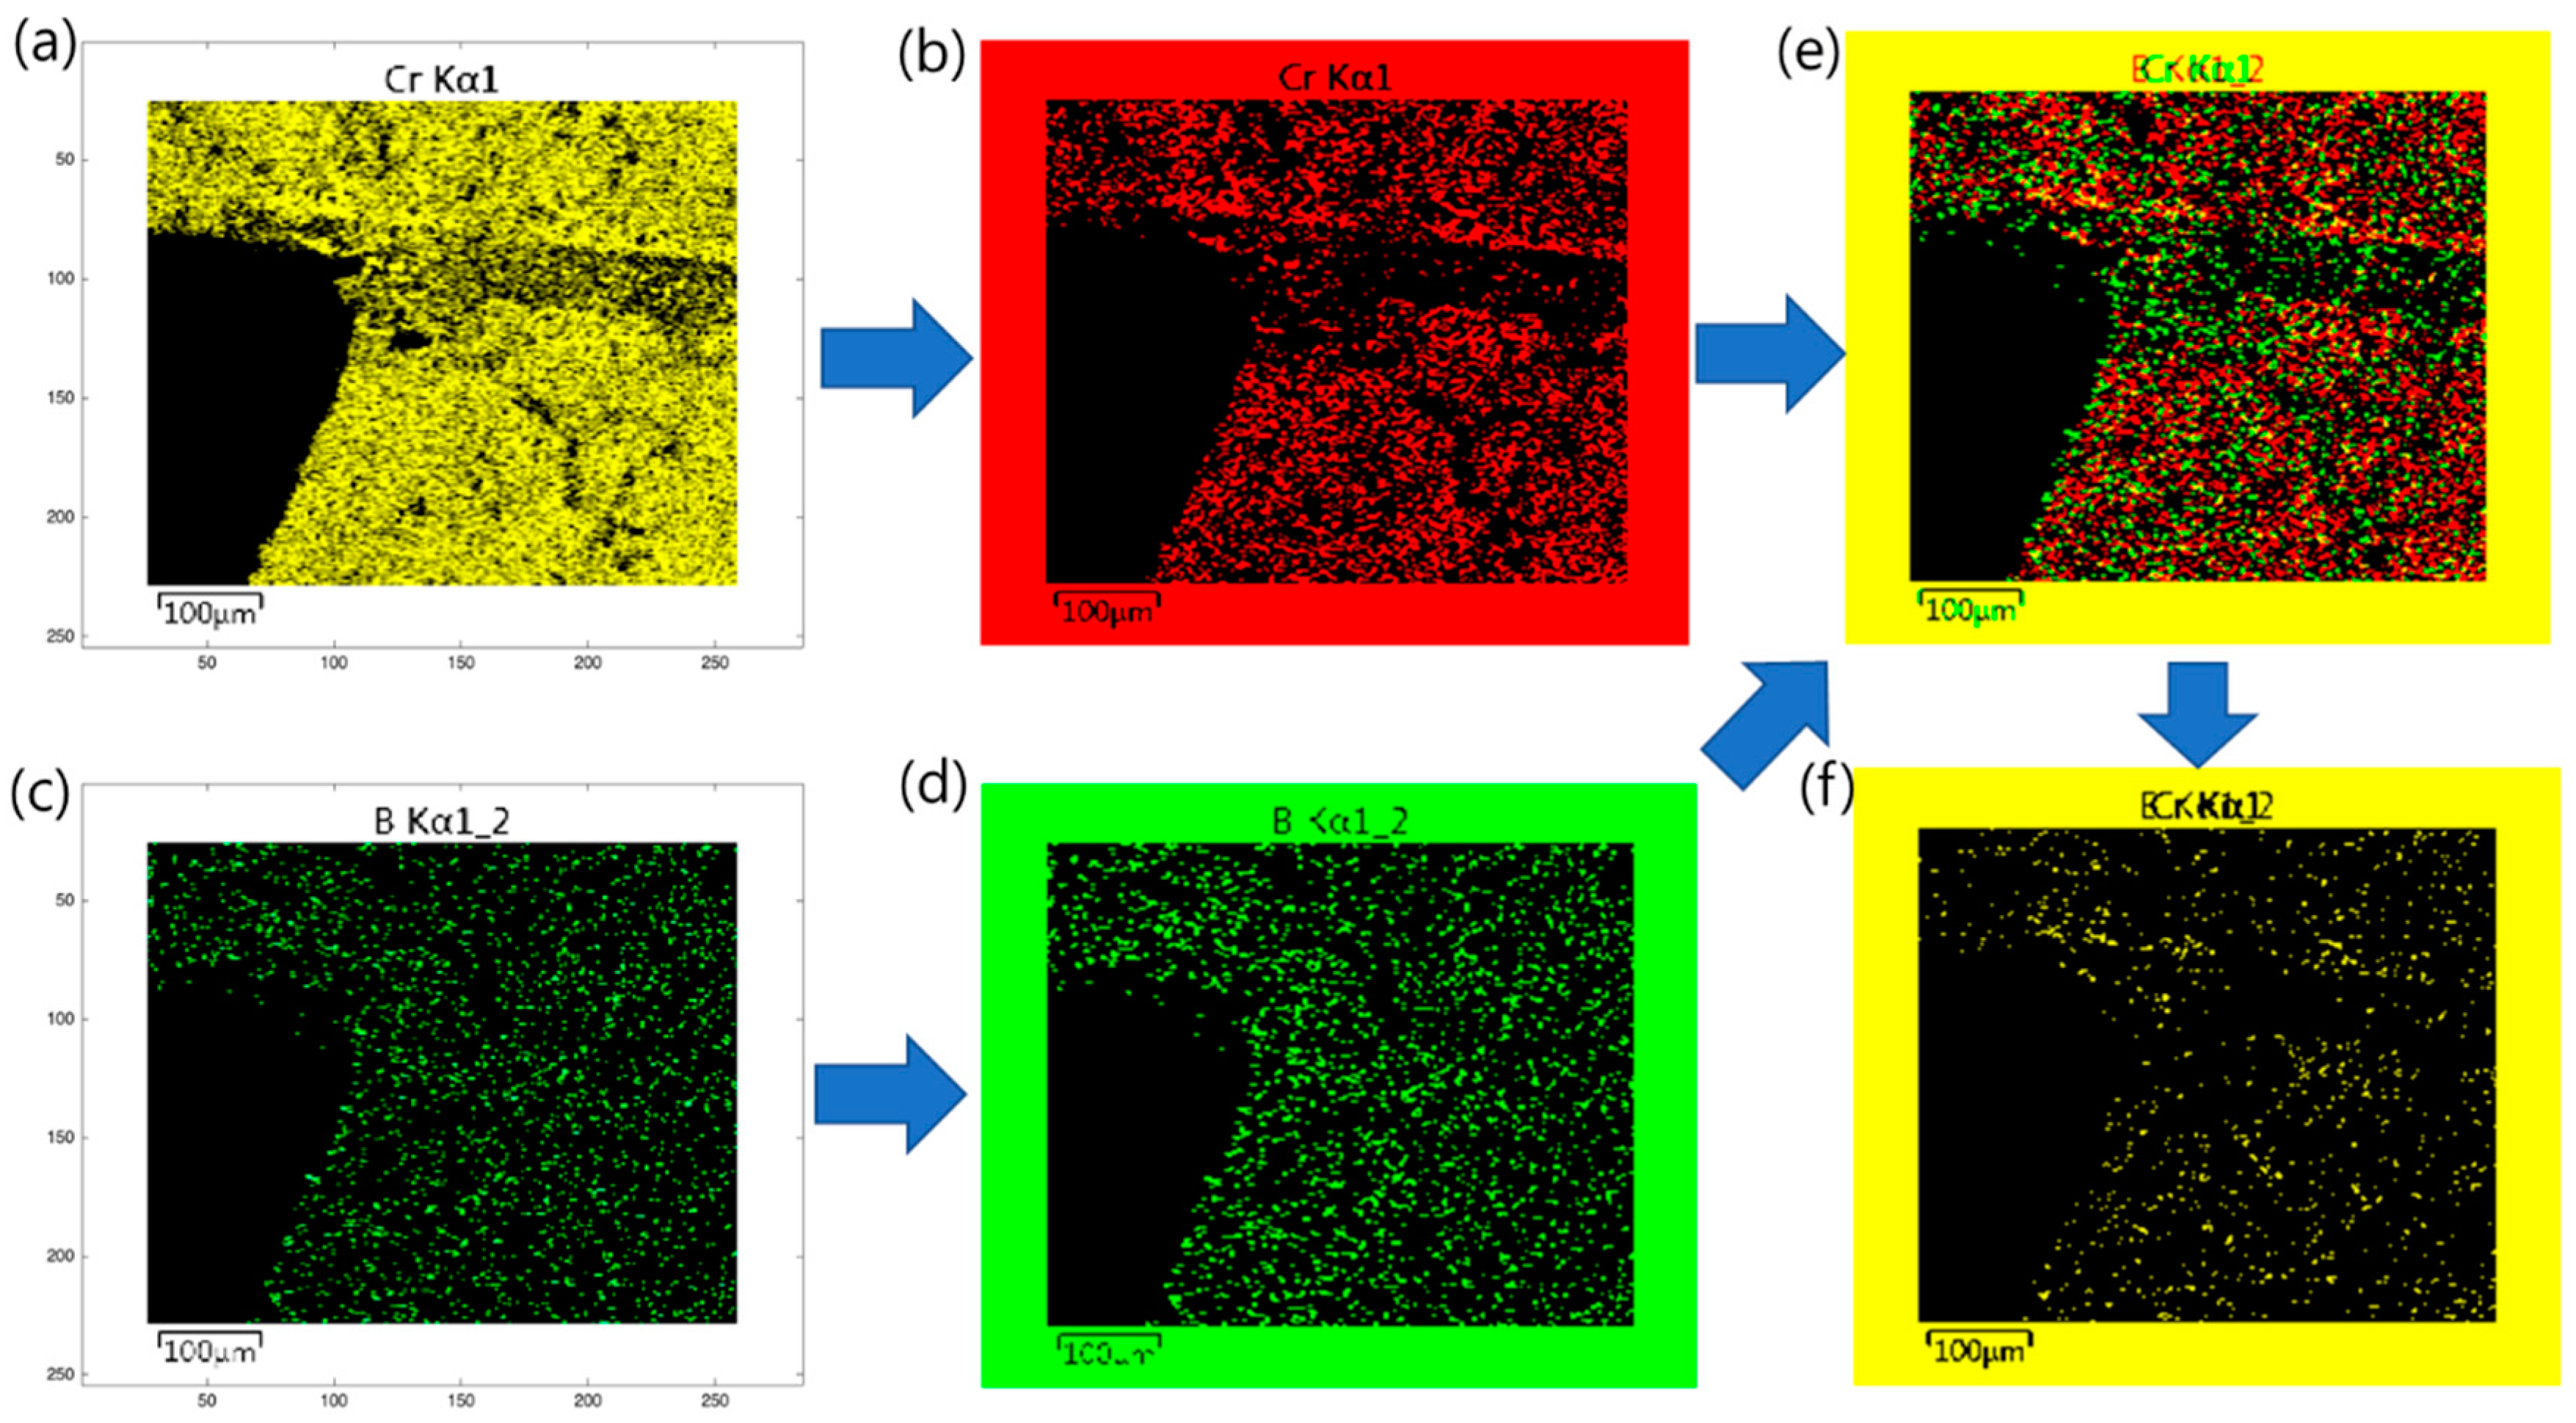
Secondly, Figure 6 shows the steps of the image processing algorithm to identify each component. For analyzing the CrxBy image, we divided the original RGB images of Cr and B (shown in Figure 6a,c) into red, green, and blue images. The yellow image of Cr and the green image of B were changed to each monochromatic image. In addition, the mono images of Cr and B were converted to red and green as in Figure 6b,d, respectively. When one image was superimposed on the other image, the overlapping part of the two elements was changed to yellow, since overlapping of green and red make yellow for RGB images, i.e., the yellow part meant that the two components existed together, the CrxBy phase. The same method was applied to Ni and Al images from SEM-EDS to analyze NixAly phase as well.

4. Results

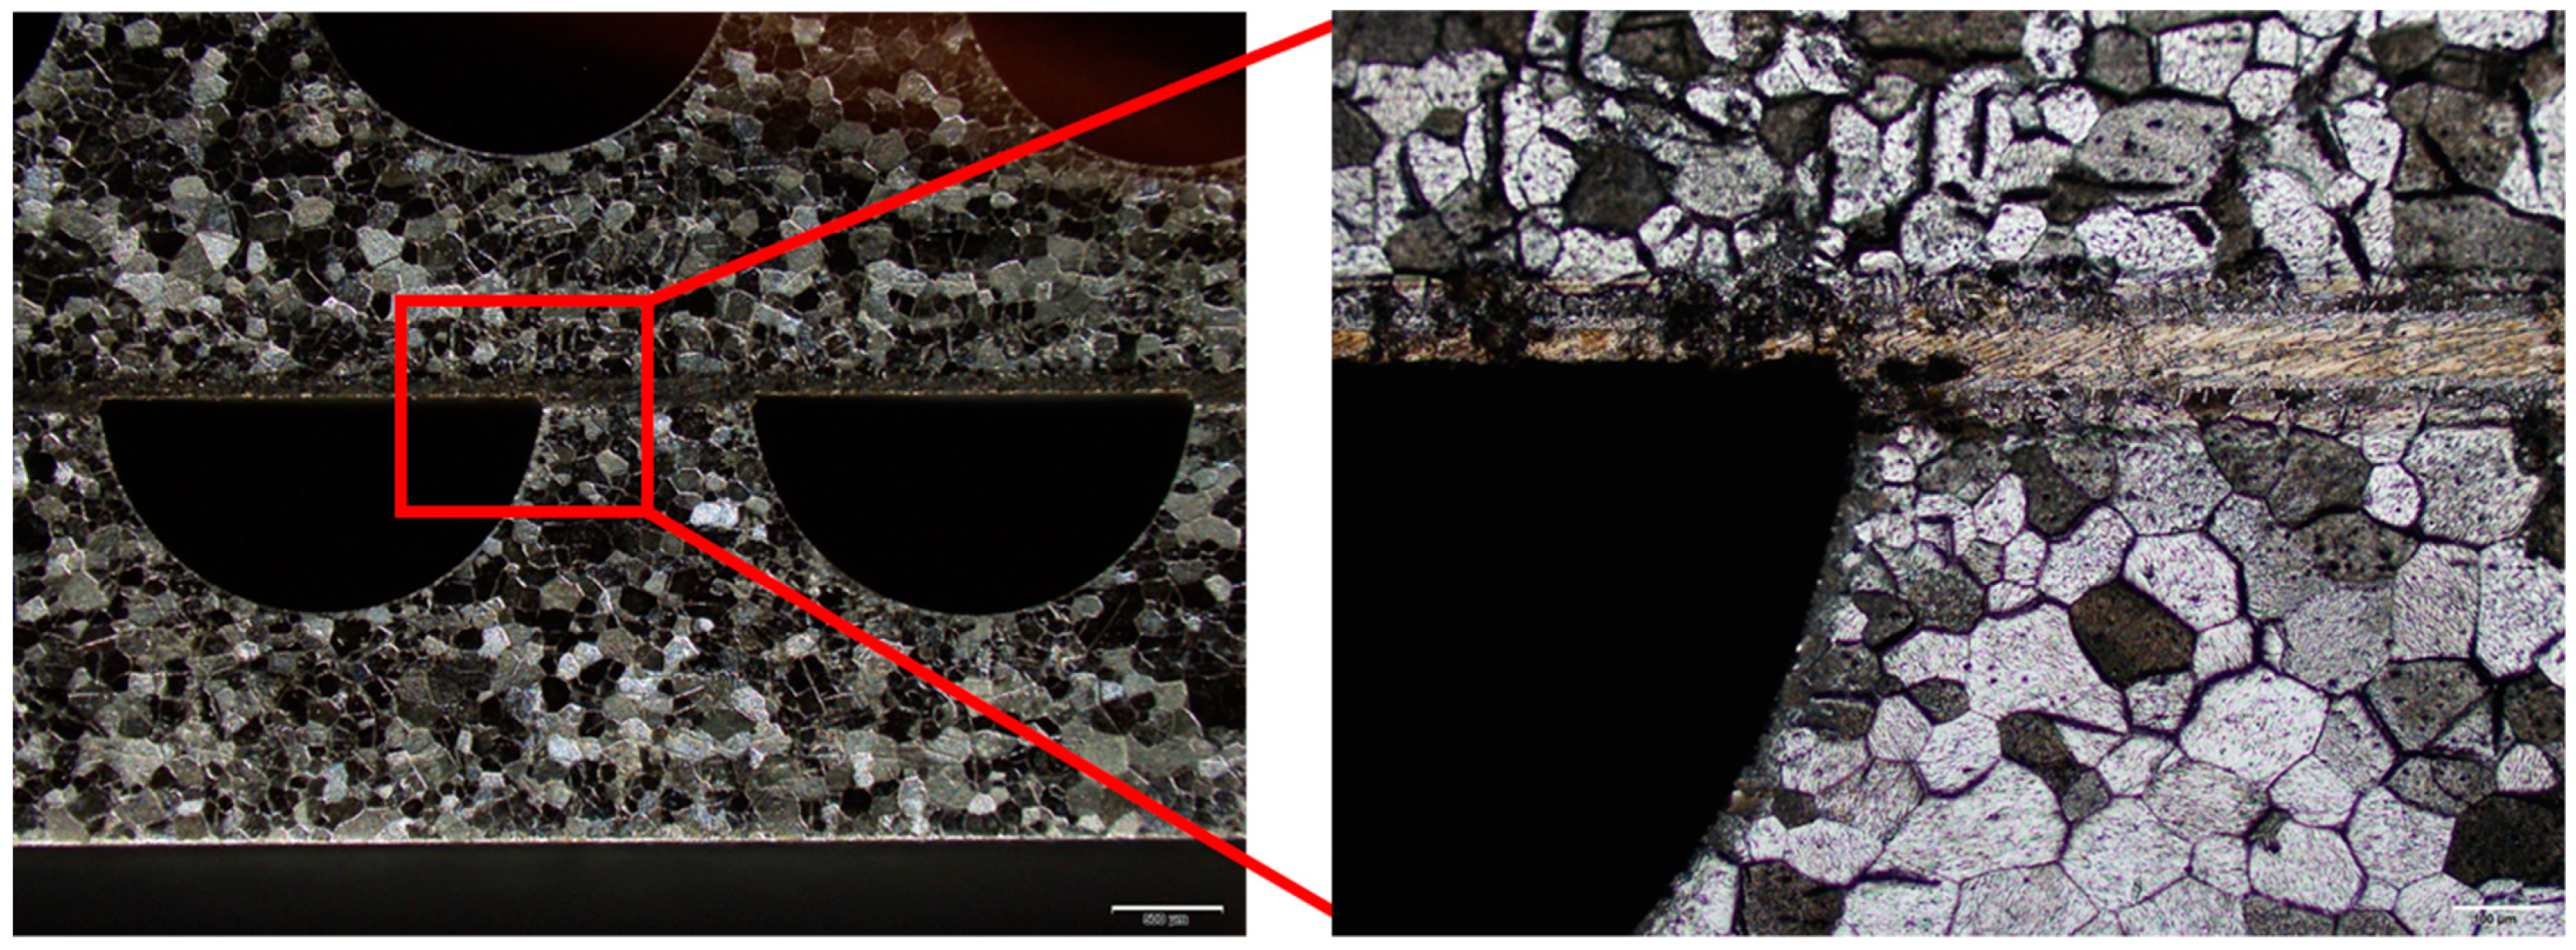
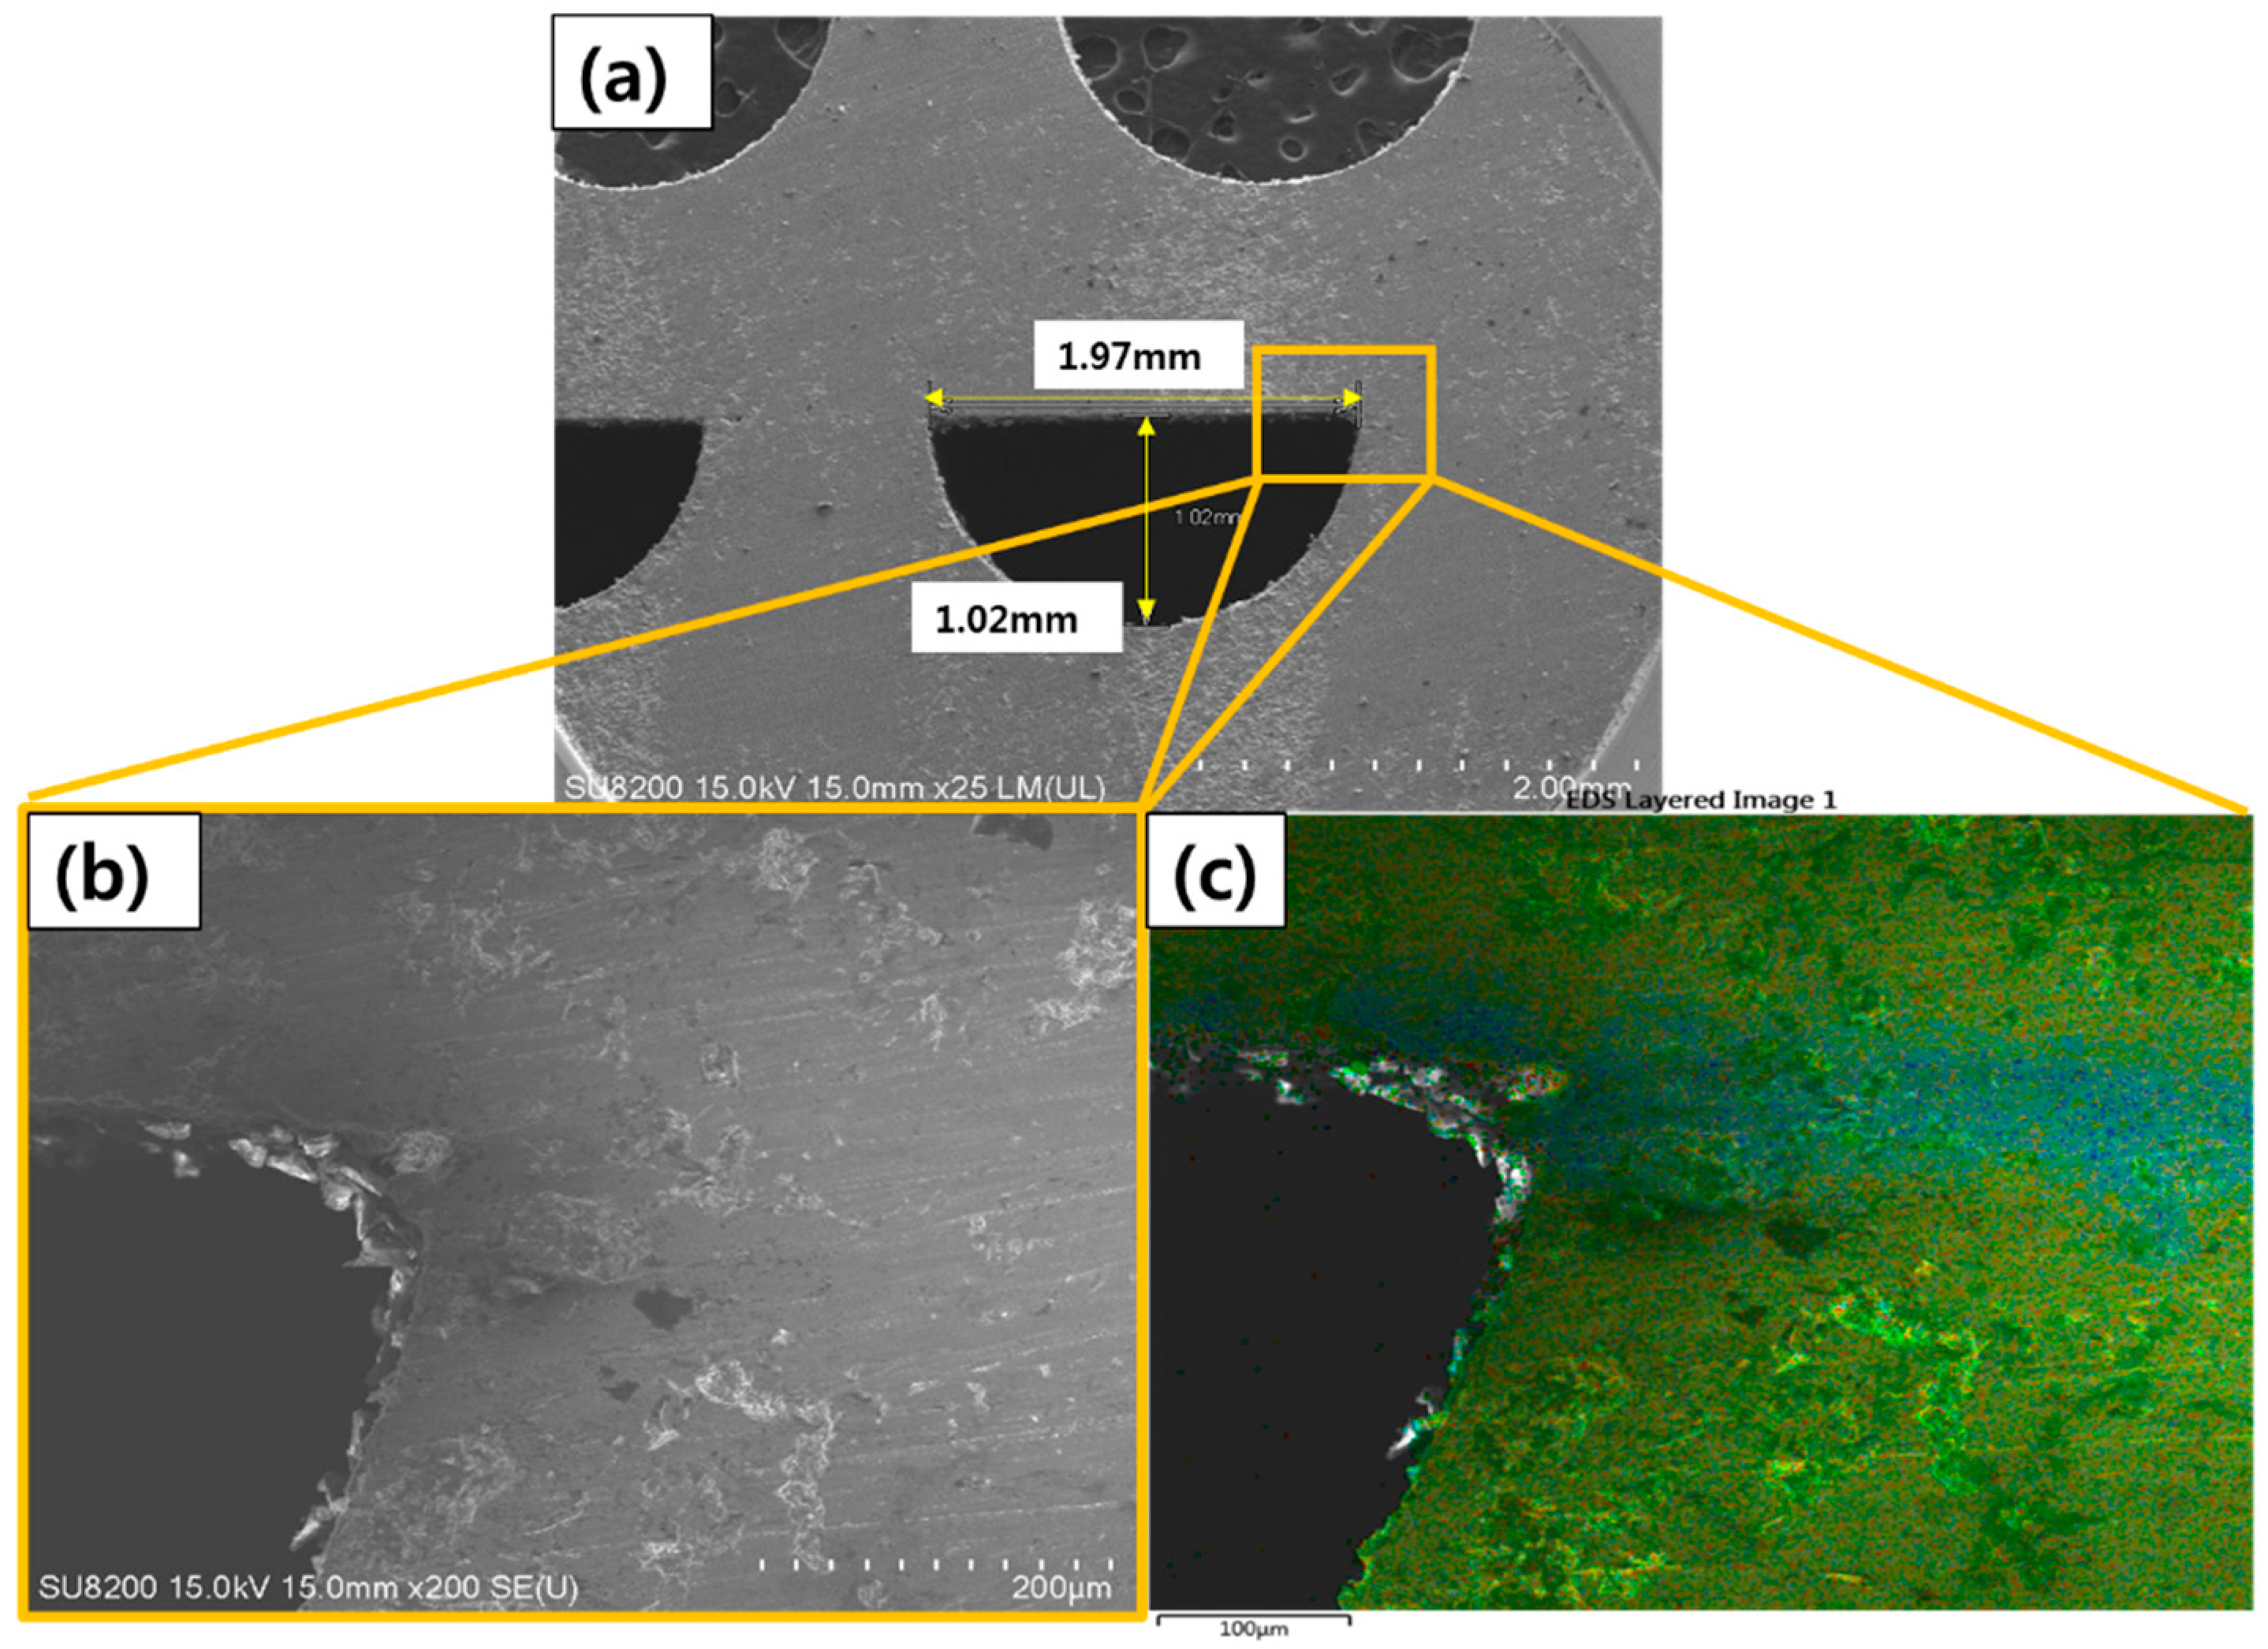
Figure 7 shows a microscope image of a cross section of Fecralloy/MBF20/Fecralloy brazed at 1000 °C. Before taking microscopic images, the test section was etched for 60 s in a solution of 70:30 nitric acid and sulfuric acid. As designed, the channel section was a semi-circle with a diameter of 2 mm, and a sheet of MBF20 was bonded between the heat transfer plates. Fecralloy and MBF 20 parts can be distinguished, and interlayers between them are shown in Figure 7b. Metal grains are visible in Fecralloy part, but not in filler metal. In case of the bonding between STS304 and MBF20, the interlayer is a region where CrxBy phase exists, which is a factor determining the strength of bonding [18,19]. For the detail analysis to understand the bonding interlayer between Fecralloy and MBF20, SEM-EDS was used and the images for brazing at 1000 °C are shown Figure 8. Figure 8a shows the cross-section of the channels, and a part in a white square is shown in Figure 8b by magnifying 10 times. The image was analyzed by SEM-EDS and each component in different color was superimposed as in Figure 8c. However, with those images, it is not possible to measure the exact change of the thickness of the filler metal and it is difficult to analyze the bonding quality, the results obtained by apply the developed image processing method is presented in the next paragraph.

4.1. Brazing Bonding Thickness

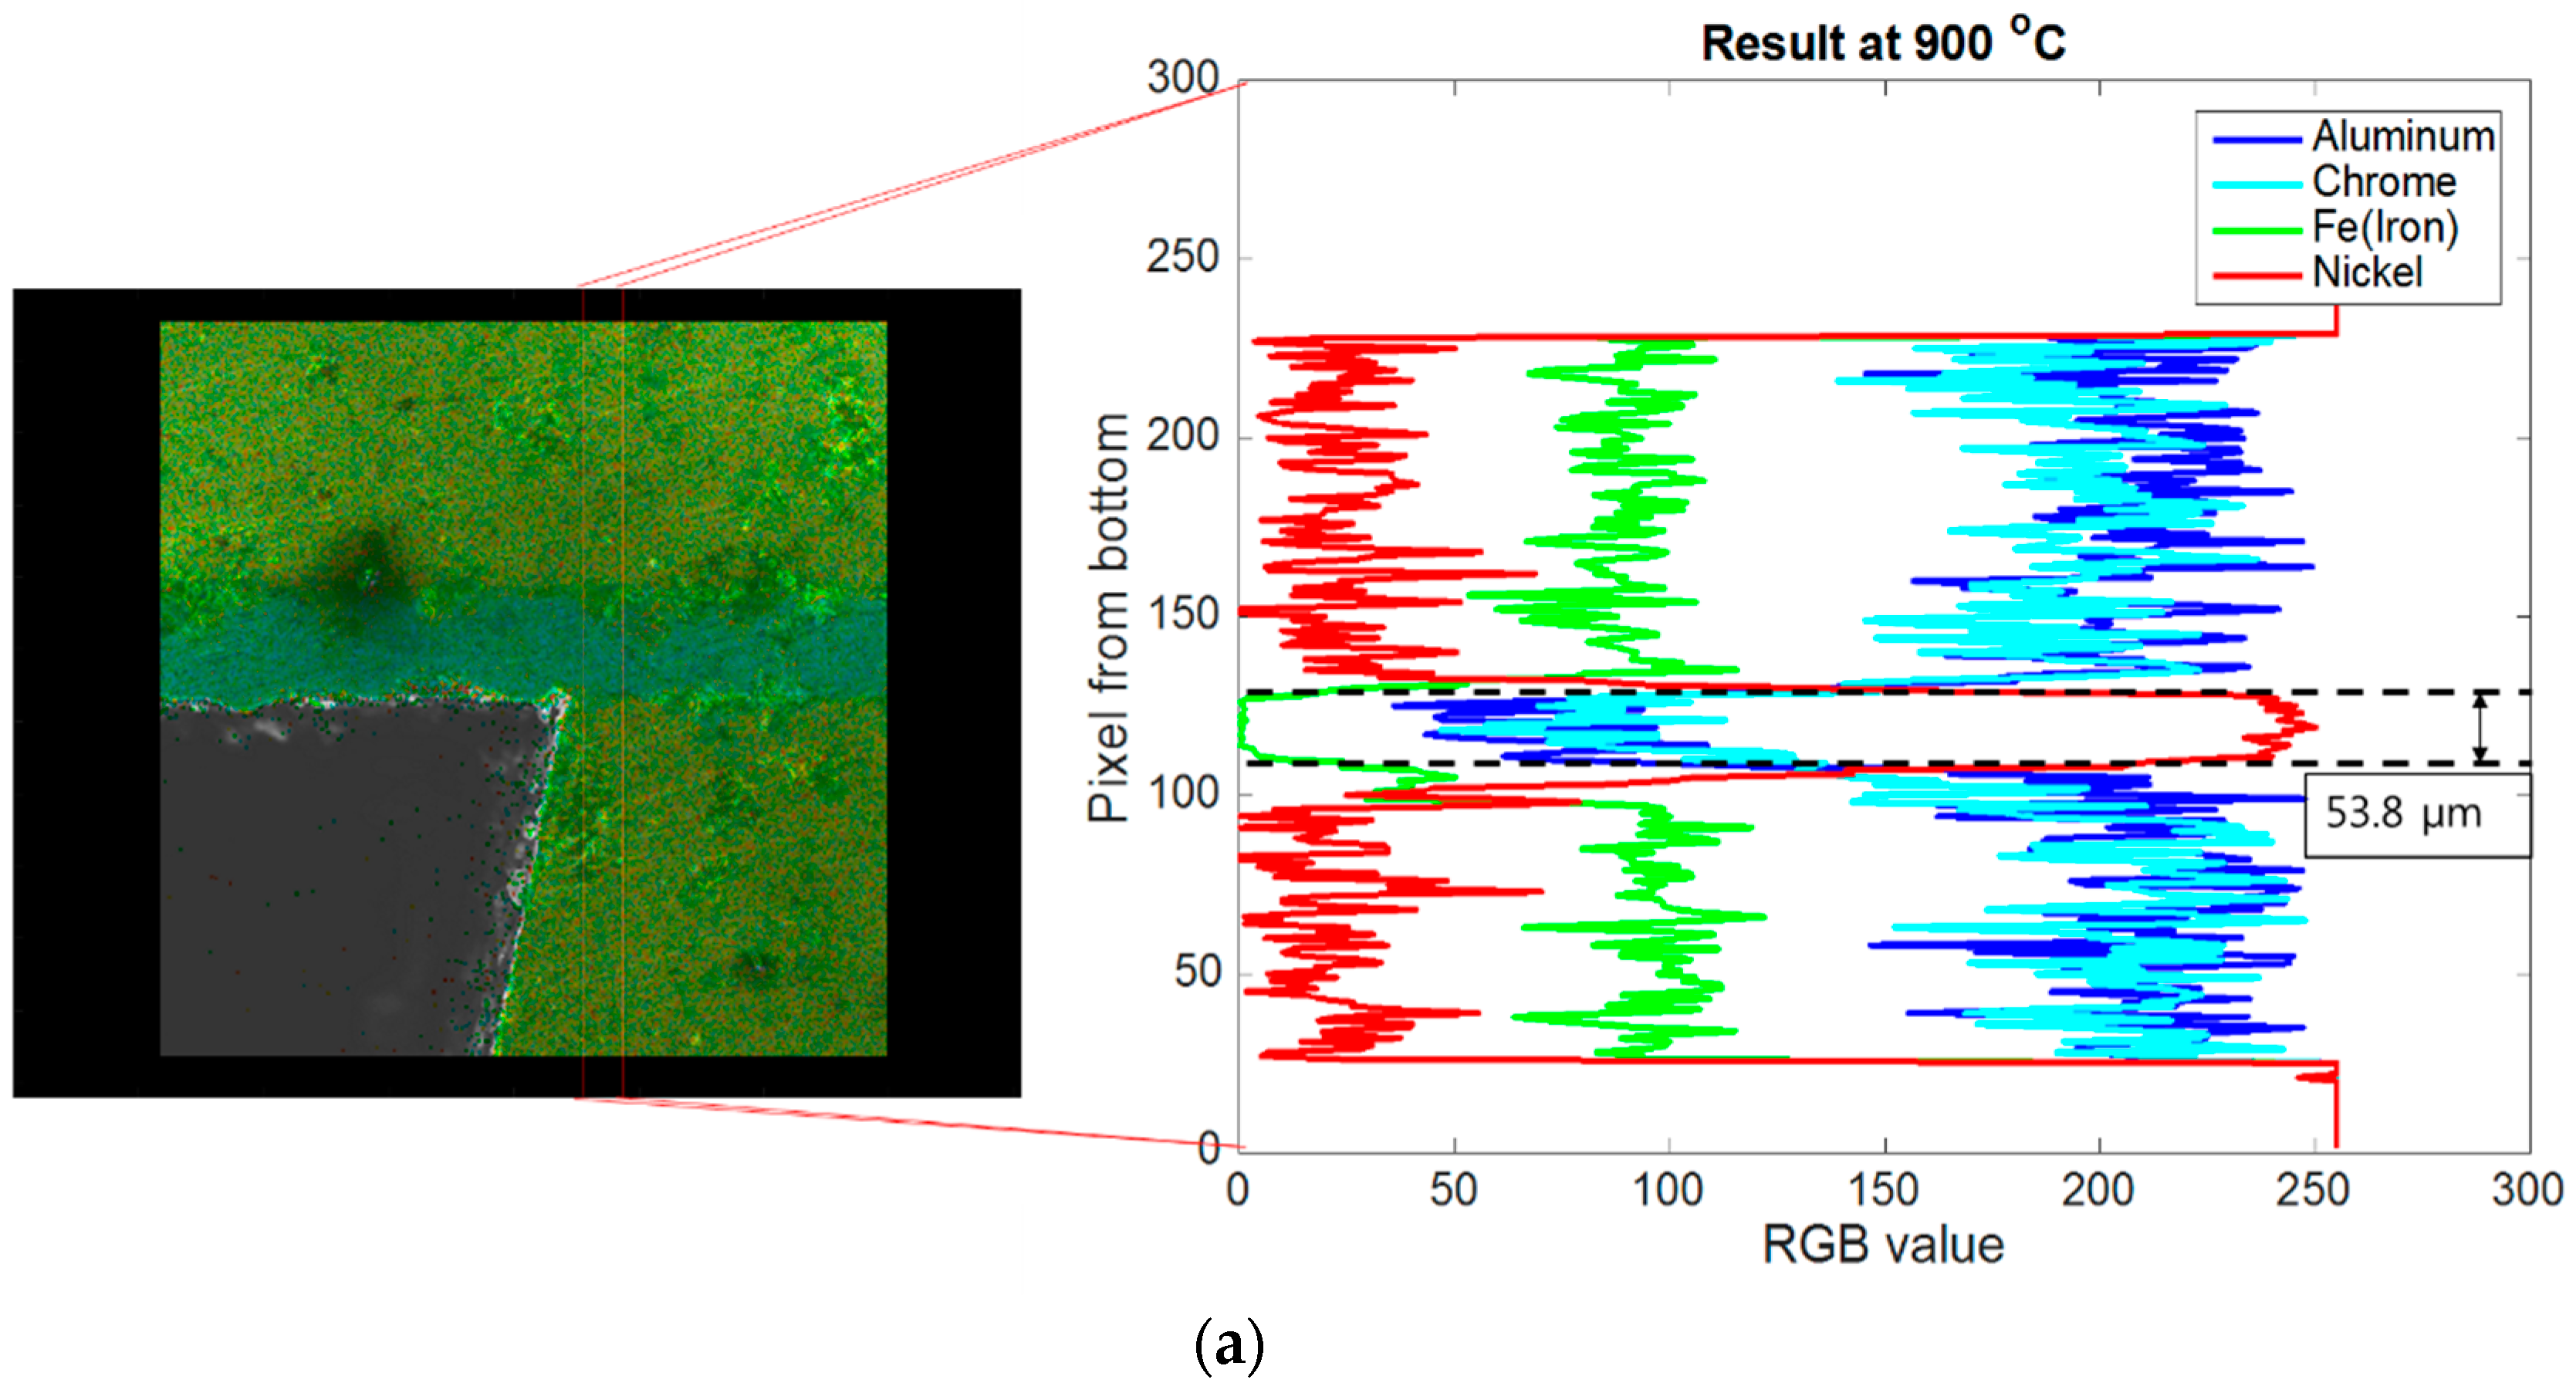
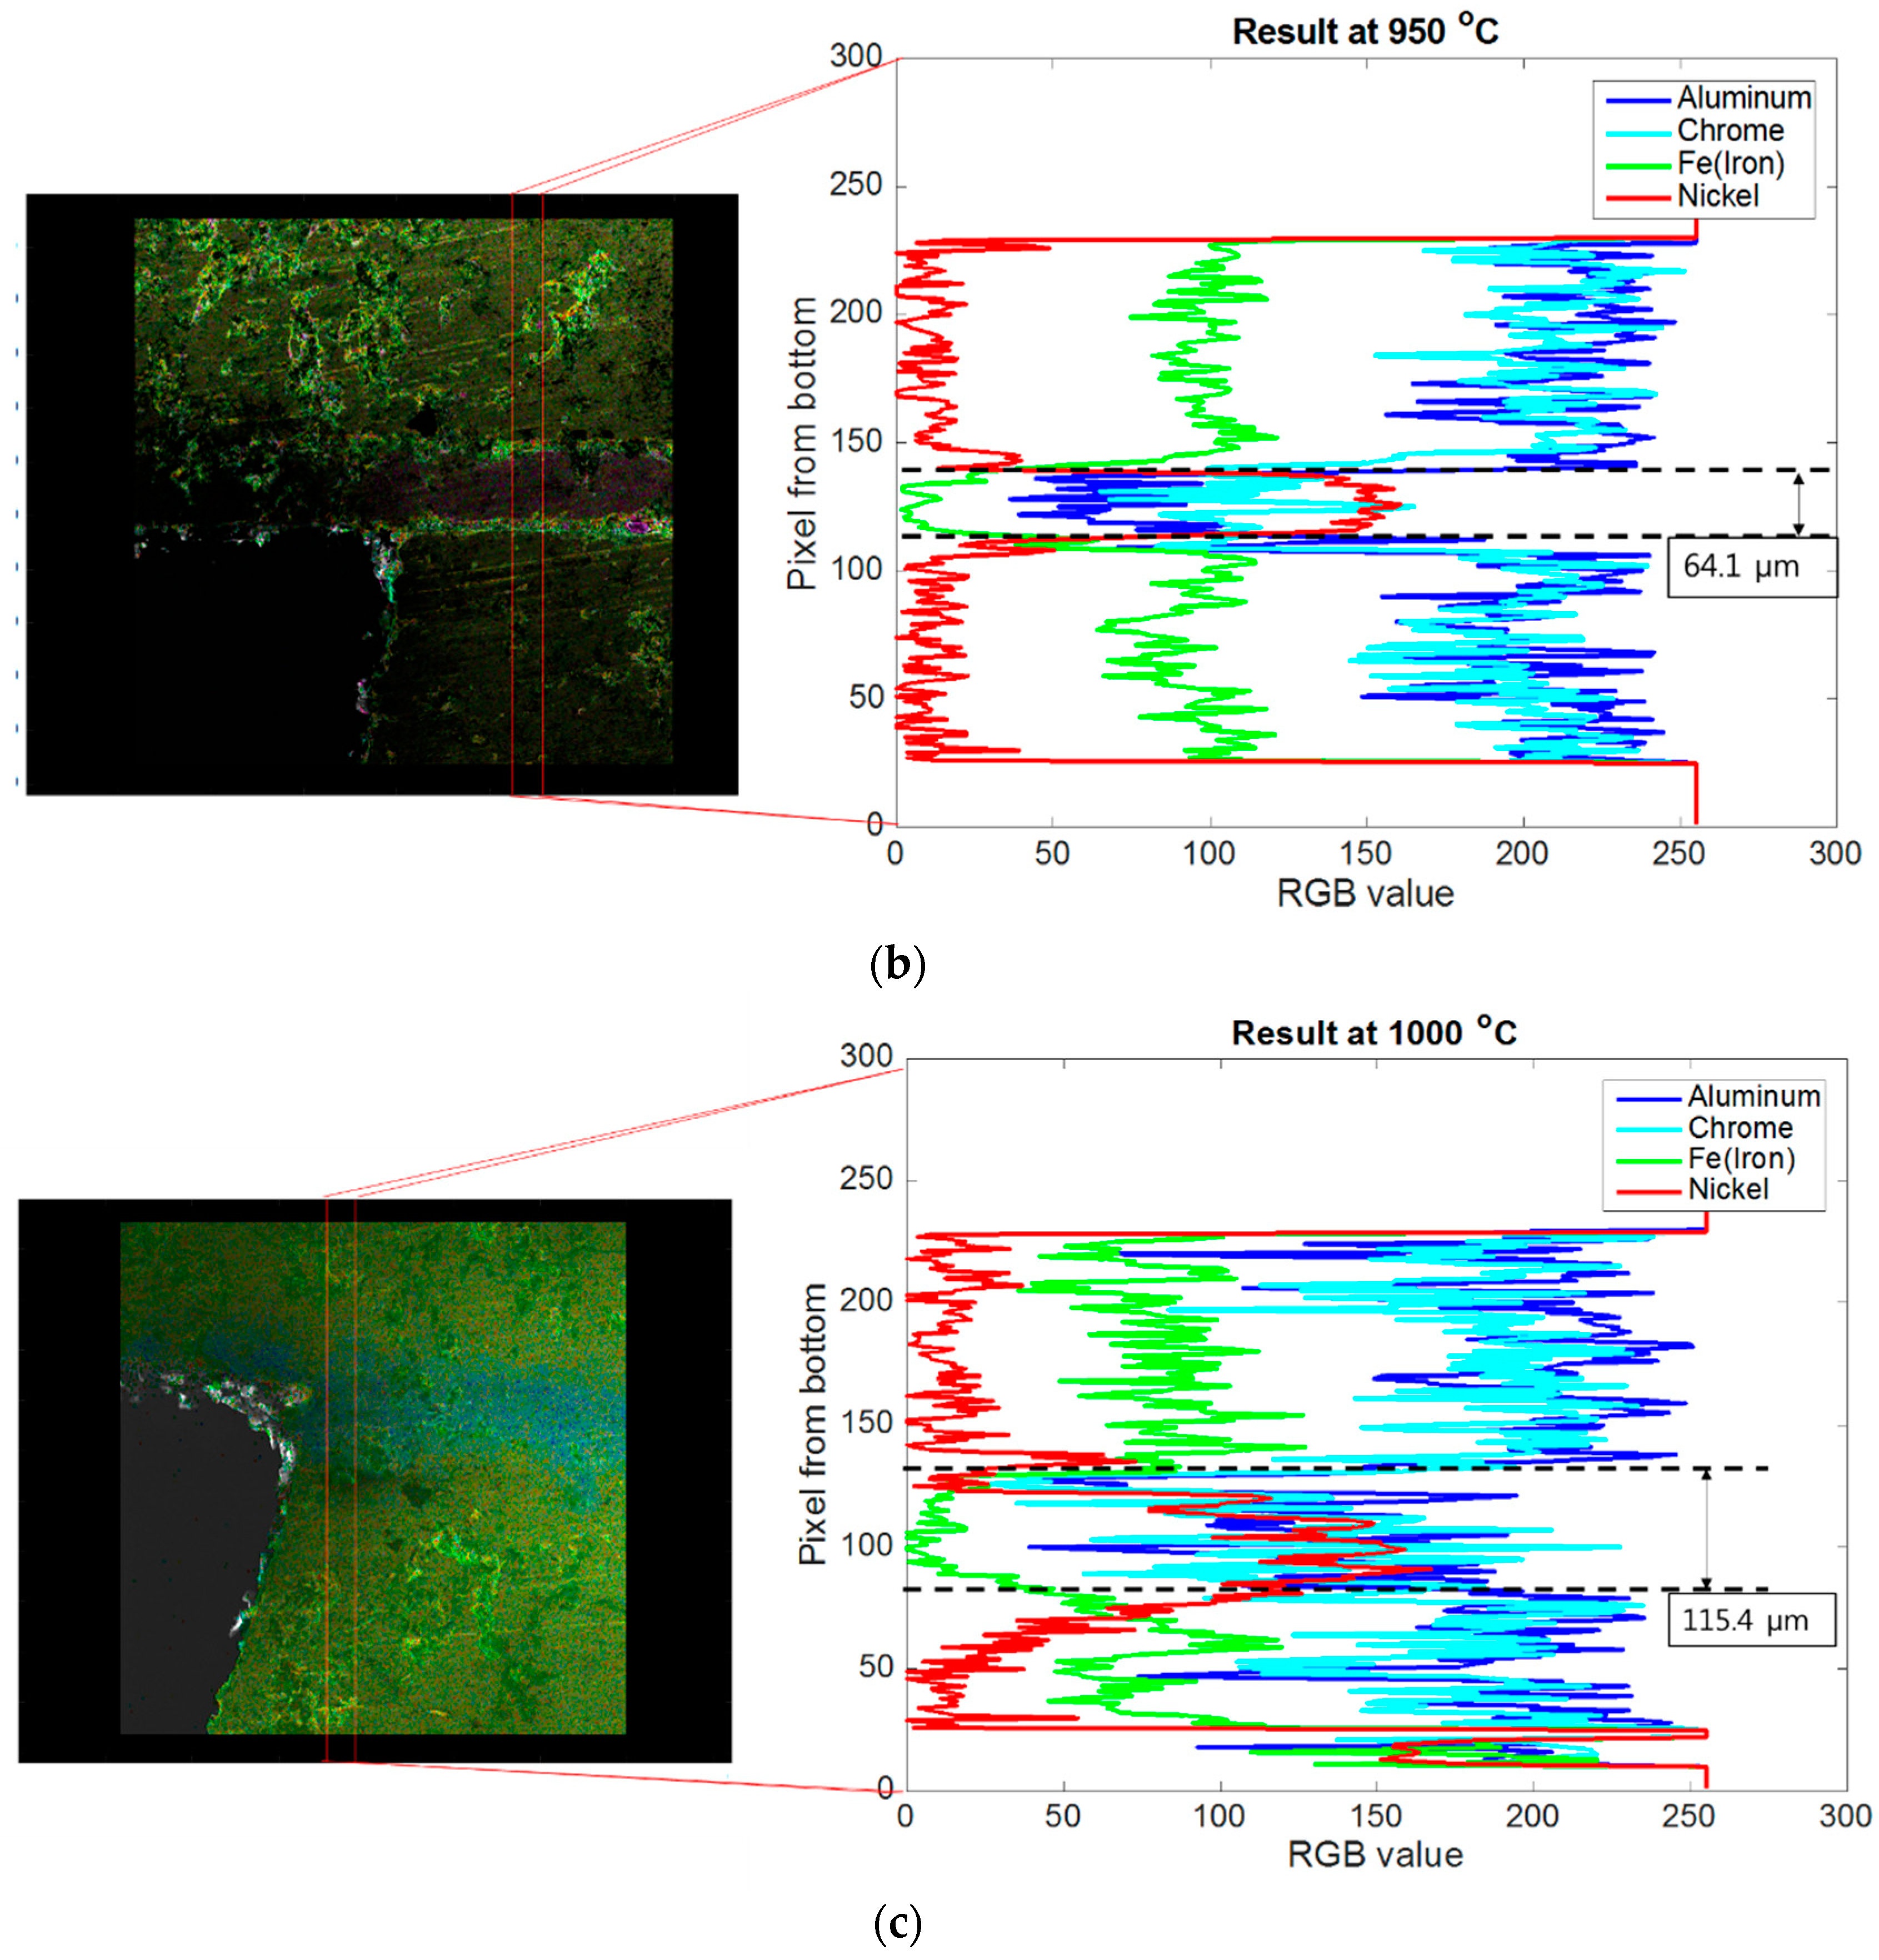
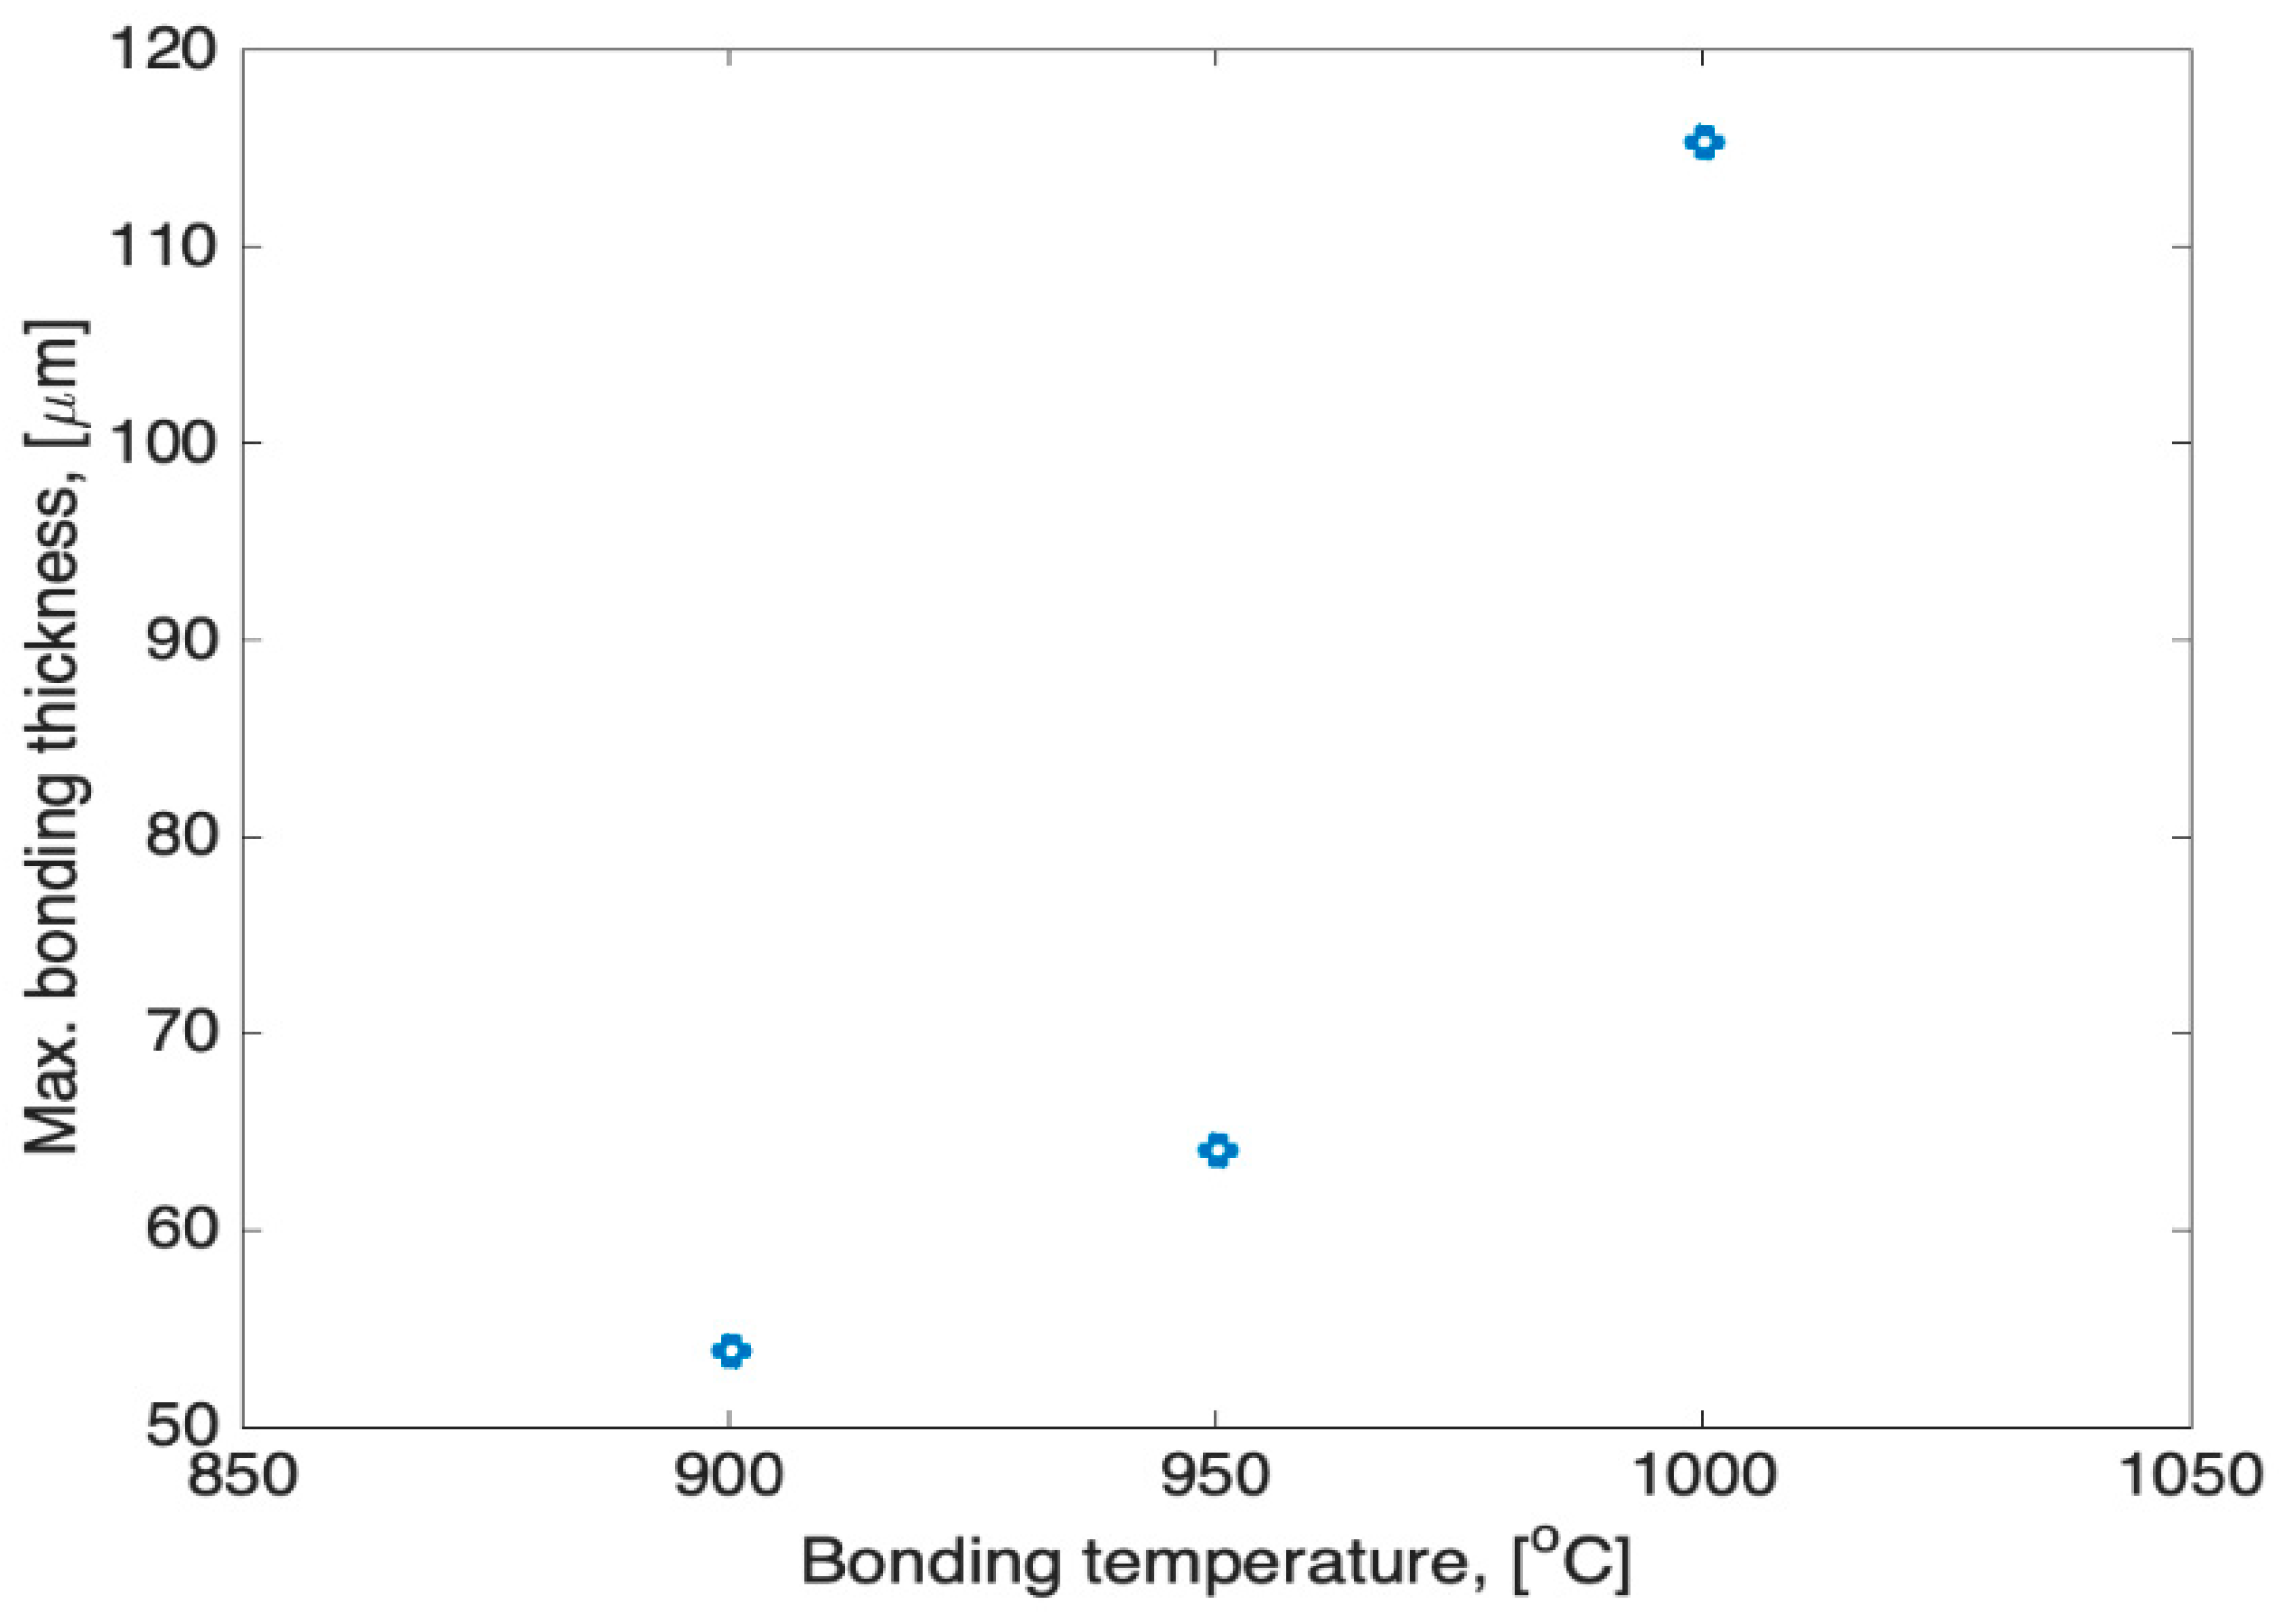
SEM-EDS mapping of brazed samples bonded at 900 °C, 950 °C, and 1000 °C was used to obtain images of the distribution of each component (e.g., Al, B, C, Cr, Si, Fe, Ni and Cu). Representative components, Al, Cr, Fe, and Ni, which can distinguish Fecralloy and MBF20, were analyzed using image processing. When brazing at 900 °C, the thickness of filler metal, MBF20 was 53.8 μm as shown in Figure 9a. The estimated thickness was thinner than the filler metal before bonding, which can be deduced to be just compressed without diffusion. It can be shown in the SEM-EDS images that Aluminum and nickel were metal components only contained in Fecralloy and the filler metal, respectively, and the diffusion to counter metals rarely occurred. Chromium and iron were present in different proportions in Fecralloy and filler metal, and even after diffusion bonding, the density of the two metals was clearly differentiated between the Fecralloy and the filler portion by the content ratio. It can also be deduced that the two metal did not diffuse to each other, and that the filler metal. The results at 950 °C were different from that at 900 °C in that the thickness of the filler part was 64.1 μm. The interlayers between Fecralloy and filler were not distinct compared to 900 °C results as shown in Figure 9b. In particular, the intensity of the nickel of the filler metal part bonded at 900 °C was higher and more distinct than that of 950 °C in the image analysis. The thickness of filler metal and the intensity of the nickel imply that nickel was diffused to counter metal, Fecralloy. At higher bonding temperature of 1000 °C, the boundary between filler and Fecralloy became more obscured as shown in Figure 9c. Compared to the results at other temperatures, the distribution of the intensity widened and weakened. Thus, the boundary between filler and base metal became blurred. As shown in the SEM-EDS image in Figure 9c, the boundary between metals was not straight, but led to thick parts and thin parts. This meant that they were not diffused evenly and diffusion rate was locally different. The thickest part was 115.4 μm. Figure 10 shows the variation of the Max. thickness of the filler depending on bonding temperatures. The results of the bonds indicate that as the junction temperature increased, more components of the materials were diffused into the counter materials, i.e., the quality of the bonds improved.

4.2. CrxBy and NixAly Phases

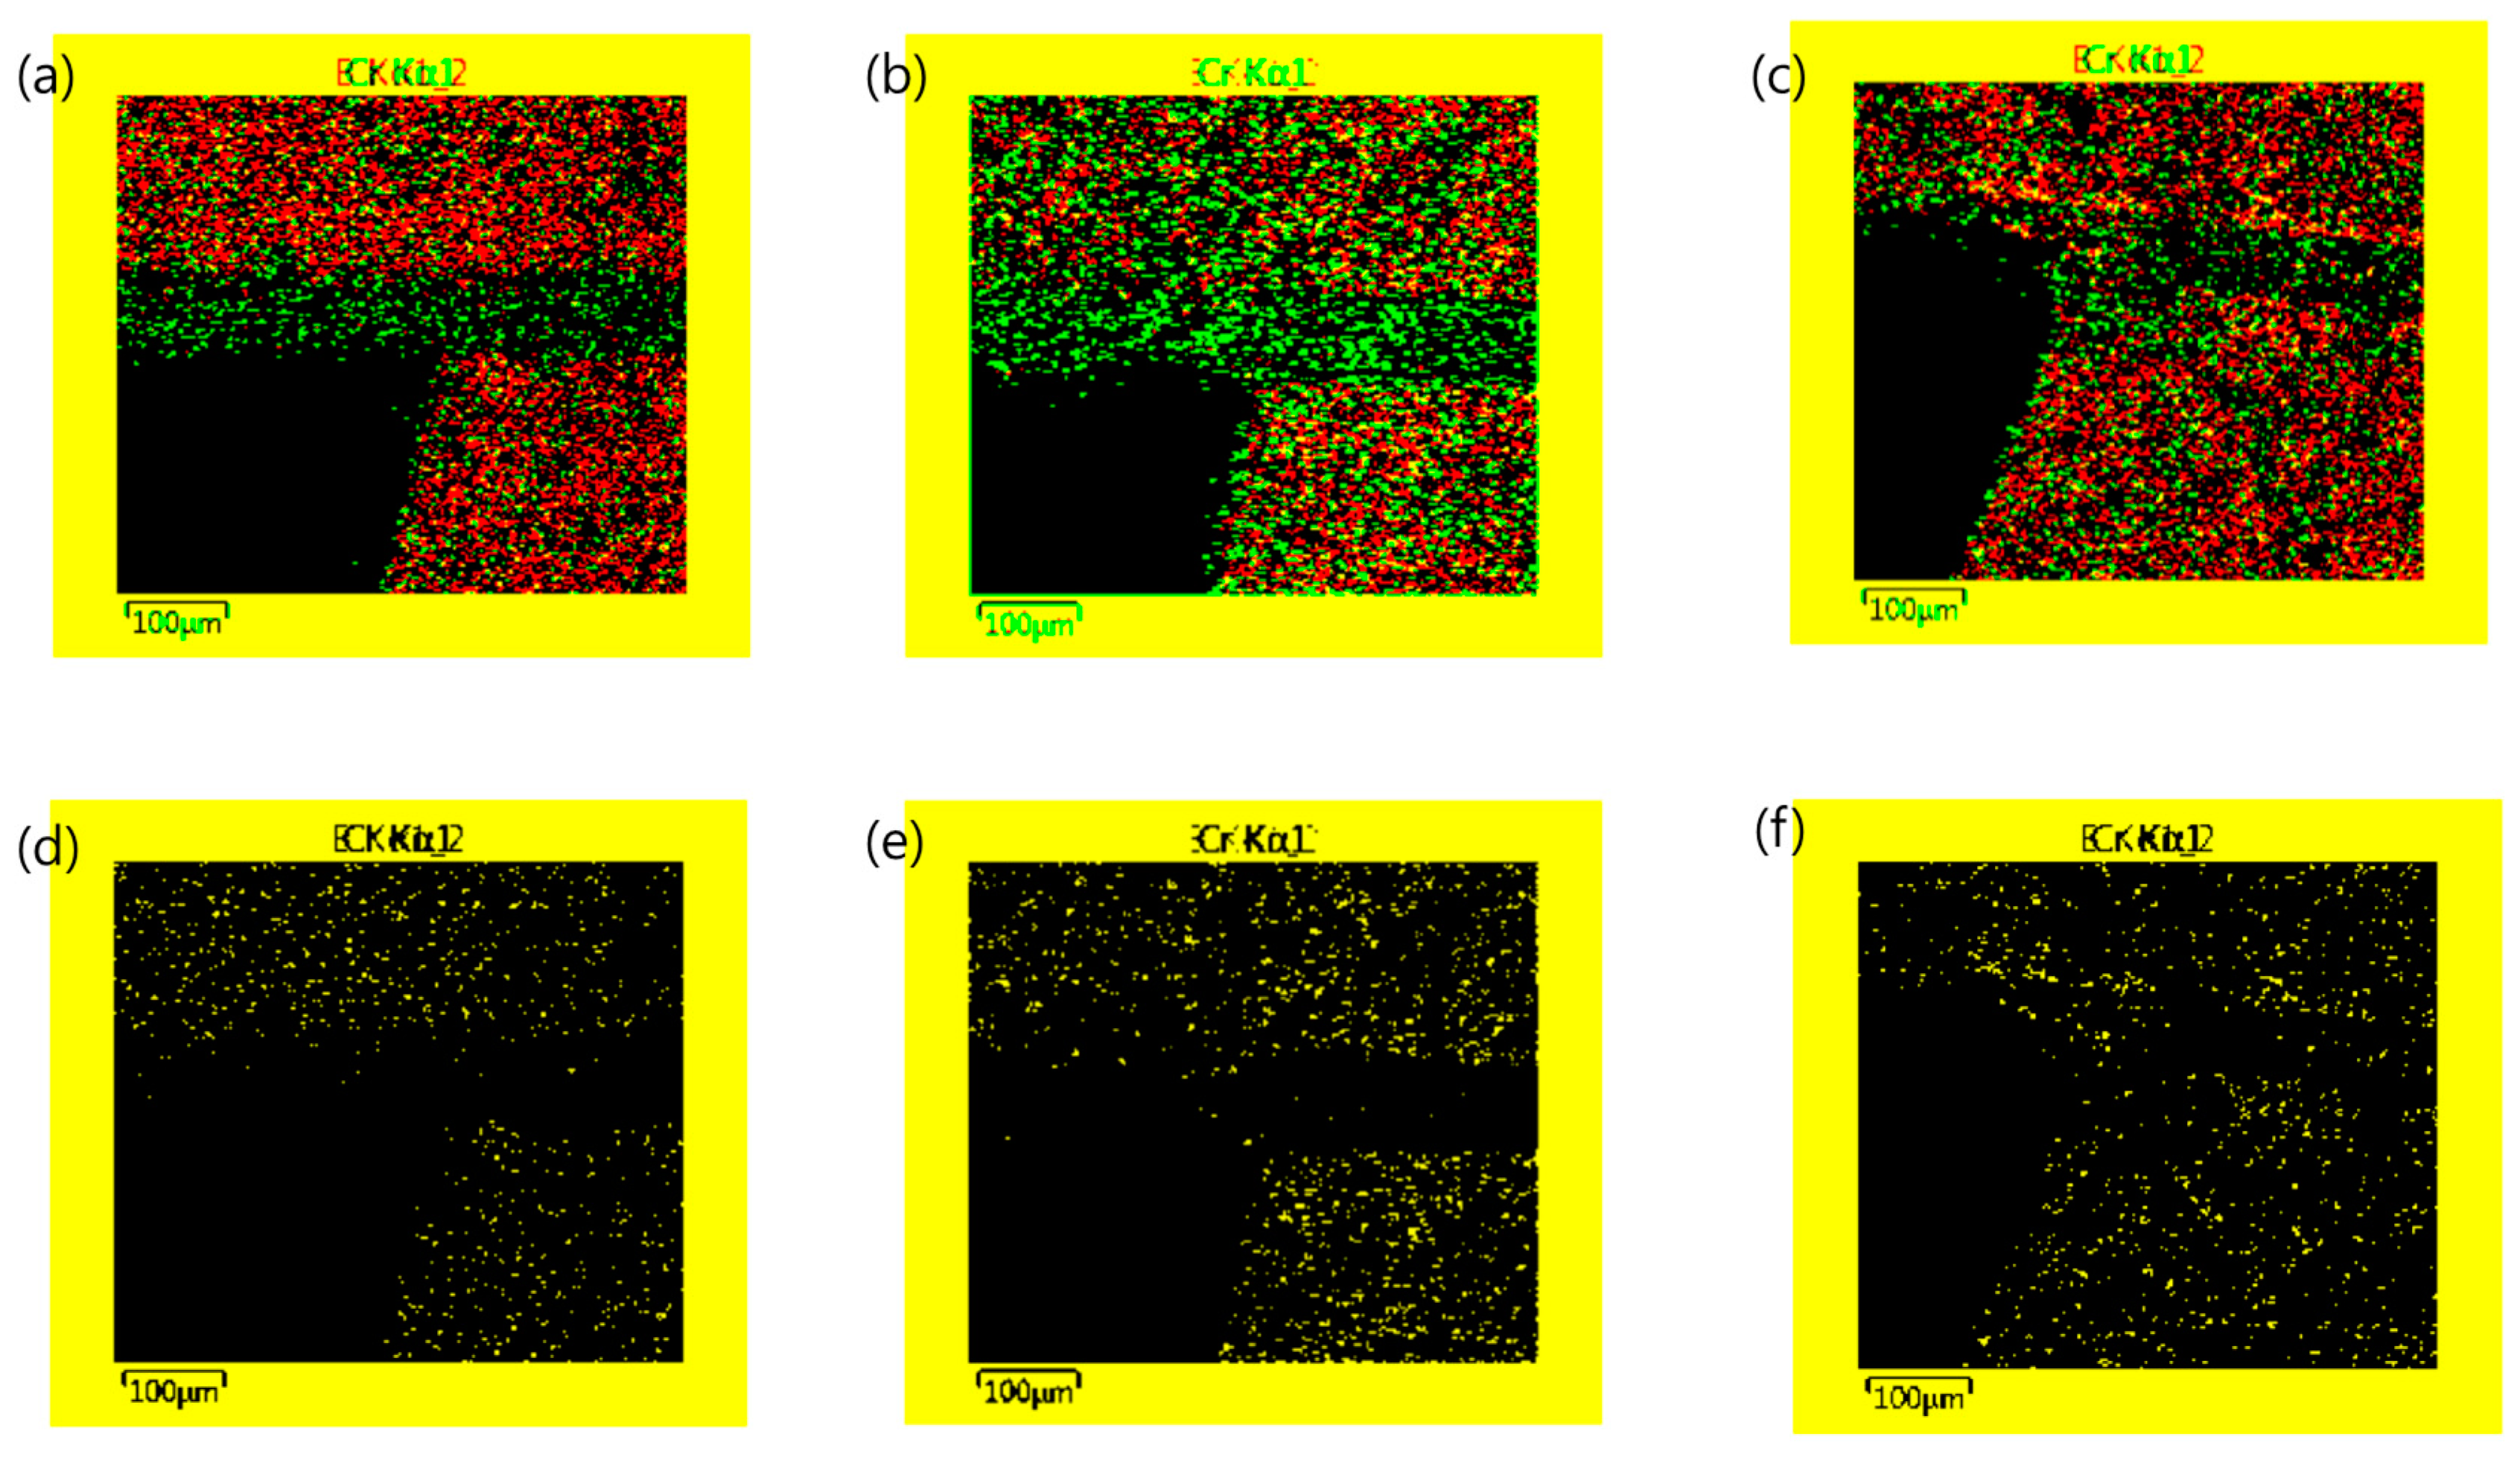
The formation of CrxBy phase at the interface of chromium and boron has been confirmed by researchers [17,18,19,25]. The formation of CrxBy is one of important factors in that CrxBy is brittle and affects the bond strength [18,19]. Figure 11 shows the component distribution of Al, Cr, Fe, and Ni at the interlayer of the Fecralloy/MBF20/Fecralloy brazed joint. The distribution of boron from the mapping was superimposed on the chrome distribution image as shown in Figure 11. Image processing was performed as introduced at previous section and Figure 11a–c show the superimposed images of chrome and boron at the interface of brazed bonding at 900 °C, 950 °C, and 1000 °C. In addition, only CrxBy phase images processed from Figure 11a–c are shown in Figure 11d–f respectively. CrxBy phase was shown only in Fecralloy in Figure 11a, and as the bonding temperature increased, more CrxBy phase image pixels were shown on the filler metal side. In other words, the components of chromium and boron were diffused better at 1000 °C to the opposite metals.
NixAly is the important phase in terms of bonding between Fecralloy and MBF20 in that NixAly is able to provide long term high temperature material strength [17]. Aluminum is included in Fecralloy at a rate of (5% wt) and nickel is contained only in MBF20 (82.24 wt. %). Thus, the distribution of the NixAly phase can be an indicator for determining the degree of brazing of dissimilar metals. Figure 12 shows the result of image processing of the image obtained by joining at each temperature. In each figure, the intensity of the NixAly was higher in the filler metal part that in the other parts. However, the strength of the intensity was varied based on the bonding temperature and used as a basis for judging the bonding degree. In other word, the number of pixels in the NixAly part of the image was counted and the rate of intensity was calculated by dividing that by the number of filler parts, total number of pixels of the red rectangle in Figure 12. As the bonding temperature increased from 900 °C to 1000 °C, the NixAly concentration increased. Table 2 shows the total number of pixels in the red square, the number of NixAly phase pixels, and the ratio of NixAly pixels. The increase in the number of newly formed phase pixels can be deduced that the junction was improving as the junction temperature increased even though the correlation might not be linear.

5. Conclusions

In this work, two different image-processing methods were developed to analyze the bonding quality with the component images from SEM-EDS. Fecralloy plates designed for heat plates were brazed using a filler metal, MBF20 at different temperatures, and the SEM-EDS mapping images of the brazed joint were analyzed using image processing methods. With the first method, the variation of the thickness of the brazed joints depending on brazing temperature was estimated, and it was found that the thickness of the filler material with the boundaries increased as the bonding temperature increased. By assuming that 25% change of the intensity of a component was the bonding boundary, the distance between boundaries were defined as thickness. The thicknesses were 53.8, 64.1, and 115.8 μm at 900, 950, and 1000 °C of bonding temperatures, respectively. In addition, the distribution of CrxBy and NixAly in the analysis using superimposed image processing was analyzed by the second method, and the change of distribution thickness according to the change of brazing temperature was confirmed. In particular, in case of NixAly, the pixel density of the superimposed part of Al and Ni image was calculated using image processing, and the degree of distribution was analyzed quantitatively. By counting the number of overlapping pixels of the components, the newly formed, CrxBy and NixAly phases were found and quantified. The intensities of NixAly were estimated as 62.83%, 67.20%, and 84.57% at 900, 950, and 1000 °C, respectively. From both analysis, it was found that the penetration of filler metal to heat plates was getting deeper and the newly formed phases were getting denser, which meant the bonding quality was improved as the bonding temperature increased.

6. Discussion

We proposed two different methods to analyze the bonding quality using image processing method with the component images from SEM-EDS. The thickness of the filler material increased as the bonding temperature increased, and it is possible to be inferred that a quantitative variation in thickness showed a qualitative change in the degree of diffusion of a substance into the counter material. This analysis can be correlated with other physical test results (e.g., tensile strength measurement) to understand the correlation between image processing analysis and bonding quality. By using the second method, the distribution of CrxBy and NixAly was analyzed, and in case of NixAly, it was found that the intensities increased with the increase of bonding temperature. The strength of bonding related to the change of boundary thickness and quantified distributions of CrxBy and NixAly are able to be used as a predictor of actual bonding strength with a following experiment.

Author Contributions

Conceptualization, J.-H.S. and S.H.Y.; methodology, J.S and H.W.C.; software, J.-H.S.; formal analysis, J.-H.S.; investigation, J.S and H.W.C.; writing—original draft preparation, J.-H.S. and Y.K.; writing—review and editing, J.-H.S.; supervision, J.C, S.H.Y.; project administration, J.S.C. and S.H.Y.; funding acquisition, S.H.Y.

Funding

This project was funded by the Korea Evaluation Institute of Industrial Technology (KEIT) and the Ministry of Trade, Industry & Energy of the Republic of Korea (No. 10067761).

Acknowledgments

This project was supported by the Korea Evaluation Institute of Industrial Technology (KEIT) and the Ministry of Trade, Industry & Energy of the Republic of Korea (No. 10067761).

Conflicts of Interest

The authors declare no conflict of interest.

References

  1. Wang, Y.; Holladay, J.D. (Eds.) Microreactor Technology and Process. Intensification; American Chemical Society: Washington, DC, USA, 2005. [Google Scholar]
  2. Pfeifer, P.; Schubert, K.; Liauw, M.; Emig, G.; Liauw, M. Electrically Heated Microreactors for Methanol Steam Reforming. Chem. Eng. Res. Des. 2003, 81, 711–720. [Google Scholar] [CrossRef]
  3. Kolb, G.; Zapf, R.; Hessel, V.; Löwe, H. Propane steam reforming in micro-channels—Results from catalyst screening and optimisation. Appl. Catal. A Gen. 2004, 277, 155–166. [Google Scholar] [CrossRef]
  4. Men, Y.; Gnaser, H.; Zapf, R.; Hessel, V.; Ziegler, C.; Kolb, G. Steam reforming of methanol over Cu/CeO2/γ-Al2O3 catalysts in a microchannel reactor. Appl. Catal. A Gen. 2004, 277, 83–90. [Google Scholar] [CrossRef]
  5. Ming, Q. Steam reforming of hydrocarbon fuels. Catal. Today 2002, 77, 51–64. [Google Scholar] [CrossRef]
  6. Horny, C.; Kiwi-Minsker, L.; Renken, A. Micro-structured string-reactor for autothermal production of hydrogen. Chem. Eng. J. 2004, 101, 3–9. [Google Scholar] [CrossRef] [Green Version]
  7. Aartun, I.; Venvik, H.J.; Holmén, A.; Pfeifer, P.; Görke, O.; Schubert, K. Temperature profiles and residence time effects during catalytic partial oxidation and oxidative steam reforming of propane in metallic microchannel reactors. Catal. Today 2005, 110, 98–107. [Google Scholar] [CrossRef]
  8. Fichtner, M.; Mayer, J.; Wolf, D.; Schubert, K. Microstructured Rhodium Catalysts for the Partial Oxidation of Methane to Syngas under Pressure. Ind. Eng. Chem. Res. 2001, 40, 3475–3483. [Google Scholar] [CrossRef]
  9. Aartun, I.; Gjervan, T.; Venvik, H.; Görke, O.; Pfeifer, P.; Fathi, M.; Holmén, A.; Schubert, K. Catalytic conversion of propane to hydrogen in microstructured reactors. Chem. Eng. J. 2004, 101, 93–99. [Google Scholar] [CrossRef]
  10. Tonkovich, A.Y.; Zilka, J.L.; LaMont, M.J.; Wang, Y.; Wegeng, R.S. Microchannel Reactors for Fuel Processing Applications. I. Water Gas Shift Reactor. Chem. Eng. Sci. 1999, 54, 2947–2951. [Google Scholar] [CrossRef]
  11. De Miguel, N.; Manzanedo, J.; Thormann, J.; Pfeifer, P.; Arias, P.L. Ni Catalyst Coating on Fecralloy®Microchanneled Foils and Testing for Methane Steam Reforming. Chem. Eng. Technol. 2010, 33, 155–166. [Google Scholar] [CrossRef]
  12. Enger, B.C.; Walmsley, J.; Bjørgum, E.; Lødeng, R.; Pfeifer, P.; Schubert, K.; Holmén, A.; Venvik, H.J. Performance and SEM characterization of Rh impregnated microchannel reactors in the catalytic partial oxidation of methane and propane. Chem. Eng. J. 2008, 144, 489–501. [Google Scholar] [CrossRef]
  13. Koo, K.Y.; Joo, H.; Jung, U.H.; Choi, E.J.; You, S.M.; Yoon, W.L. Novel surface pretreatment for metal structured catalyst. Catal. Today 2011, 164, 52–57. [Google Scholar] [CrossRef]
  14. Schwartz, M.M. Brazing, 2nd ed.; ASM International: Novelty, OH, USA, 2003. [Google Scholar]
  15. Chakraborty, G.; Chaurasia, P.K.; Murugesan, S.; Albert, S.K.; Murugan, S.; Somasundaram, M. Effect of brazing temperature on the microstructure of martensitic–austenitic steel joints. Mater. Sci. Technol. 2017, 33, 1372–1378. [Google Scholar] [CrossRef]
  16. Chen, H.; Feng, K.; Wei, S.; Xiong, J.; Guo, Z.; Wang, H. Microstructure and properties of WC–Co/3Cr13 joints brazed using Ni electroplated interlayer. Int. J. Refract. Met. Hard Mater. 2012, 33, 70–74. [Google Scholar] [CrossRef]
  17. Leone, E.A.; Rabinkin, A.; Sarna, B. Microstructure of Thin-Gauge Austenitic and Ferritic Stainless Steel Joints Brazed using Metglas® Amorphous Foil. Weld. World 2006, 50, 3–15. [Google Scholar] [CrossRef]
  18. Park, D.Y.; Lee, S.K.; Kim, J.K.; Lee, S.N.; Park, S.J.; Oh, Y.J. Image processing-based analysis of interfacial phases in brazed stainless steel with Ni-based filler metal. Mater. Charact. 2017, 130, 278–284. [Google Scholar] [CrossRef]
  19. Park, D.Y.; Lee, S.K.; Oh, Y.J. Taguchi Analysis of Relation Between Tensile Strength and Interfacial Phases Quantified via Image Processing. Met. Mater. Trans. A 2018, 49, 4684–4699. [Google Scholar] [CrossRef]
  20. Kar, A.; Mandal, S.; Venkateswarlu, K.; Ray, A.K. Characterization of interface of Al2O3–304 stainless steel braze joint. Mater. Charact. 2007, 58, 555–562. [Google Scholar] [CrossRef]
  21. Kar, A.; Ray, A.K. Characterization of Al2O3–304 stainless steel braze joint interface. Mater. Lett. 2007, 61, 2982–2985. [Google Scholar] [CrossRef]
  22. Jadoon, A.; Ralph, B.; Hornsby, P. Metal to ceramic joining via a metallic interlayer bonding technique. J. Mater. Process. Technol. 2004, 152, 257–265. [Google Scholar] [CrossRef]
  23. Miab, R.J.; Hadian, A. Effect of brazing time on microstructure and mechanical properties of cubic boron nitride/steel joints. Ceram. Int. 2014, 40, 8519–8524. [Google Scholar] [CrossRef]
  24. Lemus-Ruiz, J.; Verduzco, J.; González-Sánchez, J.; López, V. Characterization, shear strength and corrosion resistance of self joining AISI 304 using a Ni Fe–Cr–Si metallic glass foil. J. Mater. Process. Technol. 2015, 223, 16–21. [Google Scholar] [CrossRef]
  25. Yuan, X.; Kim, M.B.; Cho, Y.H.; Kang, C.Y. Microstructures, Mechanical and Chemical Properties of Tlp-Bonded Joints in a Duplex Stainless Steel with Amorphous Ni-Based Insert Alloys. Metall. Mater. Trans. A 2012, 43, 1989–2001. [Google Scholar] [CrossRef]
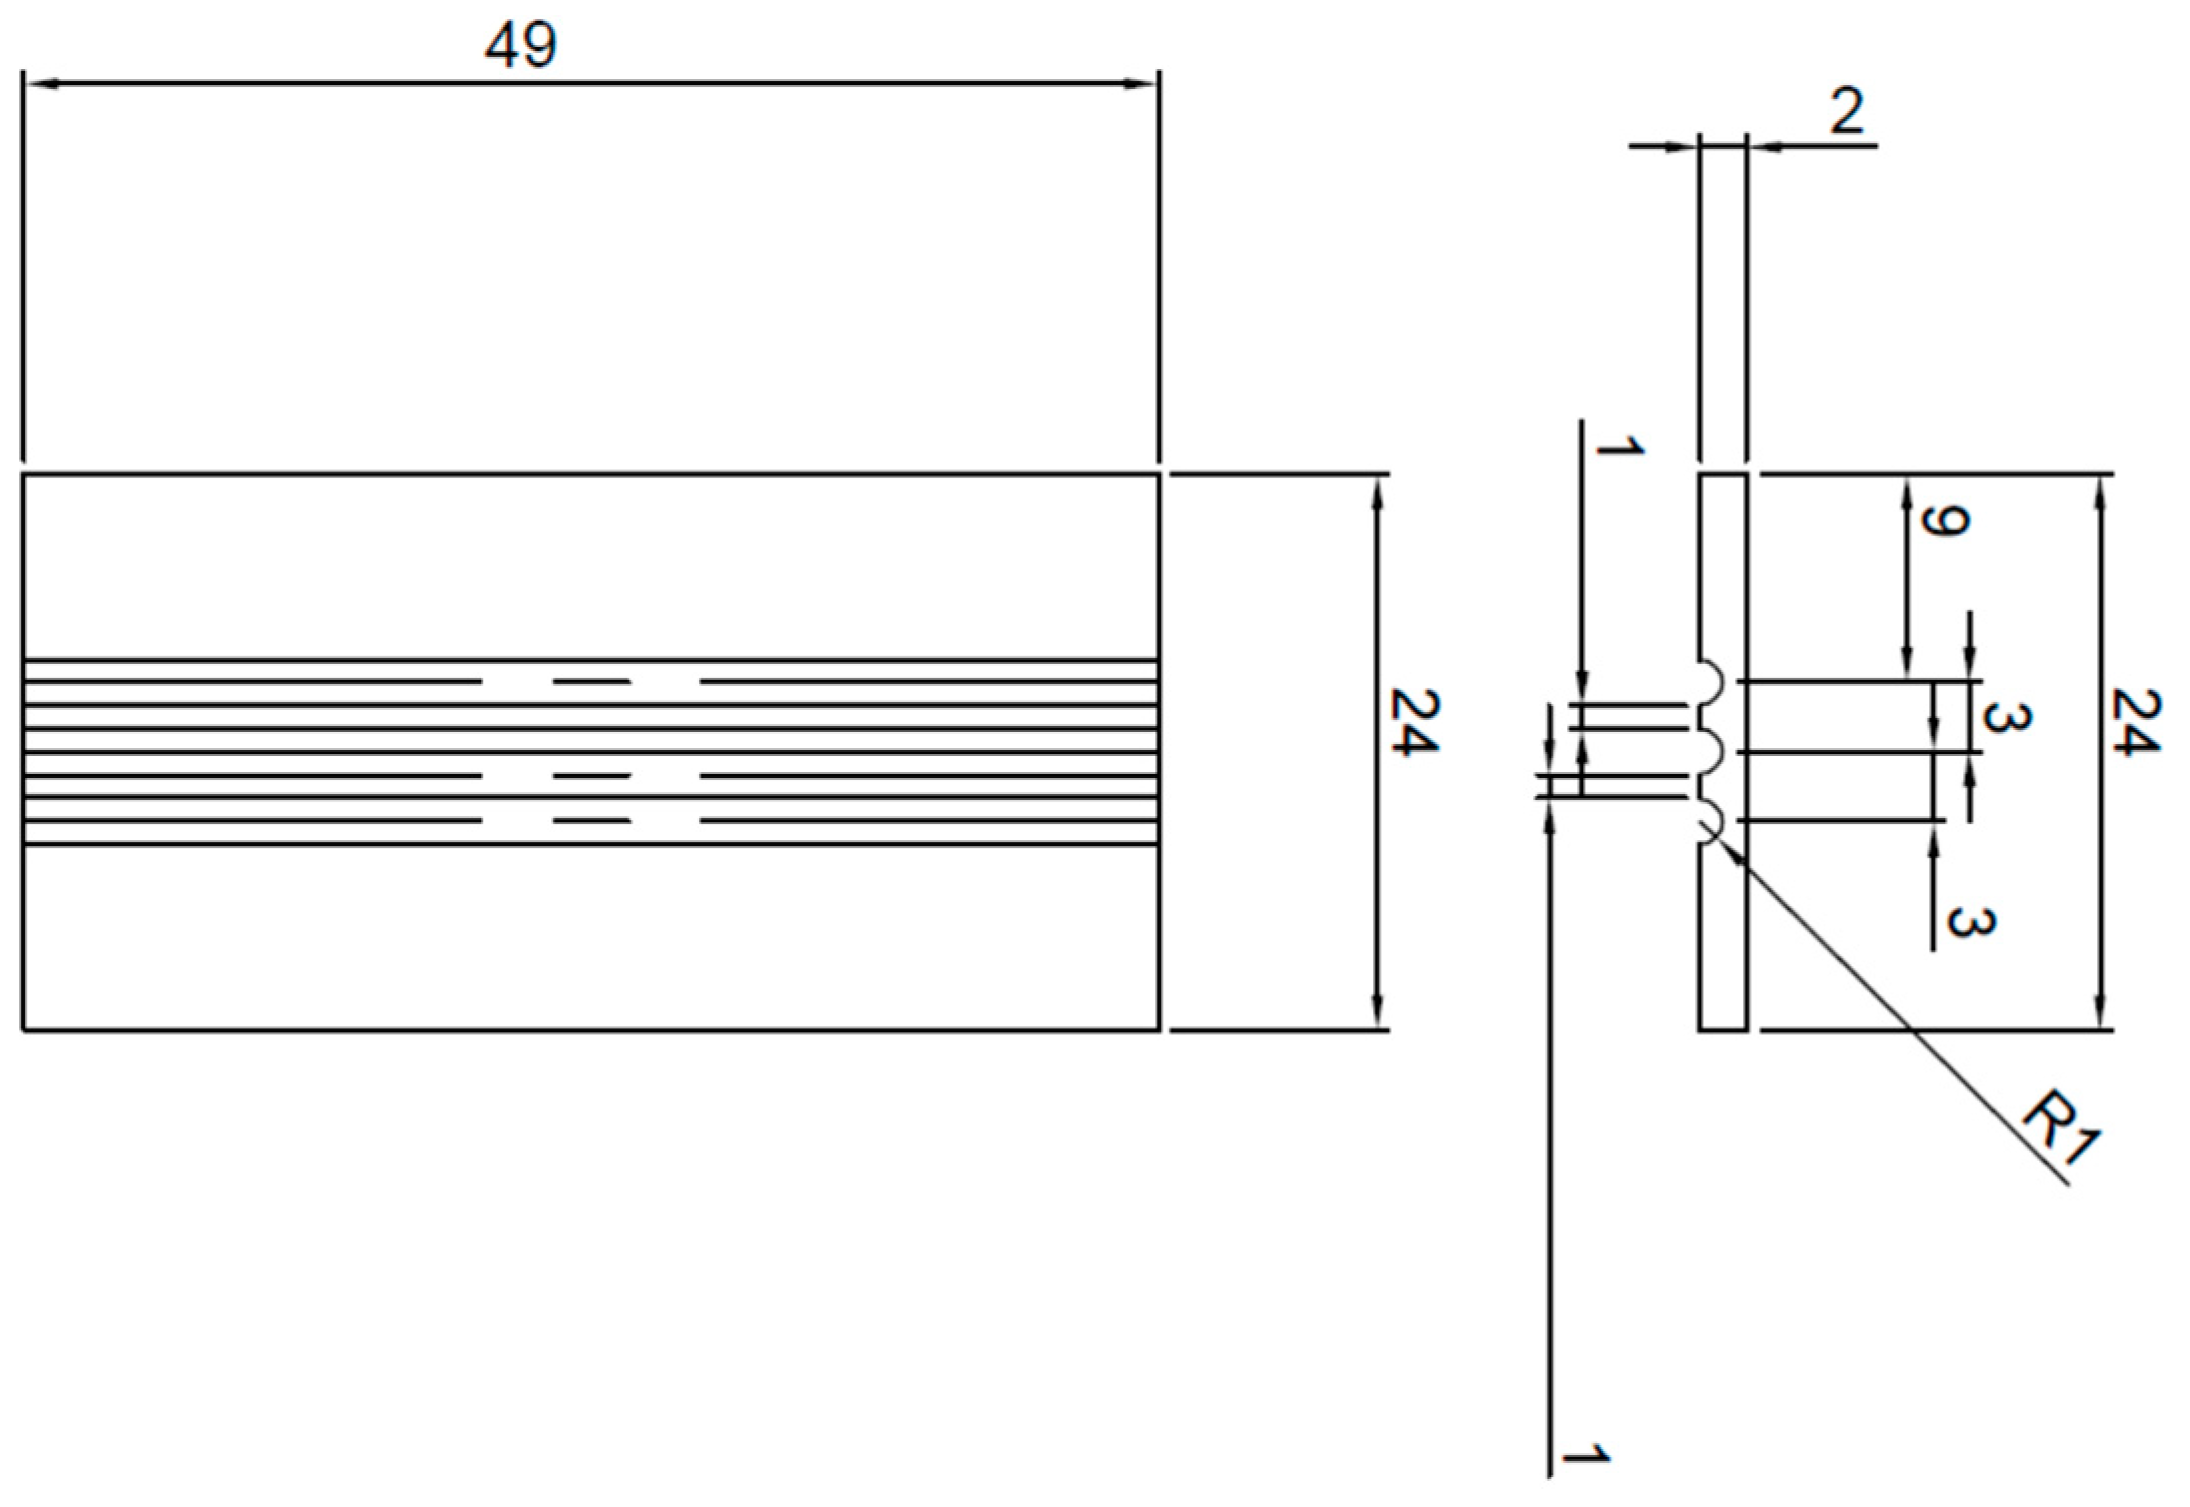
Figure 1. Design of channeled Fecralloy plate.
Metals 09 01139 g001
Figure 2. Temperature profile for brazing.
Metals 09 01139 g002
Figure 3. SEM-EDS mapped images for Al, Cr, Fe, and Ni bonded at 900 °C. Lines were drawn in the range to measure the thickness of filler.
Metals 09 01139 g003
Figure 4. The variation of RGB values along each pixel column and the averaged values in red for each component.
Metals 09 01139 g004
Figure 5. Averaged RGB values along pixel columns of each component were superimposed.
Metals 09 01139 g005
Figure 6. Image processing algorithm. (a) Original image of Cr read with MATLAB (b) Converted to binary image in red of Cr (c) Original image of B read with MATLAB (d) Converted to binary image in green of B (e) Superimposed image of binary red Cr and binary green B (f) Extraction of superimposed pixels.
Metals 09 01139 g006
Figure 7. Microscopic image of the bonding between Fecralloy and MBF20 at 1000 °C.
Metals 09 01139 g007
Figure 8. SEM-EDS image of the bonding at 1000 °C.
Metals 09 01139 g008
Figure 9. Image processing analysis for the thickness of filler metal at (a) 900 °C (b) 950 °C (c) 1000 °C.
Metals 09 01139 g009aMetals 09 01139 g009b
Figure 10. Maximum filler boundary thickness depending on bonding temperature.
Metals 09 01139 g010
Figure 11. Distribution of chromium, boron, and CrxBy phase through image processing. Superimposed images of chromium and boron (a) at 900 °C (b) at 950 °C (c) at 1000 °C. Distribution of CrxBy phase (d) at 900 °C (e) at 950 °C (f) at 1000 °C.
Metals 09 01139 g011
Figure 12. Distribution of NixAly phase at (a) 900 °C (b) 950 °C (c) 1000 °C. Red square is the area that measures the intensity of NixAly.
Metals 09 01139 g012
Table 1. Chemical compositions of Fecralloy and MBF20.
Chem. comp. [wt. %]FeCrAlCMnSiYZrBNi
FecralloyBal.22.005.000.020.020.300.100.10--
MBF203.007.00-0.06-4.50--3.20Bal.
Table 2. Results of image processing analysis depending on temperatures.
Bonding temp. (°C)# of NixAly pixels# of pixels in red sqr.Intesity (# of NixAly pixels/# of pixels in red sqr., %)
9003790603262.83%
9504989742467.20%
10007662906084.57%