Article

Bending and Torsion Fatigue-Testing Machine Developed for Multiaxial Non-Proportional Loading

1
Department of Mechanical Engineering, College of Science and Engineering, Ritsumeikan University, Kyoto 525-8577, Japan
2
Graduate School of Science & Engineering, Ritsumeikan University, Kyoto 525-8577, Japan
*
Author to whom correspondence should be addressed.
Metals 2019, 9(10), 1115; https://doi.org/10.3390/met9101115
Submission received: 19 September 2019 / Revised: 9 October 2019 / Accepted: 14 October 2019 / Published: 18 October 2019
(This article belongs to the Special Issue Multiaxial Fatigue: Testing and Modelling)

Abstract

:
A new fatigue-testing machine was developed to perform high-cycle multiaxial fatigue tests at 50 Hz, in order to reduce testing time. The developed machine can combine bending and torsion loading and perform fatigue tests at a high frequency, under proportional and non-proportional loading conditions, where the principal stress direction changes during a cycle. The proportional loading is cyclic bending loading, and the non-proportional loading is cyclic, combining bending and reversed torsion loading. In this study, the effectiveness of the testing machine was verified by conducting tests under these loading conditions, using specimens of type 490A hot-rolled steel and type 304 stainless steel. The fatigue life linked to bending loading obtained using the new testing machine was slightly extended compared with that obtained using the conventional fatigue-testing machine. The fatigue life derived as a result of a combination of bending and torsion was comparable to that obtained using the conventional fatigue-testing machine, although a fatigue limit reduction of 100 MPa was observed compared to the former study. The feasibility of tests using the developed multiaxial fatigue-testing machine was confirmed.

1. Introduction

Machines and structures, such as vehicles, ships, and bridges, experience multiaxial fatigue loads, which leads to shortened fatigue life. In particular, many components are subjected to non-proportional multiaxial loading, in which the principal directions of stress and strain change during a cycle, further reducing fatigue life [1,2,3,4,5,6,7]. Therefore, taking into account that non-proportional multiaxial fatigue damage in mechanical design is important for the safety and reliability of actual components, low-cycle fatigue properties under non-proportional multiaxial fatigue conditions have been widely investigated, and strain parameters or other fatigue life correlation parameters, such as critical plane models, verified specifically for low-cycle regions under non-proportional multiaxial loading, have been proposed [5,6,7]. However, limited data exist on fatigue properties in high-cycle regions under non-proportional multiaxial fatigue; performing fatigue tests in high-cycle regions (above 105 cycles) is time-consuming, and currently, only a small number of testing machines are suitable for non-proportional multiaxial fatigue in high-cycle regions. Regarding high-cycle multiaxial fatigue, Itoh et al. performed stress-controlled tension–torsion multiaxial fatigue tests for structural rolled steel type SS400 [8]. In the low-cycle region, fatigue endurance was extended under non-proportional loading compared with proportional loading, because additional hardening led to decreasing strain value, which dominated fatigue life under non-proportional loading. On the other hand, the fatigue limit at 107 cycles was decreased under non-proportional loading [8]. This was the result of intensive movement of dislocation and crack initiation at low stress under non-proportional loading. Therefore, it is important to investigate the high-cycle multiaxial fatigue properties of structural components to assure structural safety. However, it takes almost 2 months to perform fatigue tests at 107 cycles using a conventional electric servohydraulic multiaxial fatigue-testing machine, with a test frequency of ~2 Hz. The maximum testing frequency of multiaxial fatigue tests achieved to date is 4 Hz, performed by Nelson and Rostami [9].
This study aimed to propose a new multiaxial testing machine for high-cycle fatigue. A motor-assisted high-cycle fatigue-testing machine for cyclic bending and reversed torsion was developed to perform multiaxial fatigue tests at high frequency, up to 50 Hz, in order to perform 107 cycles in 3 days. This paper presents the basic aspects of the fatigue-testing machine and, utilizing the developed testing machine, the tests results obtained for two steel types: 490A hot-rolled steel and type 304 stainless steel. Fatigue data were compared with those obtained by a conventional electric servohydraulic multiaxial fatigue-testing machine, and fracture surfaces were observed. The characteristics of the testing machine are discussed herein based on the resulting fatigue data.

2. Development of the Testing Machine
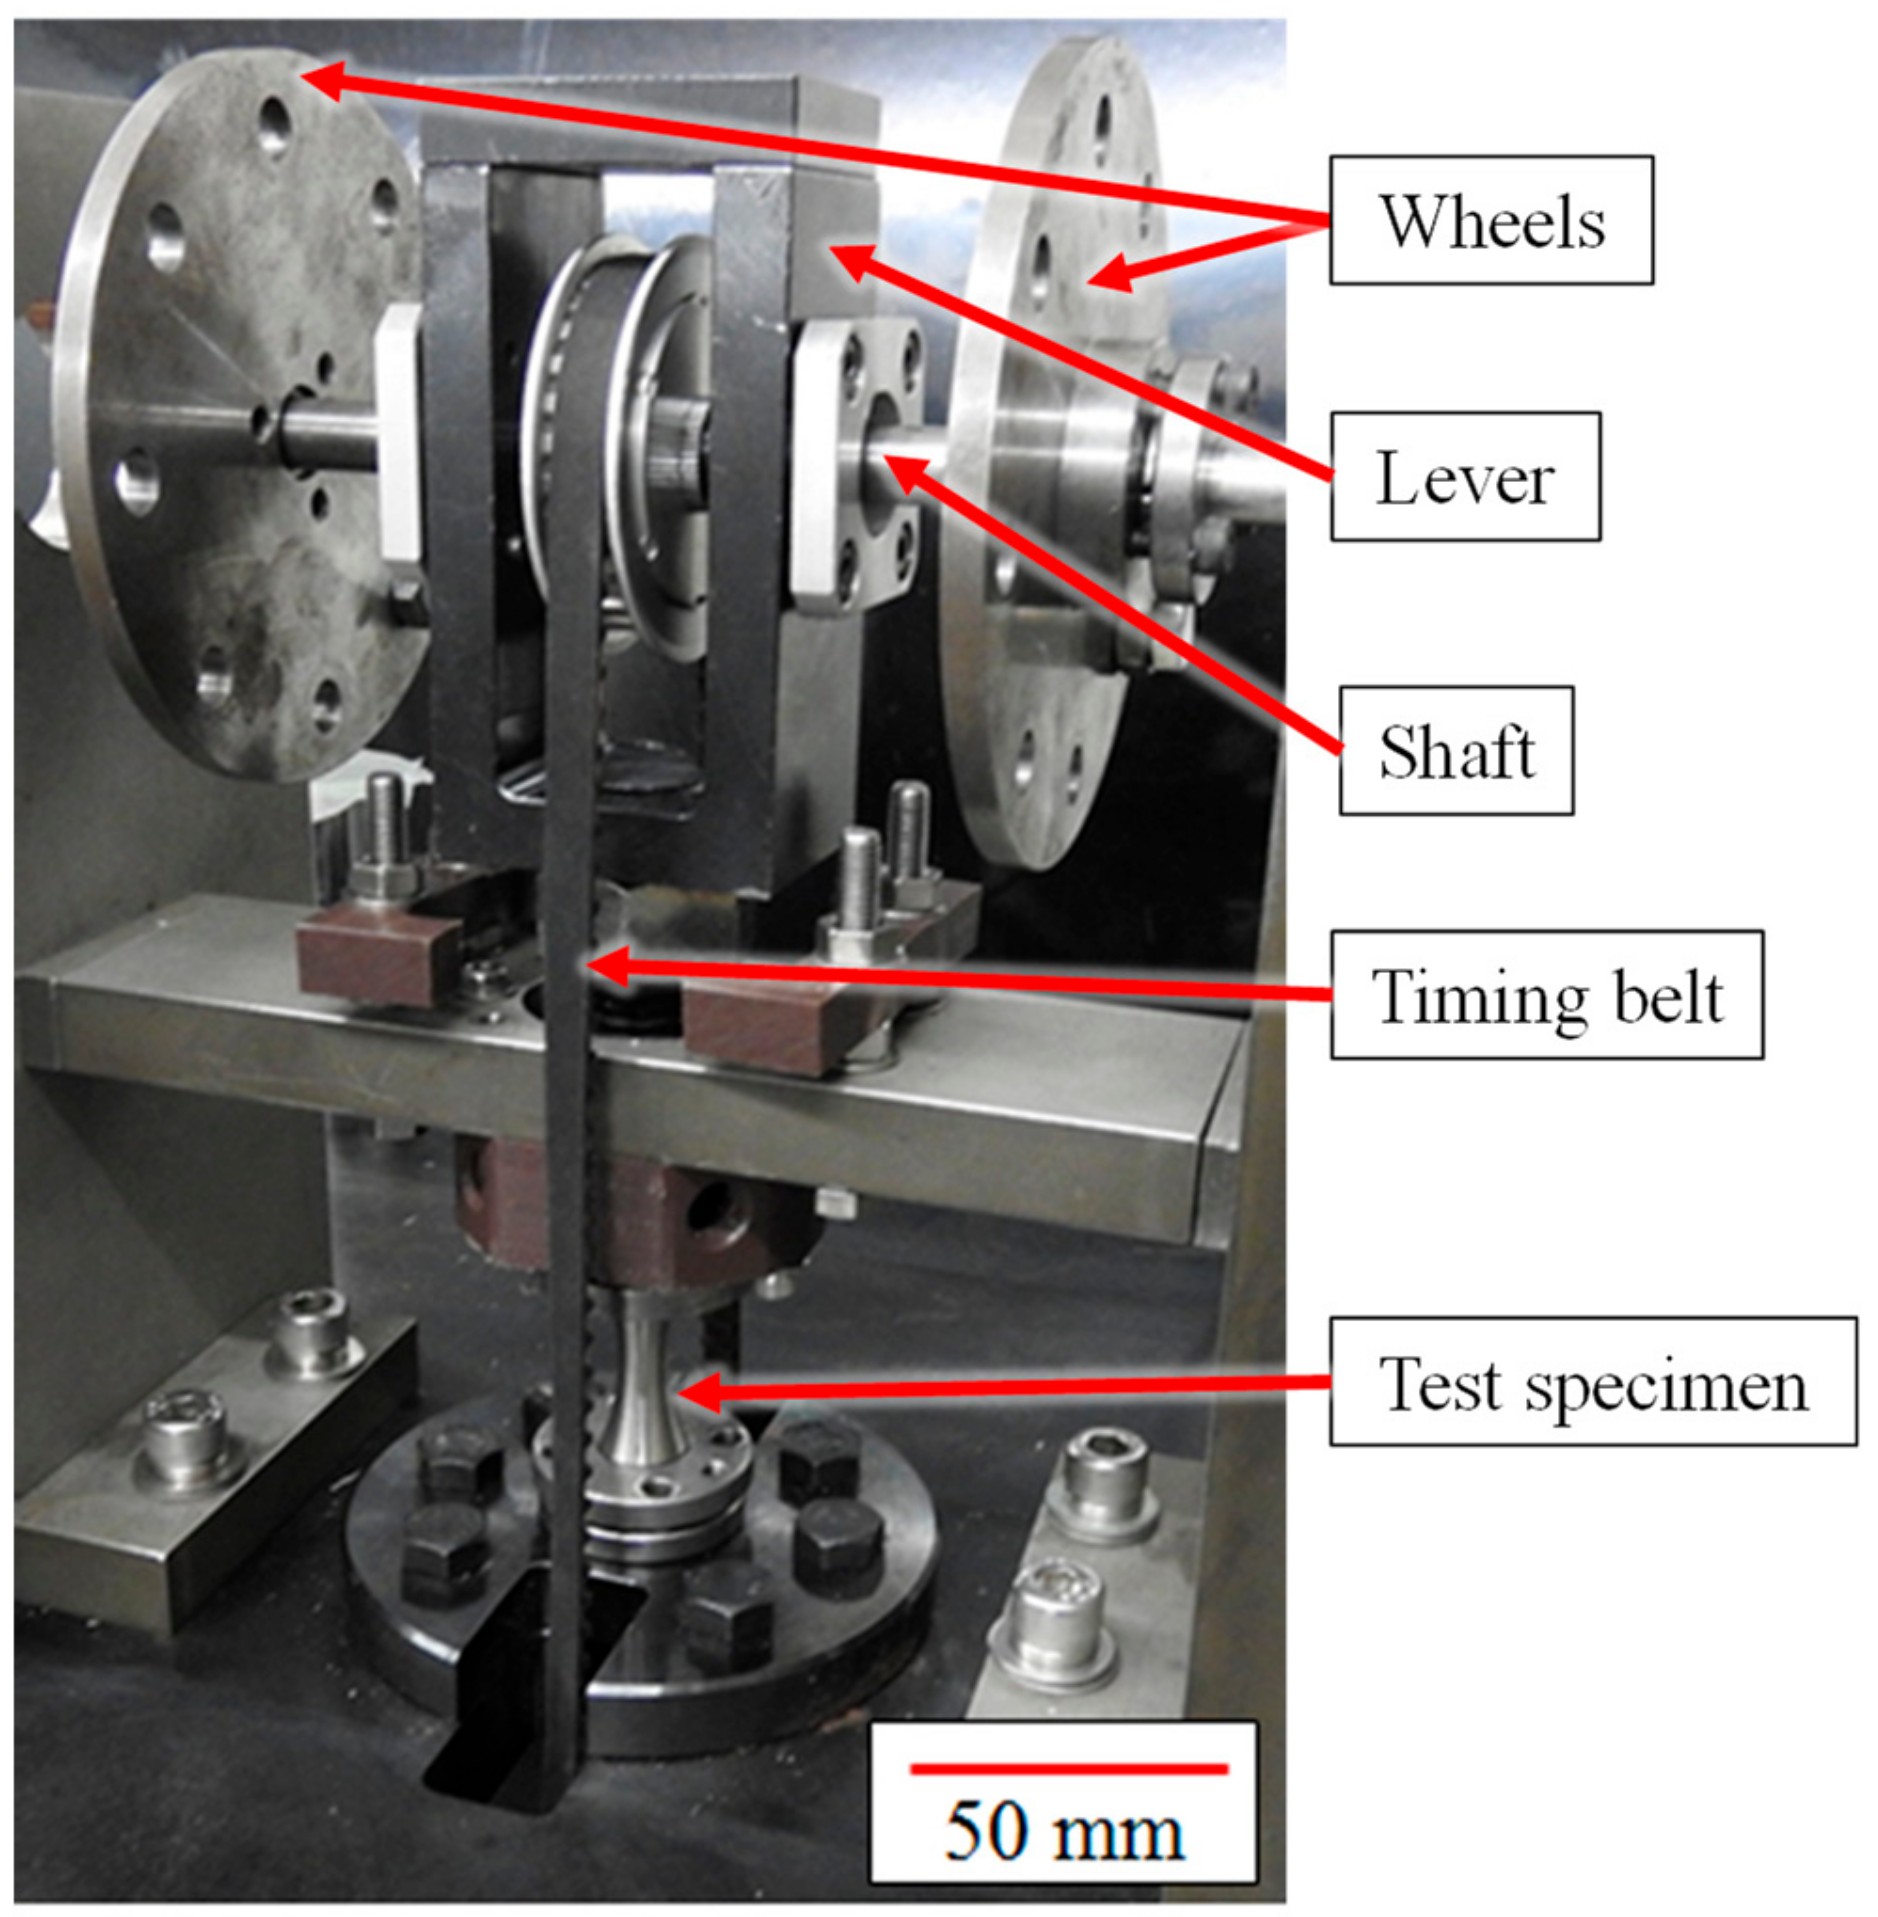
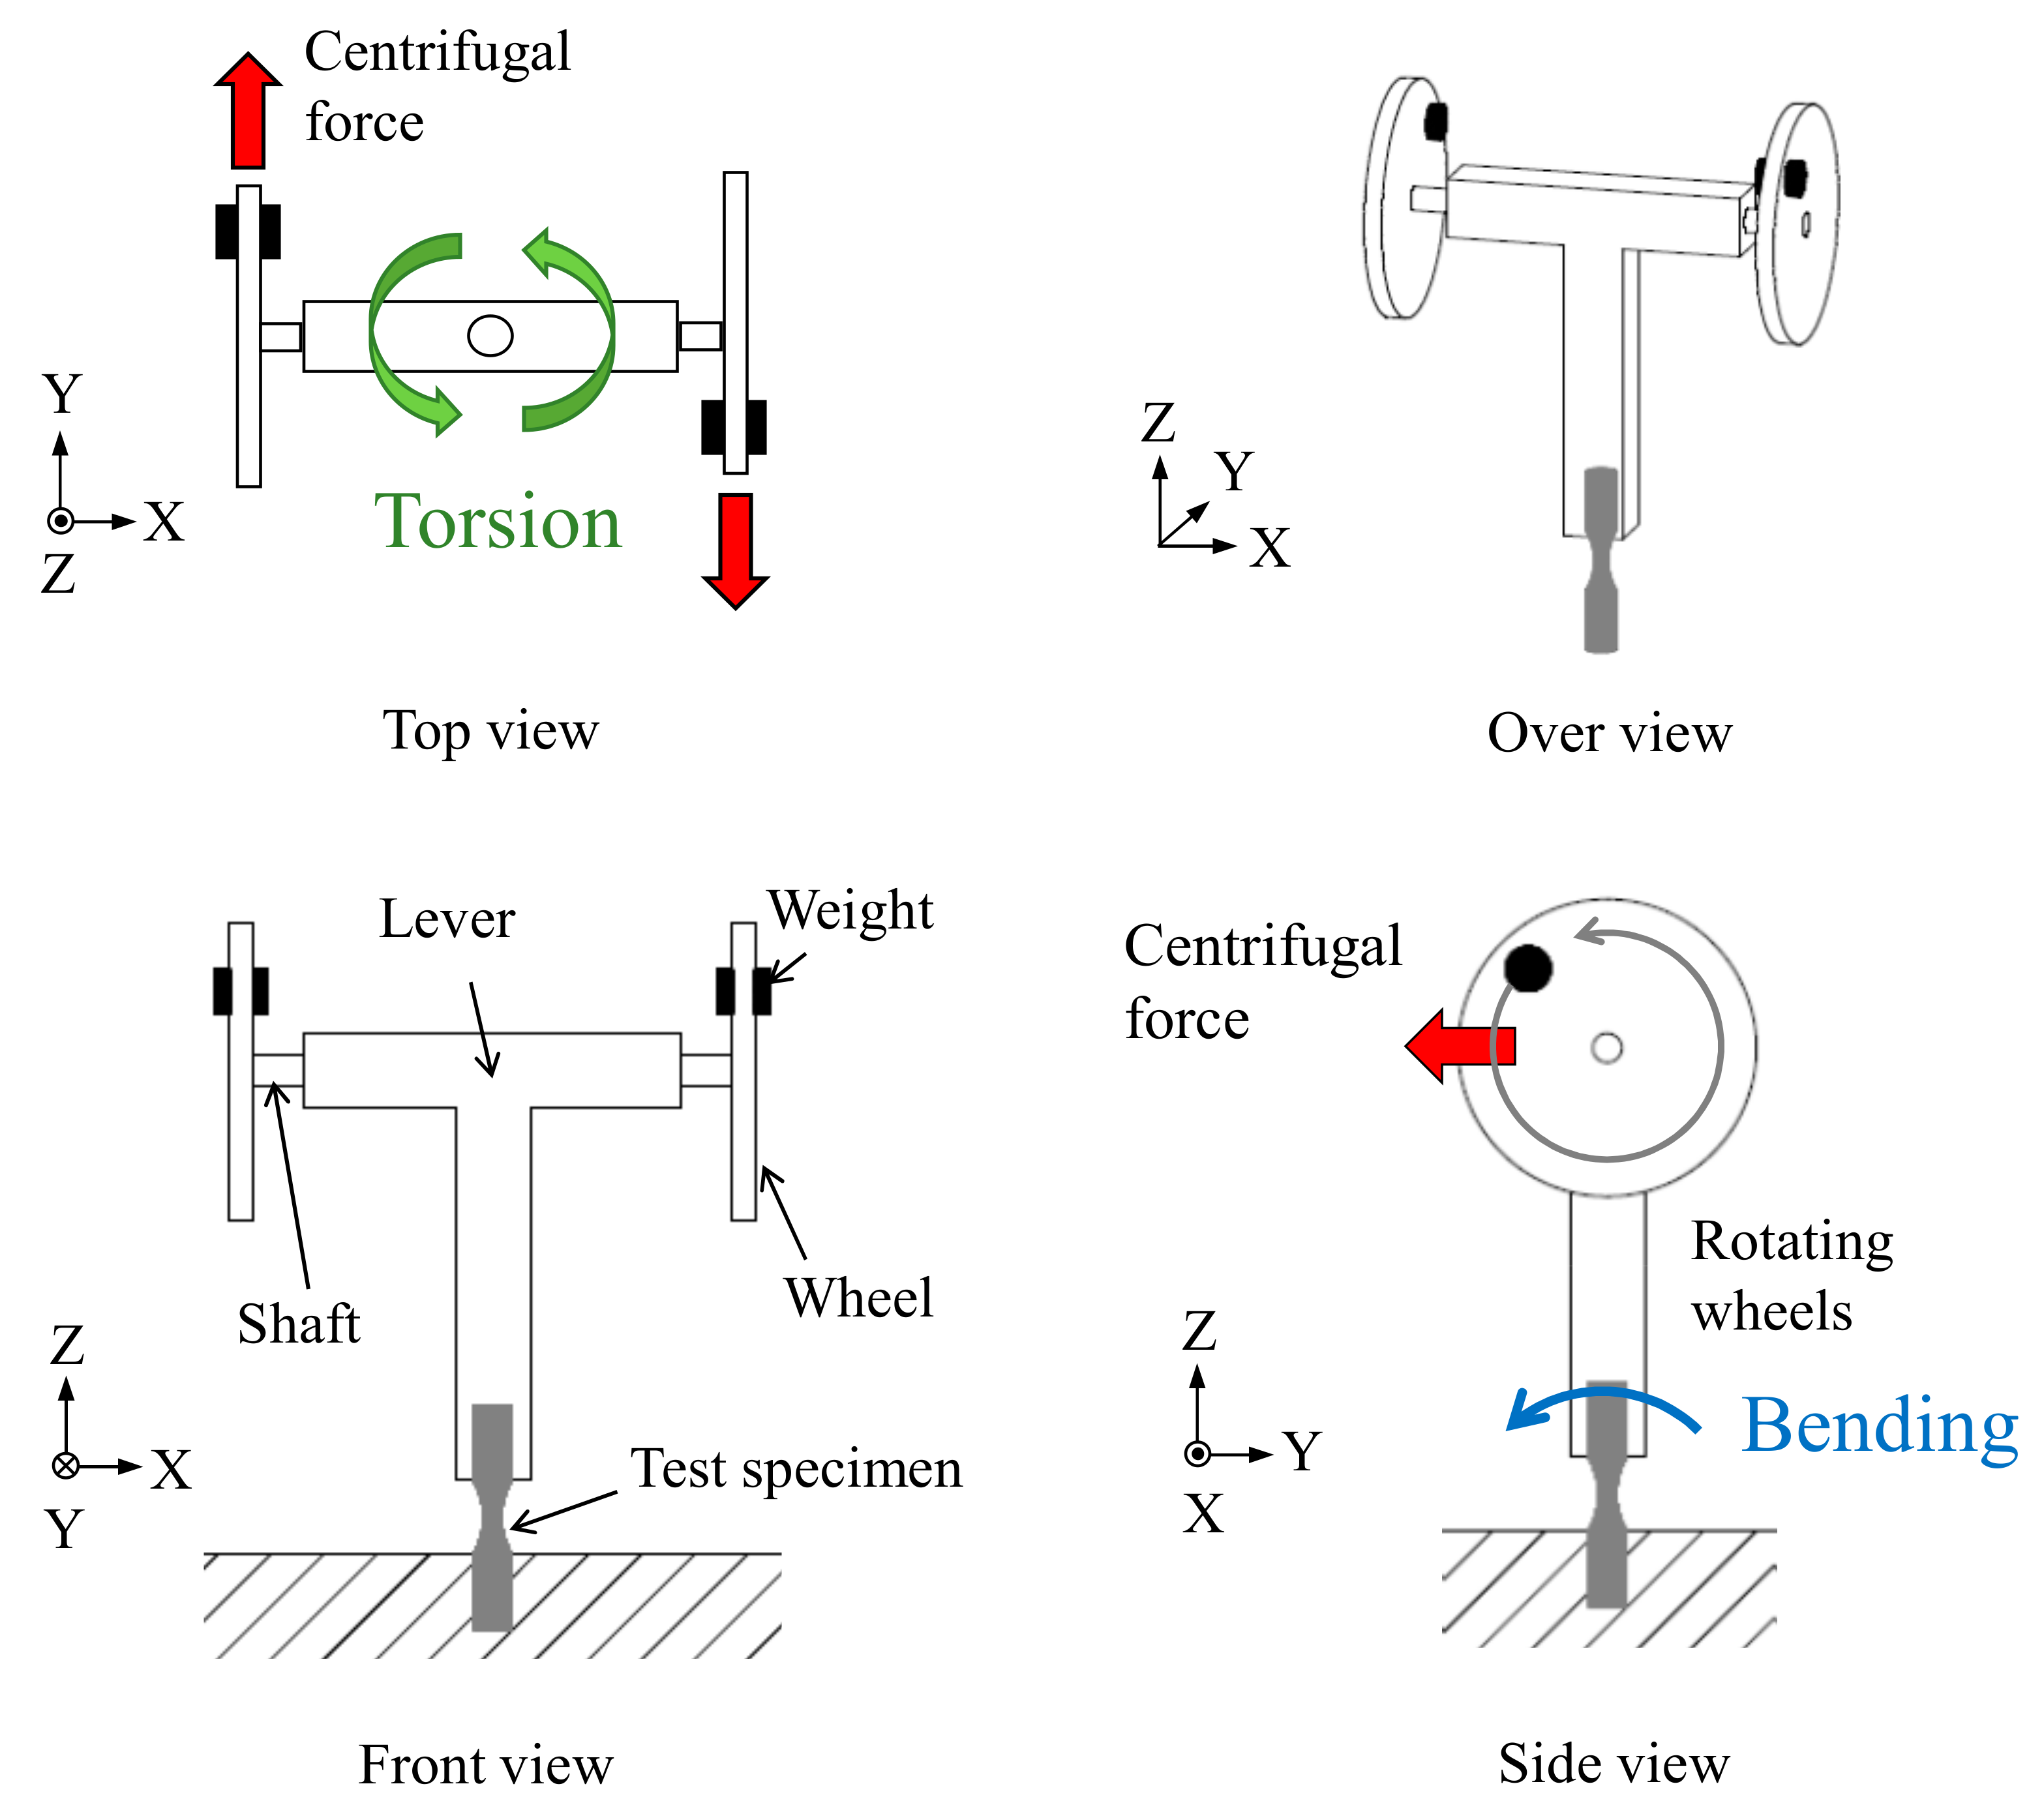
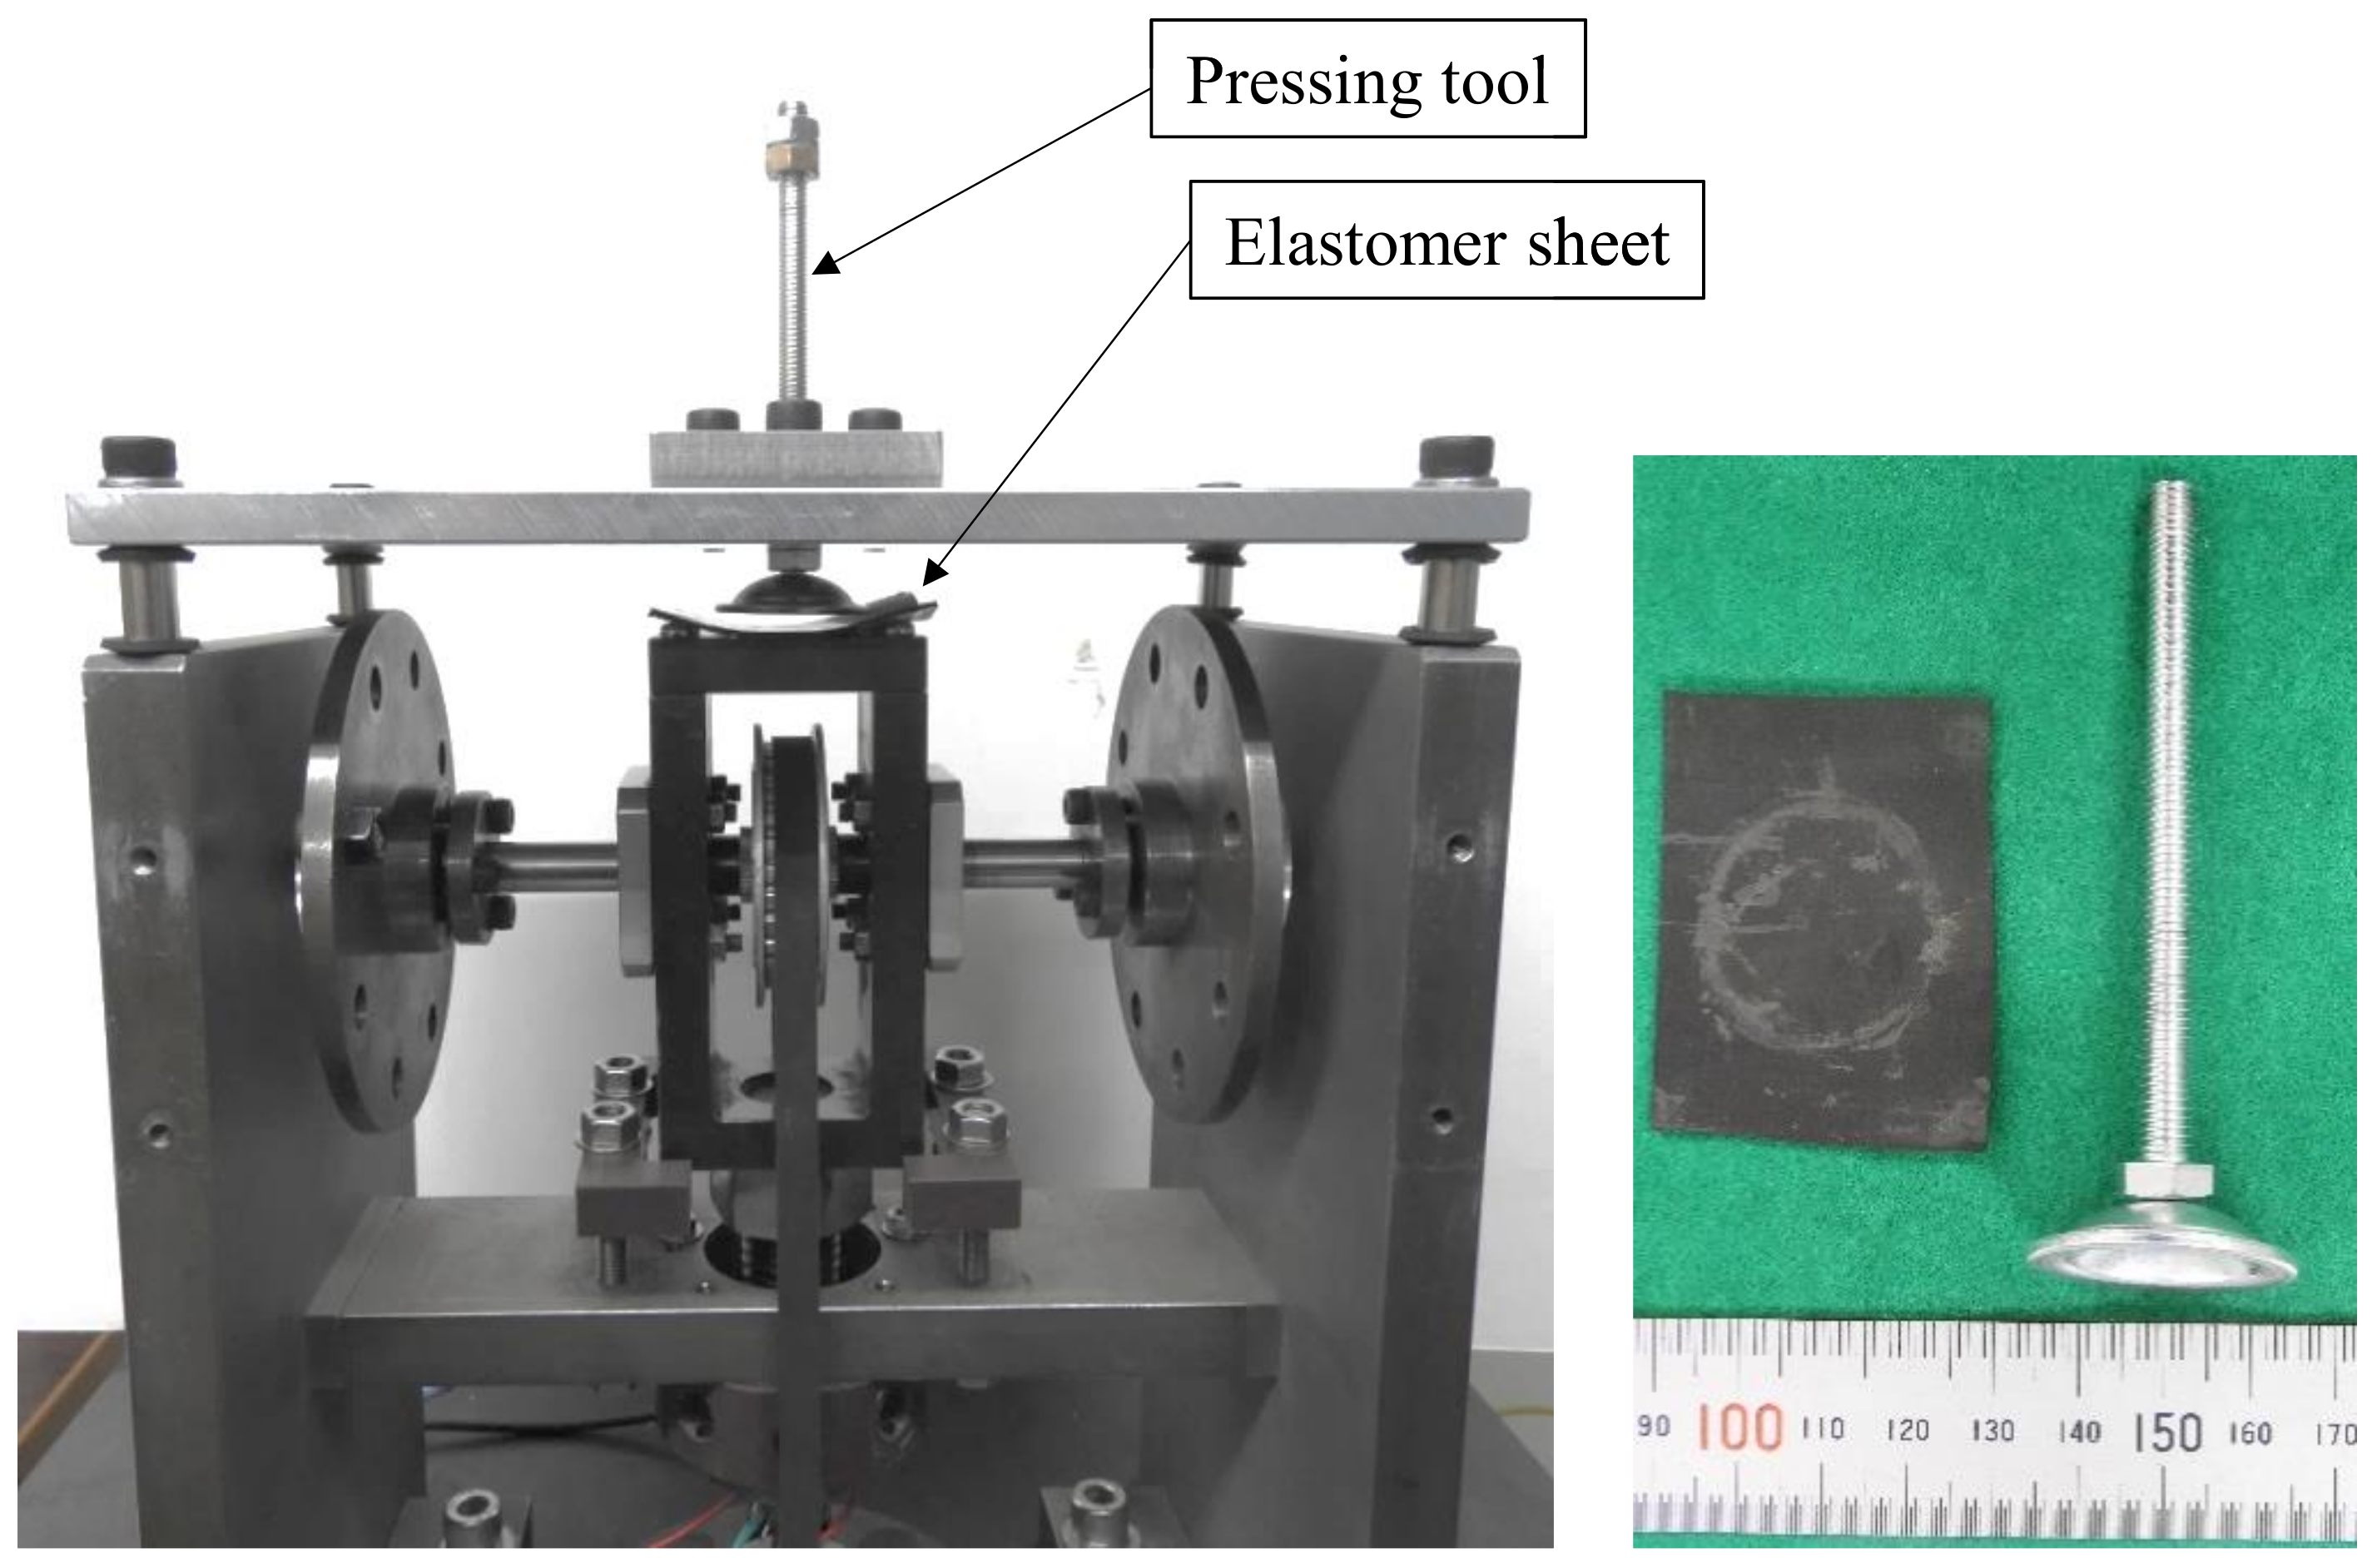
2.1. Basic Concept

The developed fatigue-testing machine can apply cyclic bending and reversed torsion loading. Figure 1 presents a photo image of the testing machine. The machine dimensions are as follows: 600 mm in height, 400 mm in width, and 400 mm in depth. This test machine comprises a revolution control motor, a timing belt, wheels, a shaft connecting the bilateral wheels, weights attached onto the wheels, and a test specimen.
Figure 2 presents a schematic diagram showing the mechanism of the developed testing machine. Both wheels and weights were rotated by the revolution control motor via the timing belt. The core idea of the testing machine was that the loading head, comprising the overhead wheels, would be balanced above the specimen. The rotation of the wheels induced inertial forces on the specimen. Depending on the position of the weights, both bending and torsion loading could be generated, as presented in Figure 2. With no weights on the wheels, almost no bending occurred on the specimen because the specimen and timing belt were not directly connected. The maximum axial stress and bending stress could be changed depending on the amount of weight, as is discussed later. A wide range of specimen geometry could be applied using a cylinder and round bar specimen. In the conventional servohydraulic fatigue-testing machine, the test frequency is relatively low because of the characteristics of the hydraulic cylinder. However, for the testing machine developed by this research, testing at high frequency could be achieved because of the inertial force generated by the rotation of the wheels. The drawback of the testing machine is that the stress range cannot be obtained directly and must be calculated from the strain value. The stress range that can be achieved using the developed testing machine was limited because this testing machine used the power generated near the resonance point of the specimen, as is discussed later.

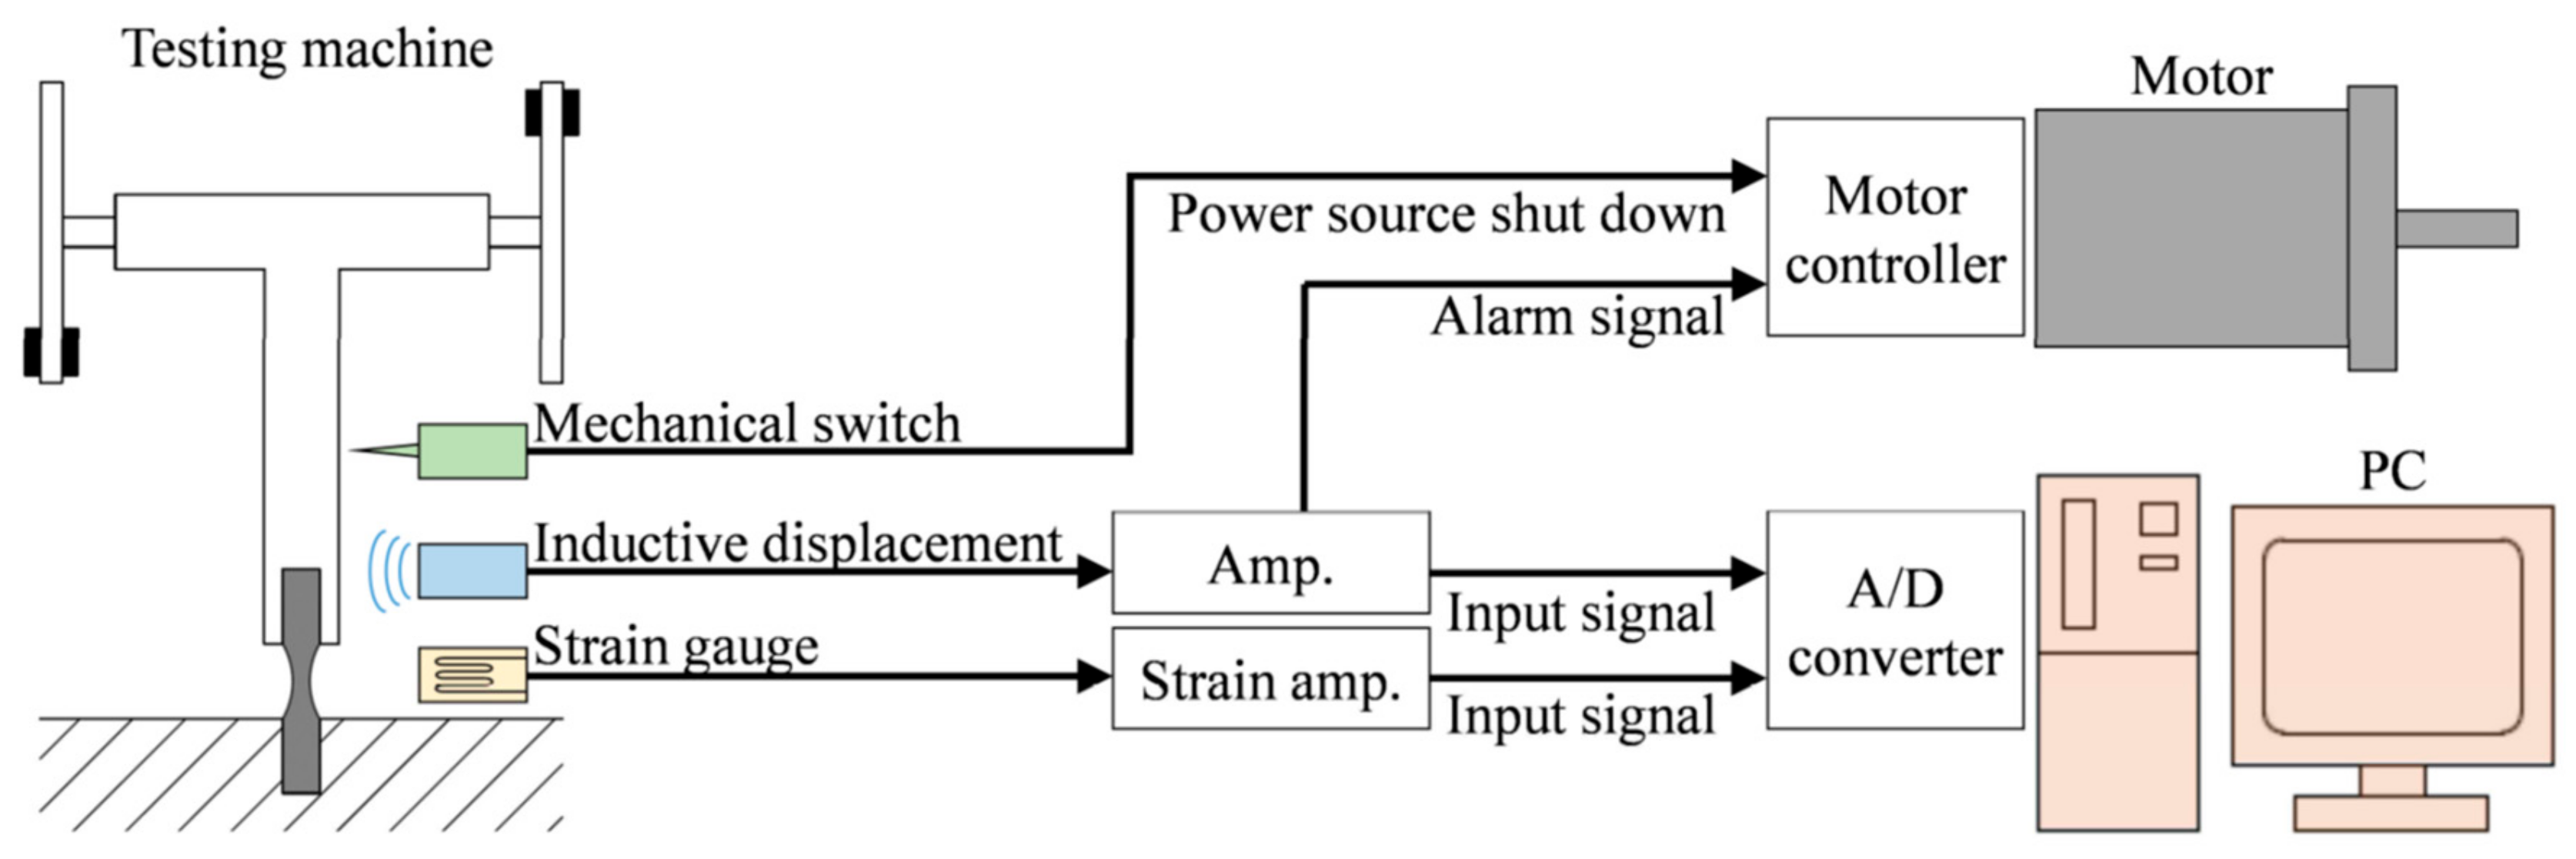
2.2. Measurement and Control System

Three types of sensors were installed for controlling the machine and for measuring vibration and strain (see Table 1 and Figure 3):
The mechanical switch detected excessive vibration of the testing machine and shut down the power source of the driving motor in case of rupture of the test specimen, or when an uncontrollable event occurred. The inductive displacement sensor measured the change in position and the displacement of the lever due to bending and torsion loading via the non-contact mode. If the displacement exceeded the safe range of vibration, the amplifier of the inductive displacement sensor sent the motor’s controller an alarm signal, which similarly interrupted the motor using the mechanical switch. The strain gauges were attached onto the gauge section of the specimen for the measurement of axial and shear strains. A rosette gauge and single gauge were combined to measure the strain. The length of the gauge was 3 mm. The resulting data were then stored in a computer to investigate the deformation behavior of the test specimen. In the high-cycle region, there was a possibility that the strain gauge would peel off from the surface of the specimen. In such cases, the values of axial and shear strains could be obtained from the inductive displacement sensor. To effect measurement in such a case, calibration to verify the correlation between the measured displacement and measured strain was performed.

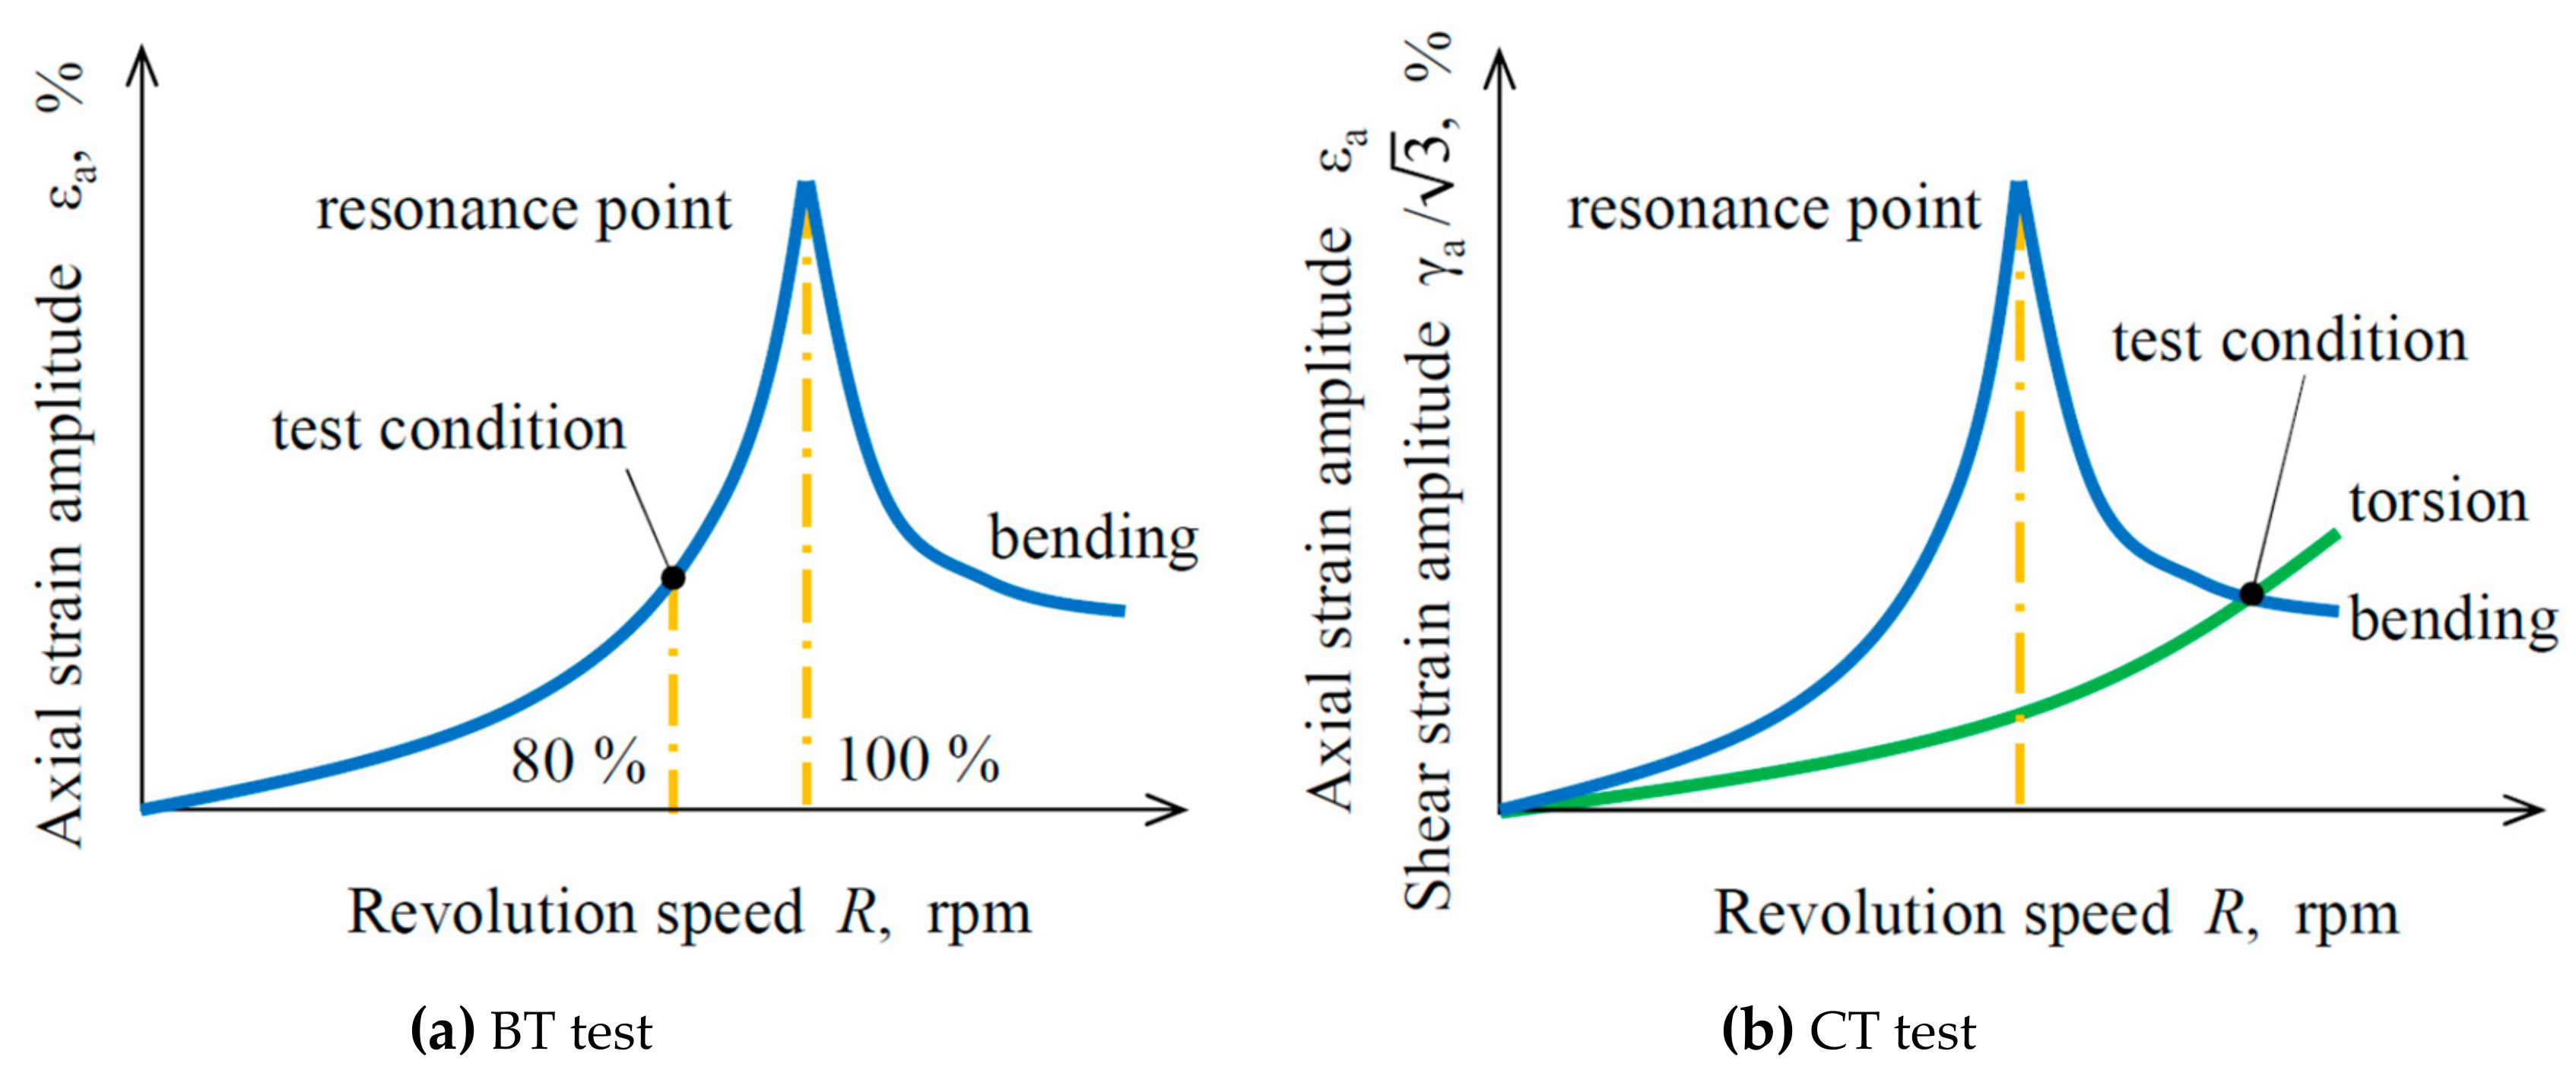
2.3. Weight Setting and Loading Conditions

In the following paragraph, the weight layout and the resulting generated loading condition are elucidated. In this work, two types of loading paths were applied: cyclic bending loading (BT) and a combination of bending and reversed torsion loading (CT). The CT test involved non-proportional multiaxial loading, in which cyclic sinusoidal bending loading and reversed sinusoidal torsion loading, with a 90° out-of-phase difference, were combined. The positions of the weights determined the types of fatigue loading attainable using the developed machine. Figure 4a,b schematically show the setting of the weights and the applied forces in a cycle.
BT could be performed when the weights on the bilateral wheels were in the same position, as presented in Figure 4a. In BT, when the weights were at the top or the bottom of the wheel, pull or push loading occurred. When the weights were in the forward or backward position, bending loading occurred. Although push–pull loading was also generated by the weight configuration presented in Figure 4a, its amplitude was negligible. In fact, for the hourglass-shaped solid test specimen with an 8-mm minimum diameter and a 39-mm round part, when the centrifugal force became 80 N, the maximum stress amplitude due to push–pull and bending loading was 2 and 200 MPa, respectively. Therefore, the loading condition in a cycle can be regarded as pure cyclic bending loading.
To carry out CT, the positions of the two weights differed by an angle of 180° on the bilateral wheels, as presented in Figure 4b. When one of the weights was in the forward position, the other was in the backward position, and torsion loading was applied to the specimen. When one of the weights was in the upward position and the other in the downward position, bending loading occurred.

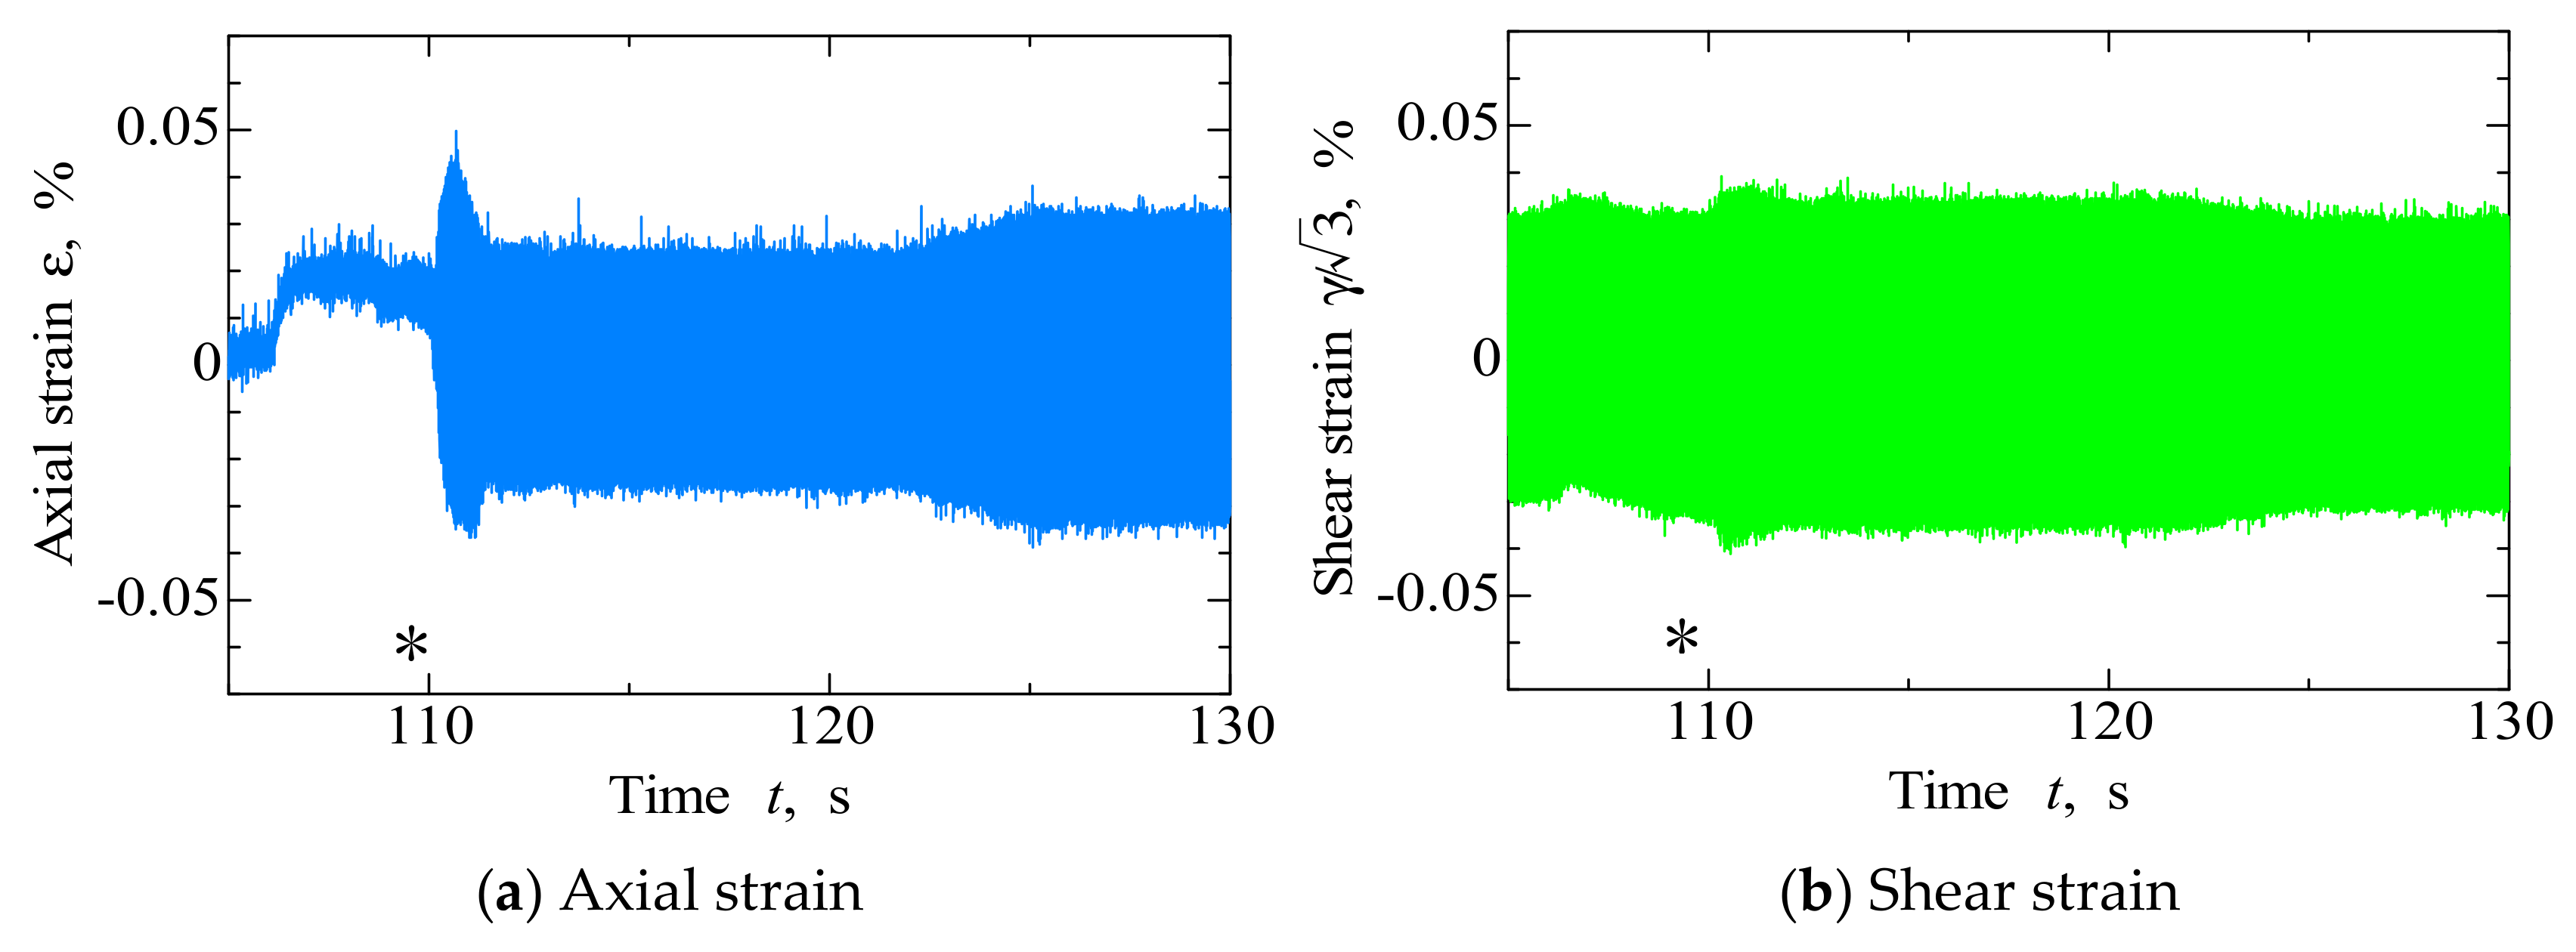
2.4. Control of the Testing Machine

The stress and strain levels on the test specimen could be determined by the weights and revolution speed, i.e., the moment of inertia. The revolution speed of the testing machine was set to avoid the resonance frequency of the specimen, because maintaining constant stress amplitude is difficult at resonance point. However, to obtain enough load to perform fatigue tests, the revolution speed needed to be near the resonance point, in view of the use of vibration for fatigue tests. Figure 5a,b present the relationships between axial strain range Δε and revolution speed R, and between shear strain range Δγ and revolution speed R, for a given weight mass M. The elastic strain portion was dominant in the high-cycle fatigue test. Figure 5 was derived from theoretical calculation, and experimental data could be outside of the lines. Therefore, several plots were experimentally obtained near the resonance point, and the value was corrected accordingly.
The revolution speed in the BT test was set at 80% of the resonance value, in order to obtain enough power equivalent to the weights attached to the wheels. In the CT test, rotational speed was set so that the axial and shear strains assumed the same value, based on the von Mises. To perform the CT test, the revolution speed had to exceed the resonance point in order to realize the same value for axial and shear strains. To avoid phenomena that could become detrimental to the specimen’s integrity due to resonance, an elastomeric sheet and pressing tool were attached onto the upper side of the testing machine in order to protect the test specimen from overload due to resonance, as presented in Figure 6. The pressing tool was detached from the testing machine when the revolution exceeded both the resonance point and the target frequency. Then, the revolution speed was lowered again to achieve the target frequency. The revolution speed at the target frequency was defined by the resonance point, i.e., the natural frequency of the test specimen. Thus, strain range was determined by the amount of weight attached to the machine. The relationship between strain range and weight was linear, since the weight had a proportional relation with centrifugal force, according to the theory. For testing, the relationships needed to be obtained experimentally prior to conducting tests because they depended on the material and shape of the test specimen.
After detaching the pressing tool to suppress overload on the specimen, a small amount of overload occurred on the test specimen (Figure 7). Strain data in Figure 7 were collected using strain gauges attached onto the specimen. The timing of the pressing tool detachment is indicated in Figure 7 by asterisks. Strain values were increased within 100 cycles following the detachment of the pressing tool. However, the value was 1.15 to 1.2 times that of the targeted strain value. Table 2 presents the calculation result of fatigue damage, based on the linear cumulative damage (LCD) rule, which shows that the effect of overload was negligible on the fatigue life of the specimen. Therefore, the effect of overload could be neglected, and a multiaxial fatigue test at 50 Hz could be performed.

3. Fatigue Tests

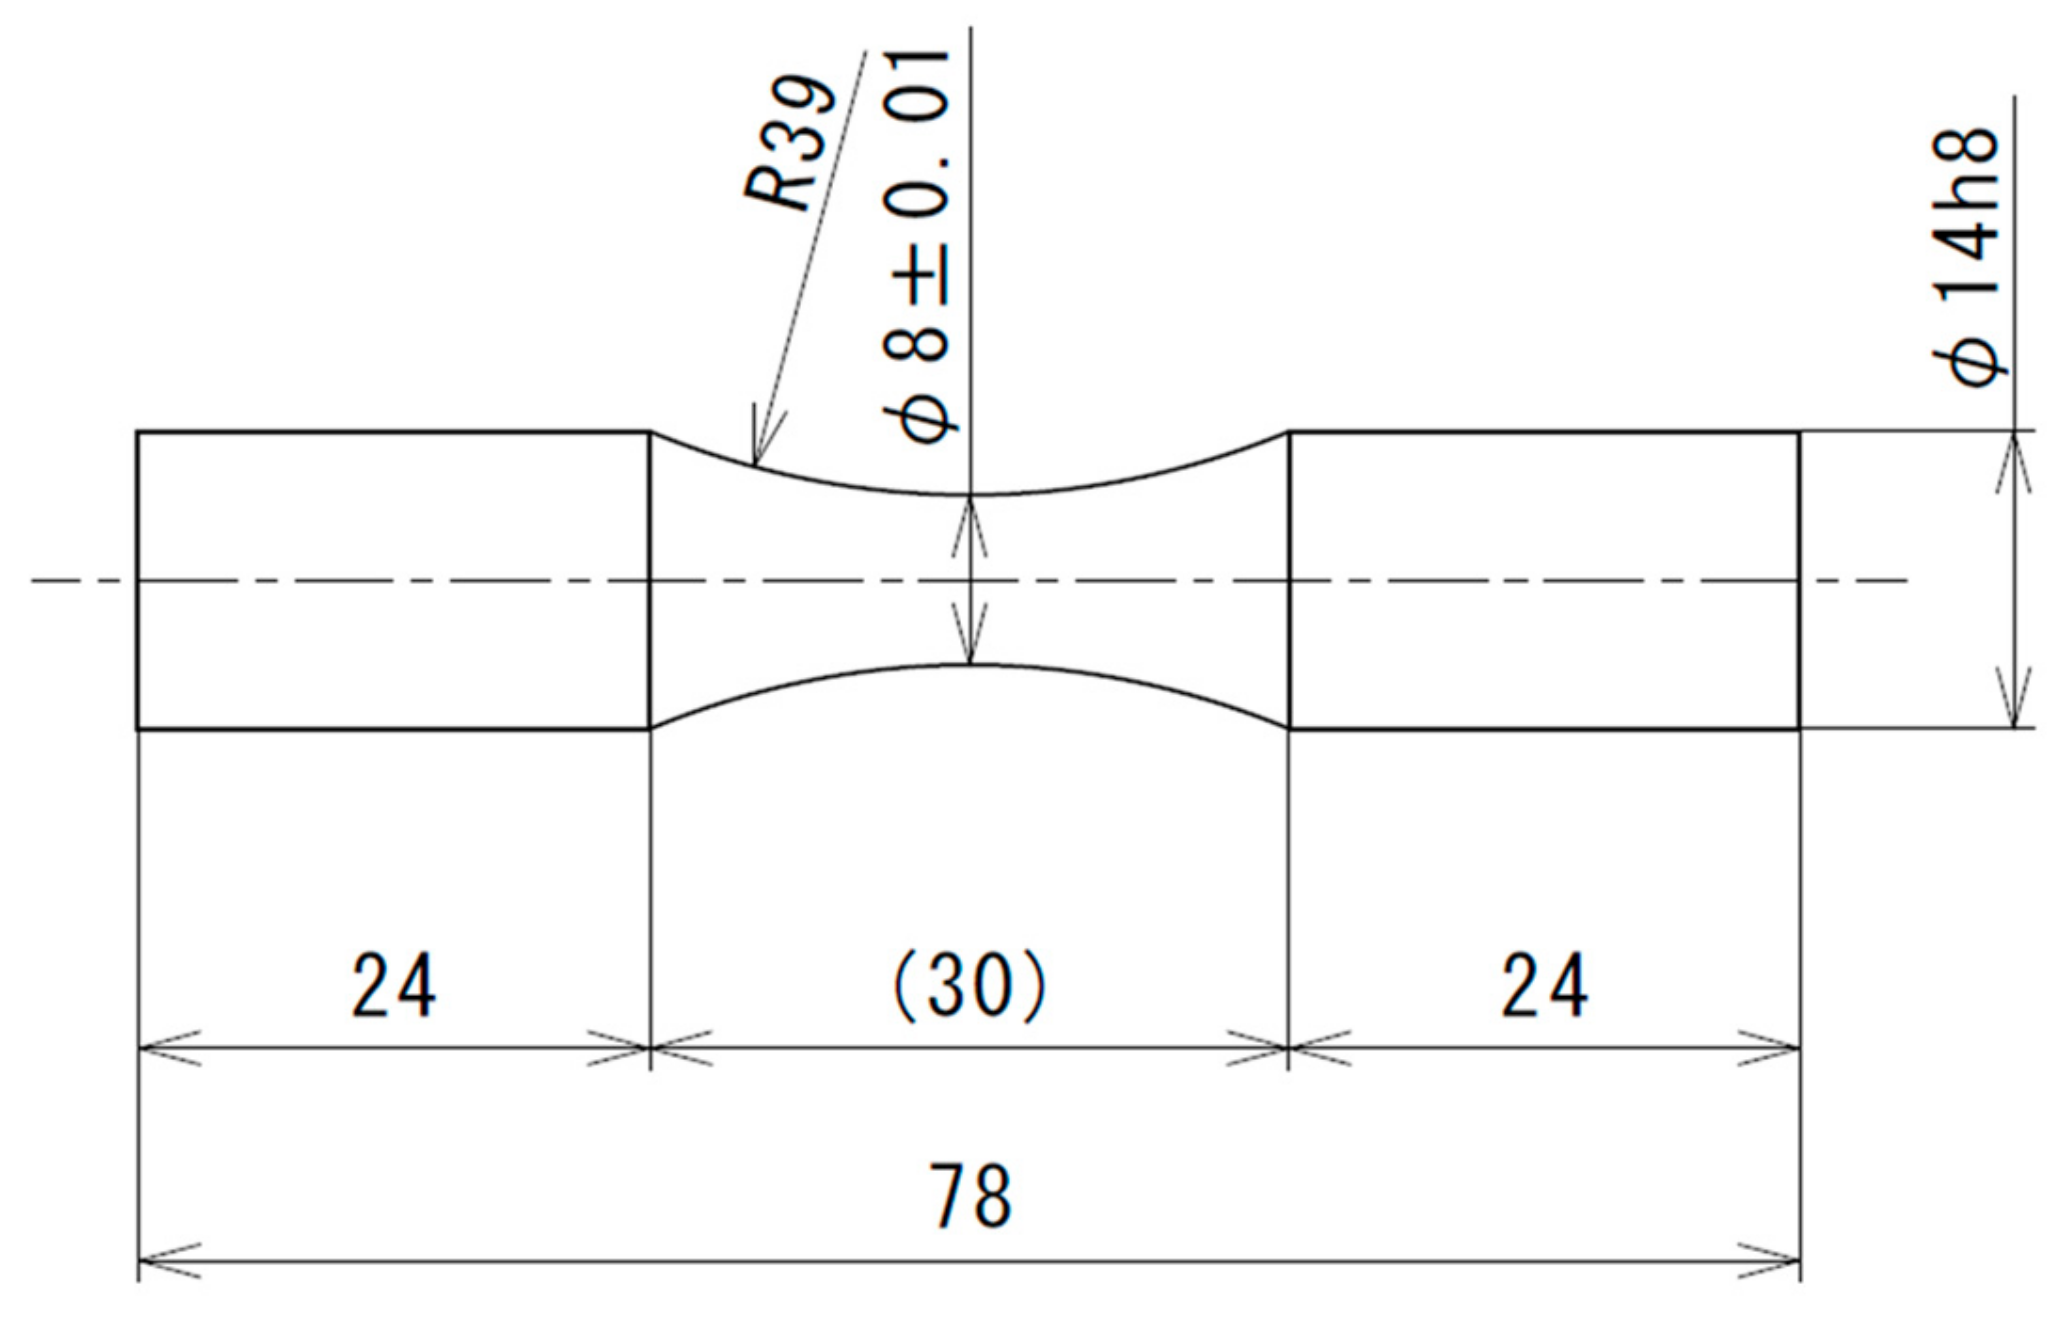
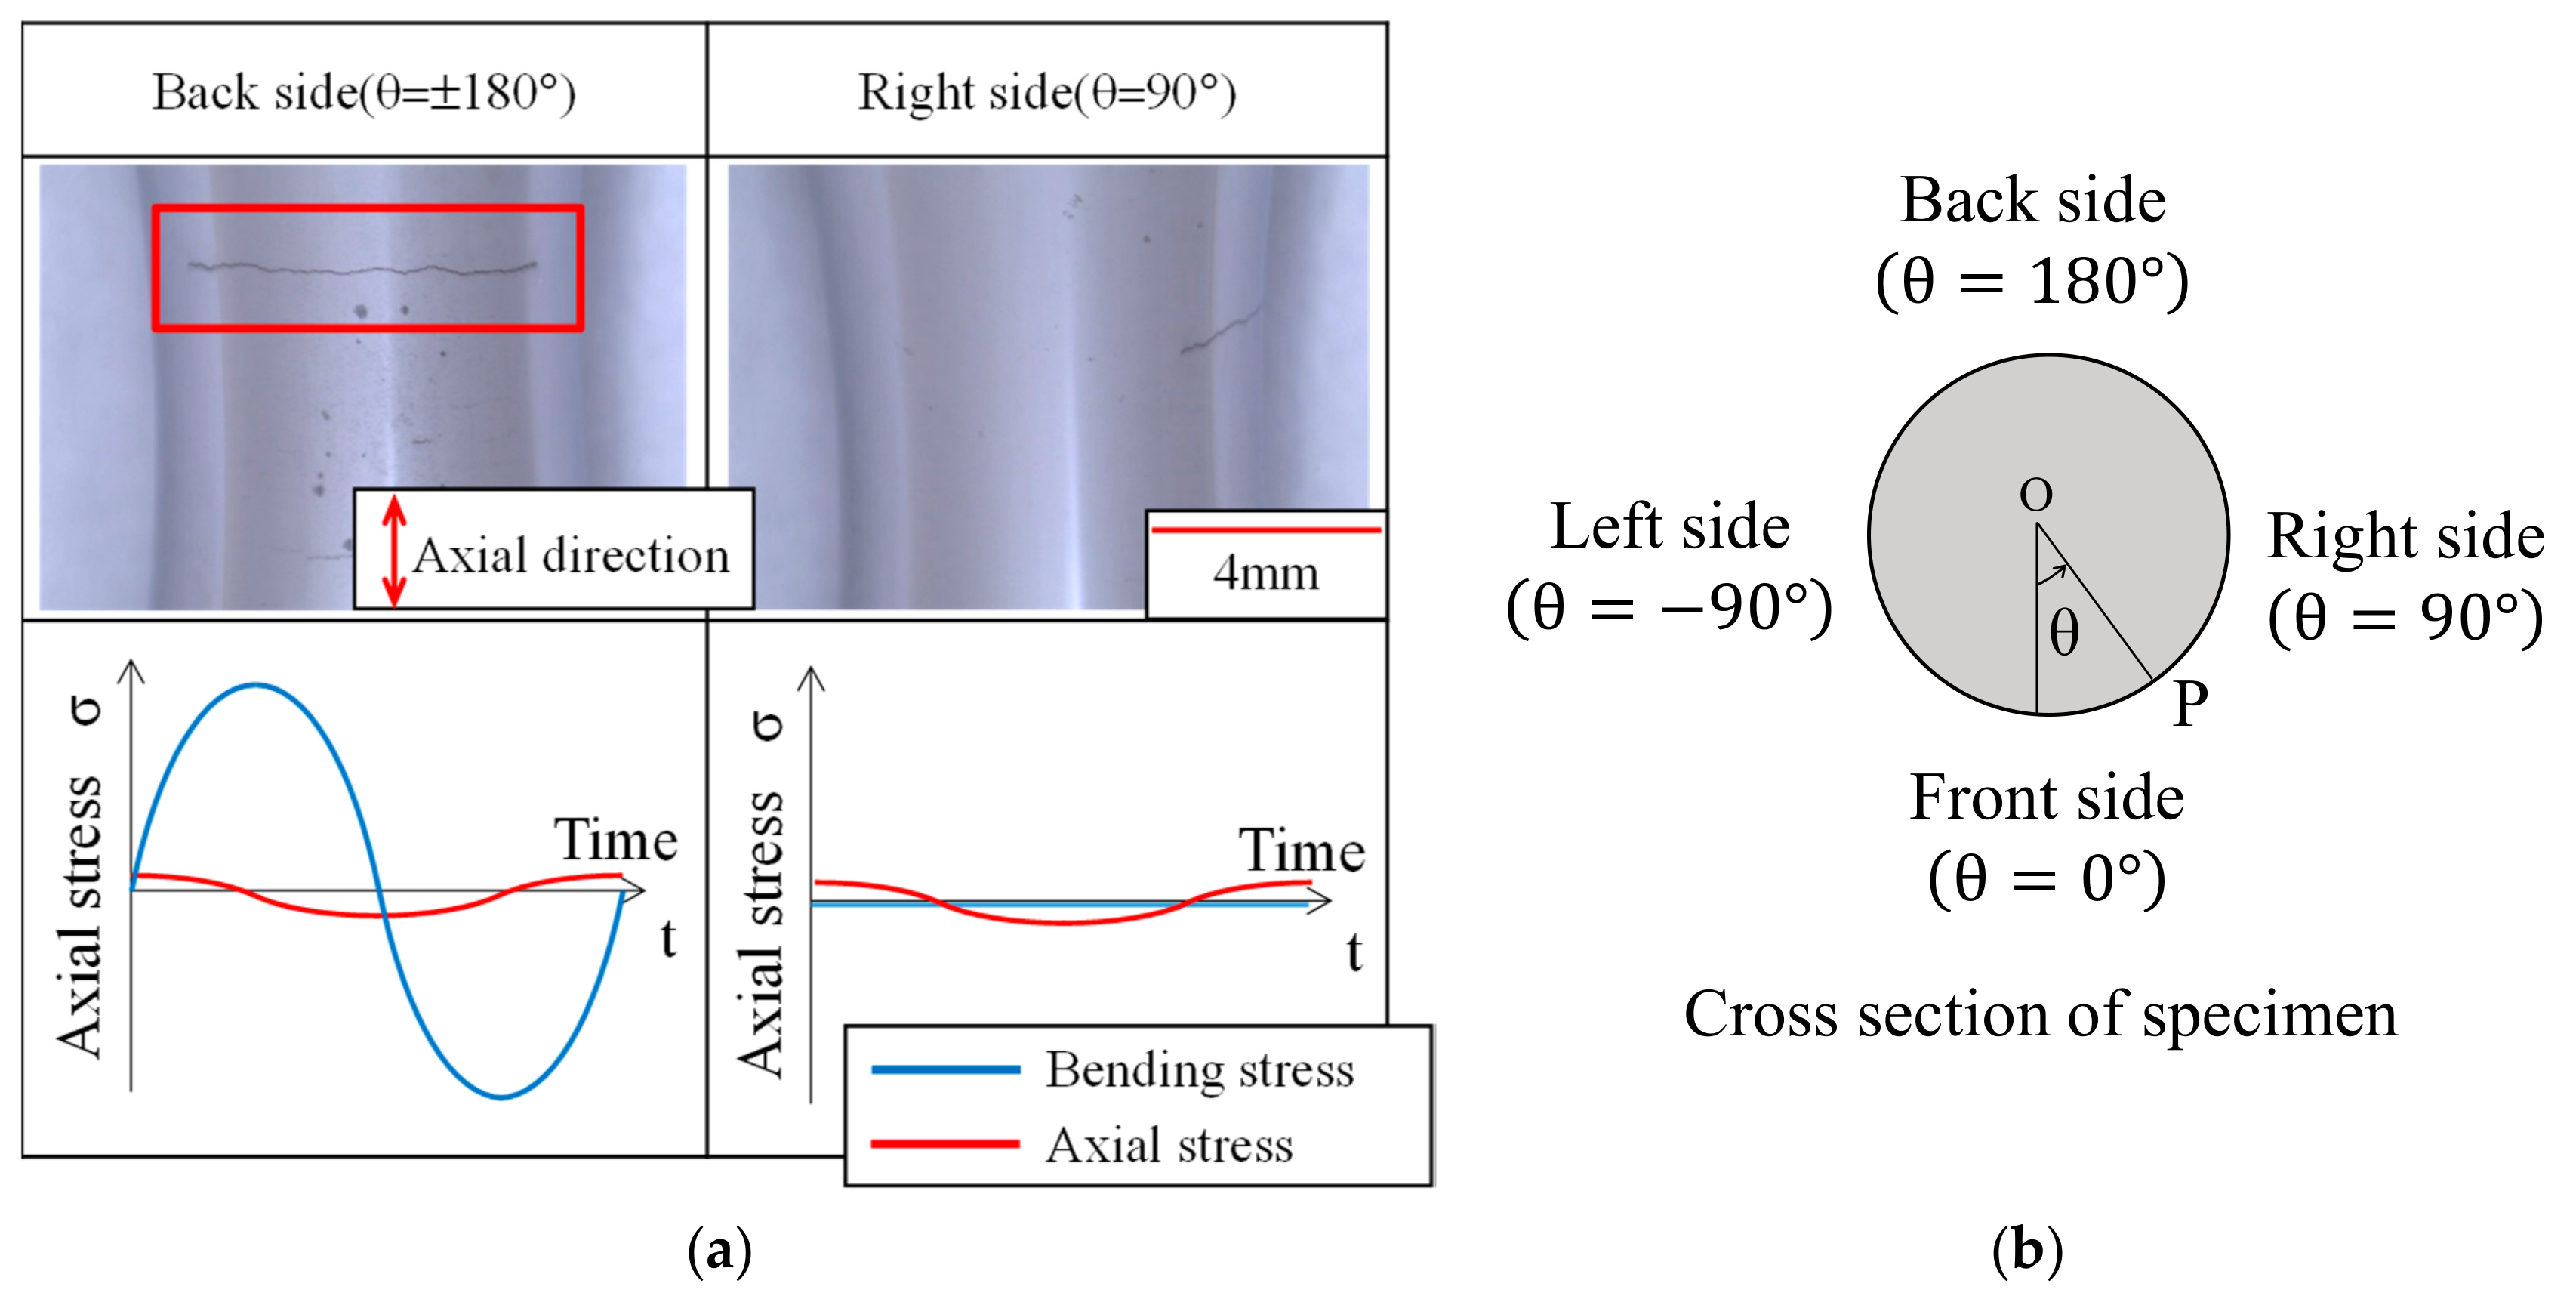
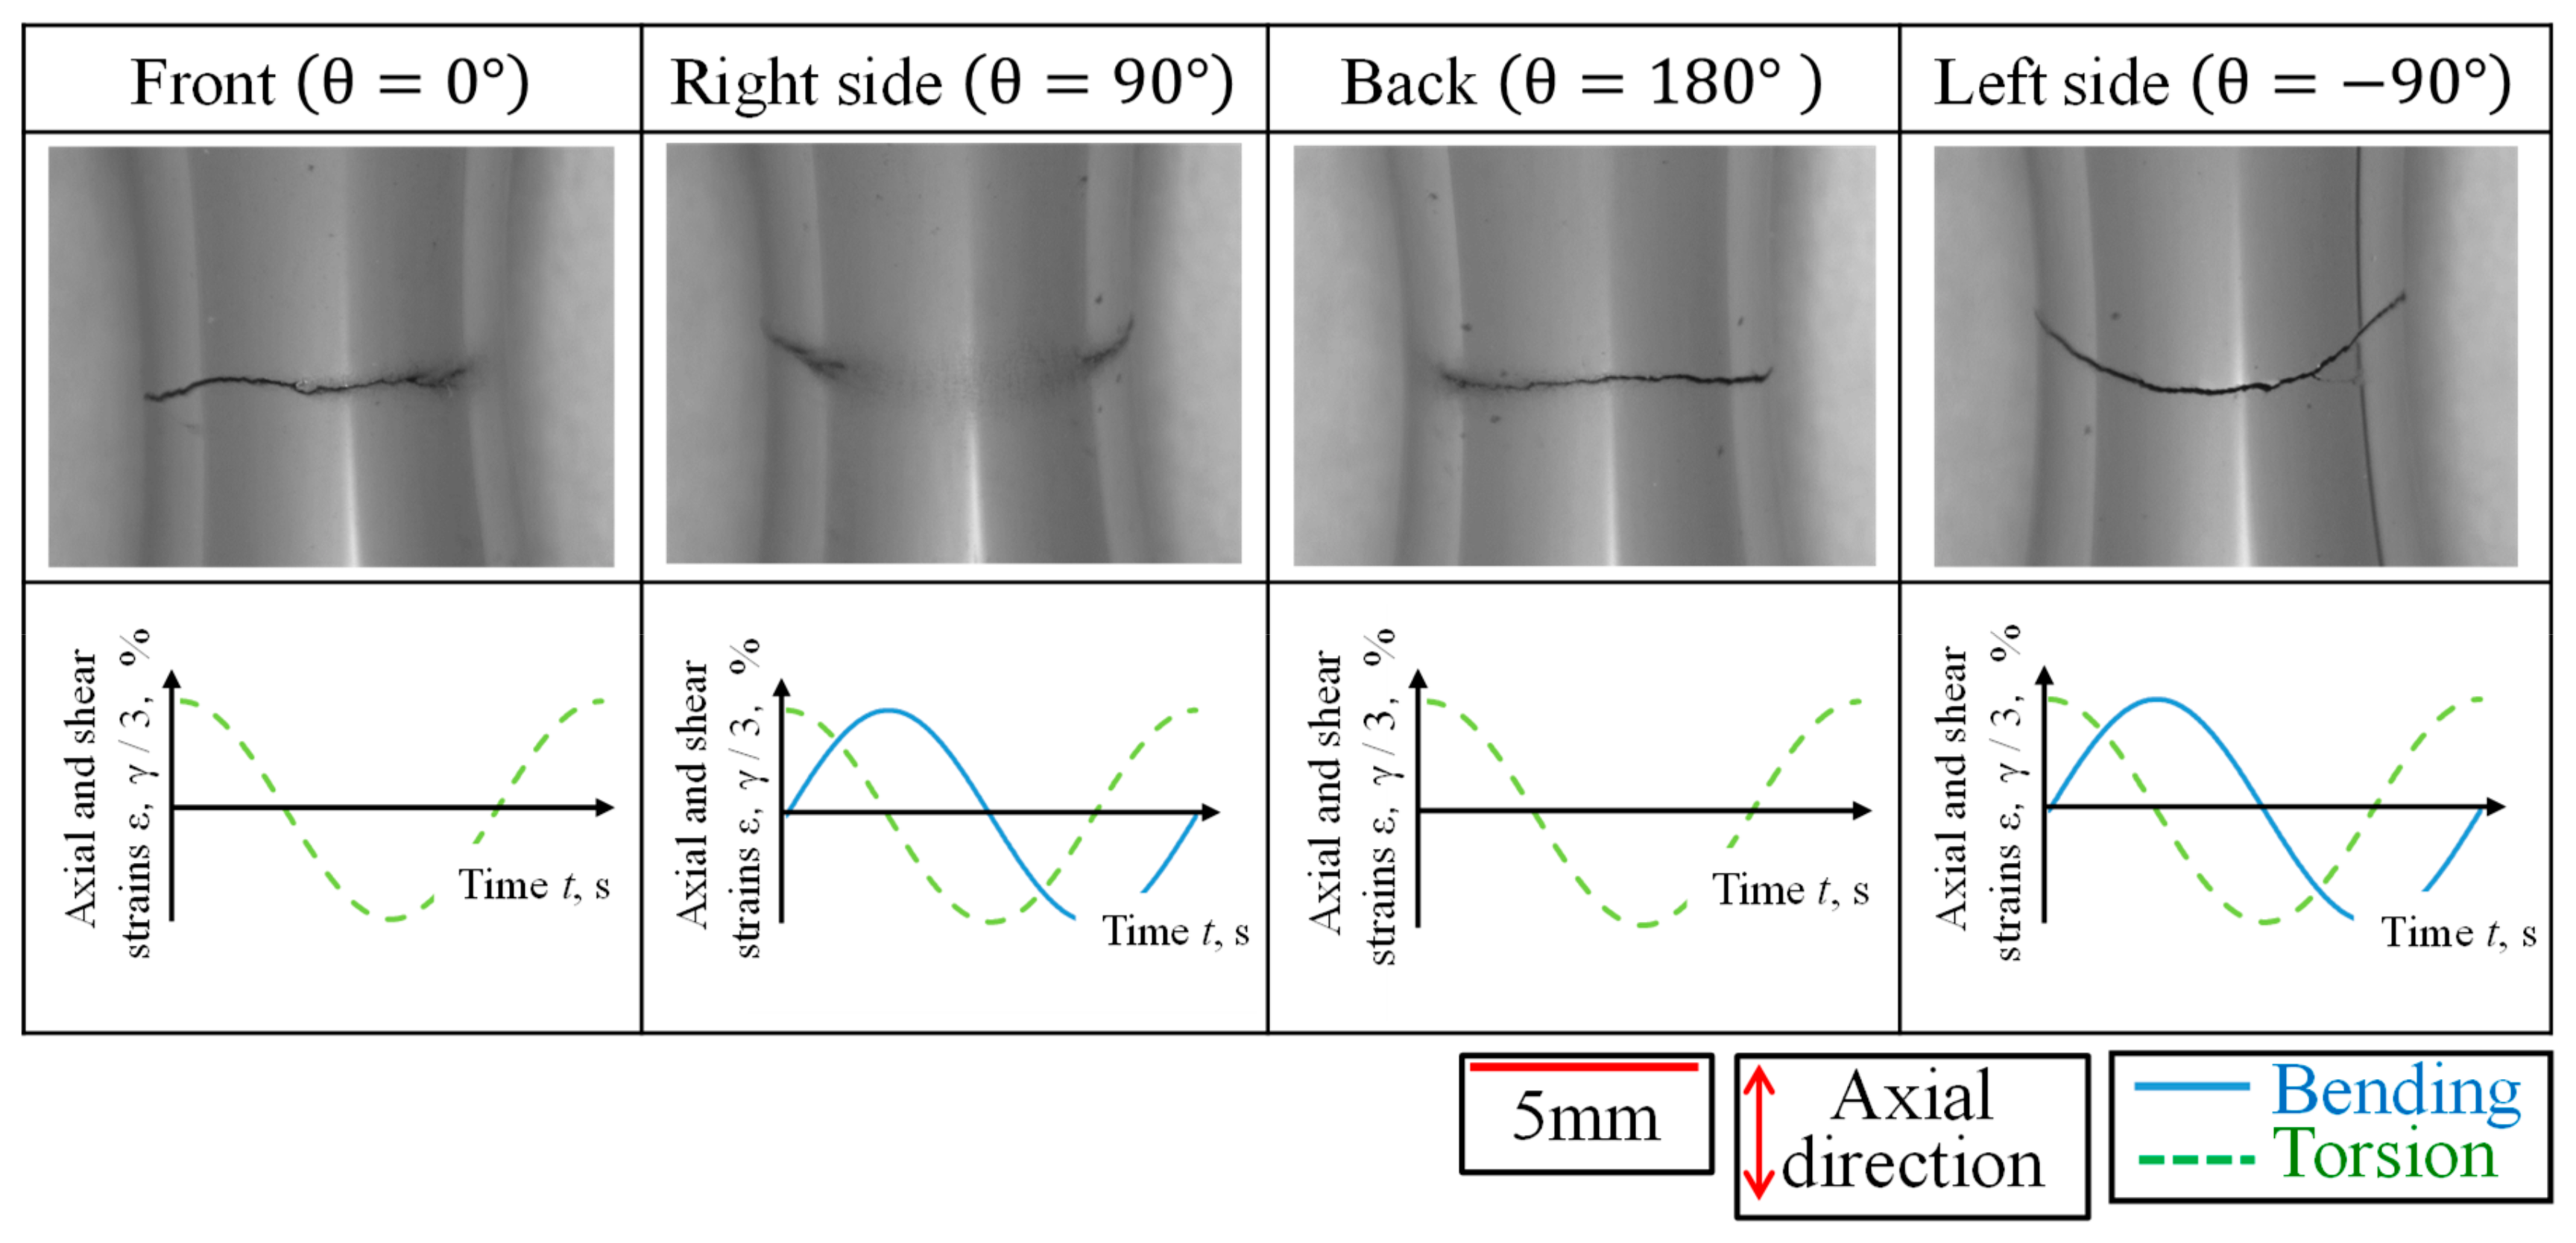
3.1. Specimens and Loading Paths

The investigation of fatigue properties of structural materials is fundamental for achieving a reliable mechanical design of actual components [10,11,12,13,14]. As test materials, type 490A hot-rolled steel and type 304 stainless steel were used. The chemical compositions of the tested materials are presented in Table 3 and Table 4. An hourglass-shaped solid test specimen with an 8-mm minimum diameter and 39-mm round part was used (Figure 8).
The employed loading paths in the tests were BT and CT. Figure 9 presents the strain waveforms of BT at 29 Hz and of CT at 44 Hz. The data were obtained using strain gauges attached to the specimen. For CT, results at high test frequency are shown. Figure 9a presents the smooth sinusoidal strain waveform of BT at M = 31.3 g and R = 1660 rpm. In the CT test with M = 19.2 g and R=2840 rpm, the axial and shear strains exhibited a 90° phase difference, as presented in Figure 9b.

3.2. Test Results

Figure 10 presents the multiaxial fatigue test results for the type 490A hot-rolled specimen. Failure life was defined as the cycle where a large amount of vibration occurred due to the generation of large cracks on the specimen; when this happened, the testing machine was stopped. In the same graphic, the test results obtained using a conventional electric servohydraulic multiaxial fatigue-testing machine are also represented (reference, Figure 10), where PP denotes push–pull, RT denotes reversed torsion, and CI denotes circle loading, in which axial and torsional strains had a 90° phase difference. Failure life was defined as the cycle in which stress amplitude became 3/4 of the maximum value. The test data were correlated using equivalent stress amplitude. Equivalent stress amplitude was calculated from the strain data for the developed machine, whereas experimental data were obtained for the conventional servohydraulic testing machine. CT (developed, Figure 10) was compared with CI (reference, Figure 10), whereas BT (developed, Figure 10) was compared with PP (reference, Figure 10). The test conditions between the developed testing machine and conventional servohydraulic testing machine, i.e., the difference in waveforms, showed differences with regard to bending torsion and push–pull torsion, as well as test frequency. The definition of “failure life” was also different, as mentioned earlier. For the developed testing machine, the fatigue limit was defined as the stress under which no specimen failure occurs over 107 cycles; data for the specimen without failure are indicated by black arrows. For the conventional servohydraulic testing machine, the CI test (reference, Figure 10) ran out at 106 cycles. The data are indicated by black arrows.
In this study, the results obtained by two different tests, i.e., BT (developed, Figure 10) and PP (reference, Figure 10) as well as CT (developed, Figure 10) and CI (reference, Figure 10), were compared. It is clear from Figure 10 that the fatigue life of BT (developed, Figure 10) was slightly longer than that of PP (reference, Figure 10). The existing literature reports that fatigue life is longer when using a round bar specimen compared with using a plate specimen [15]. The fatigue life of CT (developed, Figure 10) correlated well with that of CI (reference, Figure 10), although the fatigue limit was lower by roughly 100 MPa. The developed testing machine was able to perform non-proportional multiaxial fatigue tests at a high frequency, and non-proportional multiaxial fatigue life was shortened compared with proportional tests, which coincides with the data obtained using a conventional fatigue-testing machine. A reduction in fatigue limit did not indicate that the specimen failed faster using the developed testing machine. However, the difference in test waveform, i.e., bending torsion and push–pull torsion, may have contributed to the reduction in fatigue limit. The difference in fatigue limit possibly arose from the definition applied to “failure life.” The cause of the reduction will be investigated in detail in future research.
Figure 11 presents the results for type 304 stainless steel. The fatigue life of BT (developed, Figure 11) was longer than that of PP (reference, Figure 11). The fatigue life of CT (developed, Figure 11) coincided with that of CI (reference, Figure 11), regardless of the absence of data pertaining to CT (developed, Figure 11) at high axial strain amplitude. The fatigue life of CI (reference, Figure 11) was longer due to a decrease in strain caused by additional hardening under non-proportional multiaxial loading. Regardless of the small difference in fatigue life, the tendency of fatigue life agreed with that of type 490A hot-rolled steel.
Figure 12 presents the observed results for the type 304 specimen surface following BT tests. Images of the back side (θ = ±180°) and right side (θ = 90°) are shown; bending and axial stress profiles are also shown for the lower side. A crack began from the back side where the maximum axial stress occurred due to bending loading.
Figure 13 presents the surface observation results for the specimen following the CT test. Crack origins were observed on the left-side surface of the specimen, to which both bending and torsion loads contributed. Cracks propagated to the front and back surfaces, which were torsional stress-related only, as shown in the lower side of Figure 13. No cracks were observed on the left-side surface. However, the roughness of the specimen’s surface increased due to non-proportional loading. Crack initiation pattern resemblances existed between the developed testing machine and conventional servohydraulic testing machine, and there was no confirmation that the failure mechanism changed as a result of the use of the developed testing machine. A reduction in fatigue limit was observed for the developed testing machine, the reasons for which will be pursued in a future study.
Figure 14 presents the fracture surface of the specimen subject to the CT loading test. Cracks were observed on several sites of the specimen’s surface, i.e., on the front side, back side, and right side. Striations were detected near the front and back sides. It is speculated that cracks began from the right side, leading to their propagation to the front and back sides. Cracks began on the side surface due to the combined impact of bending and torsion. Subsequently, they propagated to torsional sites.
The reason for the fatigue limit reduction in the CT test was not entirely clear, but it is speculated that the definition of “fatigue life” and the difference in test waveforms influenced the fatigue-testing data.

4. Conclusions

A multiaxial fatigue-testing machine for non-proportional loading at high frequency was developed. The machine was able to carry out a combined bending and torsion loading test by utilizing inertial force, generated by the rotation of bilateral wheels. Multiaxial fatigue tests at a maximum frequency of 50 Hz were achieved, which was approximately 25 times higher than the frequency attainable using the conventional electric servohydraulic multiaxial fatigue-testing machine. However, there exist limitations: the stress range needed to be calculated, and the stress range applicable in the CT test was limited. The following conclusions were derived from conducting the research.
(1)
Overload occurred when exceeding the resonance frequency. However, the effect of overload was negligible, and multiaxial fatigue tests could be performed at high frequency. Fatigue tests with 107 cycles could be performed over a period of 3 days.
(2)
The position of the weight determined the type of test. The same weight position led to bending loading, whereas a difference in the weight position (by 180°) led to bending and torsion combination loading. Non-proportional loading with a 90° phase difference in bending waveform and torsional waveform can be achieved.
(3)
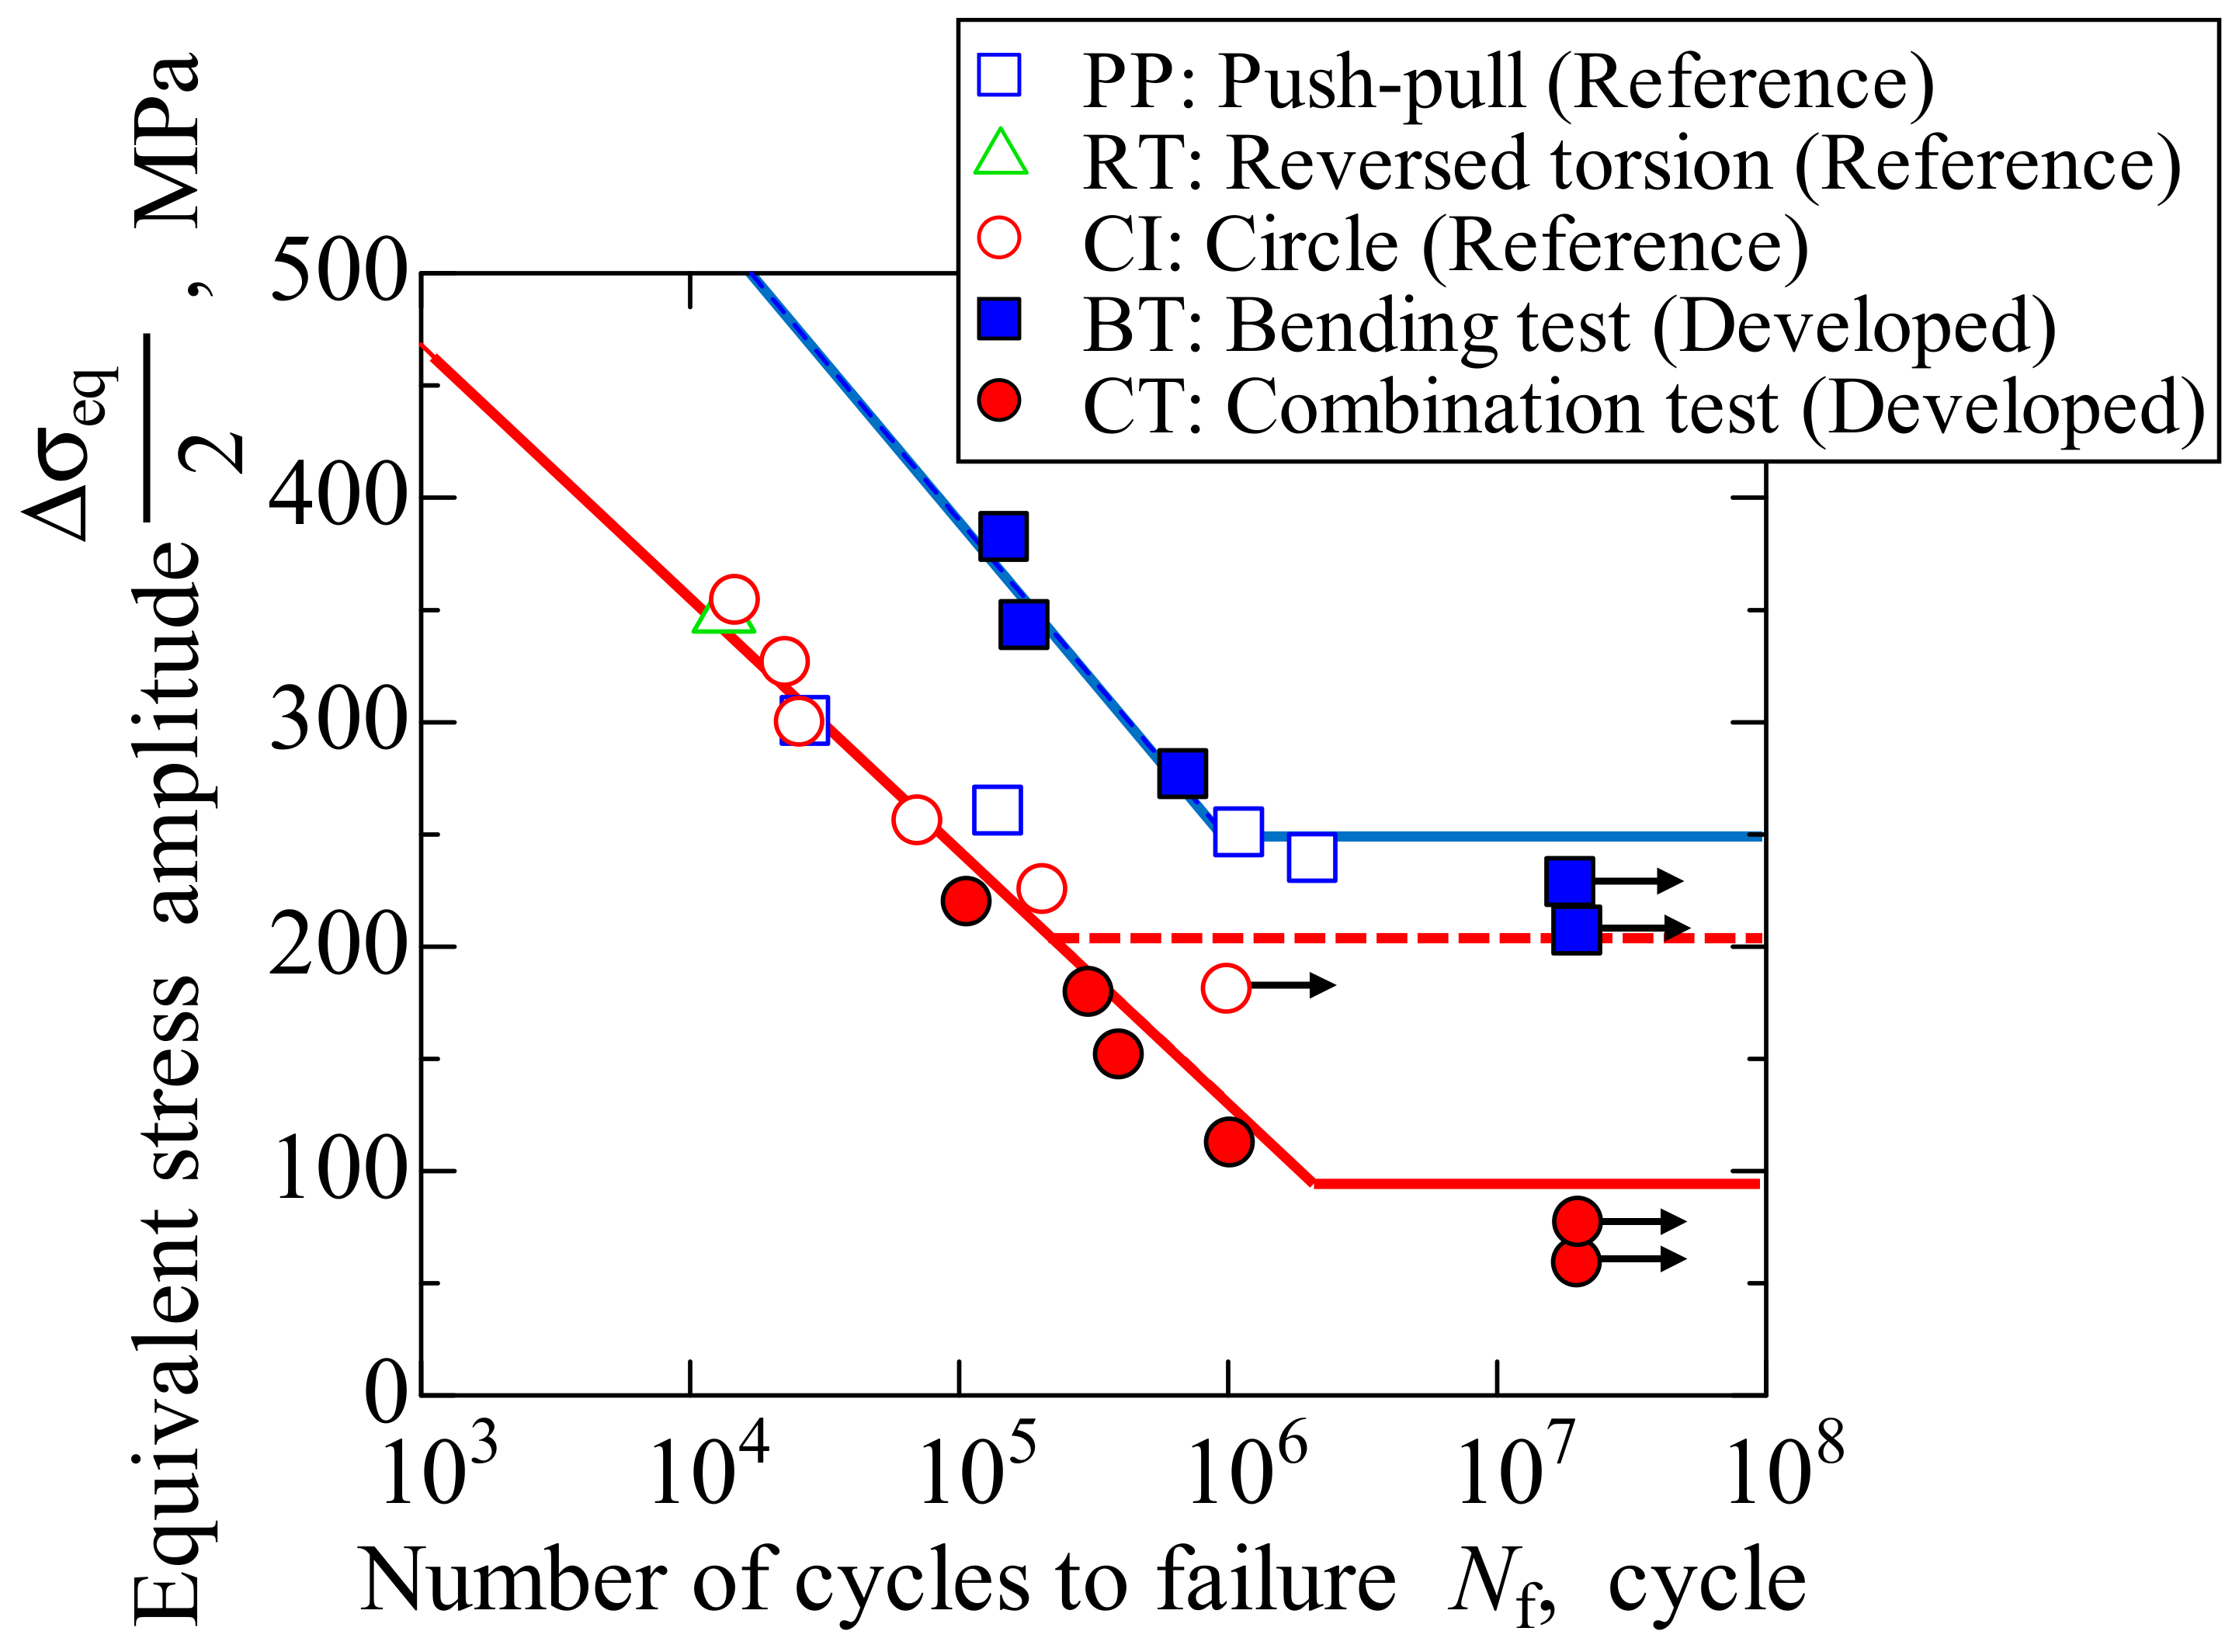
A bending loading test and combination loading test were performed using hourglass-shaped specimens made of type 490A hot-rolled steel and type 316 stainless steel. Fatigue life obtained using the bending test was slightly longer than in the case of using the conventional electric servohydraulic multiaxial fatigue-testing machine. The fatigue life in the combination test, obtained using the developed testing machine, coincided with that obtained using the conventional testing machine, regardless of the reduction in fatigue limit stress value. This was due to the difference in bending torsion and push–pull torsion waveforms and the definition assigned to “fatigue life.”
(4)
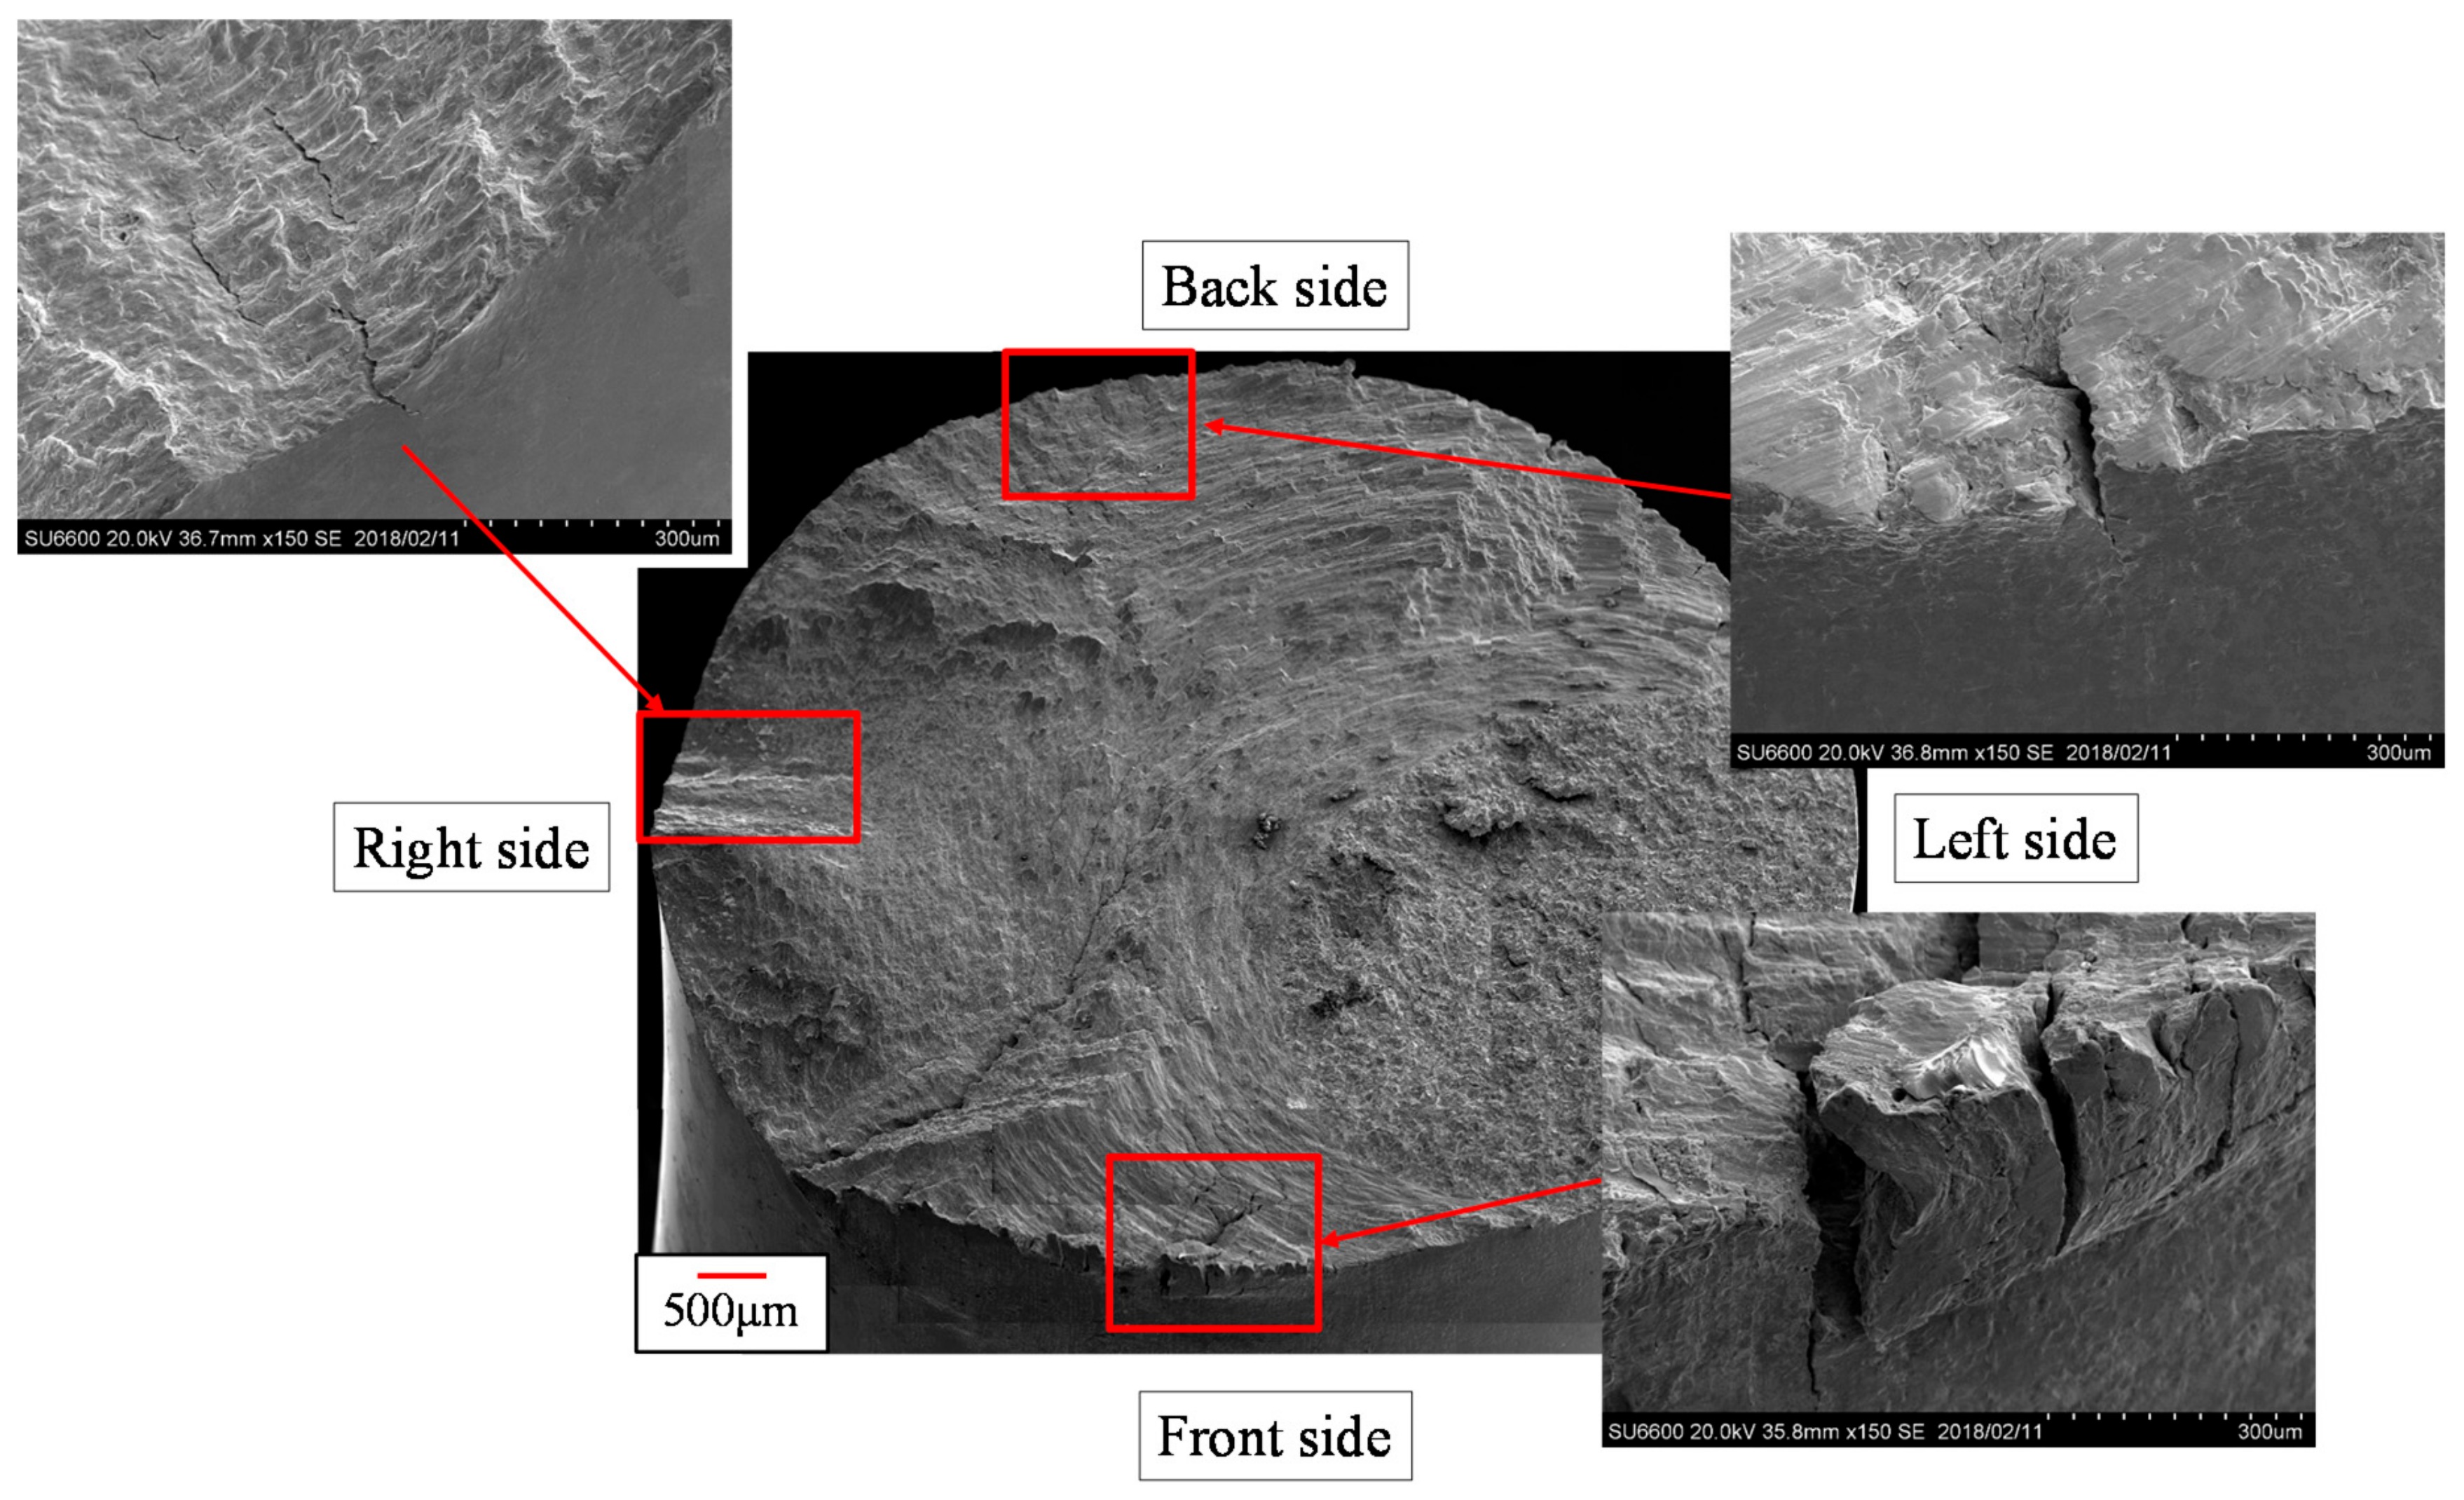
Surface fractures were observed. Crack initiation at the site of the combination of bending and torsion occurred, and then it propagated to the sites in which torsion dominated. This coincided with the typical fracture pattern under non-proportional multiaxial loading. The validity and effectiveness of multiaxial fatigue tests were confirmed.
In future contributions, a more efficient design of the testing machine for a wider stress range, as well as an elucidation of the fatigue failure mechanism under the combined loading of bending and torsion, will be performed through comparisons with data obtained using a conventional servohydraulic testing machine.

Author Contributions

The development of the testing machine and the experiment were carried out by Y.S., S.B., and T.M. Observation of the surface fractures of the specimen was conducted by Y.S. and F.O. The manuscript was written by F.O. and S.B. Supervision was conducted by T.I.

Funding

Part of this work was supported by JSPS KAKENHI, Grant Numbers JP18K0354 and JP 17K14562.

Conflicts of Interest

The authors declare no conflict of interest.

References

  1. McDowell, F.L. On the path dependence of transient hardening and softening to stable states under complex biaxial cyclic loading. In Proceedings of the International Conference on Constitutive Laws for Engineering Materials, Tucson, AZ, USA, 10–14 January 1983; pp. 125–135. [Google Scholar]
  2. Socie, D.F. Multiaxial fatigue damage models. J. Eng. Mater. Technol. 1987, 109, 293–298. [Google Scholar] [CrossRef]
  3. Doong, S.H.; Socie, D.F.; Robertson, I.M. Dislocation substructures and nonproportional hardening. J. Eng. Mater. Technol. 1987, 112, 456–465. [Google Scholar] [CrossRef]
  4. Fatemi, A.; Socie, D.F. A critical plane approach to multiaxial fatigue damage including out-of-phase loading. Fatigue Eng. Mater. Struct. 1988, 11, 149–165. [Google Scholar] [CrossRef]
  5. Itoh, T.; Sakane, M.; Ohnami, M.; Socie, D.F. Non-proportional low cycle fatigue criterion for type 304 stainless steel. Trans. Am. Soc. Mech. Eng. J. Eng. Mater. Technol. 1995, 117, 285–292. [Google Scholar] [CrossRef]
  6. Itoh, T.; Nakata, D.F.; Socie, M.; Ohnami, M. Non-proportional low cycle fatigue of 6061 aluminum alloy under 14 strain path. Eur. Struct. Integrity Soc. 1999, 25, 41–54. [Google Scholar]
  7. Itoh, T.; Yang, T. Material dependence of multiaxial low cycle fatigue lives under non-proportional loading. Int. J. Fatigue 2011, 33, 1025–1031. [Google Scholar] [CrossRef] [Green Version]
  8. Morishita, T.; Takaoka, T.; Itoh, T. Fatigue strength of SS400 steel under non-proportional loading. Fract. Struct. Integrity 2016, 10, 289–295. [Google Scholar] [CrossRef]
  9. Nelson, D.V.; Rostami, A. Biaxial Fatigue of A533B Pressure Vessel Steel. J. Pres. Ves. Technol. 1997, 119, 325–331. [Google Scholar] [CrossRef]
  10. Stephens, R.I.; Fatemi, A.; Stephens, R.R.; Fuchs, H.O. Metal Fatigue in Engineering, 2nd ed.; Wiley Interscience: Hoboken, NJ, USA, 2000; pp. 1–18. [Google Scholar]
  11. Suresh, S. Fatigue of Materials, 2nd ed.; Cambridge University Press: Cambridge, UK, 2008; pp. 1–36. [Google Scholar]
  12. Bathias, C.; Pineau, A. Fatigue of Materials and Structures: Fundamental; Wiley Interscience: Hoboken, NJ, USA, 2013; pp. 1–19. [Google Scholar]
  13. Frost, N.E.; Marsh, K.J.; Pook, L.P. Metal Fatigue; Dover Publications: Mineola, NY, USA, 2011; pp. 1–5. [Google Scholar]
  14. Dowling, N.E. Mechanical Behavior of Materials: Engineering Methods for Deformation, Fracture, and Fatigue, 2nd ed.; Prentice Hall: Upper Saddle River, NJ, USA, 1998; pp. 19–39. [Google Scholar]
  15. Koe, S.; Nakamura, H.; Tsunenari, T.; Okada, T. Relation between bending and direct stress fatigue strengths of steels. J. Jpn. Soc. Mater. Sci. 1982, 356, 522–526. [Google Scholar]
Figure 1. Photo image of the testing machine.
Metals 09 01115 g001
Figure 2. Schematic view of the testing machine developed in this research.
Metals 09 01115 g002
Figure 3. Measurement and control system for the testing machine.
Metals 09 01115 g003
Figure 4. Weight settings for bending and combination loading tests.
Metals 09 01115 g004
Figure 5. Relationships among ∆ε, ∆γ and R.
Metals 09 01115 g005
Figure 6. Pressing tool to suppress overload on the specimen.
Metals 09 01115 g006
Figure 7. Overload induced on the specimen after detachment of the pressing tool, collected using a strain gauge.
Metals 09 01115 g007
Figure 8. Specimen geometry (mm).
Metals 09 01115 g008
Figure 9. Strain waveforms during fatigue tests, measured using strain gauges.
Metals 09 01115 g009
Figure 10. Fatigue test results for type 490A hot-rolled steel.
Metals 09 01115 g010
Figure 11. Fatigue test results for type 304 steel.
Metals 09 01115 g011
Figure 12. Observed results of the specimen surface following BT testing of the type 304 specimen.
Metals 09 01115 g012
Figure 13. Surface observation results for the specimen after the CT test.
Metals 09 01115 g013
Figure 14. Fracture surface observation results according to the type of specimen, following the CT test at 112 MPa of equivalent stress amplitude.
Metals 09 01115 g014
Table 1. List of sensors acquired for the developed testing machine.
Name of SensorRole of Sensor
Mechanical switchDetection of overload
Inductive displacement sensorMeasurement of vibration
Strain gaugeMeasurement of strains on the surface of the specimen
Table 2. Fatigue damage at overload, calculated using linear cumulative damage (LCD).
Fatigue LifeCyclesFatigue Damage Based on LCD
362,787 (with no overload)107,6870.2968
196,271 (overload)1000.00051
Table 3. Chemical composition of type 490A hot-rolled steel.
MaterialChemical Composition (wt, %)
MnSiCPS
SM490A1.450.290.150.020.0039
Table 4. Chemical composition of type 304 stainless steel.
MaterialChemical Composition (wt, %)
MnSiCPSCr
SUS3042.001.000.080.0450.0318.00

