Article

Electrochemical Impedance Analysis on Cryogenically Treated Dissimilar Metal Welding of 316L Stainless Steel and Monel 400 Alloy Using GTAW

1
Department of Mechanical Engineering, Birla Institute of Technology & Science, Pilani, Dubai Campus, University, Dubai P.O. Box 345055, UAE
2
Department of Mechanical Engineering, American University of Sharjah, Sharjah P.O. Box 26666, UAE
*
Author to whom correspondence should be addressed.
Metals 2019, 9(10), 1088; https://doi.org/10.3390/met9101088
Submission received: 10 July 2019 / Revised: 30 September 2019 / Accepted: 1 October 2019 / Published: 10 October 2019

Abstract

:
An attempt was made to study the corrosion behavior of austenitic stainless-steel SS 316L/Monel 400 alloy dissimilar metal welded joints using gas tungsten arc welding. This combination of welded joints is used in re-heaters and heat exchangers in gas processing and oil refining industries. The welded specimens were subjected to post-weld treatments, such as annealing and deep cryogenic treatment. The welded specimens were sectioned into five different parts: SS 316L base, SS 316L HAZ, weld, Monel HAZ, and Monel base. The polarization method and electrochemical impedance analysis were used to analyze the corrosion resistance in a NaCl solution. A polarization graph, Nyquist plot, and Bode plot were constructed for all regions, separately, for the heat-treated and cryo-treated specimens, to analyze the variation in corrosion resistance in different regions, and then the results were compared. To validate the results of electrochemical impedance analysis, scanning electron microscope (SEM) and energy dispersive spectroscope (EDS) analyses were also performed. The results indicated that the cryo-treated specimens have better corrosion resistance when compared to the annealed ones. Weld region on both specimens exhibited better corrosion resistance when compared to other zones.

1. Introduction

The joining of materials is an important manufacturing process used to combine metallic, as well as nonmetallic, parts for various applications. Multiple industries are actively considering numerous alternate welding techniques that would enhance the commercialization of high-performance of lightweight materials [1]. Narayanan et al. (2014) have mentioned that the dissimilar metal joining is one of the most essential needs of several industries these days [2]. The combinations of dissimilar metals lead to new challenges, such as effectiveness of welding in terms of developed mechanical properties, absence of any negative metallurgical changes, etc. Dissimilar metal joints are employed widely in energy-demanding sectors involving oil and petroleum, marine, nuclear, thermal, and geothermal fields, where they are prone to hot corrosion and high-temperature wear.
The dissimilar integration of austenitic stainless steels and nickel alloys has applications in oil and gas industries, as well as in chemical industries, which have low to moderate temperatures and corrosive environments. In addition, Mohandas et al. (2005) has mentioned that an integration of moderate resistance of oxidation and creep strength finds applications in fossil fuel power plants, such as tubing for generators and other tools [3]. Ramkumar (2014) mentioned that, due to variation in physical and metallurgical properties, the joining of dissimilar metals is difficult. Hot cracking, the dilution of weld metals, and other metallurgical failures can occur as a result of the differences in chemical and physical properties of the mismatched metals joined. Dissimilar integration of austenitic stainless steel and Cu-Ni alloys can be used in high-temperature, as well as corroding, environments, which are more prevalent in chemical processing [4]. Weld metal dilution is a major concern in dissimilar metal joining involving nickel and copper alloys when welded with steel for offshore structures. Vijay Ukadgaonker et al. (2008) noticed dilution of stainless steel near the weld when it is welded with Monel alloy [5]. Low-carbon steel and Monel 400 were welded by Gas Tungsten Arc Welding (GTAW) using ERNiCrFe-5 and ERNiCu-7 filler wires. Such dissimilar welds are used in oil gasification plants in which they are exposed to sulphur trioxide, hydrogen sulphide, and sulphur dioxide [6]. Kim et al. (2006) recommended the use of chromium-free Ni-Cu alloy fillers for welding austenitic stainless steel [7]. The authors specifically mentioned the use of Monel alloy fillers for excellent corrosion resistance. These fillers have excellent resistance to pitting corrosion.
Devendranath et al. (2012) examined the gas tungsten arc weld performance of stainless steel and Monel 400 in the molten salt surroundings comprising potassium sulphate and sodium chloride at 600 °C. The dissimilar integration of stainless steel and Monel 400 have typical applications in hot and corrosive environments, such as heat exchangers in chemical and nuclear industries [8]. Janakiram et al. (2006) stated that the operating surroundings of these dissimilar joints of metal include high temperatures and the existence of different elements which integrate to form the molten salts inherently, and, thus, it forms the eutectic combination during the operations. The integration of these molten salt deposits at high temperatures are riskier and will fuse onto a dissimilar system of metal, thereby enhancing the corrosion attack. Hence, weld characterization is essential both in high temperature and in transient conditions before industrial use [9].
Post-weld heat treatment is often used to improve the mechanical properties of welded joints. Firas Al Quran et al. (2010) have studied the effects of different heat treatments on hardness and corrosion resistance [10]. The annealing process resulted in increased corrosion resistance. From a wide range of experiments, the optimum time and temperature were established as 45 min at 740 °C, respectively. It is well-known that cryogenic treatment is used to improve the mechanical properties of a material. Subzero-temperature treatments have been in use for quite a long time, especially to improve the wear resistance of steels. During cryogenic treatments, the austenitic structure retained during previous quenching operations is converted to martensite, and the second phase precipitation is be enhanced. The applications of this treatment are extended to other materials [11]. Ilyas Uygur et al. (2015) used electrochemical impedance analysis to study the corrosion resistance of D3 steel, using NaCl environment, and they observed significant improvements in corrosion resistance [12]. Potentiodynamic analysis and electrochemical impedance analysis are widely used to analyze the corrosion resistance of welded joints. Energy dispersive spectrometry is used for analyzing the corrosion resistance and protective layer formation in welded joints [13].
The objectives of the present study are as follows:
  • Gas tungsten arc welding of SS 316L and Monel 400 alloy using ENiCrFe-5 filler material;
  • Post-weld heat treatment (annealing) and cryogenic treatment on weld specimens;
  • Potentiodynamic and electrochemical analyses for corrosion resistance of the treated specimens;
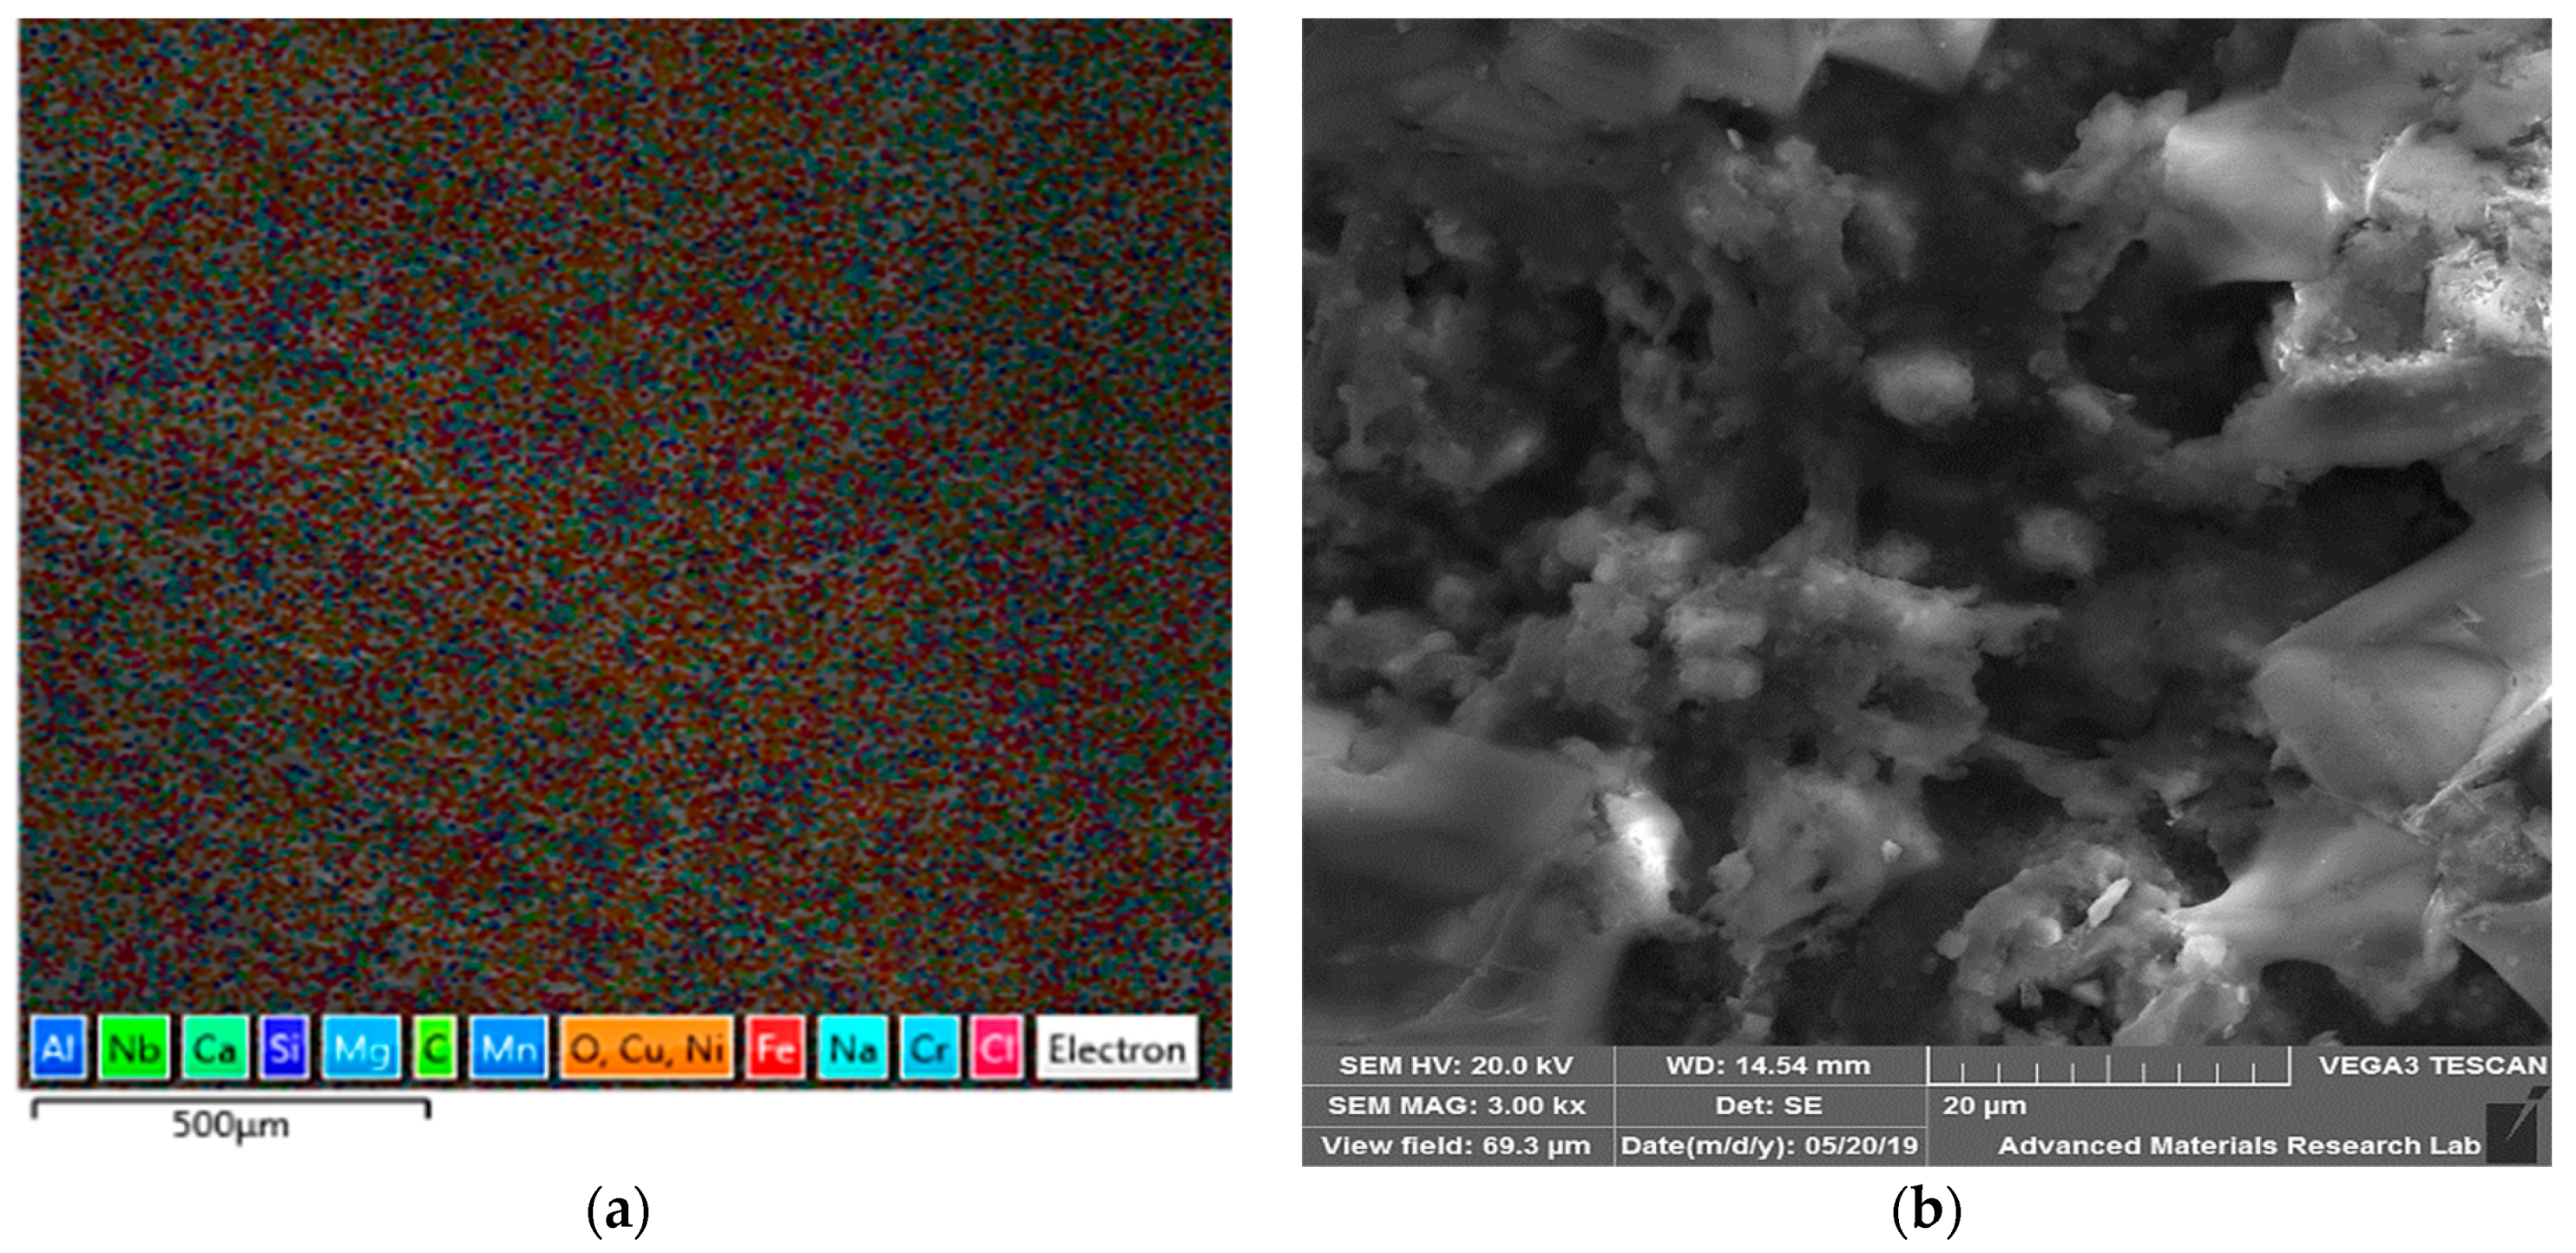
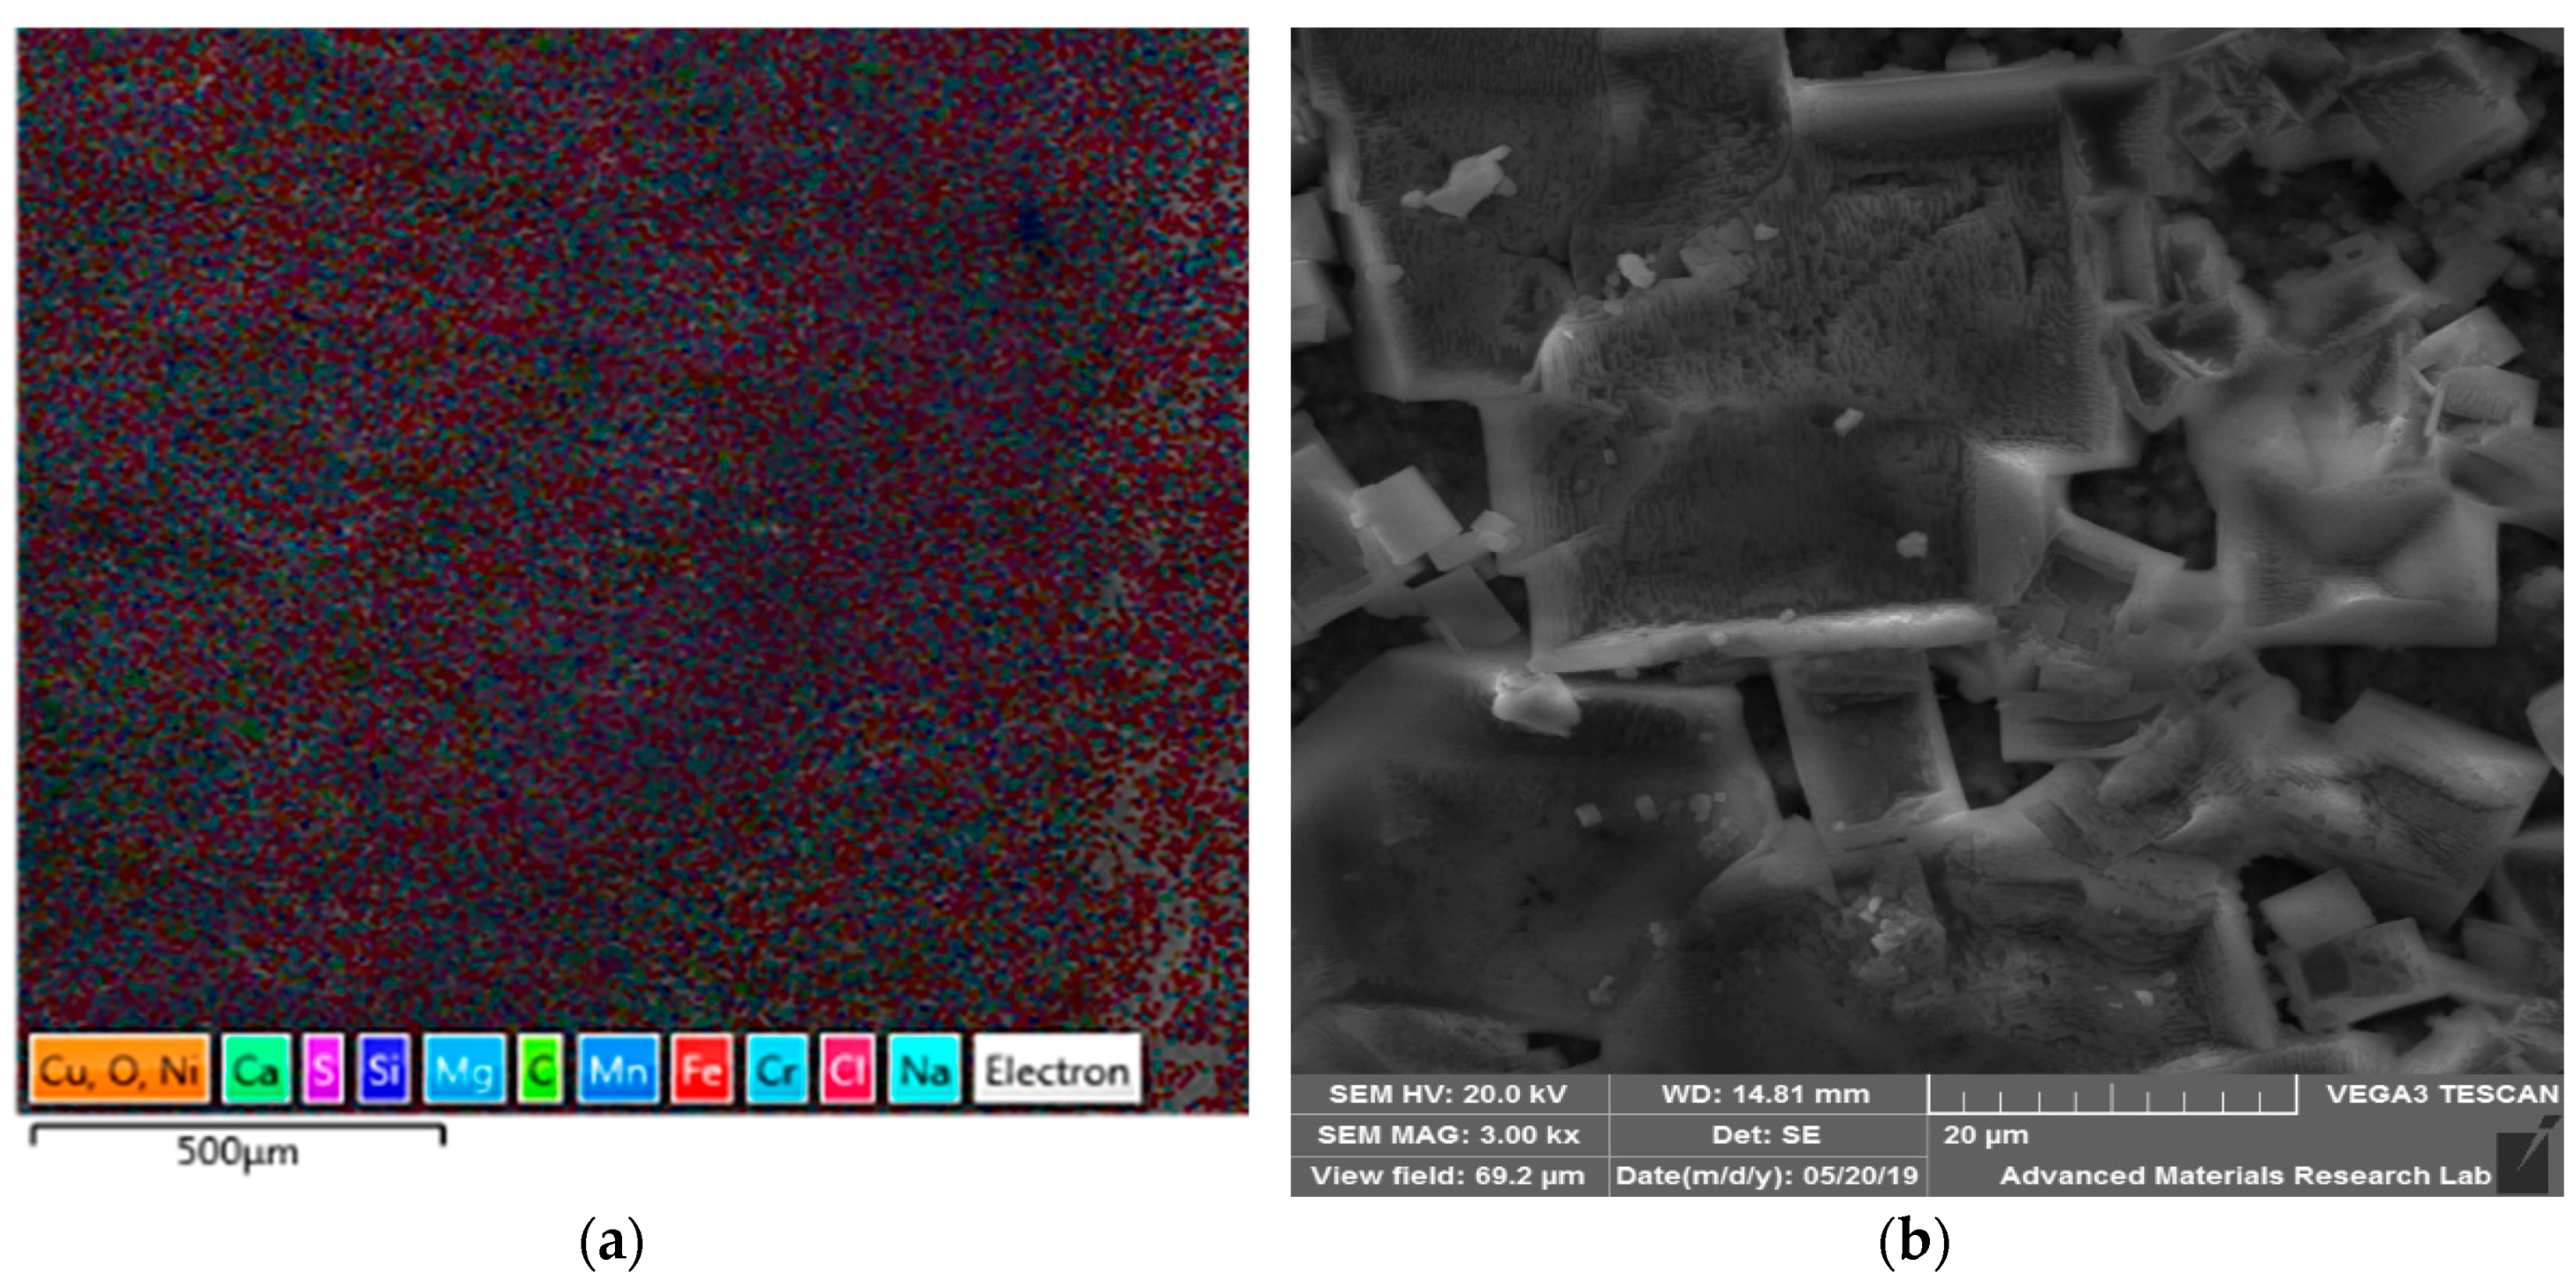
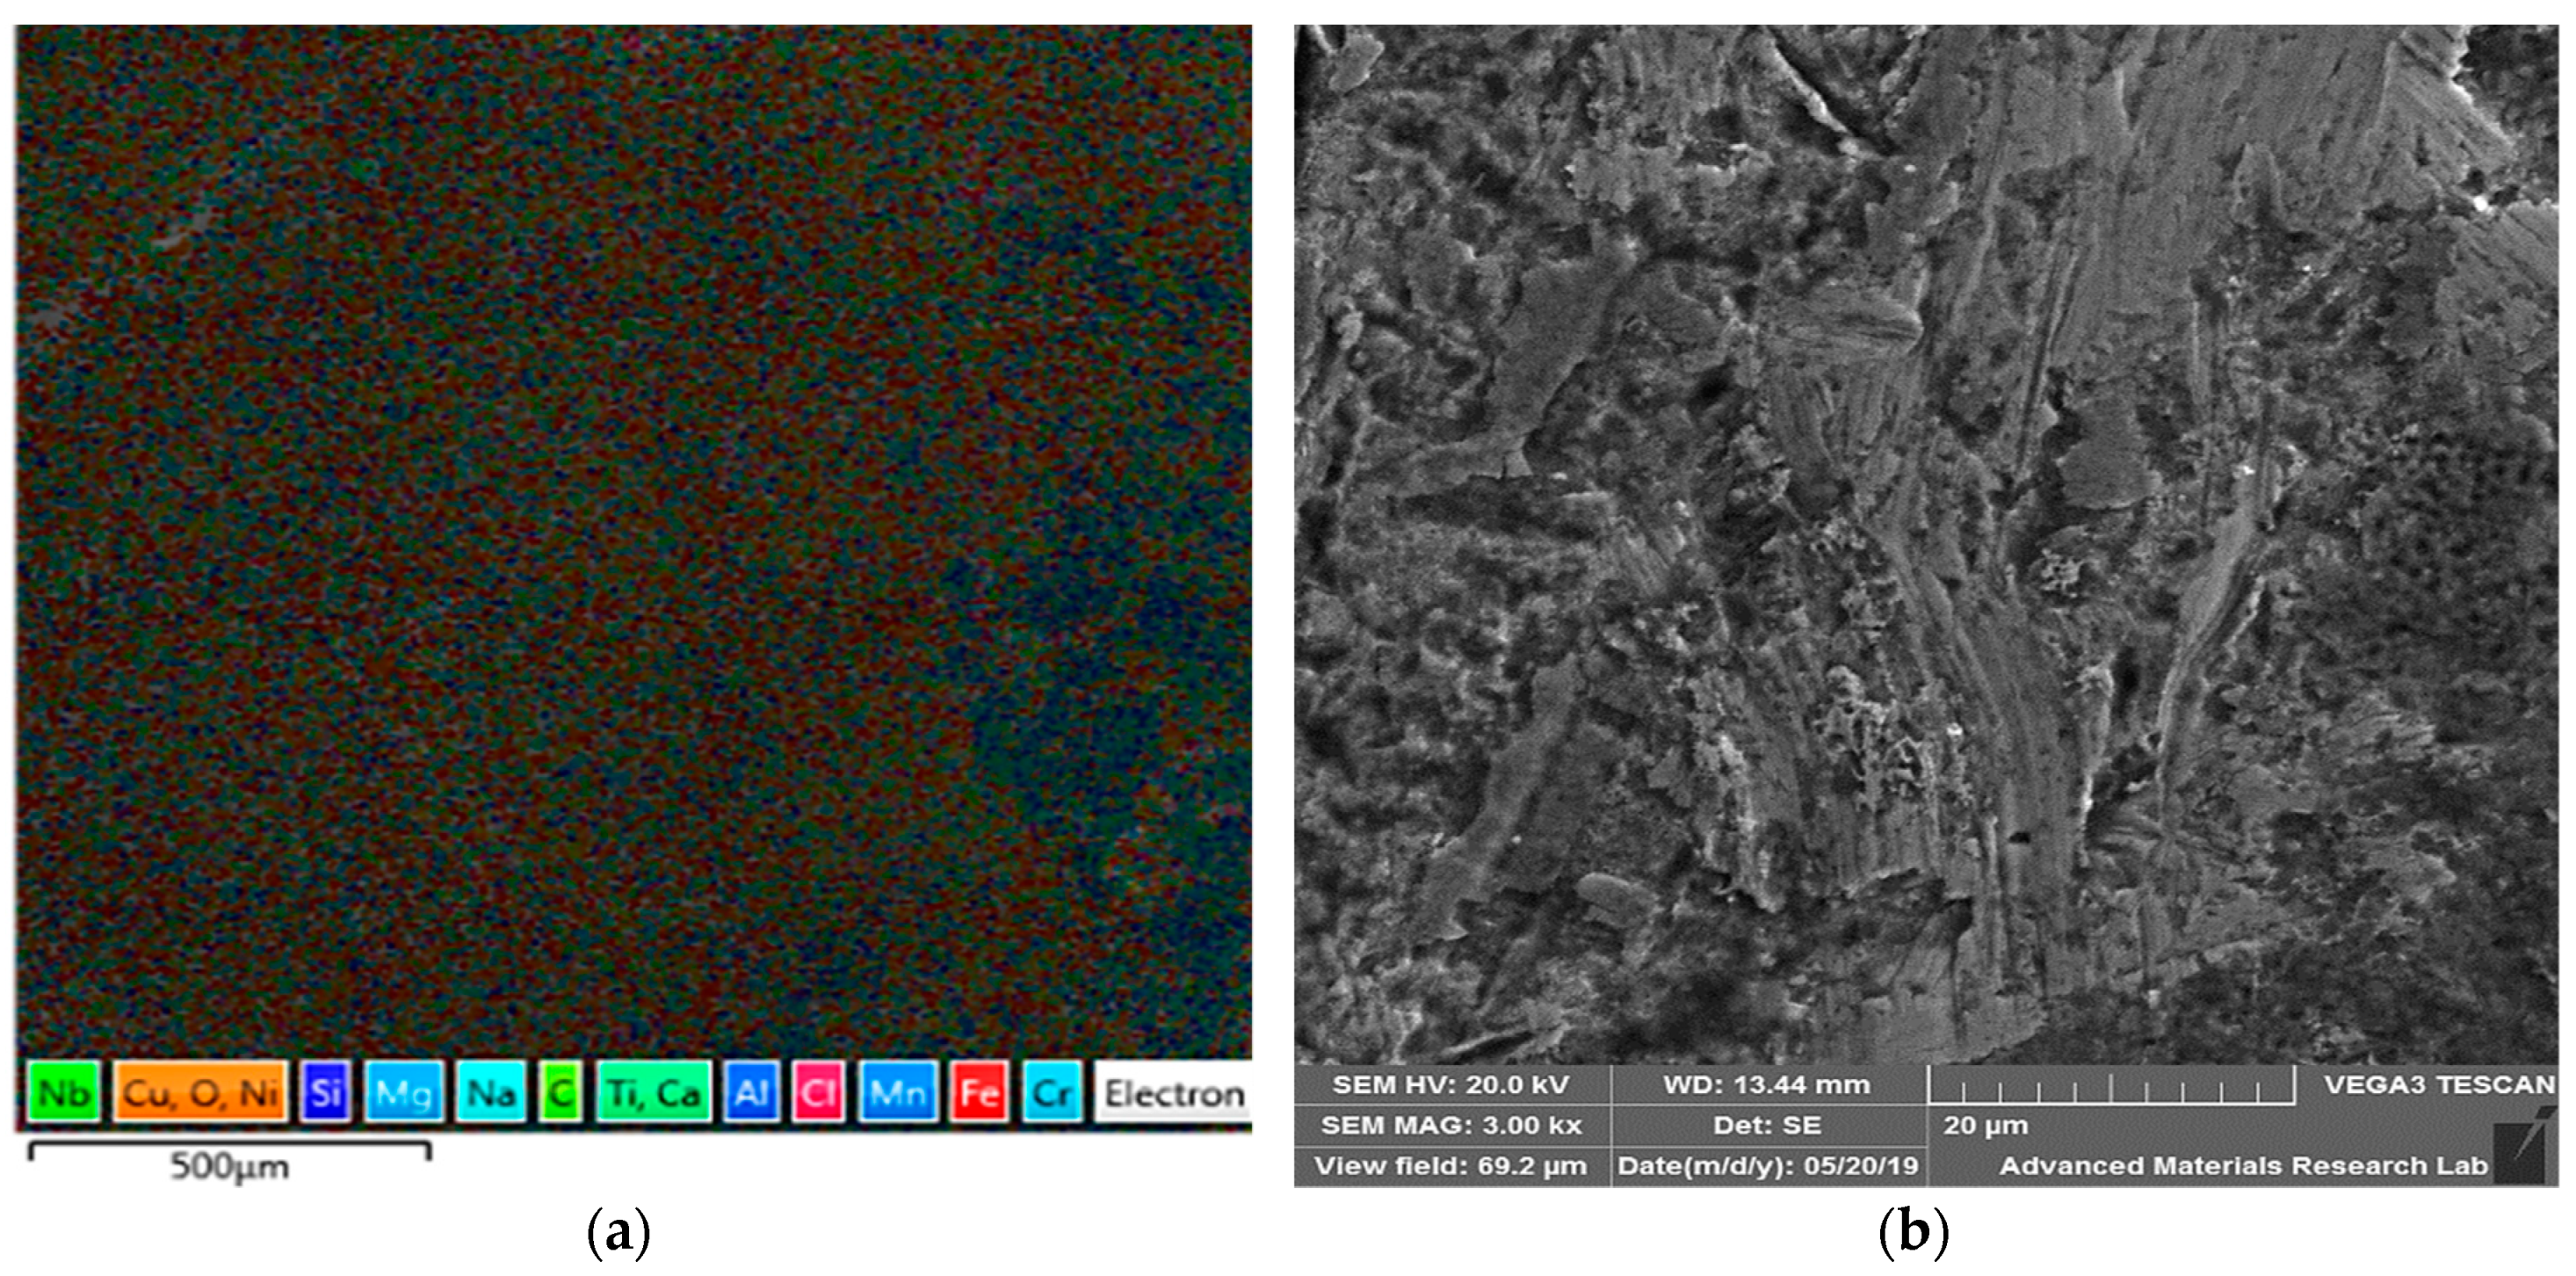
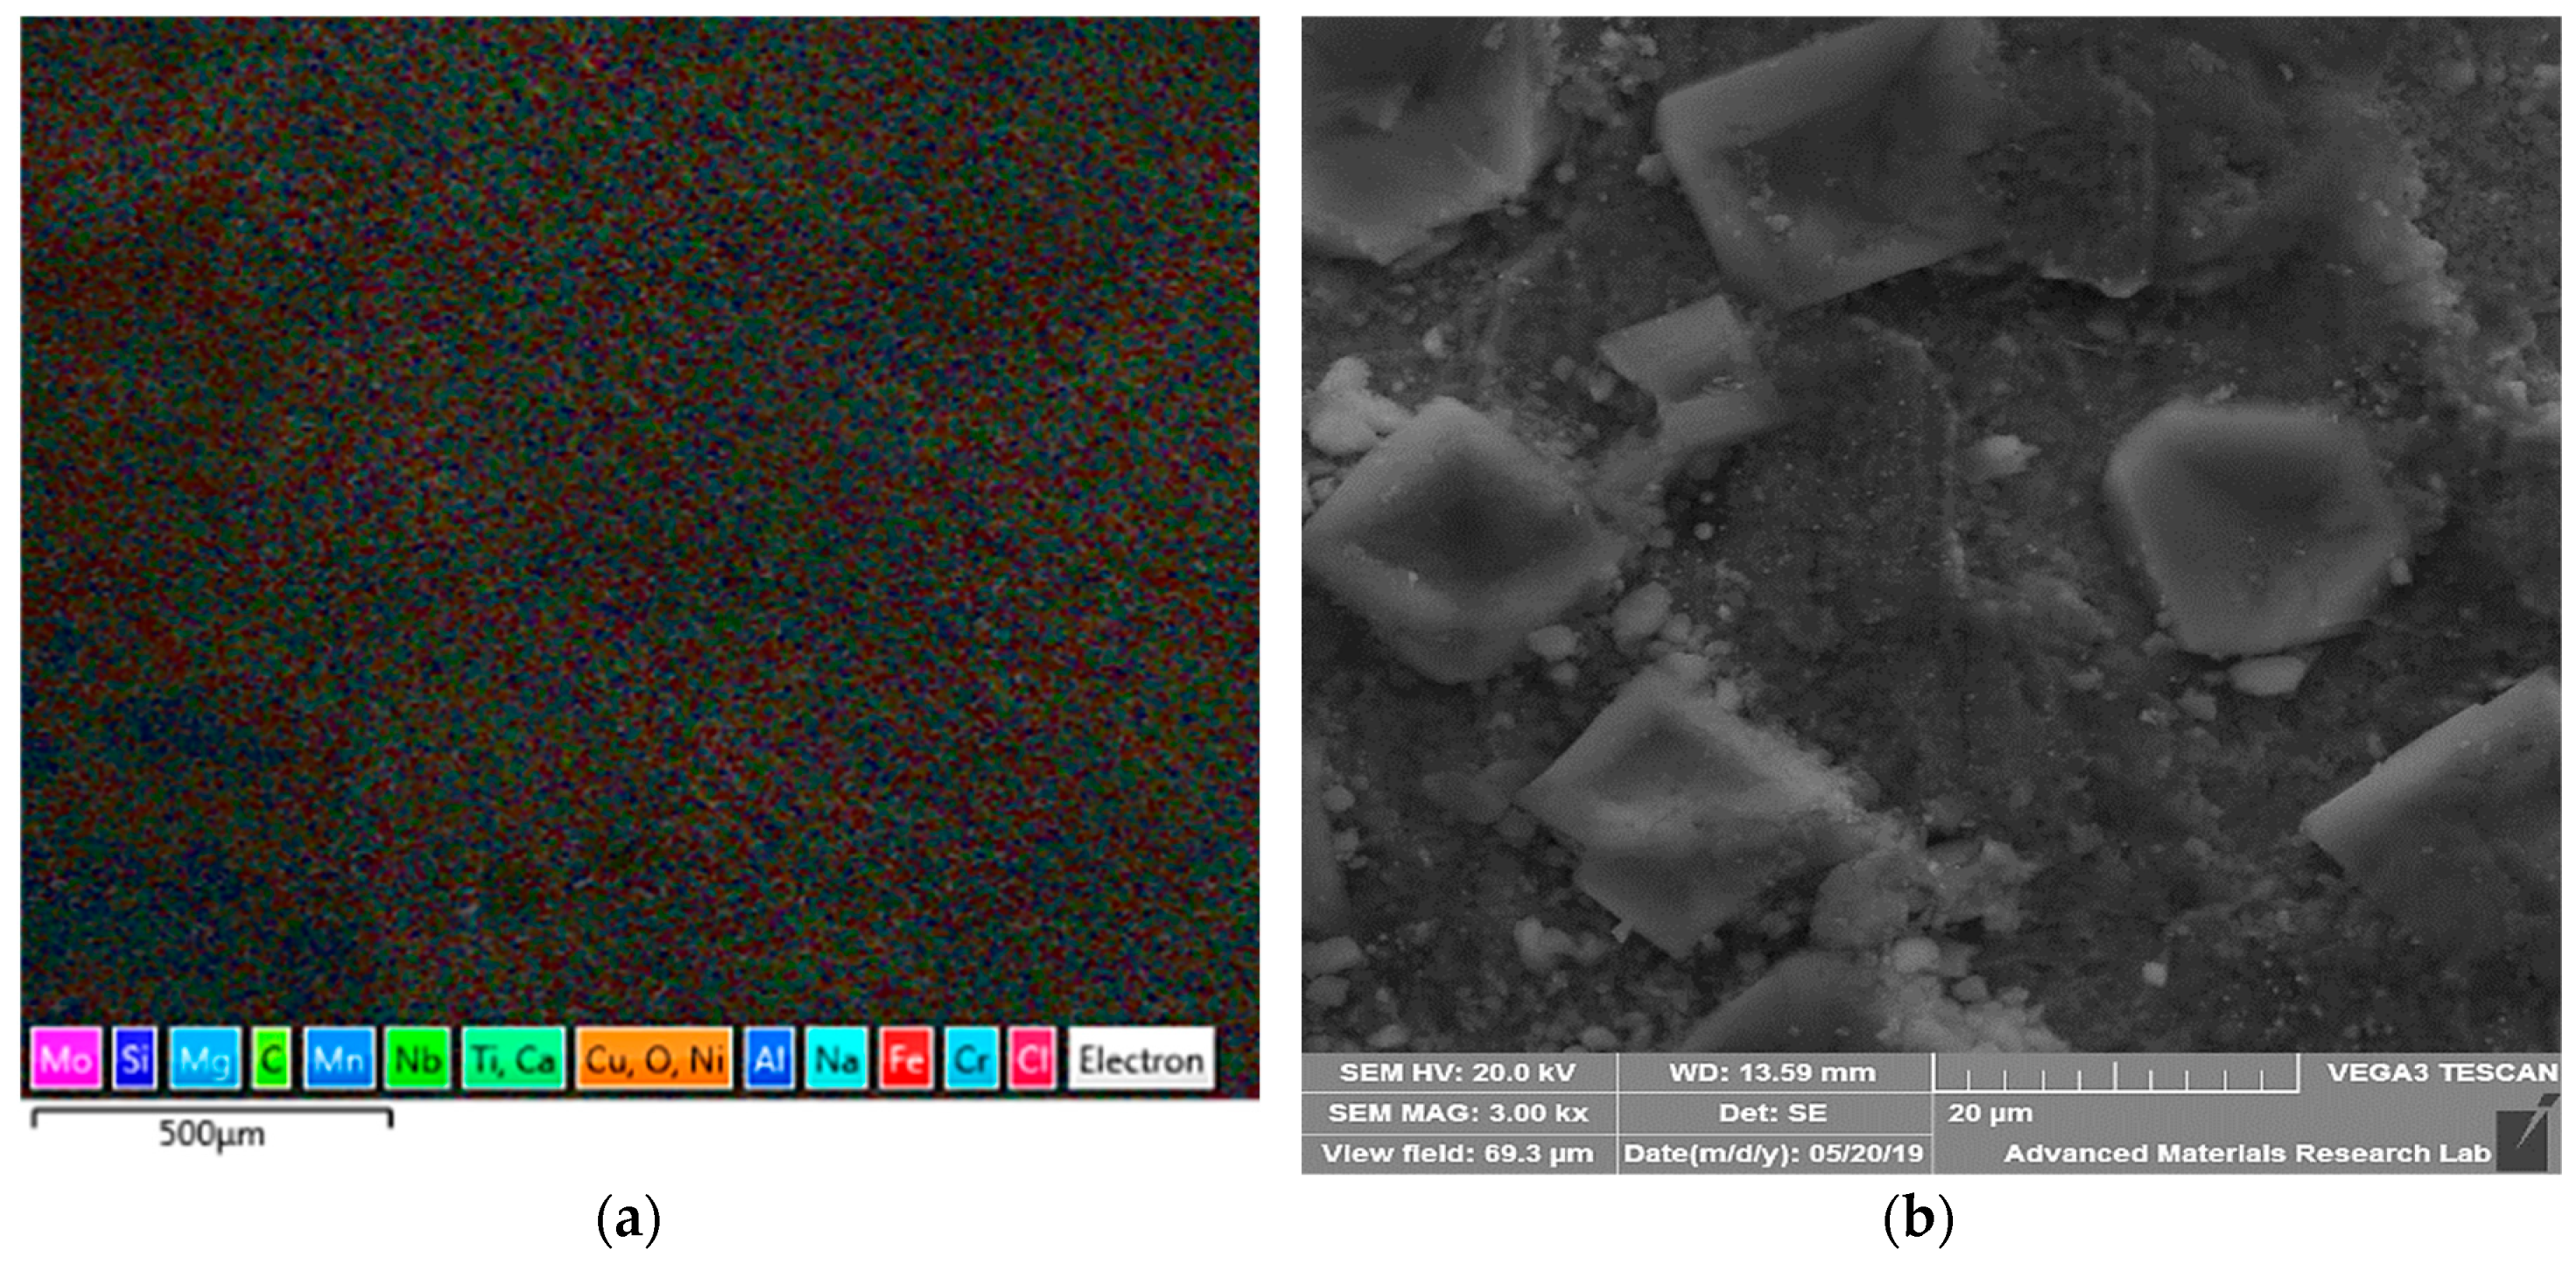
  • SEM and EDS analysis of the corroded specimens to understand the results obtained in the corrosion tests.

2. Materials and Methods

2.1. Materials

3 mm plates of Monel 400 and SS 316L with filler material of ENiCrFe-5 of dimensions 120 mm (L) × 200 mm (W) were welded using GTAW, for specimen preparation. Table 1 shows the chemical composition of base materials and filler wire.

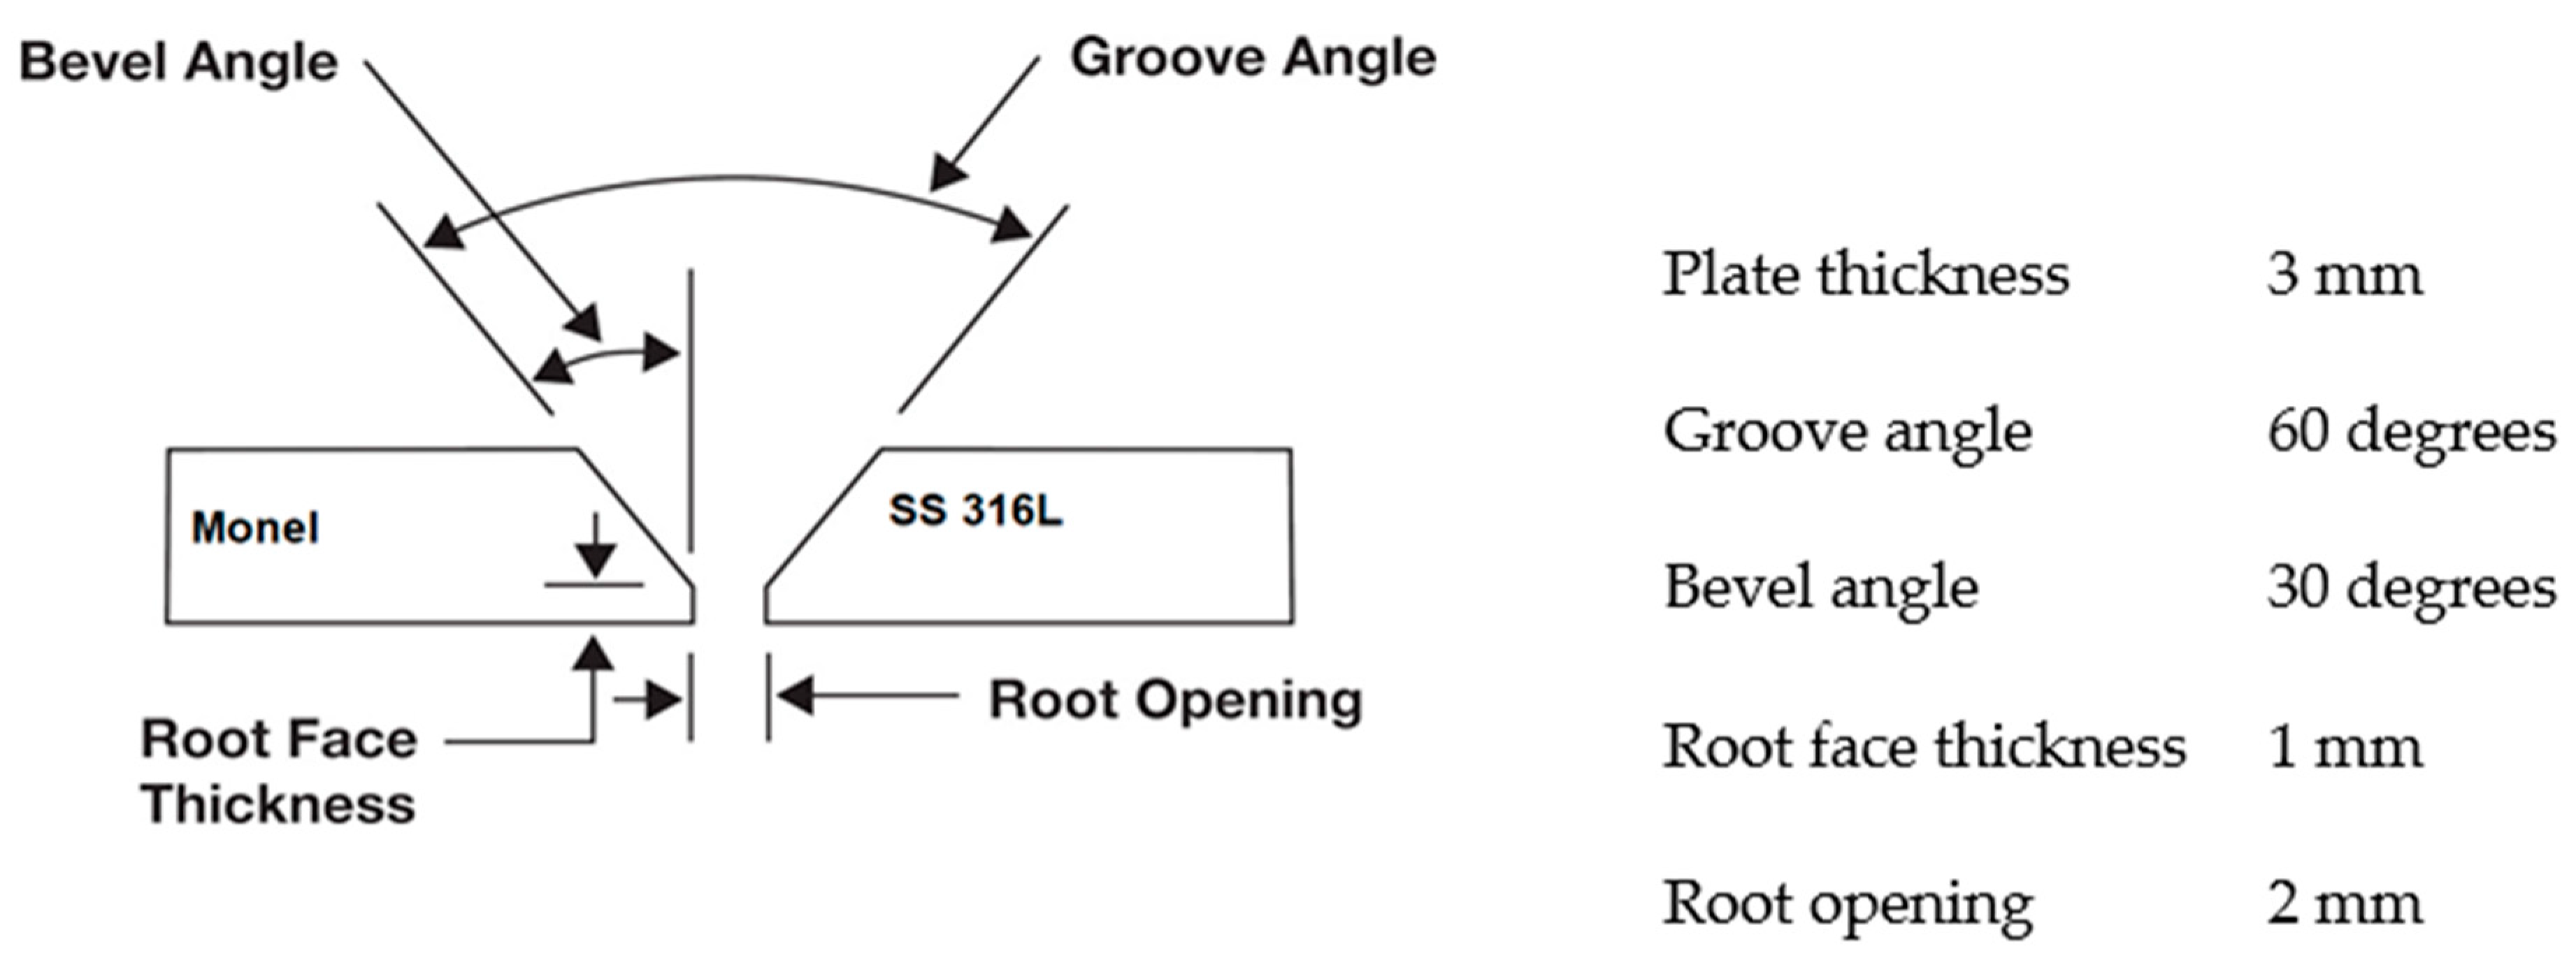
2.2. Welding and Post-Weld Treatments

Monel 400 and SS 316L plates were welded with filler material ENiCrFe-5 by GTAW process. The edge preparation with a V-groove of 30° with a root gap of 2 mm fit-up was done to carry out the weld, as shown in Figure 1. The weld current in the range of 80 to 85 Amp, polarity as DCEN, shielding gas of argon at 14 to 18.6 L per minute (LPM) and backing gas of argon with a flow rate 7 to 18.6 LPM were established by trials in line with the recommendations of the filler wire manufacturer. The important regions of interest are weldment, base metal, and the heat affected zone (HAZ) on both sides. Heat-treatment and cryogenic treatments were used to improve the microstructure after welding. Heat-treated (HT) specimens were first heat-treated to 740 °C, at a rate of 150 °C per hour, followed by a soaking time of 15 min, and then furnace cooling to ambient temperature at 200 °C per hour. For cryo-treated (CT) specimens, deep cryogenic treatment (DCT) was additionally carried out at −195 °C and then soaking for 15 min. Liquid nitrogen is preferred as the medium for cryogenic treatment because of its bulk availability in nature and easiness in conversion. The cooling rate was controlled to avoid distortion by controlling the flow rate of liquid nitrogen. After soaking, the specimens were gradually brought to room temperature. The entire DCT cycle took around 9 h, as per DCT cycle [14,15].

2.3. Optical Microscopy, EDS, and SEM

Microscopical examination is used to study the microstructural changes, such as grain size, precipitation, and sensitization, during welding. Various zones of the weld were studied using METSCOPE-1 optical microscope (METCO Pvt Ltd, Chennai, India). The examination was carried out on 5 different regions: the base metal and heat affected zones of SS 316L and Monel 400, and the weld zone. The weld specimens were polished as per the standard metallographic procedures, using SiC emery sheets with grit size varying from 220 to 2000. Disc polishing is carried out by using alumina, degreasing with acetone, and then rinsing with distilled water to obtain a mirror finish of 1 µm on the weld specimens. Parent metal of Monel 400, HAZ of Monel 400, and the weld zone were etched using marble’s reagent, whereas etching of parent metal of SS 316L and HAZ of SS 316L were carried out using aqua regia. The microstructural features generally change based on the heat input, electrode materials, and weld speed. Grain coarsening or grain refinement change of phase and precipitation may occur during welding in different locations, thereby leading to changes in mechanical properties [16]. ASTM E112 Standard test methods were used for determining average grain-size principle via the line intercept method to calculate grain size of different regions of interest. Carbide fraction analysis was carried out using ImageJ software to study the size and fraction of precipitates. The EDS area mapping analysis on the corroded samples of CT and HT were carried out to infer the elemental migration across the weld with a Tescan Vega3 SEM (TESCAN ORSAY HOLDINGS, Kohoutovice, Czech Republic). The focus was on the HAZ of SS 316L and Monel 400 and weld zone. Energy dispersive spectroscopy (EDS) by elemental mapping analysis was also carried out on these coupons to analyze the quantitative elemental profile on each zone of the weld.

2.4. Polarization Analysis and Electrochemical Impedance Spectroscopy Analysis

The reliability of a part is related to its compatibility with the environment where it is in use. Hence, the selection of material for an application in an environment needs a corrosion-rate evaluation in the same environment. Different types of treatments were applied to the metal to improve the corrosion resistance [17]. Weld specimens identified as CT and HT in experimental procedure were cut into 5 pieces, SS 316L base, SS 316L heat affected zone, weld zone, Monel 400 heat affected zone, and Monel 400 base, respectively, for corrosion testing of the average size of specimen 6 mm (w) × 7 mm (b) × 3 mm (thick). The experimental setup consisted of an electrochemical cell which was connected to a corrosion current measurement system while the corrosion potential was varied with reference to ASTM G5 standard for anodic DC polarization tests of specimens, which were previously immersed for one week in 1 molar NaCl solution with distilled water (electrolyte of the electrochemical cell) [18]. The potentiodynamic tests were done using AUTOLAB potentiostat (Metrohm Autolab B.V., Kanaalweg, The Netherlands) and the results were analyzed using Nova version 2.1.1 The experiments were carried out in a conventional three-electrode cell with a platinum and an Ag/Agcl/3MKcl electrode as the counter and the reference, respectively. The specimens were used as the working electrode. The electrochemical impedance spectroscopy tests were conducted using VersaSTAT3 Potentiostat Galvanostat (AMTEK, Princeton Applied Research, Oak Ridge, TN, USA) at a scan rate of 1.068 mV/sec in the applied potential range from −0.28 to 0.05 V. All the experiments were carried out at a room temperature of 25 °C. A delay of 2 min was given for the specimens to reach the steady state condition before the impedance test. To carry out the experiment, the specimens were cut into small pieces, and the exposed surface areas were calculated for the respective specimens to find the current density and polarization parameters, which were noted to be ac potential −0.1 V, dc frequency range 0.01 to 1000 Hz, and amplitude 10 mV RMS. The test was repeated three times to ensure data accuracy.
Electrochemical impedance spectroscopy (EIS) is an analytical tool used to assess the resistance and capacitance of materials to corrosion. For verifying polarization results, EIS is often used [19]. The surface of the electrode has excess surface charge, which is from the well-adjusted accumulation of opposite-charged ions in the solution. This results in electric neutrality of the system. The presence of a double layer near the electrode surface is equivalent to a capacitor, which is the foundation of this method [20]. The main benefits of carrying out electrochemical impedance spectroscopy on weld specimens assist in providing information on corrosion kinetics and morphology of the corrosion. Electrochemical impedance spectroscopy was performed on weld specimens identified as CT and HT in the experimental procedure and were cut into 5 pieces, SS 316L base, SS 316L HAZ, weld zone, Monel 400 HAZ, and Monel 400 base, respectively, in a 1 M NaCl solution, using VERSASTAT 3. Initially, the specimens were immersed in 1 M NaCl for 30 min for stabilization. When the fluctuation of open circuit potential was limited to 10 mV for a period of 1000 s, the condition was considered stable to proceed with EIS experiments. The frequency range used for the analysis was −0.1 to 10,000 Hz. Impedance analysis was carried out using ZSIMPWIN V3.21 (AMTEK, Princeton Applied Research, Oak Ridge, TN, USA). Impedance response was measured at diverse weld zones of specimens CT and HT with similar variations. The response increases rapidly and reduces at the end, which is similar for both the specimens. The interpretation is made on the weld specimens by correlating impedance data and equivalent circuit. The physical processes happening during corrosion are indicated by the results. Each point in the plot represents the impedance vector’s magnitude and direction at different frequencies [21]. Thus, the Nyquist plot between Z’ (the real part), in terms of resistance, and Z” (imaginary part), in terms of capacitive or inductive, is represented in the form of various frequencies ranging from −0.1 to 10,000 Hz and the graphical representation based on the electrochemical mechanism of each zone of weld specimens.

3. Results

The specimens for HT and CT were prepared by water jet cutting from the welded plate and further machined to smaller specimens for different regions, including base metal, HAZ, and weld zone of SS 316L and Monel 400, as identified in Figure 2. SEM, EDS, optical microscopy, polarization, and EIS studies were carried out, and the results were discussed for different regions of interest, as distinguished in Figure 2.

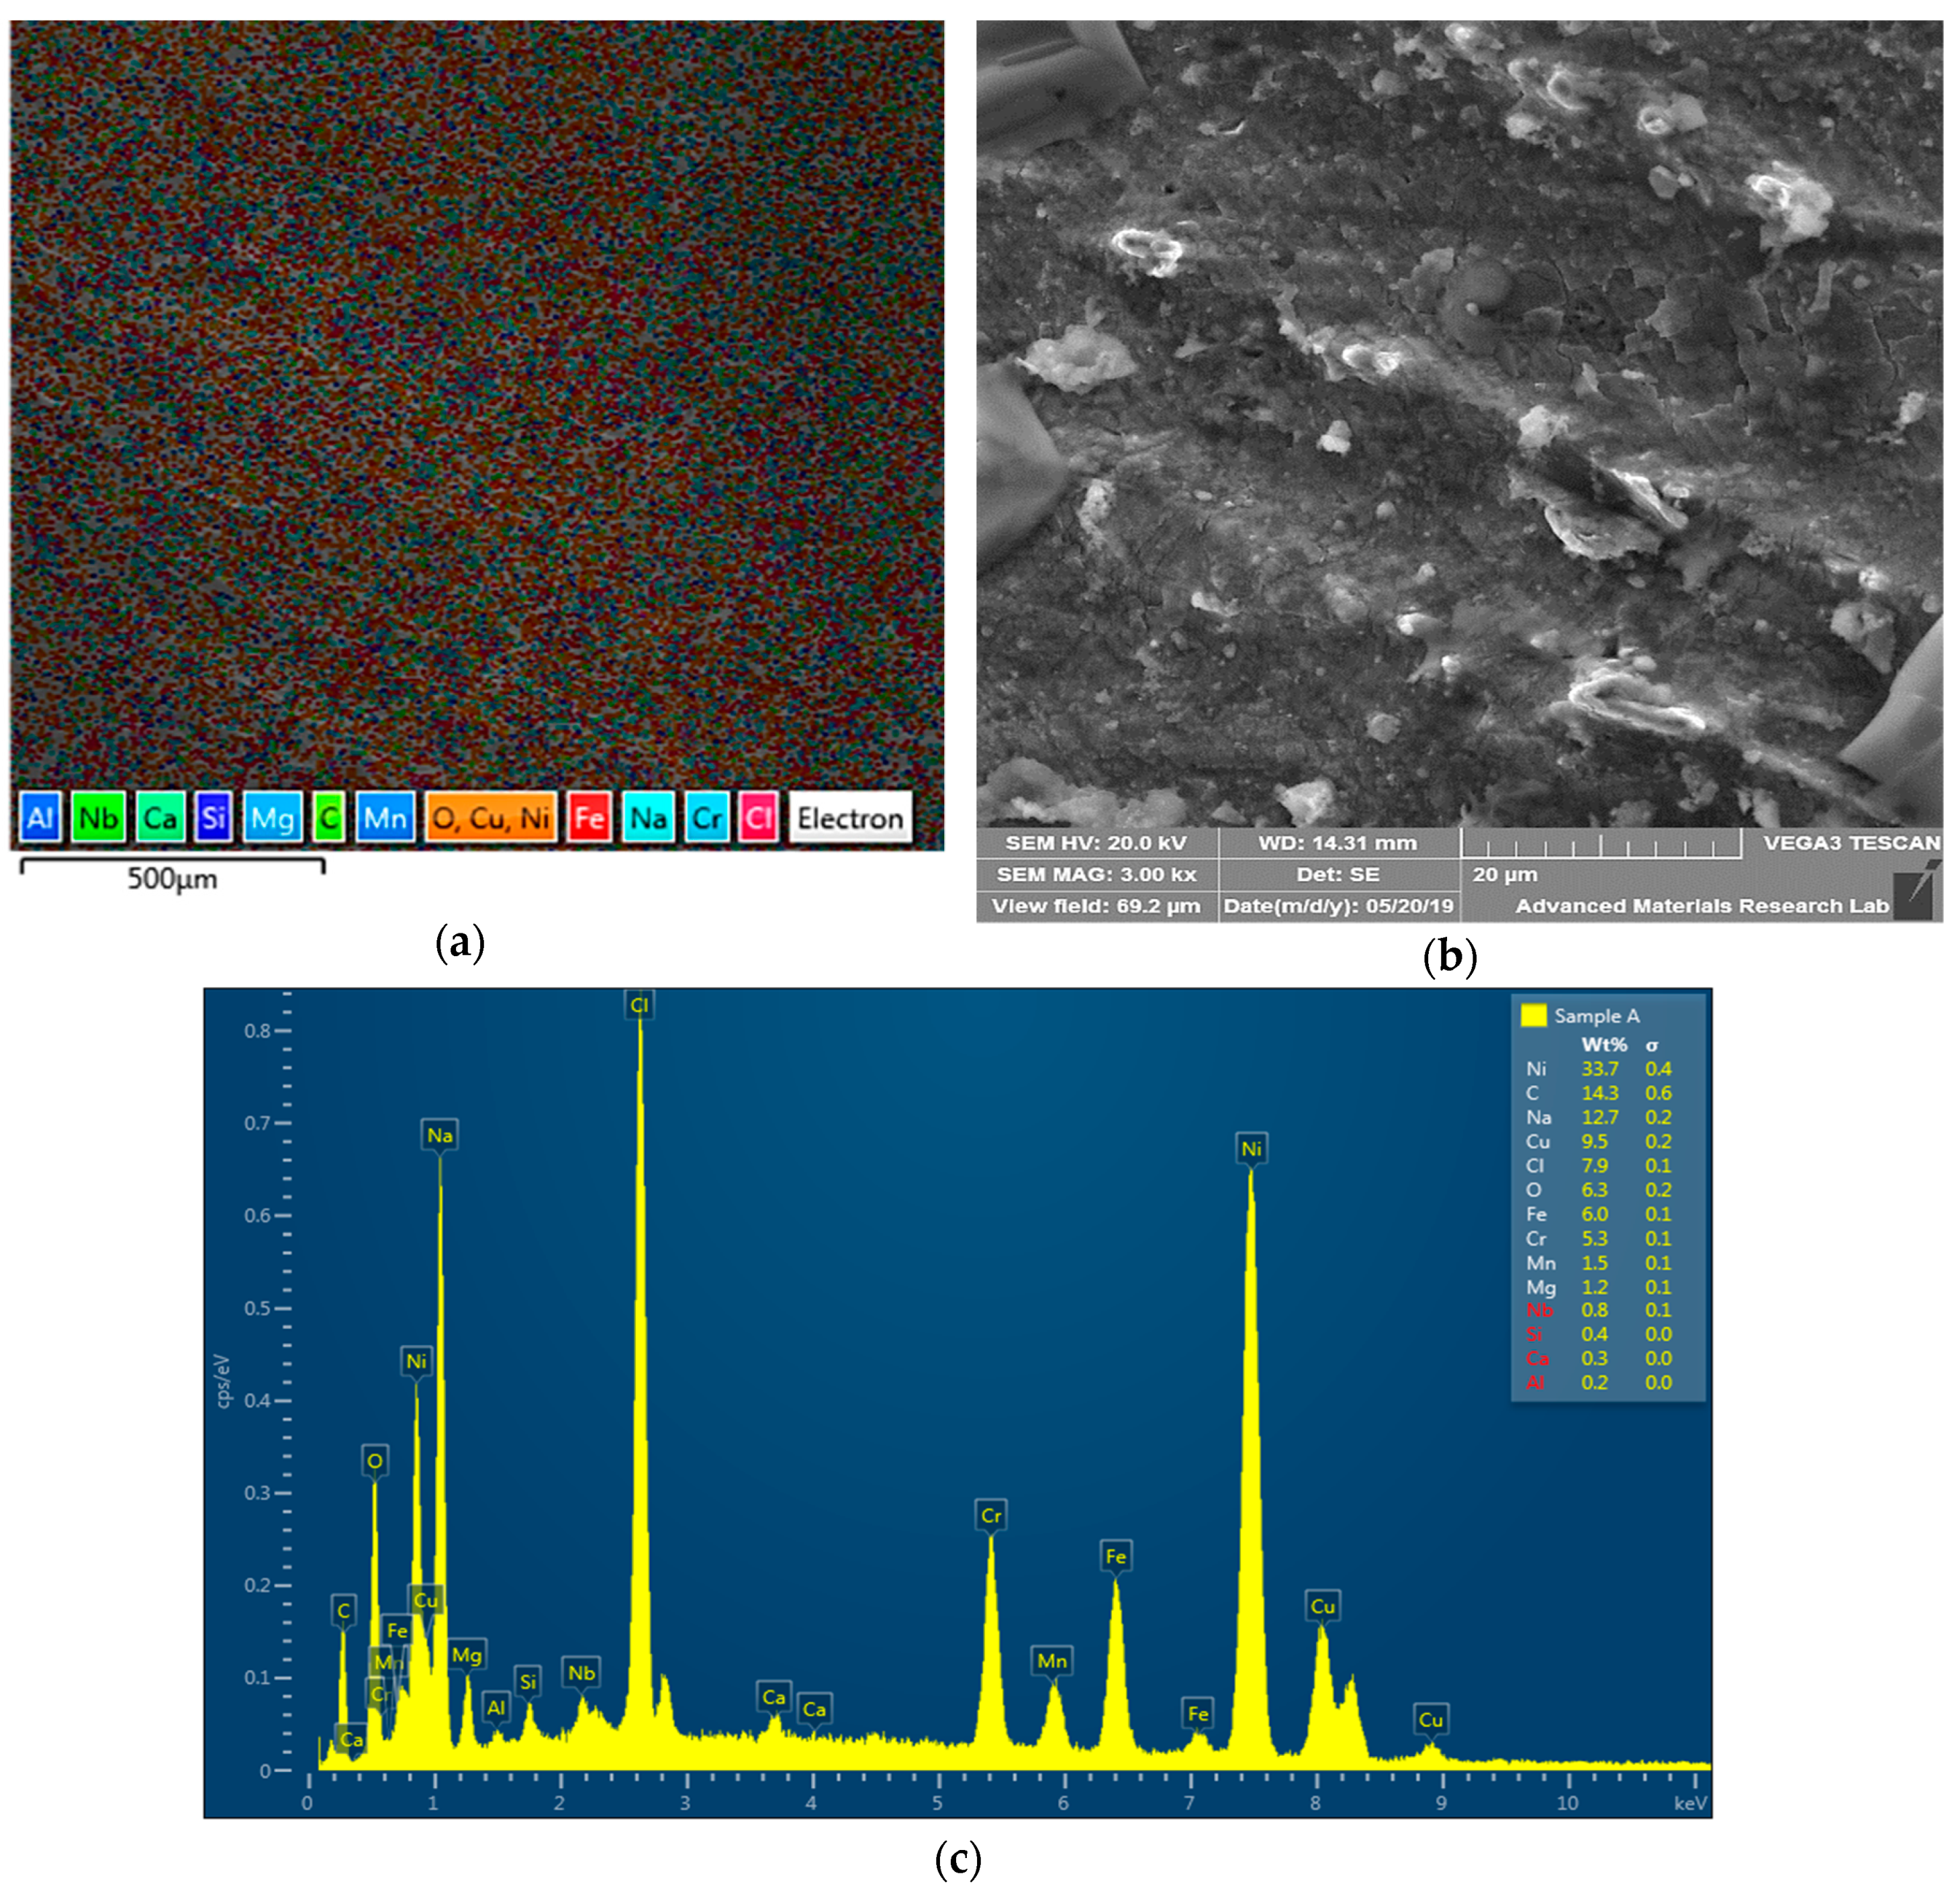
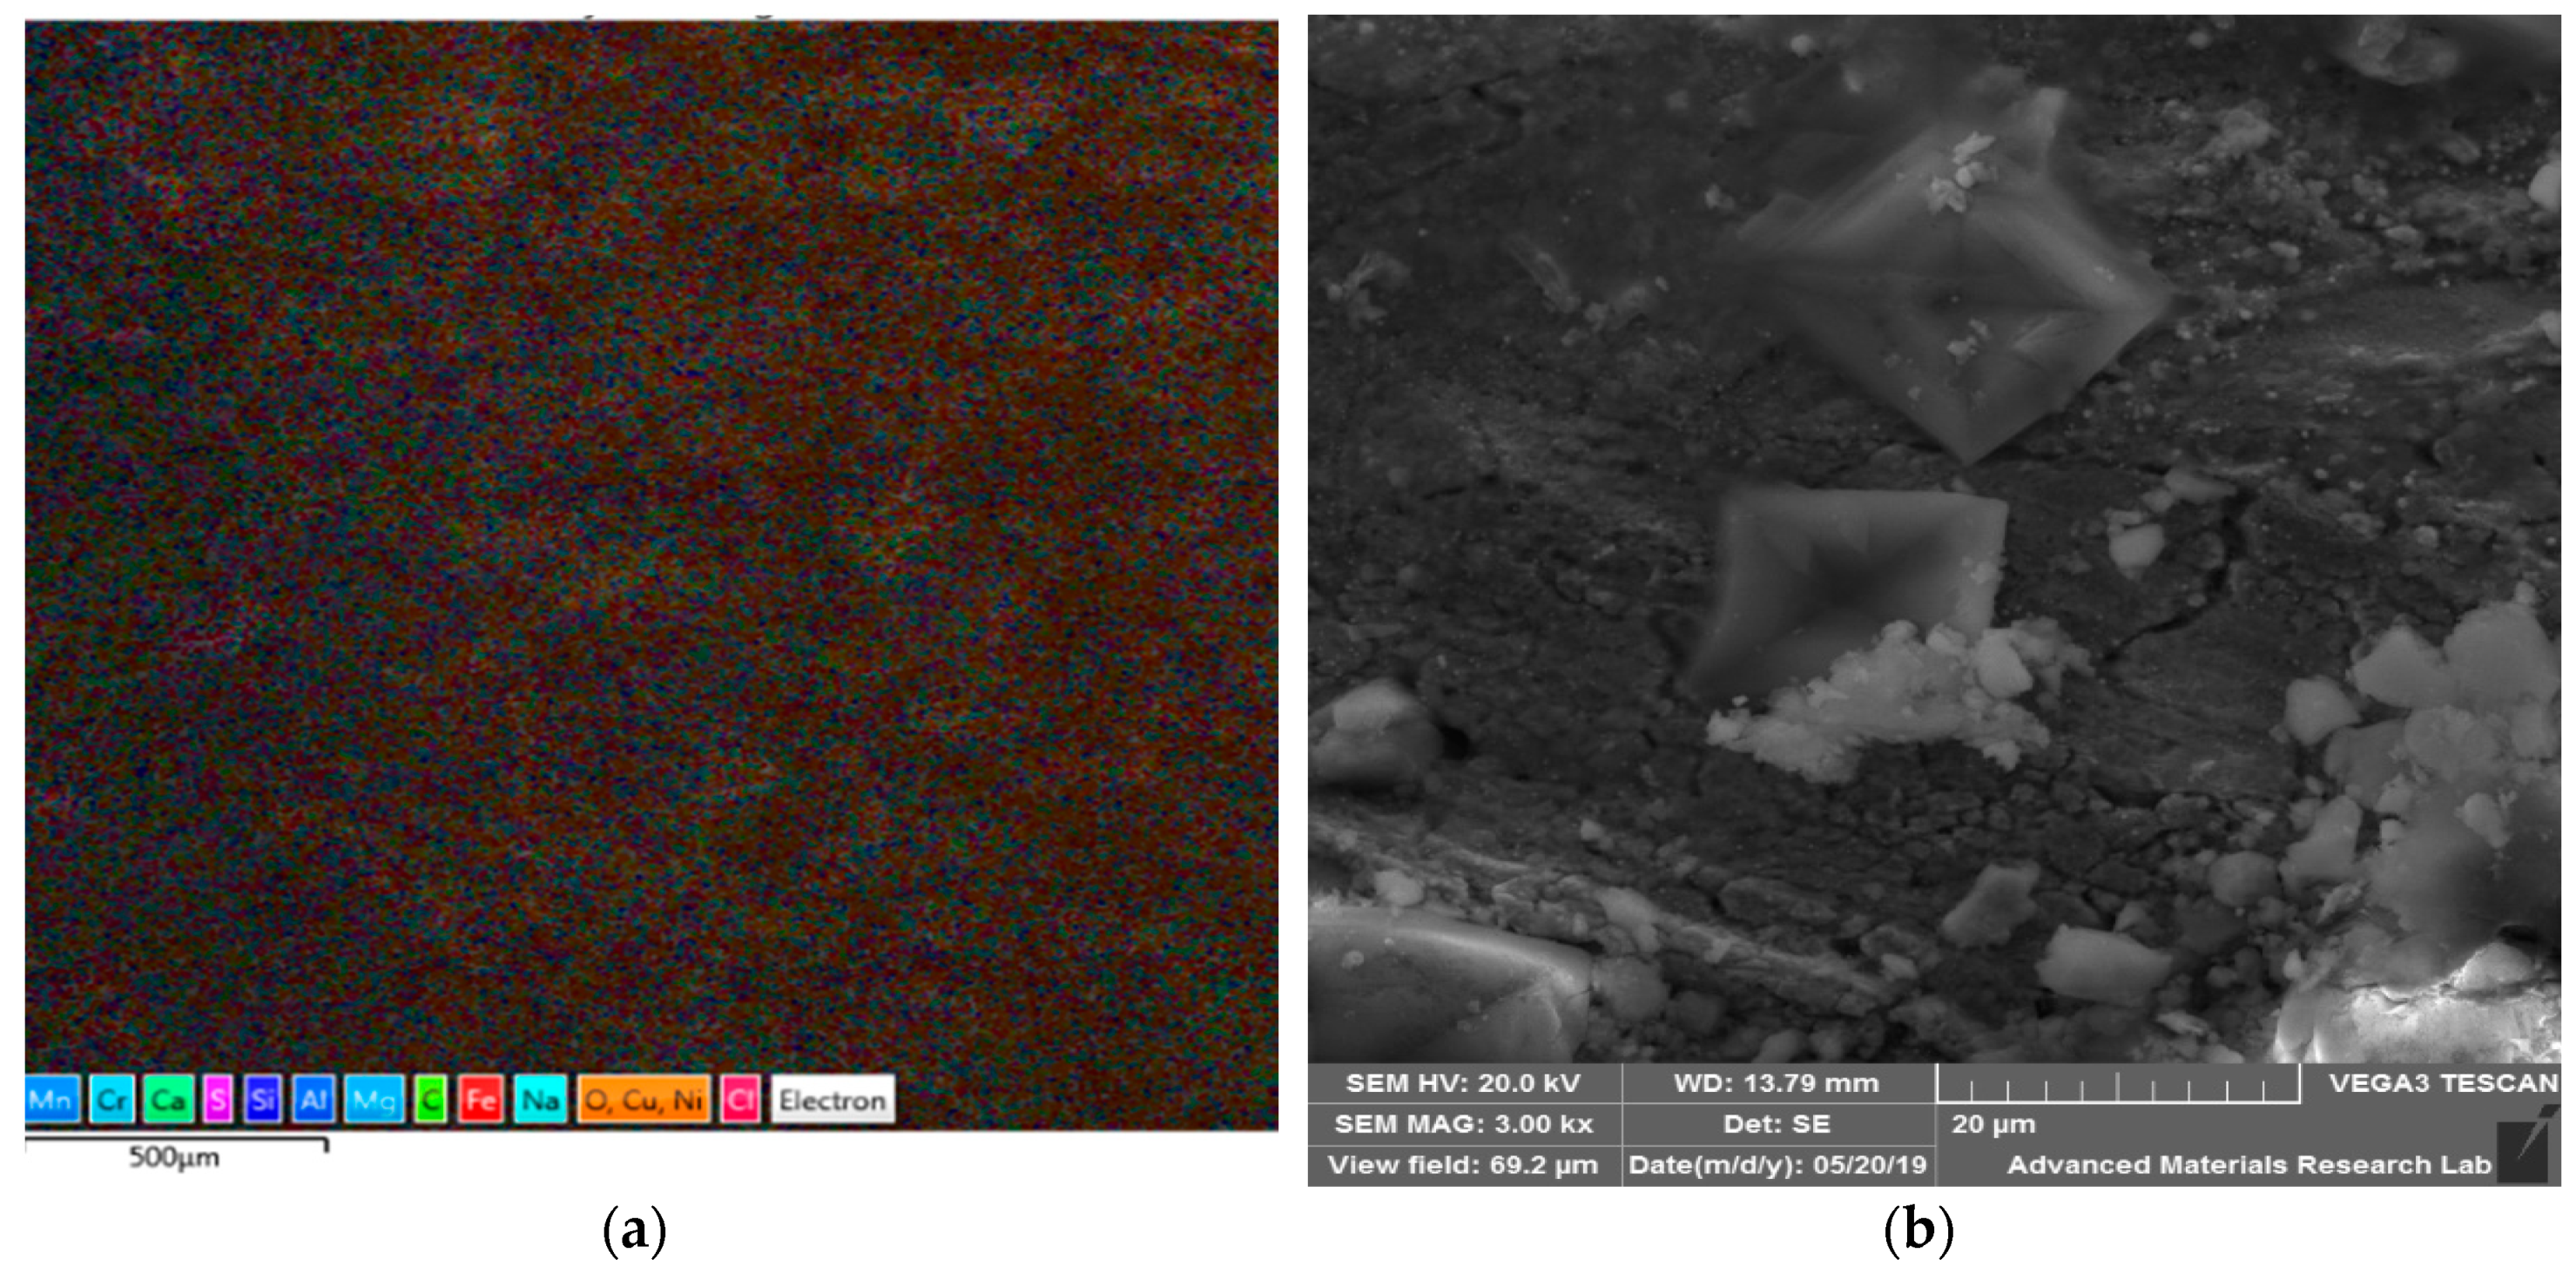
3.1. Optical Microscopy, EDS, and SEM

The micrographs of dissimilar metal joints employing ERNiCrFe-5 filler metal were studied for CT and HT specimens on locations, as shown in Figure 2, which has also shown good fusion of alloys used (Figure 3a–j). SS 316L HAZ, SS 316L fusion line, weld zone, Monel 400 fusion line, and Monel 400 HAZ are the regions of interest for specimens HT and CT. The major observations are as follows:
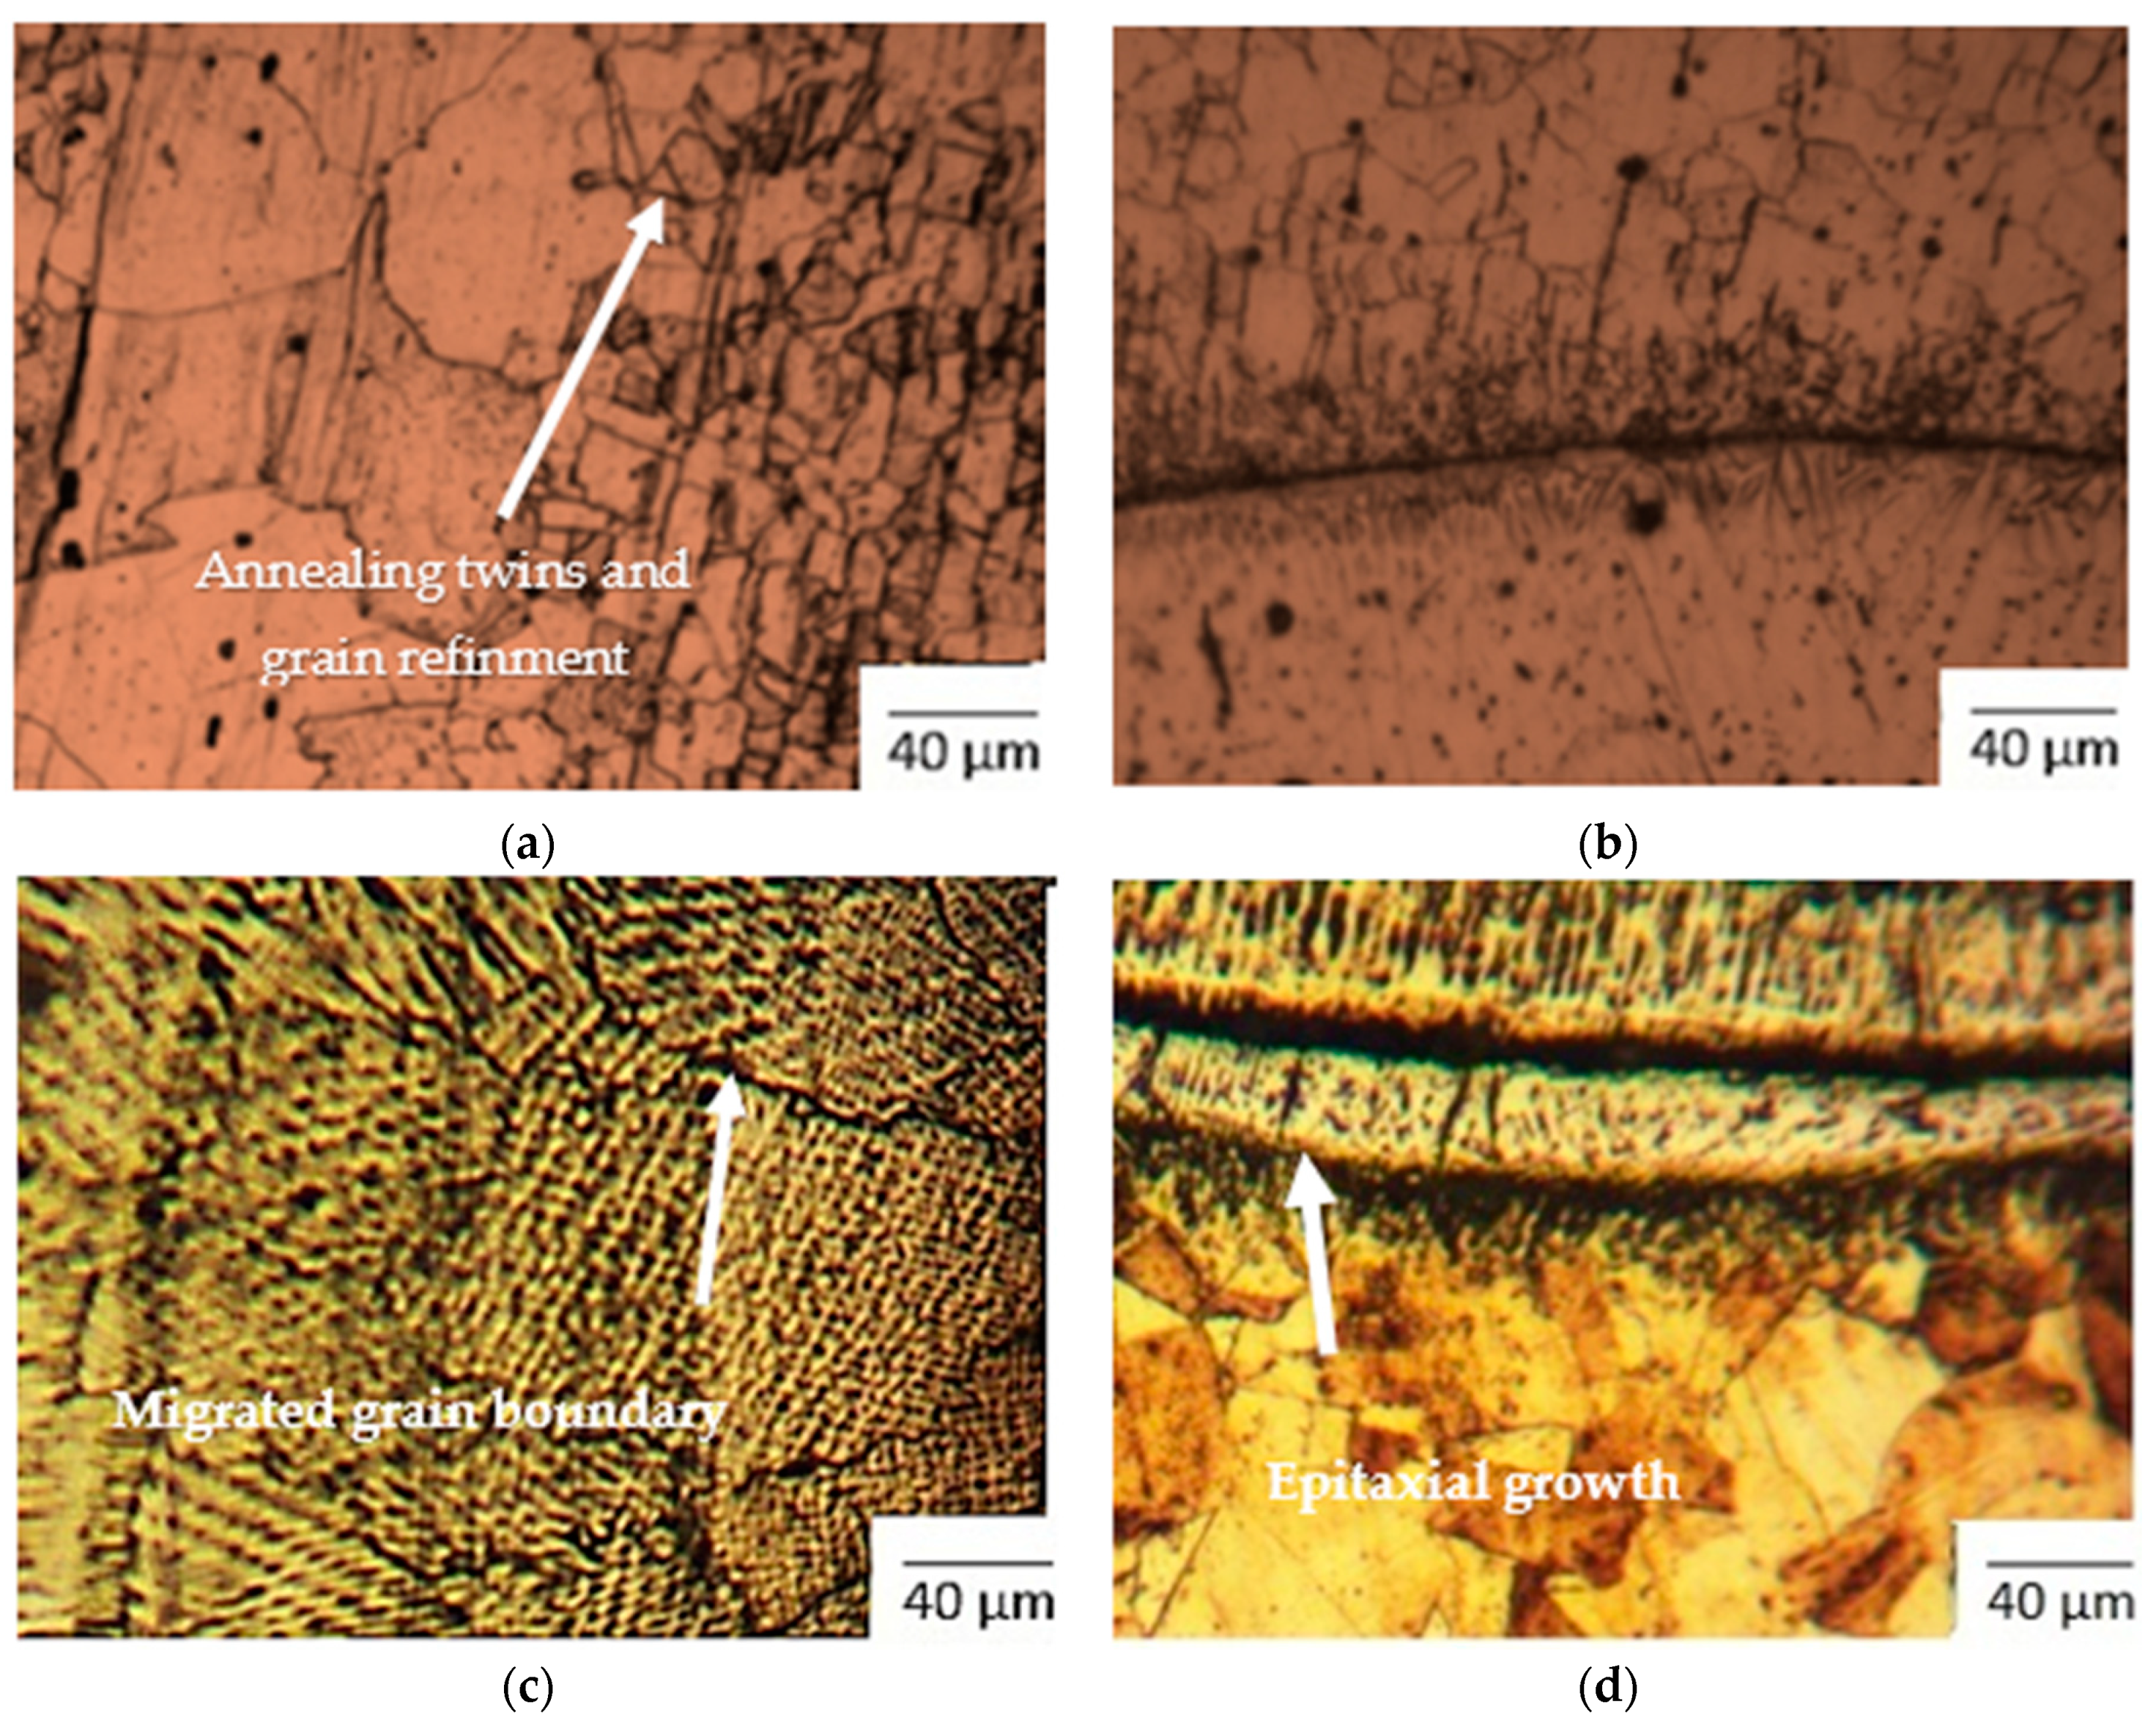
  • SS 316L HAZ of the CT specimen has revealed annealing twins and grain refinement (Figure 3a). The grain size number was in the range of 11 to 13 (smaller is coarser), as per ASTM E112. The area fraction of carbide precipitates was found to be 2.52%, with an average carbide precipitate size of 1.335 µm.
  • Figure 3b shows the optical image of SS 316L weld fusion zone, which has the grain number 13. Carbide precipitates for 2.68% of its area, with an average precipitate size of 2.78 µm, was observed.
  • Migrated grain boundaries were observed at the weld zone in Figure 3c for the CT specimen. Similar results were presented by and Devendranath Ramkumar et al. in 2015 for SS/Inconel dissimilar metal welding [22]. Carbide precipitation was observed at 6.27%, with an average precipitate size of 3.811 µm. The grain size number was noted to be close to 8.
  • Epitaxial growth in weld fusion zone was noted in Figure 3d for the CT specimen. Epitaxial growth was detected prominently at the fusion boundary of ERNiCrFe-5 weld with Monel 400. This phenomenon was also reported by Farahani et al. during welding of Inconel 617 alloy [23]. The epitaxial growth normally occurs in the weld and base materials which have a similar crystal microstructure. The grain size number of 14 was observed for the microstructure.
  • Figure 3e of the CT specimen shows Monel 400 HAZ, which has a grain size number from 11 to 13.
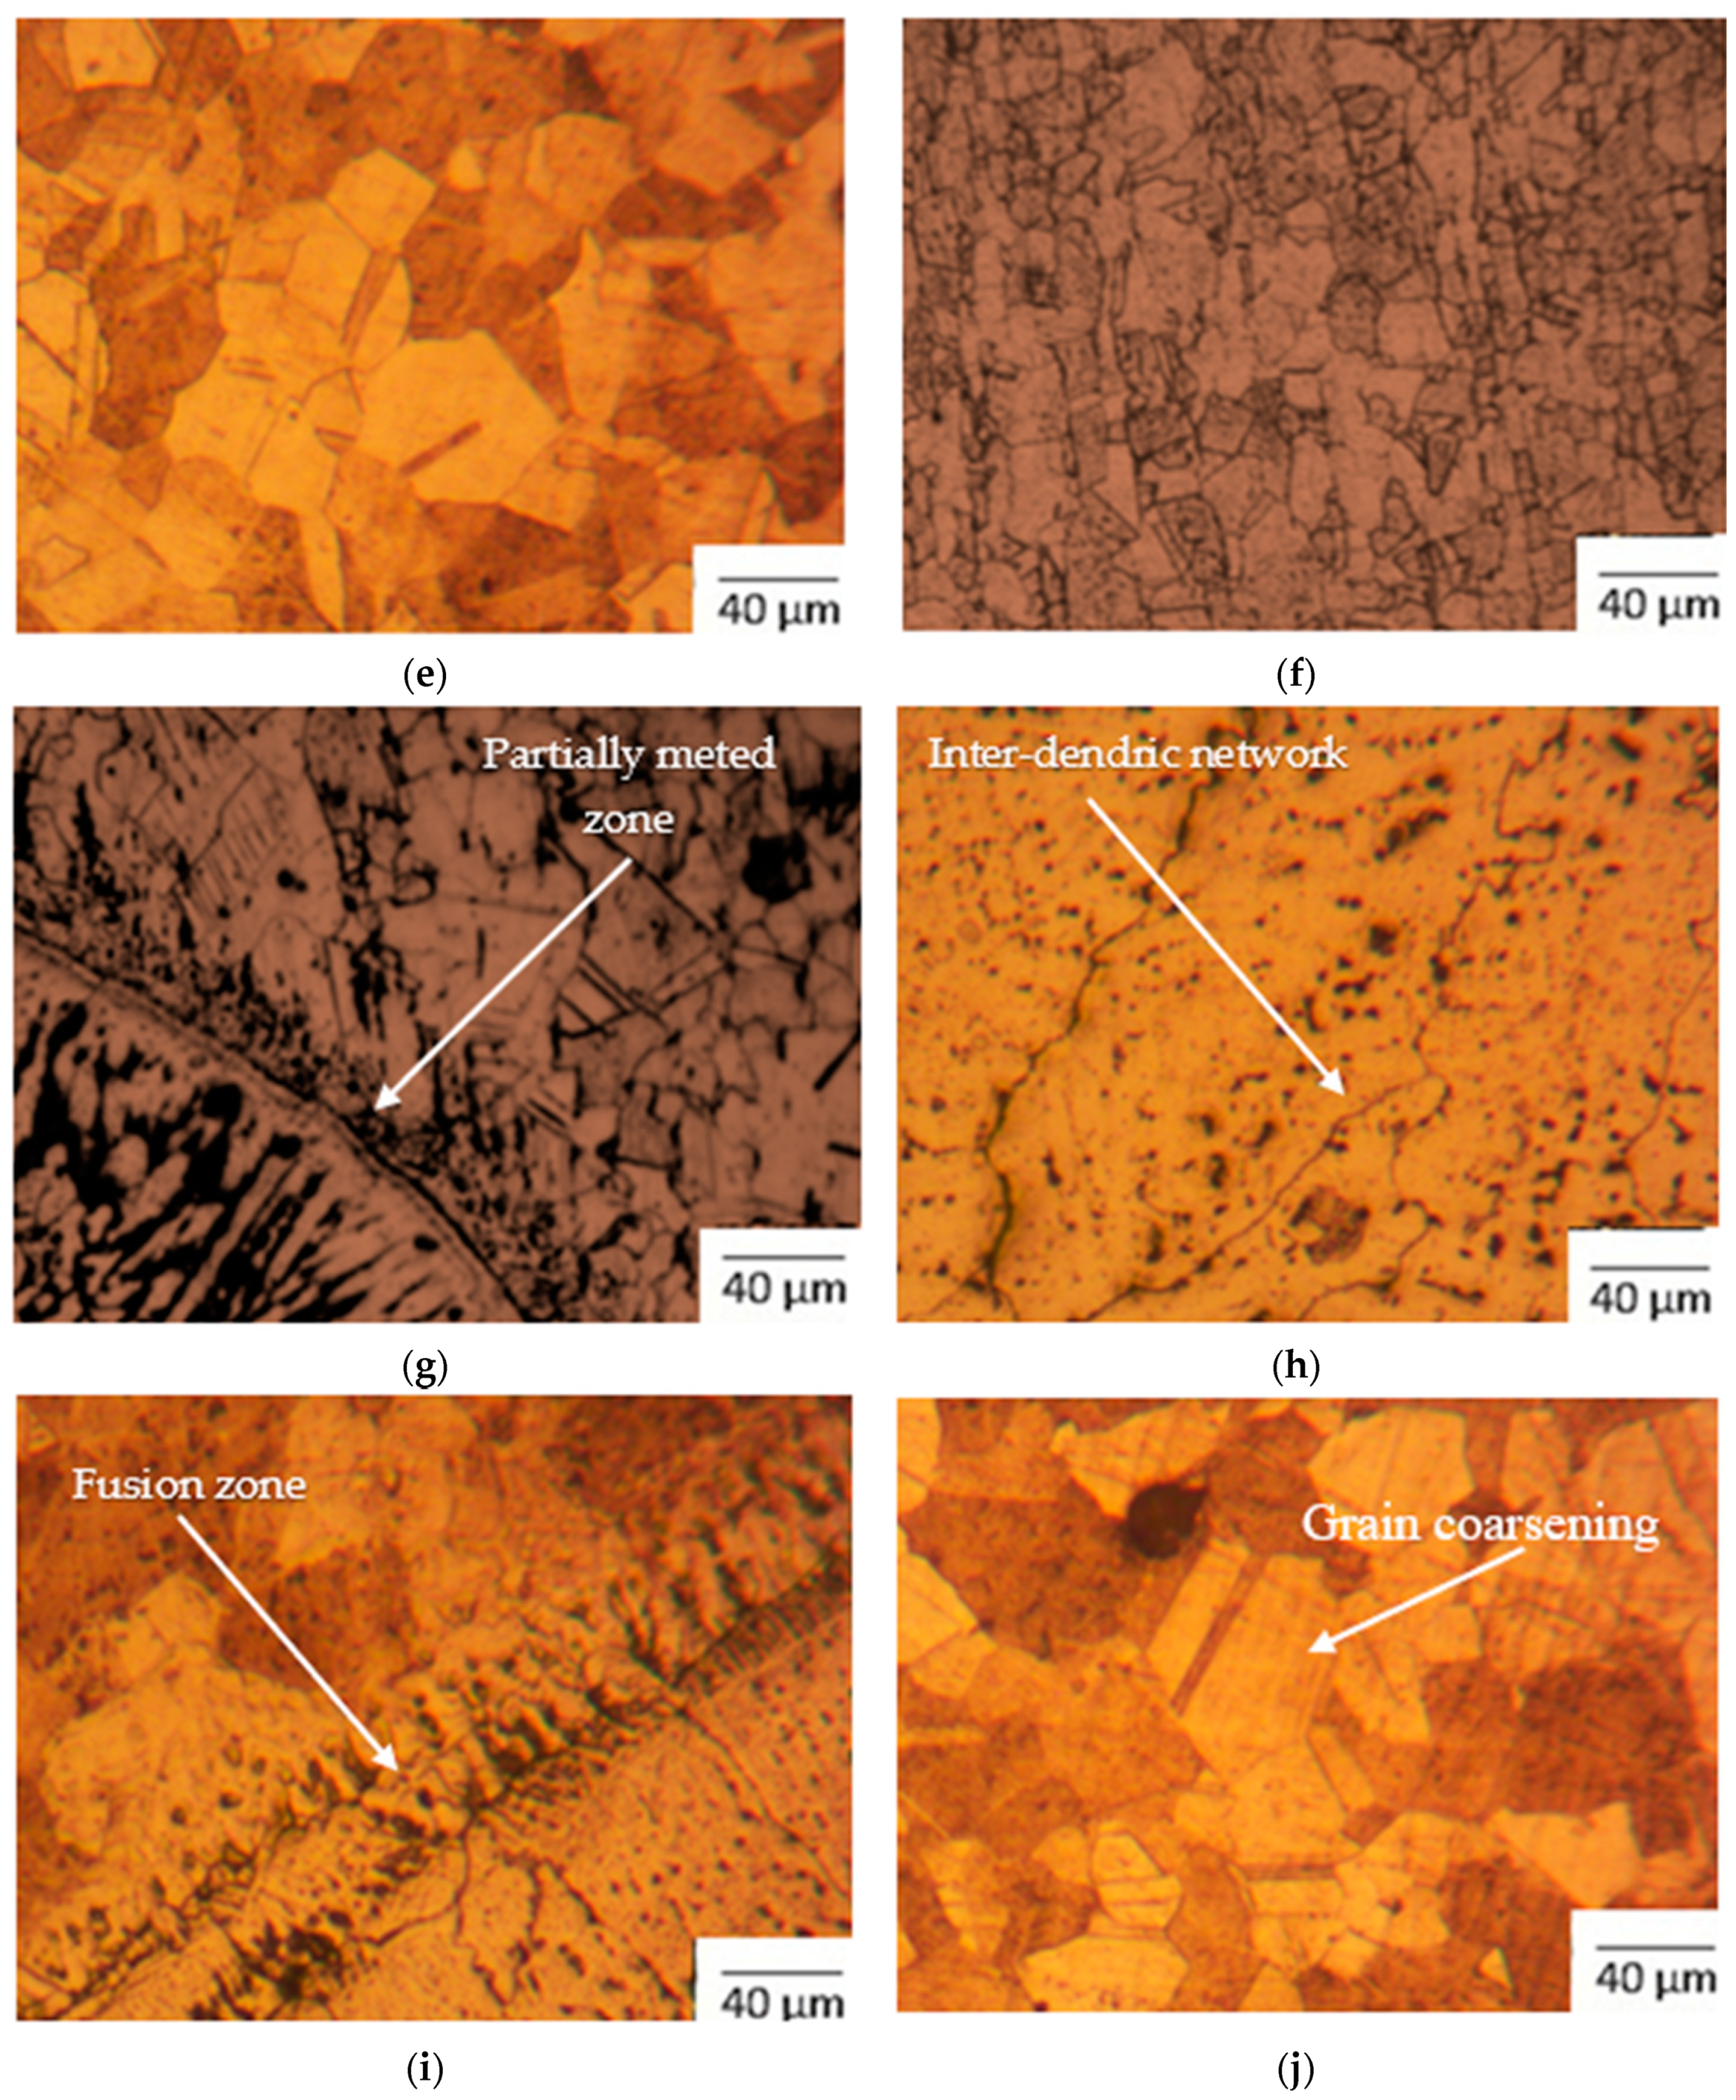
  • Figure 3f shows the optical image of SS 316L HAZ for the HT specimen, which has grain size number ranging from 13 to 14. The average carbide precipitate size was observed to be 1.73 µm, with 2.46% of precipitates with respect to area.
  • Partially melted zones on the weld fusion are shown in Figure 3g for the SS 316L weld fusion zone of the HT specimen, which has grain size number ranging from 12 to 14. The average carbide precipitate size was observed to be 3.045 µm, with 3.97% area fraction of carbide precipitates.
  • Weld region of the HT specimen has inter-dendritic network of the elements consisting of Ni, Cr, Fe, Cu, and Nb in Figure 3h. The grain size number is 7 and average carbide precipitate size was observed to be 4.66 µm, with 3.86% of carbide precipitates.
  • Weld fusion of Monel was seen in Figure 3i for the HT specimen, which has a size grain number of 13.
  • Grain coarsening is noticed in Monel 400 HAZ for the HT specimen, as seen in Figure 3j, with grain size number in the range of 11 to 14.
Dissimilar welding of SS 316L and Monel might have led to carbide precipitations at the grain boundaries during the welding process, due to higher heat input and post-weld heat treatment. The carbides, being rich in chromium, tend to reduce the chromium concentration in the austenite adjacent to the grain boundaries, thus creating the conditions for intergranular corrosion. Deep cryogenic treatment process leads to thermodynamic equilibrium conditions, which help to flatten out the defects in the material and attain the minimum entropy state. Furthermore, CT specimens have finer precipitates when compared to HT specimens, and uniform carbide precipitate distribution can lead to improved corrosion resistance [24]. The grain size of most of the regions for the CT specimen was found to be finer than that of the HT specimen. Finer grain size may lead to increased corrosion due to increased grain boundary.
Energy Dispersive Spectroscopy was deployed by the mapping technique for the elemental analysis of the different locations. The SEM and EDS results of weld, HAZ, and base metal of both SS 316L and Monel 400 of both the specimens, CT and HT, which were left for corrosion in 1M NaCl for 30 days are shown in Figure 4, Figure 5, Figure 6, Figure 7, Figure 8 and Figure 9. EDS mapping demonstrate the elemental migration on the SS 316L to weld or vice versa was very little and is evident in EDS mapping. Results are tabulated in Table 2. EDS mapping analysis on the specimen CT and HT welds has shown a reduction of Cr weight of 5.6% and 4.8% in CT and HT specimens, respectively, at HAZ of SS 316L and filler material with movement of Cr to Monel 400 HAZ and weld fusion area. Negligible movement of Fe from SS to weld zone, as well as Monel 400 HAZ, is observed on both specimens of CT and HT, which is indicated in the weight percentages recorded in Table 2. However, Mn was found to be lesser in amount in the secondary phases at all zones. Figure 8c was identified as the weld dilution area where the EDS spectrum shows the dilution of filler material (ENiCrFe-5) into Monel, which has resulted in the presence of Cr in Monel side. An EDS spot spectrum of Monel HAZ, with no dilution of filler material, is tabulated in Table 2.
The morphology of corrosion products of HT specimens (Figure 5b, Figure 7b, and Figure 9b) shows they are crystalline in nature and their formation is related to the formation of chloride deposition. SS 316L HAZ region is more pronounced when compared to other regions. The effect is less for CT specimens, as observed in Figure 4b, Figure 6b, and Figure 8b, for different zones. SS 316L HAZ has shown extensive crystal formation when compared to other regions. When austenitic steel undergoes heating or heat treatment in temperature ranges of 450 to 900 °C, the material is prone to inter-granular corrosion, wherein chromium carbides precipitate near the grain boundaries and sensitization phenomenon in this temperature range [25,26]. This was observed in the present case, as well. HAZ of Monel 400 clearly shows the presence of considerable amounts of Ni, Cu, and Nb. The presence of alloying elements, such as Nb, promotes the formation of carbides, which are responsible for the pinning of grain boundaries [27]. Further, it is noted that the CT specimen had a smaller amount of Na and Cl deposition on the surface in comparison to the HT specimen.

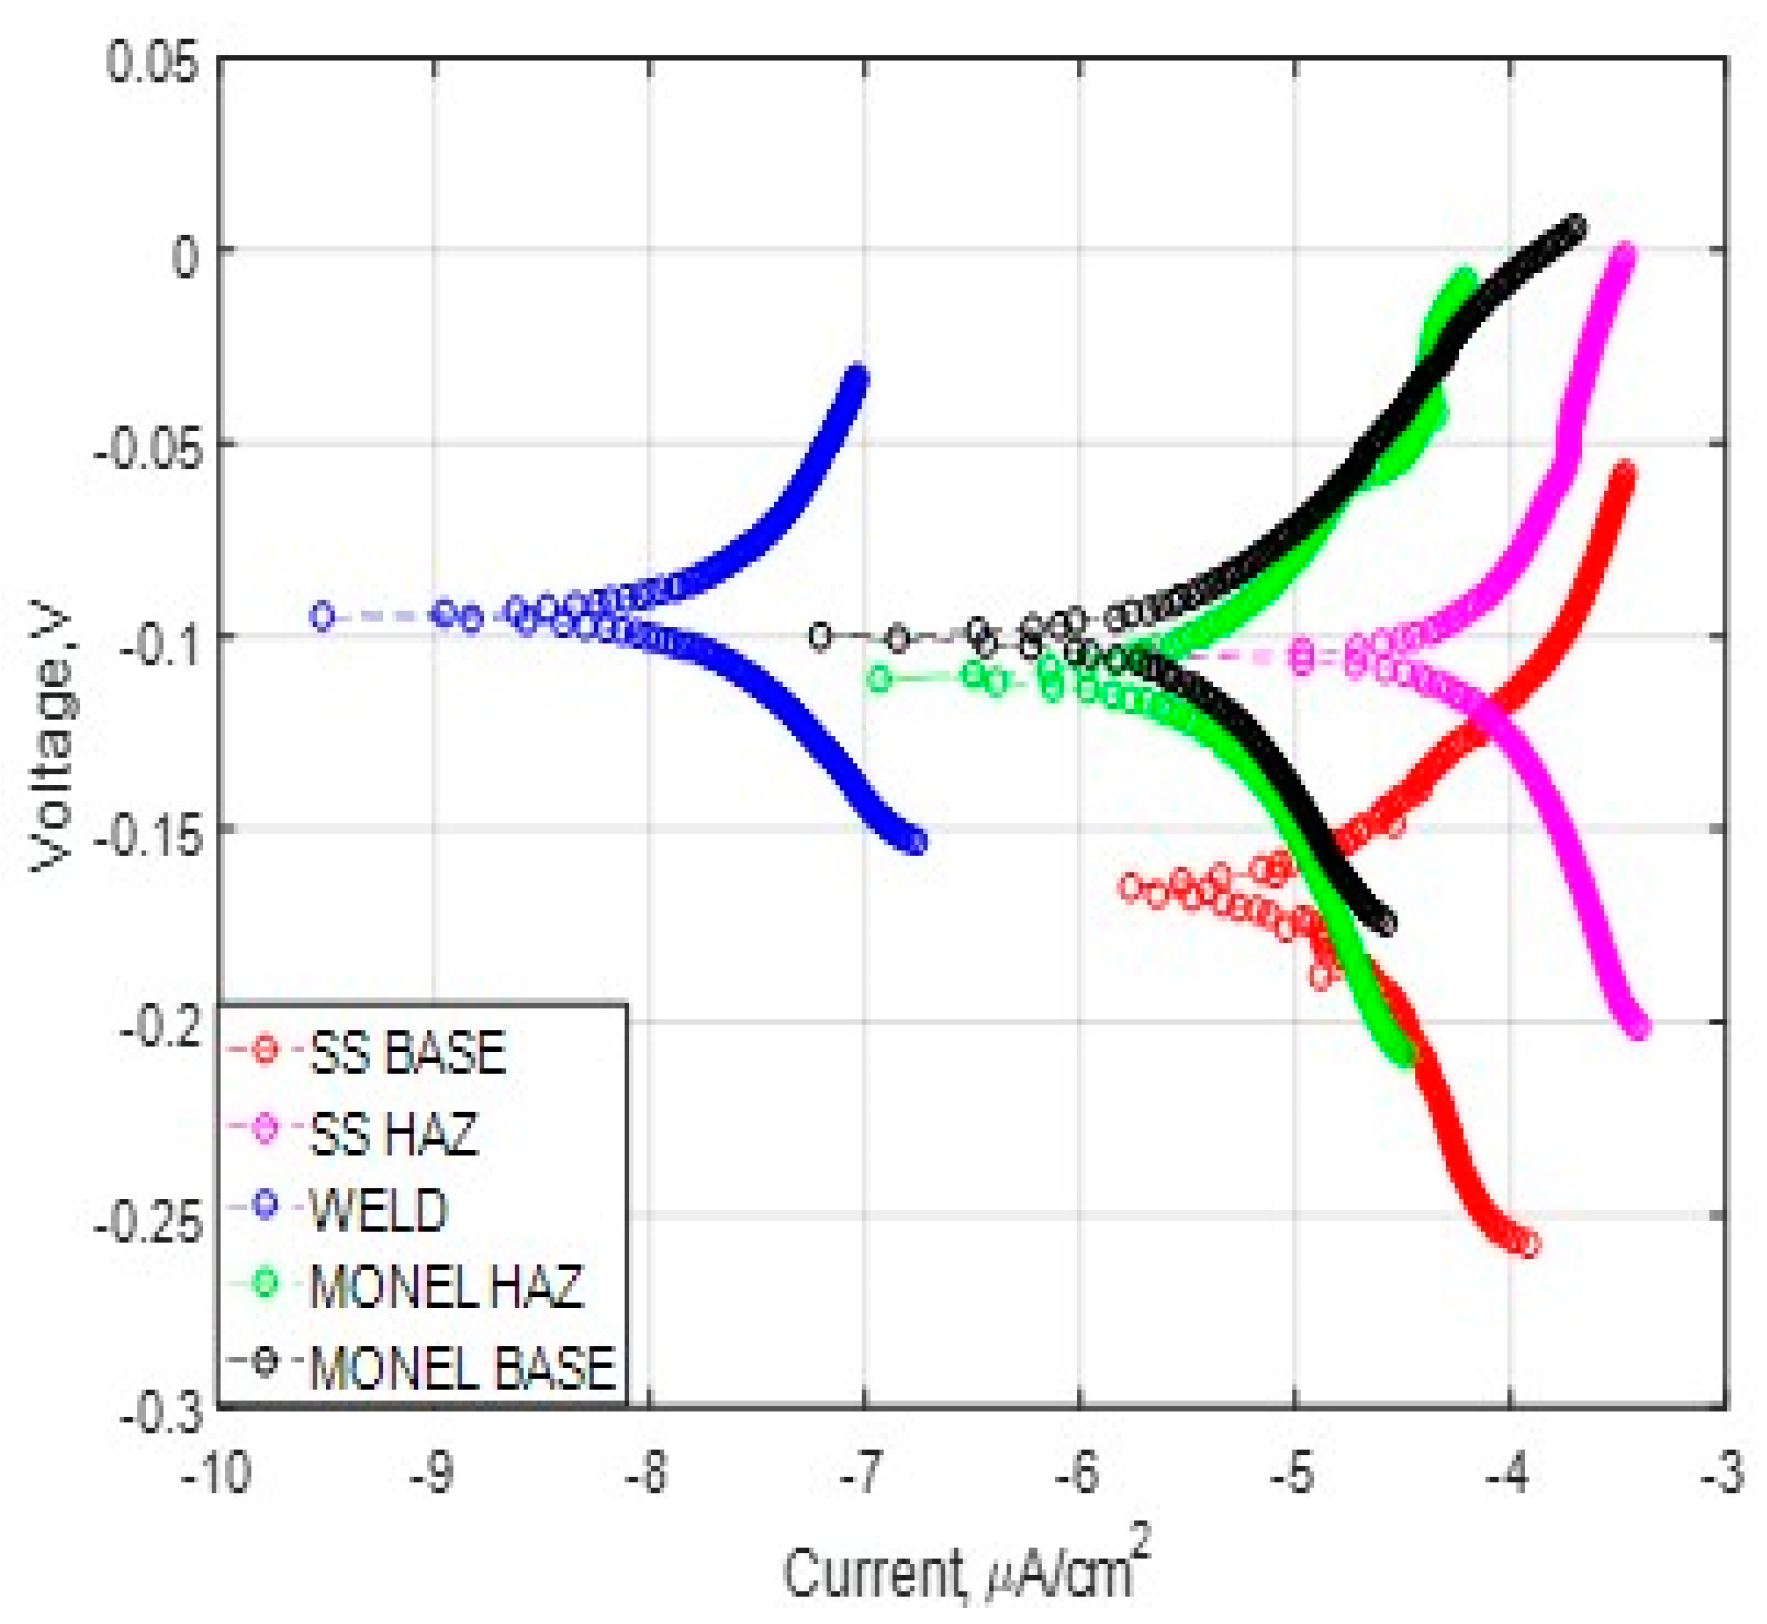
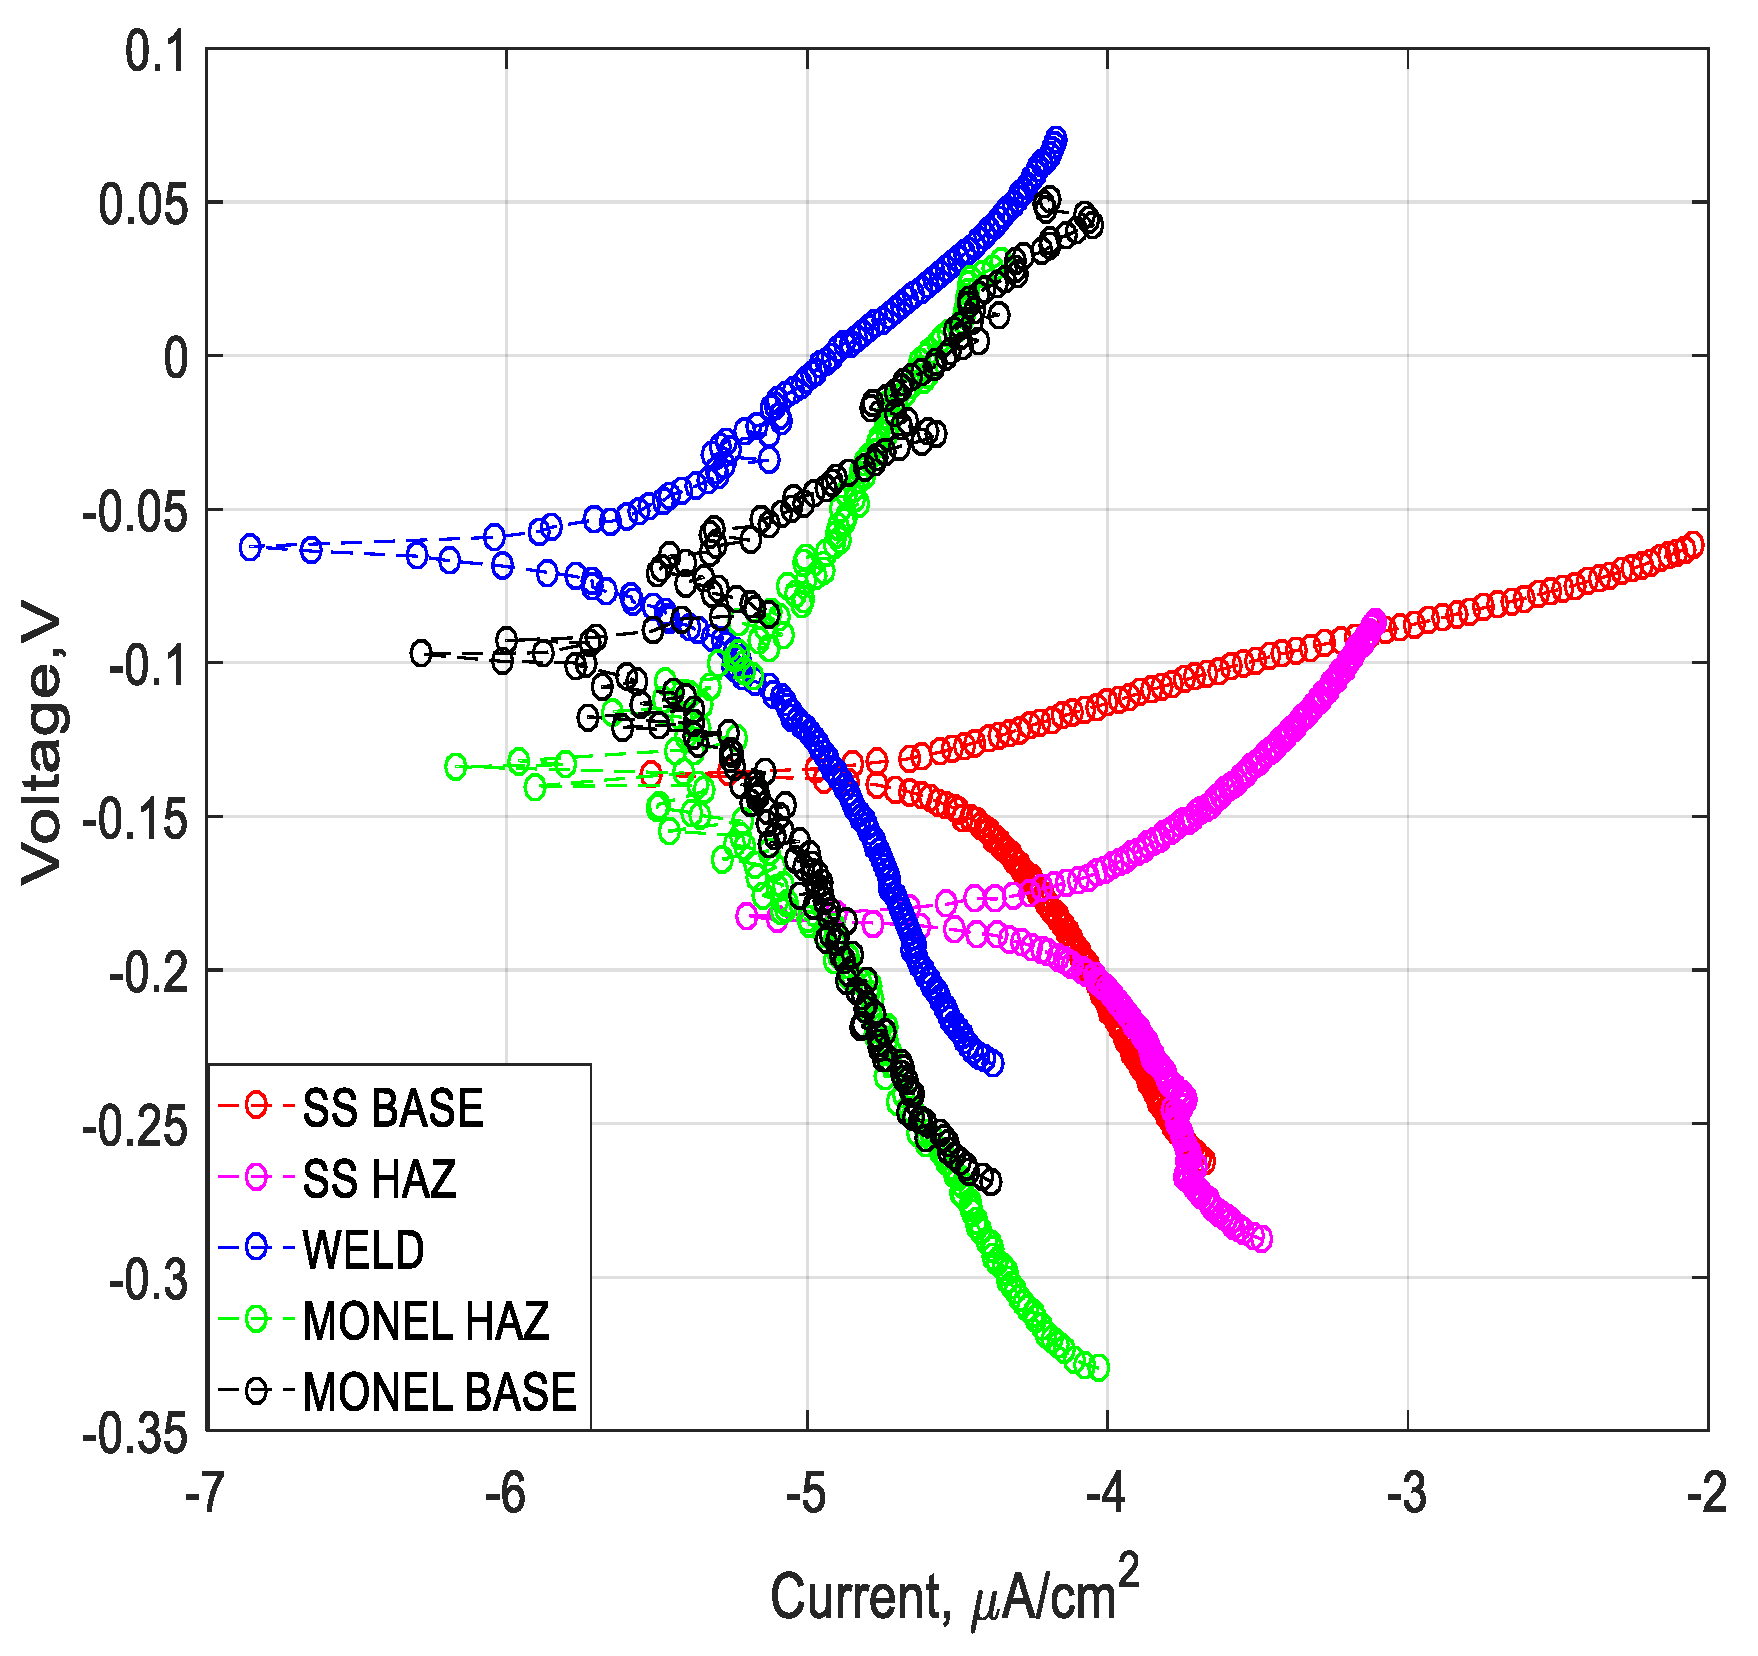
3.2. Polarization Analysis and Electrochemical Impedance Spectroscopy Analysis

The graphical representation based on the electrochemical mechanism at the five different regions of weld, comprising base metal and heat affected zone (HAZ) on SS 316L, and Monel 400 and weld zone (WZ) for CT and HT specimens, are shown in Figure 10, Figure 11, Figure 12, Figure 13, Figure 14, Figure 15, Figure 16 and Figure 17. Extrapolation of polarization curves allows determination of corrosion potential (Ecorr), as well as corrosion current density (Jcorr), and eventually uniform corrosion rate is calculated using Faraday’s law [28]. The results are presented in Table 3. Tafel extrapolation also yields anodic and cathodic Tafel slopes. The changes in electrochemical behavior are because of changes in microstructure and mechanical properties during welding and subsequent treatments, which were also observed by Aqarni et al. [29].
The diameter of the semicircle extrapolated on the Nyquist diagram represents the charge transfer resistance (Rt) equivalent to the polarization resistance (Rp). The larger the diameter of the semicircle id, the higher the resistance Rp, resulting in a lower corrosion rate [30]. The Nyquist plot represents the complex plane, and an Equivalent circuit for respective zones of CT and HT specimens is electrically fitted for the interpretation of the AC impedance spectra [31]. The most favorable model was selected among various options and used in the corrosion current calculation. For the present data, a capacitor in parallel with a resistor leads to an equivalent circuit, as shown in Table 4. Capacitance and resistance are also listed for the equivalent circuit for the different weld regions. Lower capacitance (P1) values and a higher resistance (R2), parallel to capacitance (P1), directs to higher corrosion resistance for the material. The Bode plot is another practice for depicting impedance analysis results. Logarithm of the impedance modulus (log|Z|) and the phase angle (Φ) are plotted as functions of the logarithm of angular frequency (log ω) [32]. Higher impedance at lower frequency denotes higher corrosion resistance. The Bode diagrams for CT and HT specimens at different weld regions are shown in Figure 14 and Figure 15, respectively. The phase angle is more sensitive to the conditions, and the electrical equivalent model considered for the study is validated by the variations observed in the phase angle. Figure 16 and Figure 17 show the variation of phase angle for the CT and HT specimens for different regions, and Figure 18 shows the equivalent circuit.
This section may be divided by subheadings. It should provide a concise and precise description of the experimental results, their interpretation, and the experimental conclusions that can be drawn.

3.2.1. Weld Zone

Corrosion potentials (Ecorr) of weld specimens in chloride solution are shifted toward the negative direction after immersion. The slight shift in the potential toward the lower negative values for weld zone specimens indicates better corrosion resistance [33], which has been observed for both CT and HT specimens. Open circuit potential variation during testing is an indicator for corrosion resistance. Corrosion current density of the welded zone was 0.316 µA/cm2 and 13.55 µA/cm2 for CT and HT specimens, correspondingly. Self-corrosion potential (Ecorr) was noted to be −0.0901 and 0.0623 V, whereas polarization resistance of weld zone was 313.1 M ohm and 2.45 M ohm, respectively, for CT and HT specimens (Figure 10 and Figure 11, as well as Table 4). Nyquist plots (Figure 12 and Figure 13) for the CT specimen reflects Z’ real ranging from 0 to 1800 Ohm·cm2 to Z” imaginary peak value of 550 Ohm·cm2. In comparison, specimen HT has Z’ real ranging from 0 to 1025 Ohm·cm2 and Z’’ imaginary peak value is at 320 Ohm·cm2, inferring a higher corrosion rate for the HT specimen. The bode plots shown in Figure 14 and Figure 15 show higher Z values up to 1854 Ohm·cm2 in specimen CT and 1020 Ohm·cm2 for specimen HT. Measured for weld in the lower frequency range and in the higher frequency range, it varies from 10 to 25 Ohm·cm2 for both specimens. These observations are mainly from the material composition of filler material ERNiCrFe-5, which consists of higher Cr and Ni, as observed in EDS referred in Figure 6c and Figure 7c for specimens CT and HT, respectively. Migrated grain boundaries identified in Figure 3b for the CT specimen and Inter-dendritic grains recognized for the HT specimen identified in Figure 3e may also contribute to the lower corrosion rate in weld zone.

3.2.2. SS 316L HAZ

Along HAZ from fusion line, the temperature and cooling rates vary significantly. Recrystallization and vaporization of alloying elements from the molten weld pool are the major metallurgical factors which alter the material properties in HAZ region. SS 316L HAZ showed the highest shift of the potential toward right in comparison to weld zone. Current density (Jcorr) was found to be 564.9 µA/cm2 and 56.23µA/cm2 for specimens CT and HT, respectively, which resulted in a corrosion rate of 0.588 × 10⁻⁶ mm/year and 5.86 × 10⁻⁶ mm/year, respectively. These results are reflected in the polarization curves shown in Figure 10 and Figure 11. Nyquist plots of SS 316L HAZ have the smallest diameter of the semicircle for specimen CT, which results in lower corrosion resistance and Z real ranges from 0 to 400 Ohm·cm2 (Figure 12 and Figure 13), whereas specimen HT shows an increasing trend of its curve being at a higher range, due to the presence of a passive layer on the surface. SS 316L HAZ has the lowest Z value, ranging from 2 to 408 Ohm·cm2 for the frequency range studied in the Bode plot (Figure 14 and Figure 15). Higher values denote the molecular adsorption and surface-film formation, which increase corrosion inhibition. SS 316L HAZ has remarkably lower values of impedance in higher, as well as lower, frequency ranges. The reduction in the corrosion rate for the CT specimen noted from very low Icorr and Jcorr, which is a result of cryogenic treatment for specimen CT. SS 316L HAZ of specimen HT has a finer grain size, which makes it susceptible to a chloride attack, due to the increased grain boundary [34].

3.2.3. Monel 400 HAZ

From Table 3 and Figure 10 and Figure 11, it is found the corrosion current density Jcorr is recorded as 2.05 µA/cm2 and 39.08 µA/cm2 for specimens CT and HT, respectively, where the Jcorr of the HT specimen has an increase of 1806%. The same is reflected with a 93% decrease in polarization resistance of specimen CT in comparison with specimen HT. Ecorr and Jcorr values obtained in Table 2 indicate their dependence on the microstructural modification due to the welding process, which is supported by Kangazian et al. [35]. Monel 400 HAZ of specimen CT shows Z real ranging from 0 to 680 Ohm.cm2, whereas the HT specimen has Z real ranges from 0 to 550 Ohm·cm2. Both specimens have a Z imaginary peak value of 200 Ohm·cm2 (Figure 12 and Figure 13). The Bode plots also depict similar trends for this region.

3.2.4. SS 316L Base

From Table 3, it is found that the corrosion current density Jcorr of SS 316L base material of specimen CT is less in comparison to the HT specimen, thereby having an increase of corrosion rate for the HT specimen at this zone. The same is reflected in polarization curves shown in Figure 10 and Figure 11, where the open circuit potential of the CT specimen has higher negative values, and the polarization resistance of the CT specimen is high. The radii of both the CT specimen and the HT specimen were found to be in the range of 550–600 Ohm·cm2, as per the Nyquist plot. Similarly, not much difference is seen between the specimens in the Bode plots, as well as in the phase angle plots. Phase angle plots for the CT and HT specimens are shown in Figure 16 and Figure 17. SS base has higher peak angles for the CT specimen at lower frequencies when compared to the HT specimen.

3.2.5. Monel 400 Base

The corrosion current density Jcorr of Monel 400 base material of the CT specimen is less in comparison to the HT specimen, thereby having a lower corrosion rate for the CT specimen at this zone, as in tabulated from Table 2. The Monel base zone of the CT specimen shows Z real ranging from 0 to 820 Ohm·cm2, whereas the HT specimen shows Z real ranges from 0 to 680 Ohm·cm2, with a Z imaginary peak value of 300 Ohm.cm2 and 210 Ohm·cm2 for the CT and HT specimens, respectively, as shown in the Nyquist plots (Figure 12 and Figure 13). The phase angle plots (Figure 16 and Figure 17) show that Monel base has higher peak angles for the CT specimen at lower frequencies when compared to the HT specimen, whereas the peak phase angle for both specimens remains the same.
To summarize, polarization and EIS results for CT and HT specimens have obvious increases in the cathodic and anodic over potentials, with anodic over potentials being much more affected than the cathodic ones. The lowest value for corrosion rate was found for the weld zone of specimen CT [36]. The weld zone of the CT specimen shows a lower corrosion rate in comparison with all other zones, due to higher Cr and Ni contents of the filler wire. From the extrapolated diameter of the semicircles from the Nyquist plot, it is noted that all the zones of specimen CT display higher polarization resistance, resulting in the lower corrosion rate with respect to the HT specimen. Phase angle plots for the CT and HT specimens show that SS 316L HAZ has higher peak angles at lower frequencies when compared to other sections for the CT specimen. Bode plots in Figure 14 and Figure 15 show that the corrosion resistance of the weld zone is highest and the SS 316L HAZ is lowest, while the corrosion resistance of Monel 400 HAZ, Monel 400 base, SS 316L base in the Bode plots are close and over lapping. Figure 16 and Figure 17 for phase angle also depict the same trend; however, in Figure 16, at lower frequency, the phase angle of SS316 HAZ is followed by Monel 400 base. CT specimens have better corrosion resistance than HT specimens. Mohd Touseef studied the effect of cryogenic treatment of 316L stainless steel. The microstructure shows precipitation of carbides along the grain boundaries, which may lead to an improvement in mechanical properties [37]. The cryogenic treatment normally results in homogeneous distribution of microstructure with fine precipitation, which may improve the corrosion resistance. Barron and Thompson stated that cryogenic treatment improved the corrosion resistance for austenitic steel, and the carbon content played an important role in the improvement. The suggested mechanism for the effect of cryogenic treatment on the corrosion resistance is refinement of grain boundaries, which is the region in which the corrosion was predominant. With refinement of grain boundaries, there would be a smaller microscopic area available for the diffusion of the corrosion medium into the metal, which would result in a reduction in the corrosion rate [38]. The trends of polarizations rate agree with the electrochemical impedance spectroscopy analysis.

4. Discussion and Conclusions

Dissimilar metal welding of 316L stainless steel and Monel alloy using GTAW was carried out, followed by conventional annealing (HT) and cryogenic treatments (CT). Optical microscopy, EDS and SEM were carried out on specimens. The polarization method and Electrochemical Impedance Spectroscopy method were used to analyze the five different parts, such as zones of dissimilar metal welds of 316L and Monel 400 alloy. A polarization curve, Nyquist plots, bode plots, and electrical equivalent circuits were constructed to compare the results obtained from both of the treatments.
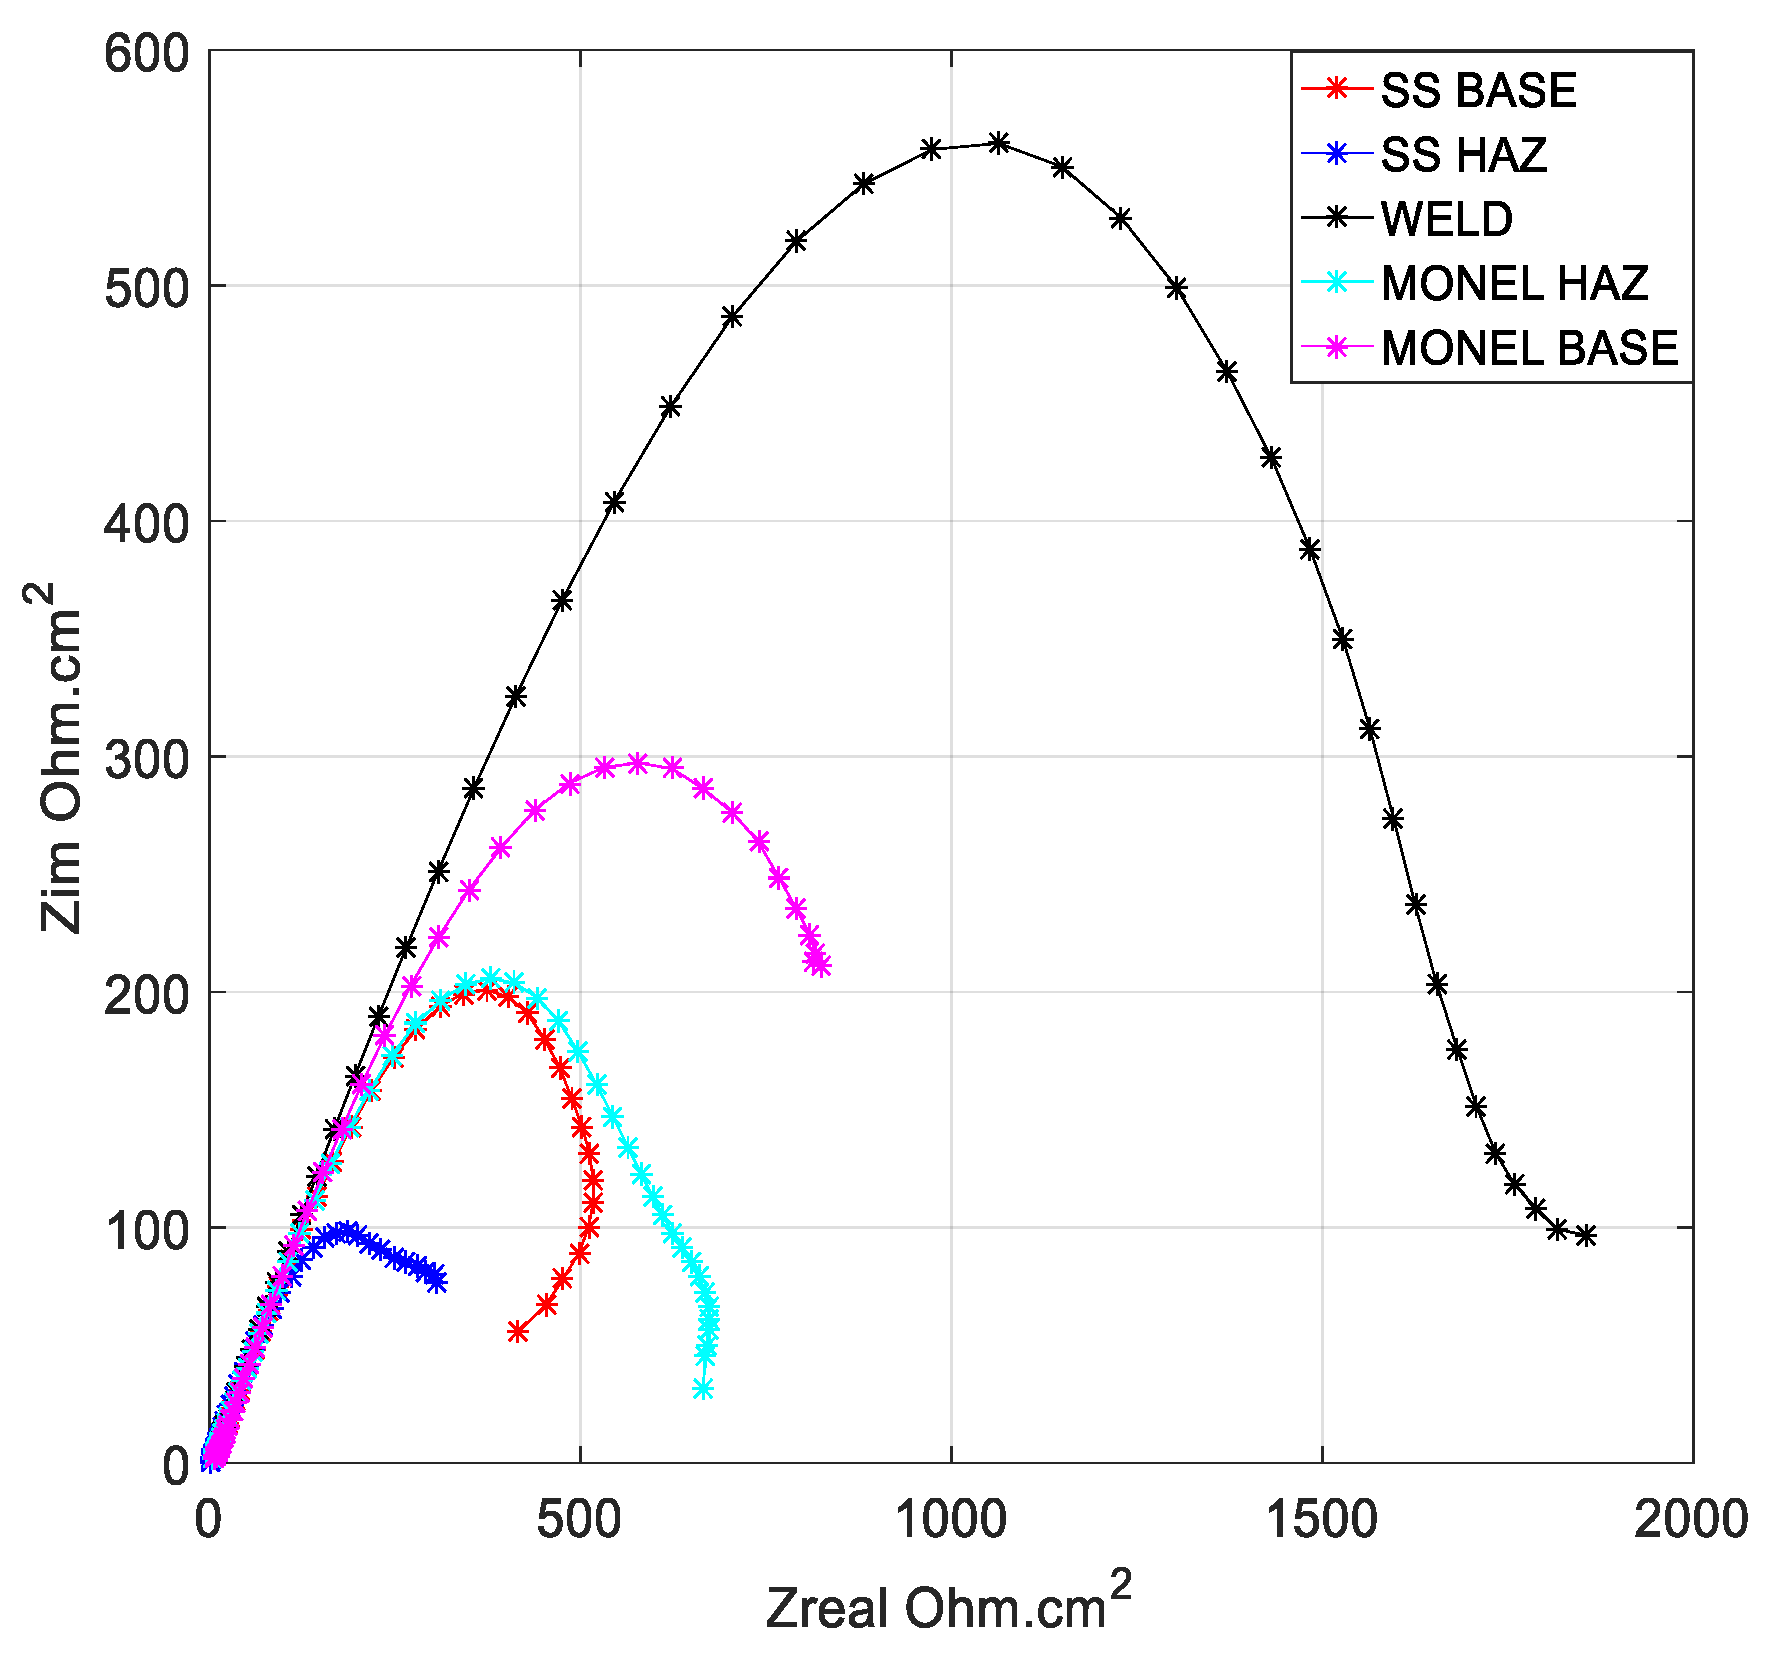
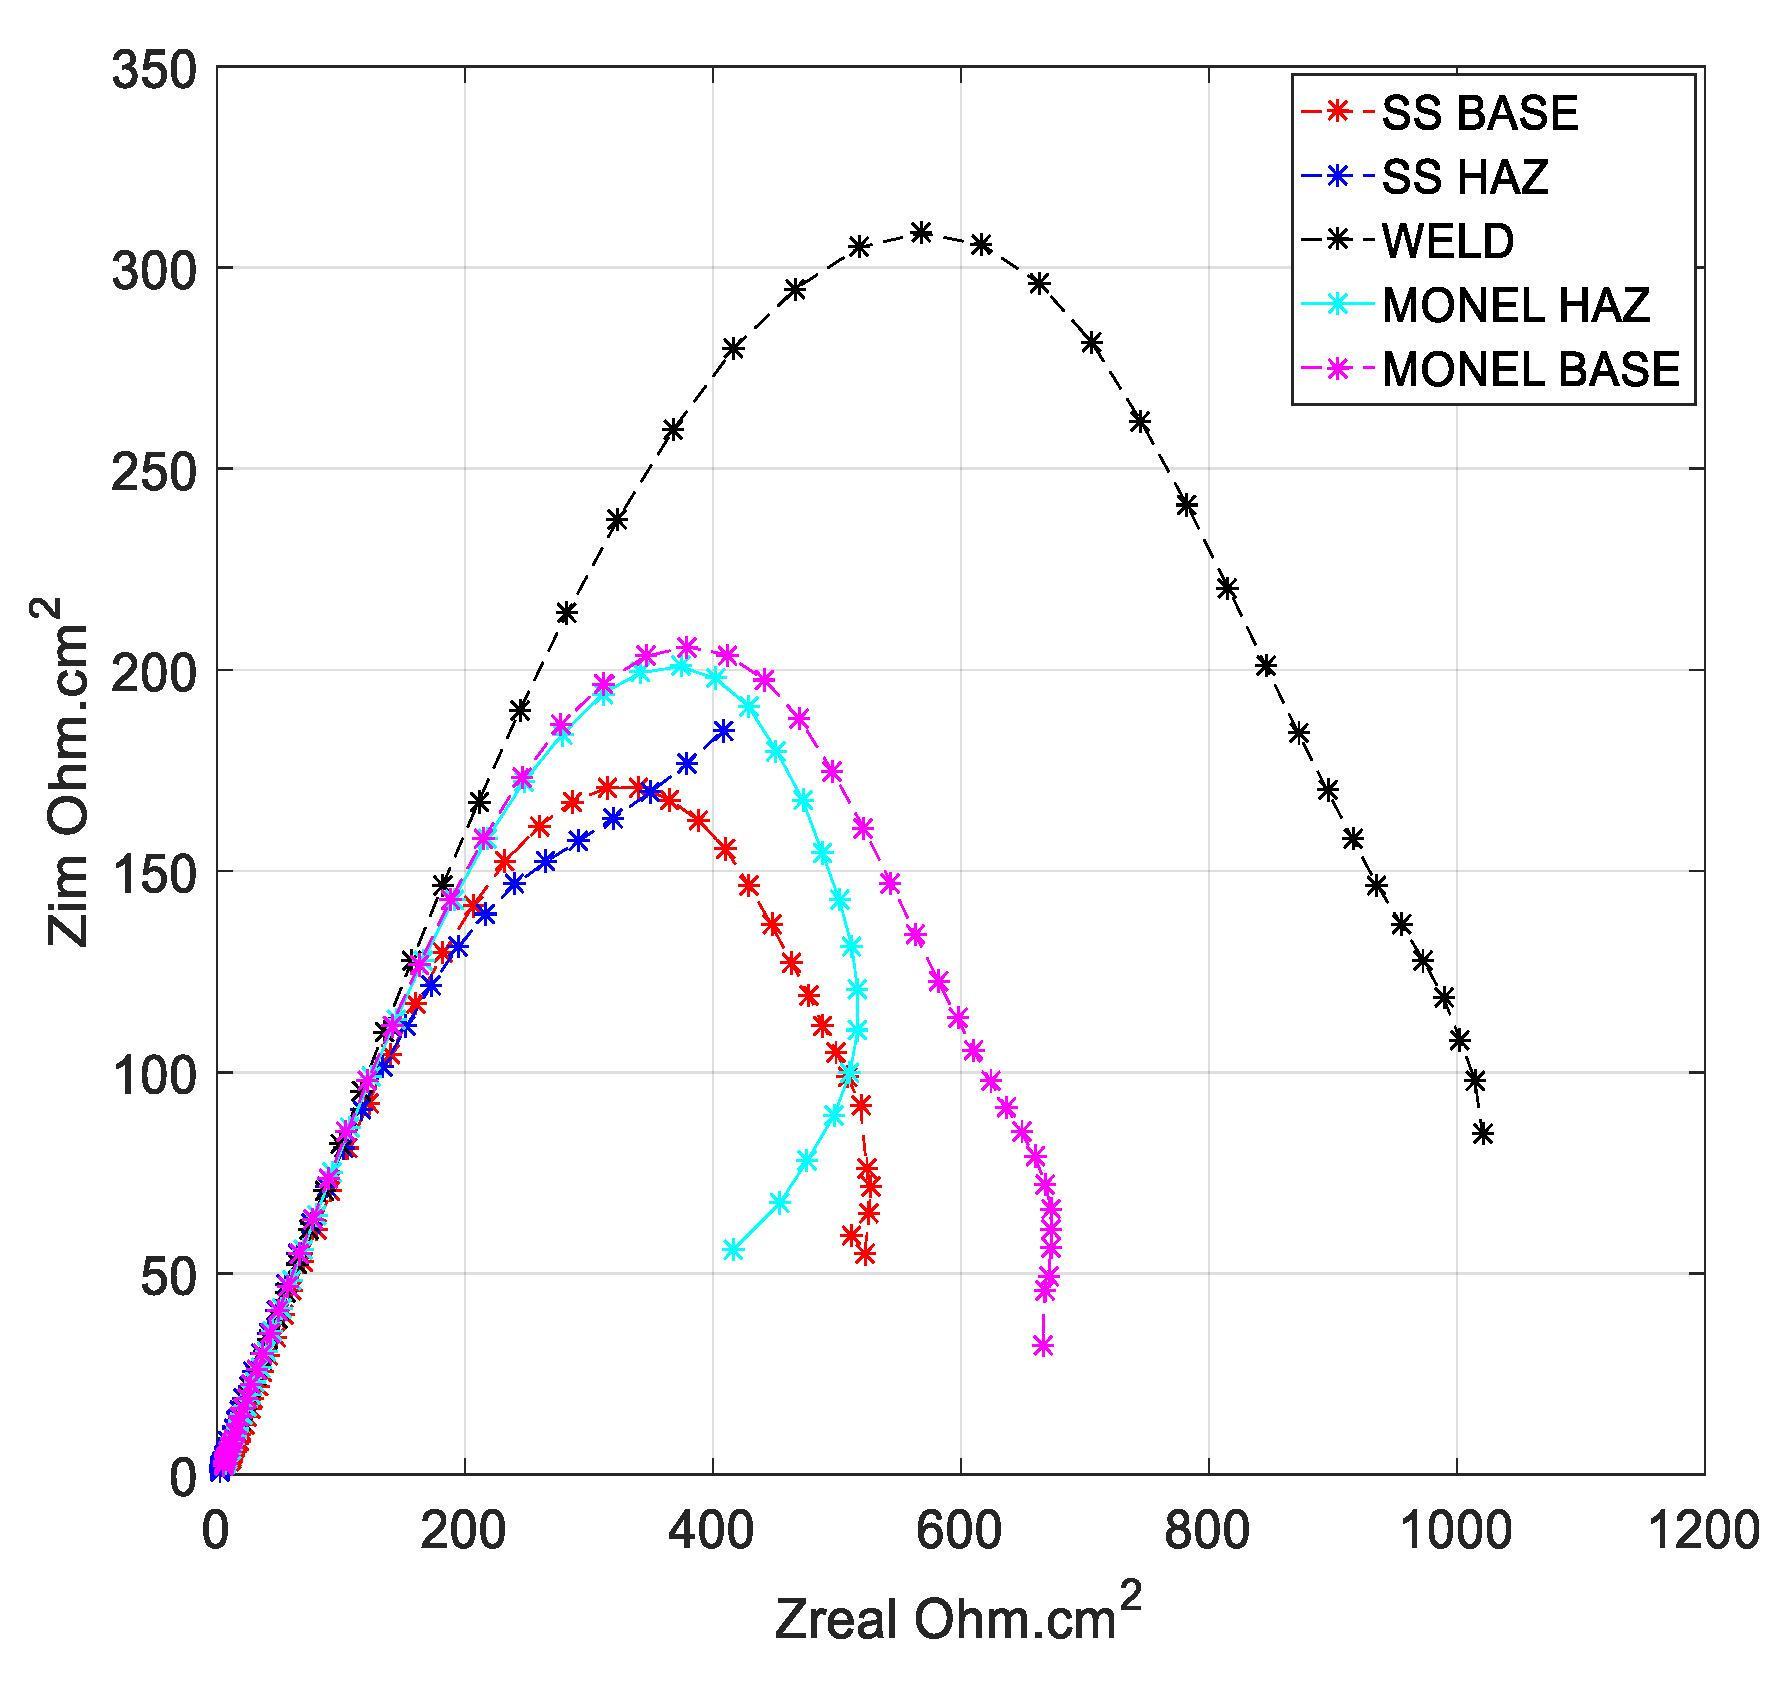
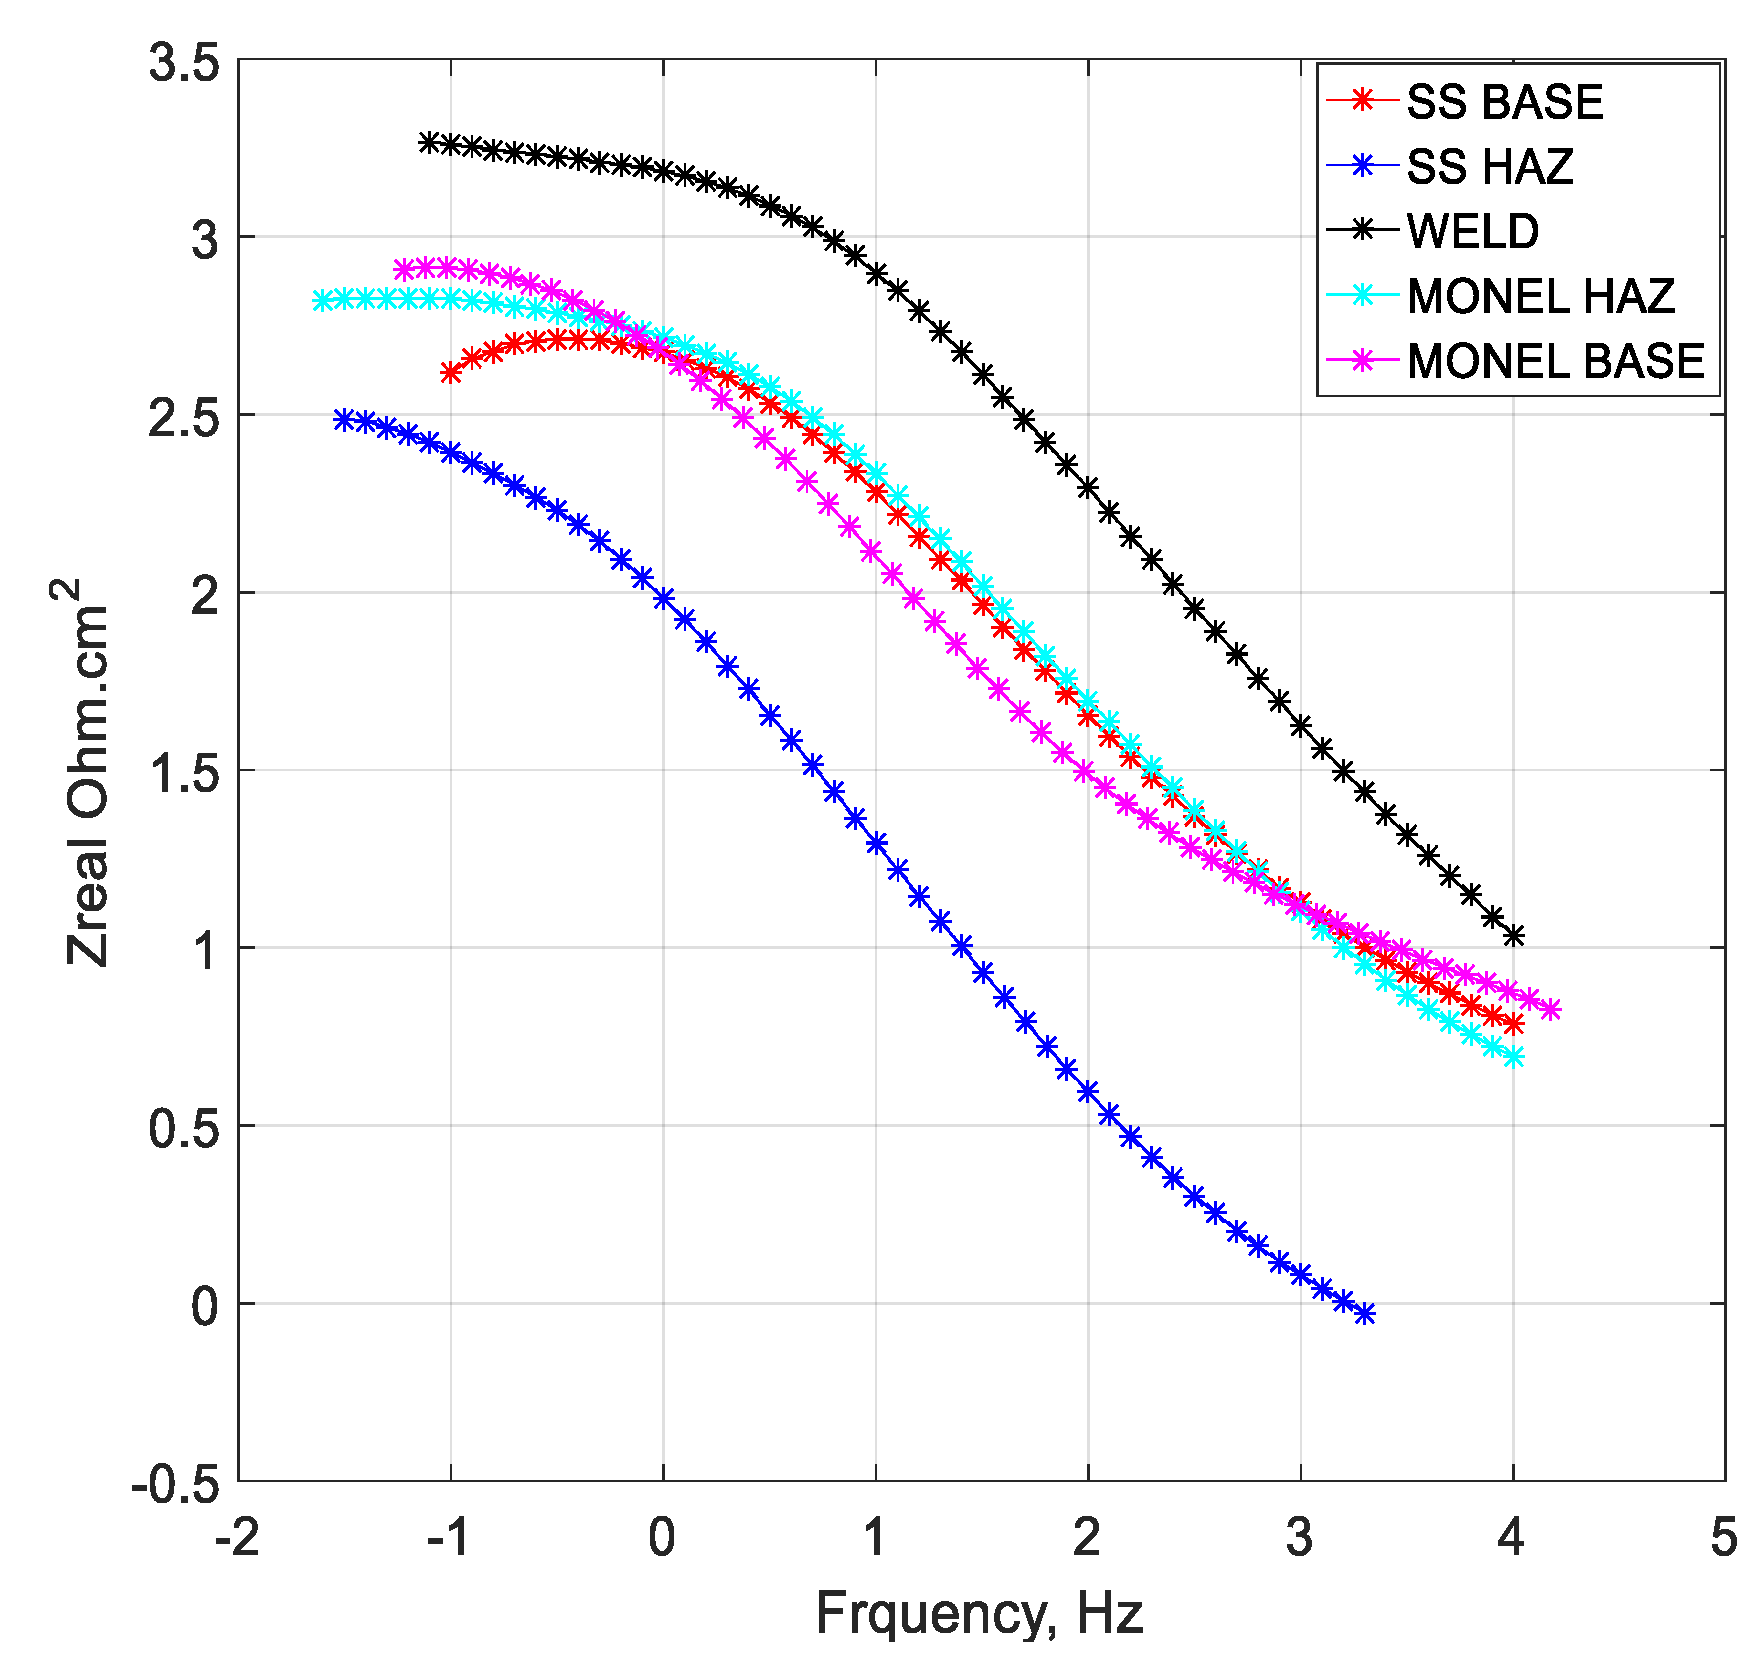
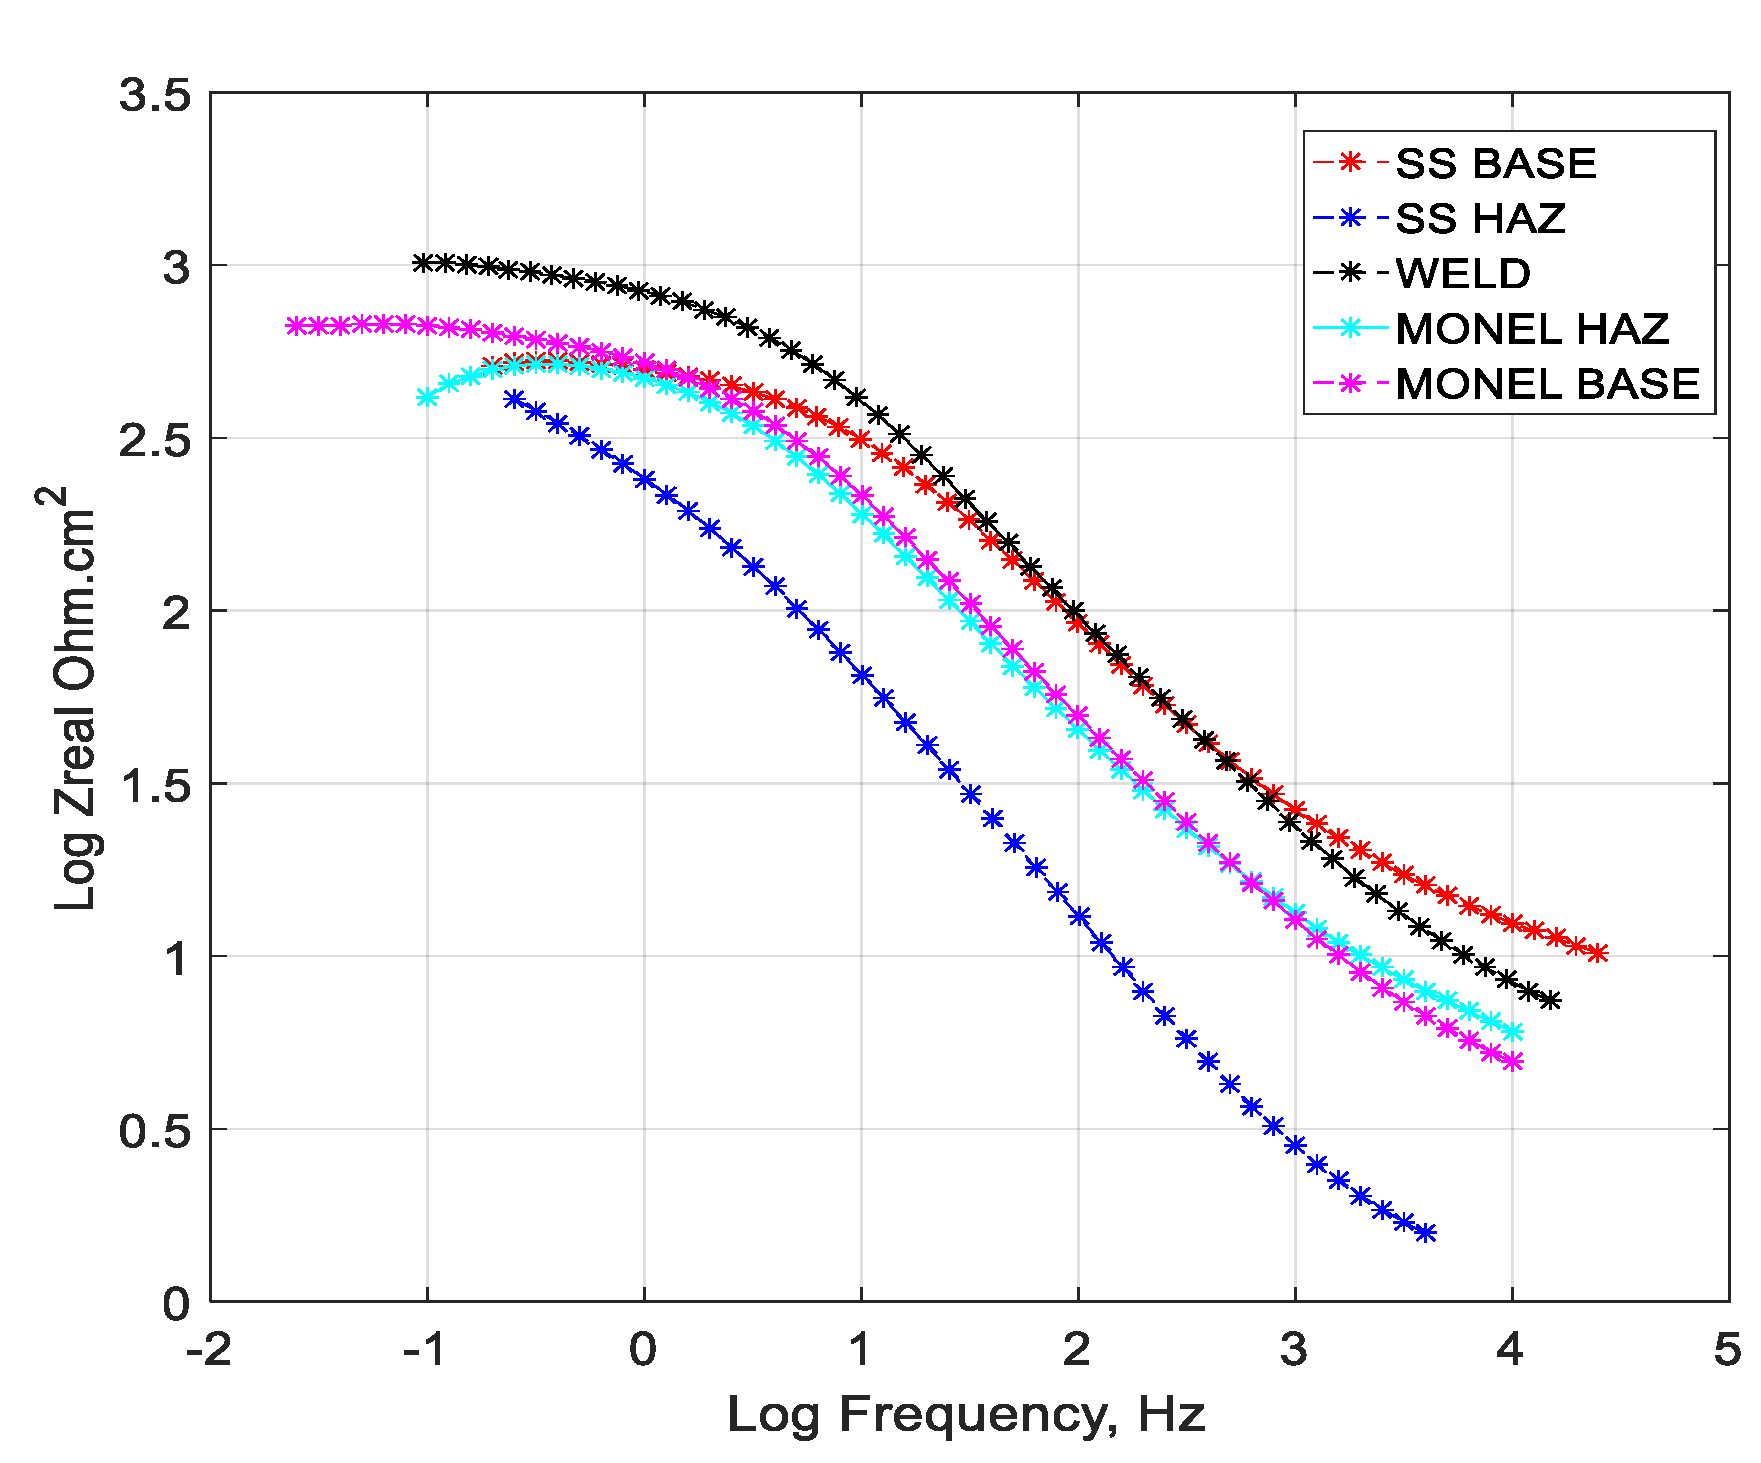
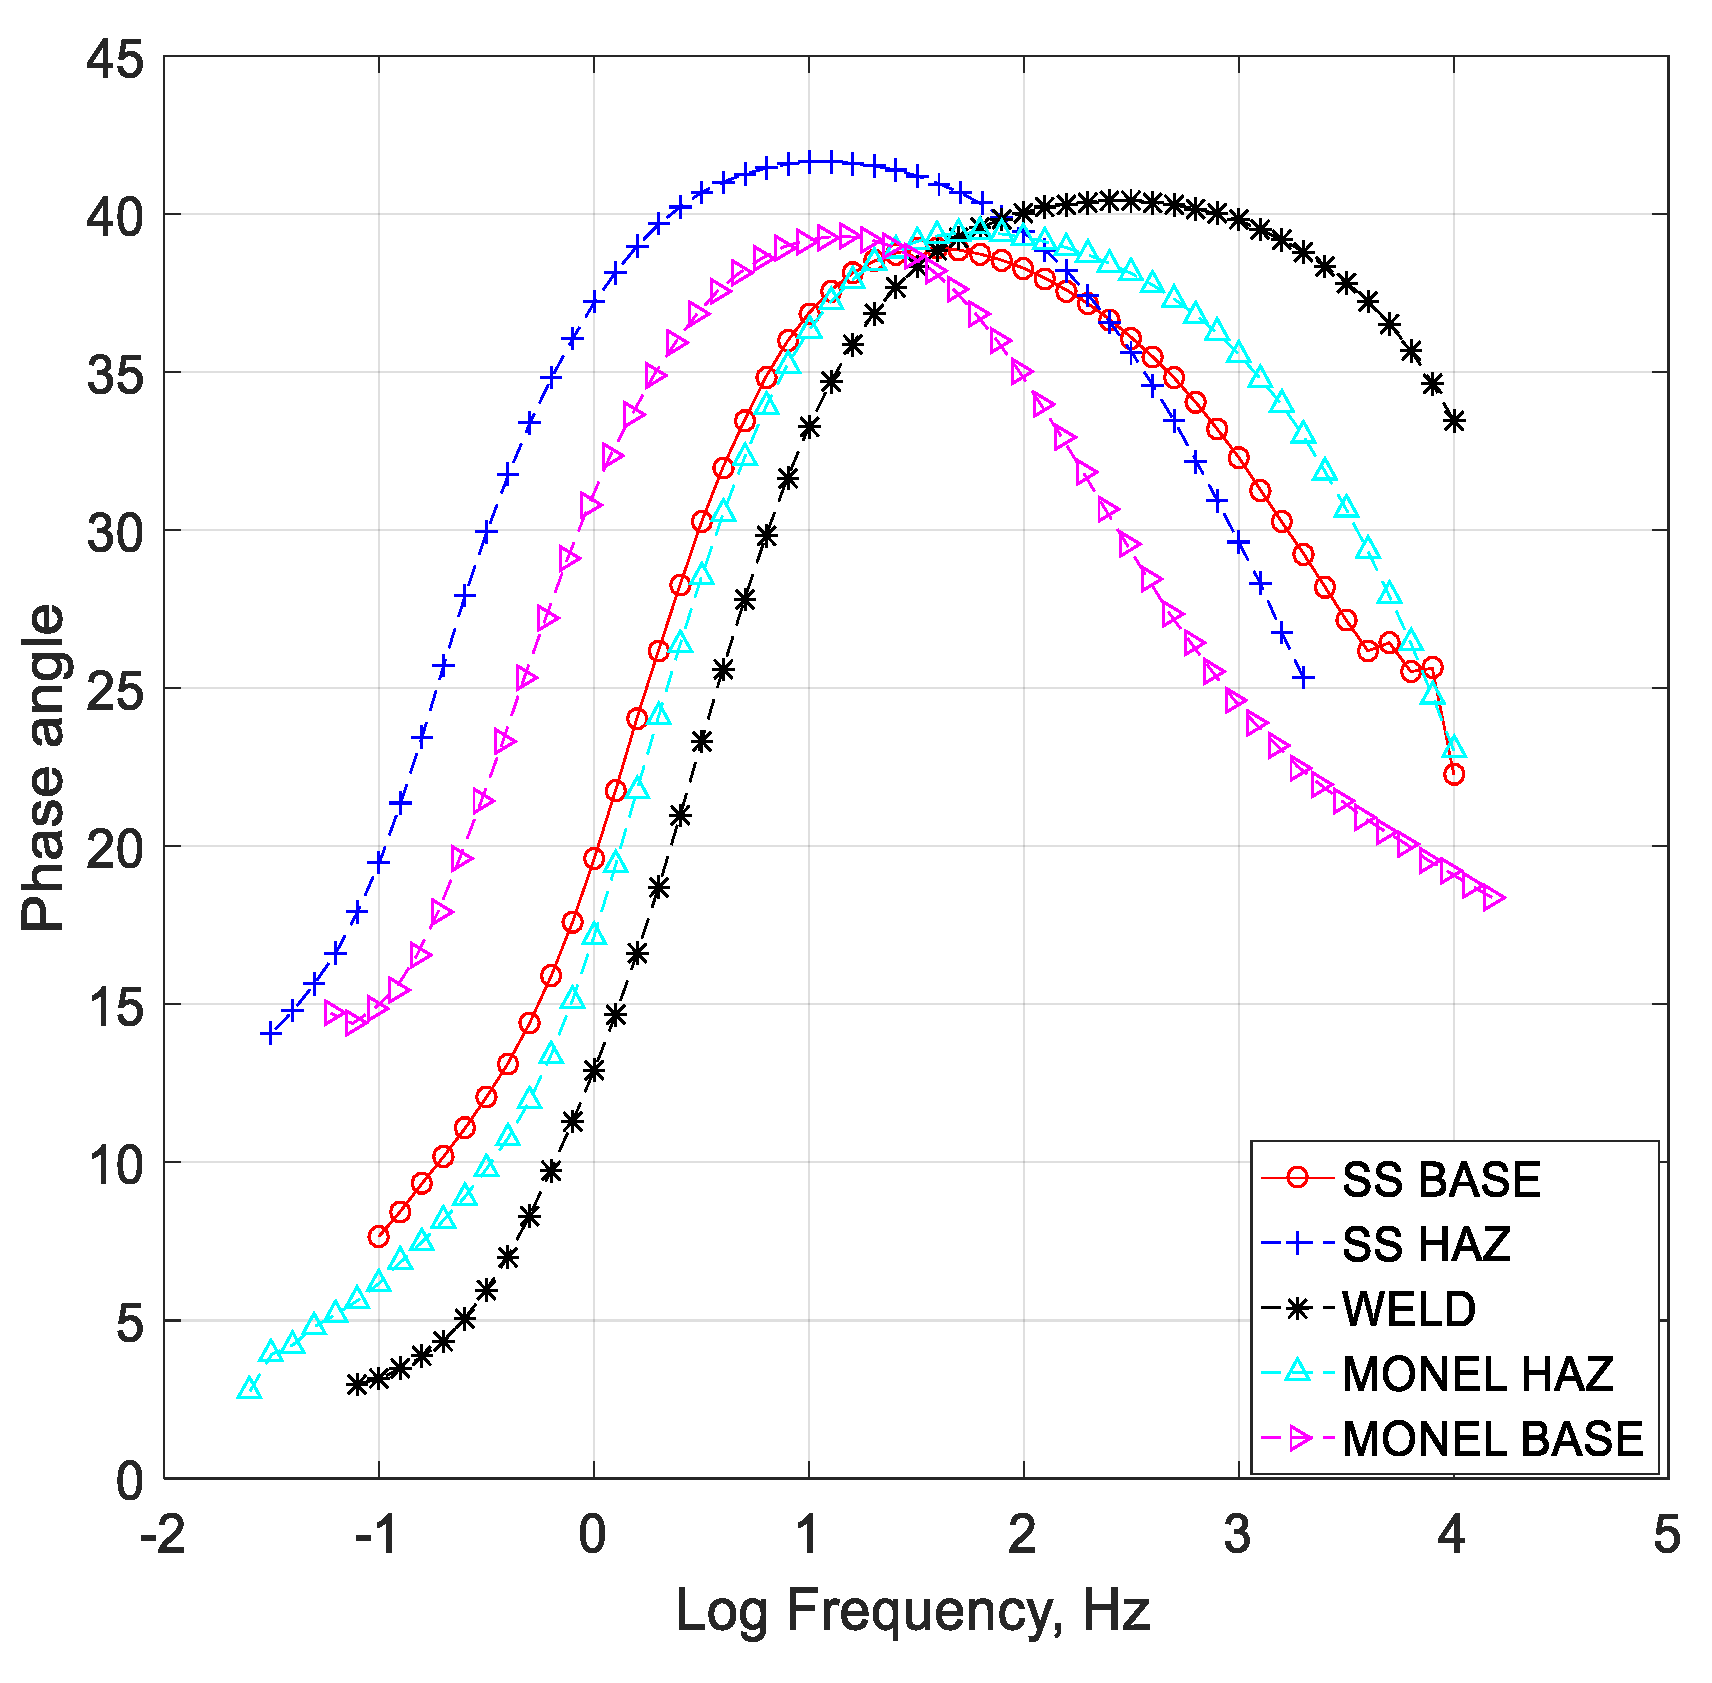
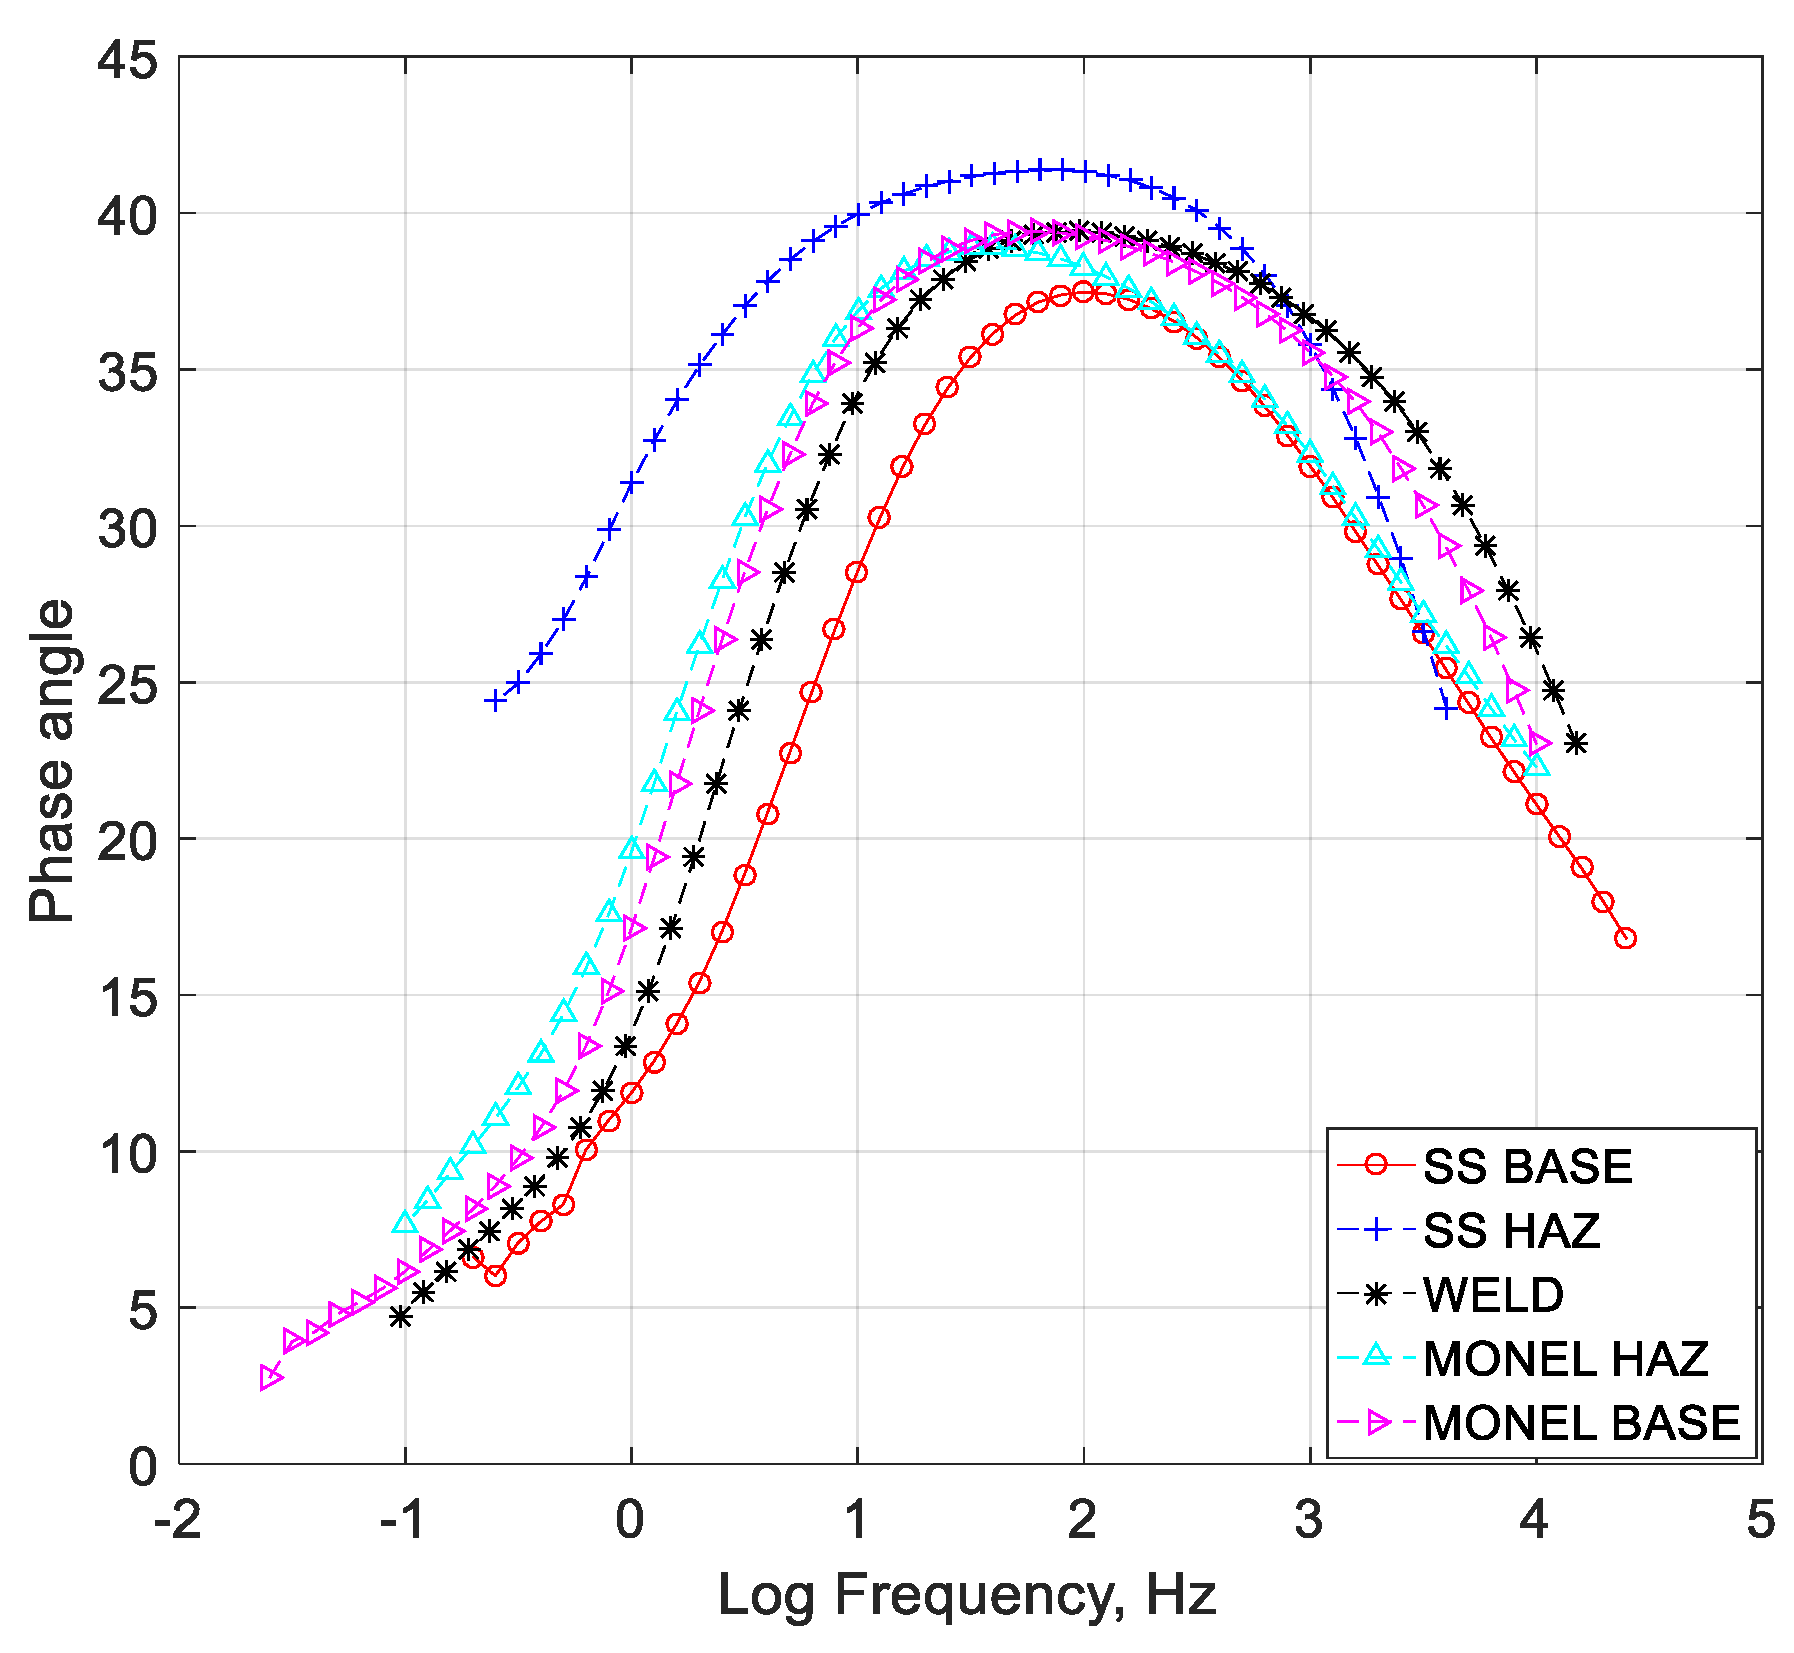
  • Polarization analysis and Electrochemical Impedance Spectroscopy Analysis are powerful techniques to investigate the corrosion resistance of dissimilar metal welds. In the present study, the results have similar trends.
  • Chloride attack at localized location as corrosion is a serious problem of stainless steels when they are exposed to chloride solutions in 316L/Monel 400 dissimilar metal welds.
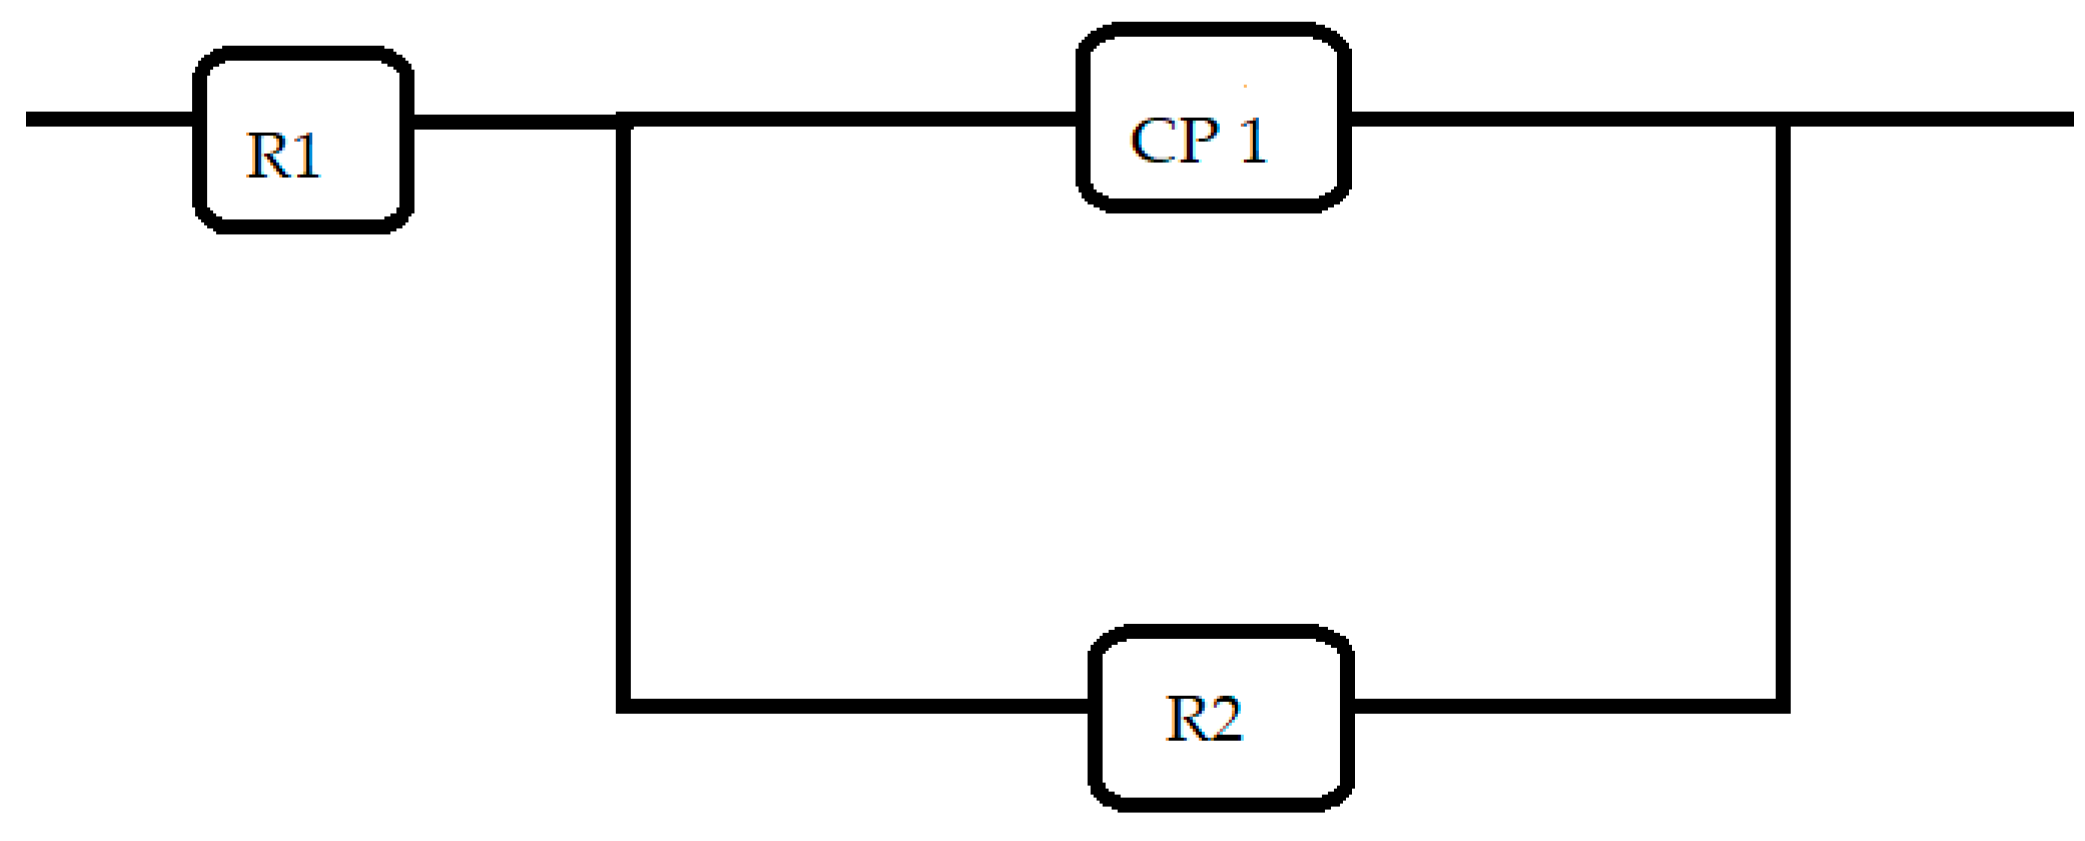
  • Cryogenic treatment resulted in better corrosion resistance when compared to the conventional annealing. The Jcorr values decreased up to 41 times for the cryo-treated specimens, and the corrosion rate of the weld zone was as low as 0.003 × 10⁻⁶ mm/yr, resulting in a 97% reduction in corrosion rate. The electrical equivalent circuit selected matches with the phase angle plot.
  • Among the zones identified for dissimilar welds, corrosion rate is lowest for weld zone and highest for SS 316L HAZ. The corrosion rate for Monel base, Monel HAZ, and SS 316L base are in between them and are almost in the same range as observed in both polarization and electro chemical impedance analyses.

Author Contributions

Conceptualization, Investigation, Resources, Visualization, Writing—original draft: C.M.; Formal analysis, Supervision, Software: R.K.; Validation, Writing—review & editing: S.K.

Funding

This research received no external funding.

Acknowledgments

The authors acknowledge support from BITS Pilani, Dubai campus, for supporting the research and Advanced Material Research Lab, University of Sharjah for extending test facilities.

Conflicts of Interest

The authors declare no conflicts of interest.

Abbreviations

BMBase metal zone
CTCryo-treated specimen
DCENDirect Current Electrode Negative
DCTDeep cryogenic treatment
DMWDissimilar metal welding
EDSEnergy dispersion X-ray Spectroscopy
EISElectrochemical impedance spectroscopy
GTAWGas Tungsten Arc Welding
HAZHeat Affected Zone
HTHeat-treated specimen
LPMLiters per minute
SMAWShielded metal arc welding
SSStainless steel
WMWeld metal zone

References

  1. Mhetre, R.N.; Jadhav, S.G. Finite element analysis of welded joints. Int. J. Instrum. Control Autom. 2012, 1, 116–120. [Google Scholar]
  2. Narayanan, S.; Devendranath Ramkumar, K.; Arivazhagan, N. High temperature corrosion behavior of PCGTA weldments of Monel 400 and AISI 304 exposed in the molten salt environment at 600 °C. Int. J. Chem. Technol. Res. 2014, 6, 1775–1780. [Google Scholar]
  3. Mohandas, T.; Satyanarayana, V.V.; Madhusudhan Reddy, G. Dissimilar metal friction welding of austenitic–ferritic stainless steels. J. Mater. Process. Technol. 2005, 160, 128–137. [Google Scholar]
  4. Ramkumar, K.D.; Arivazhagan, N.; Narayanan, S.; Mishra, D. Hot corrosion behavior of monel 400 and AISI 304 dissimilar weldments exposed in the molten salt environment containing Na2SO4 + 60% V2O5 at 600 °C. Mater. Res. 2014, 17, 1273–1284. [Google Scholar] [CrossRef]
  5. Ukadgaonker, V.G.; Bhat, S.; Jha, M.; Deasai, P.B. Fatigue crack growth towards the weld interface of alloy and maraging steels. Int. J. Fatigue 2008, 30, 689–705. [Google Scholar] [CrossRef]
  6. Sadek, A.A.; Abass, M.; Zaghloul, B.; Elrefaey, A.; Ushio, M. Investigation of dissimilar Joints between Low Carbon steel and Monel 400. Trans. JWRI 2000, 29, 21–28. [Google Scholar]
  7. Kim, Y.H.; Frankel, G.S.; Lippold, J.C.; Guaytima, G. Development of a chromium-free consumable for austenitic stainless steels. Part 1: Monel (Alloy 400) filler metal. Corrosion 2006, 62, 44–53. [Google Scholar] [CrossRef]
  8. Devendranath Ramkumar, K.; Arivazhagan, N.; Narayanan, S. Effect of filler materials on the performance of Gas Tungsten arc welded AISI 304 and Monel 400. Mater. Des. 2012, 40, 70–79. [Google Scholar] [CrossRef]
  9. Ram, G.D.J.; Reddy, A.V.; Rao, K.P.; Reddy, G.M.; Rao, A.S. Effect of magnetic arc oscillation on microstructure and properties of Inconel 718 GTA welds. Trans. Indian Inst. Met. 2006, 59, 85–97. [Google Scholar]
  10. Al-Quran, F.M.F.; Al-Itawi, H.I. Effects of the Heat Treatment on Corrosion Resistance and Microhardness of Alloy Steel. Eur. J. Sci. Res. 2010, 39, 251–256. [Google Scholar]
  11. PrietoW, G.; Tuckart, R. Influence of Cryogenic Treatments on the Wear Behavior of AISI 420 Martensitic Stainless Steel. J. Mater. Eng. Perform. 2017, 26, 5262–5271. [Google Scholar] [CrossRef]
  12. Uygur, I.; Gereng, H.; Arslan, Y.; Kurtay, M. The Effects of Cryogenic Treatment on the Corrosion of AISI D3 Steel. Mat. Res. 2015, 18, 569–574. [Google Scholar] [CrossRef] [Green Version]
  13. Xu, L.-N.; Zhu, J.-Y.; Lu, M.-X. Electrochemical impedance spectroscopy study on the corrosion of the weld zone of 3Cr steel welded joints in CO2 environments. Int. J. Miner. Metall. Mater. 2015, 22, 500–508. [Google Scholar] [CrossRef]
  14. Sendooran, S.; Raja, P. Metallurgical investigation on Cryogenic treated HSS tool. Int. J. Eng. Sci. Technol. 2011, 3, 5. [Google Scholar]
  15. Prieto, G.; PerezIpiña, J.E.; Tuckart, W.R. Cryogenic treatments on AISI 420 stainless steel: Microstructure and mechanical properties. Mater. Sci. Eng. A 2014, 605, 236–243. [Google Scholar] [CrossRef]
  16. Kianersi, D.; Mostafaei, A.; Amadeh, A.A. Resistance spot welding joints of AISI 316L austenitic stainless-steel sheets: Phase transformations, mechanical properties and microstructure characterizations. Mater. Des. 2015, 61, 251–263. [Google Scholar] [CrossRef]
  17. Wong, L.L.; Martin, S.I.; Rebak, R.B. Methods To Calculate Corrosion Rates For Alloy 22 From Polarization Resistance Experiments. In Proceedings of the 2006 ASME Pressure Vessels And Piping Division Conference, Vancouver, BC, Canada, 23–27 July 2006. [Google Scholar]
  18. ASTM G5-14e1. Standard Reference Test Method for Making Potentio-Dynamic Anodic Polarization Measurements; ASTM International: West Conshohocken, PA, USA, 2014. [Google Scholar]
  19. El-Taib Heakal, F.; Tantawy, N.S.; Shehata, O.S. Influence of cerium (III) ions on corrosion and hydrogen evolution of carbon steel in acid solutions. Int. J. Hydrog. Energy 2012, 37, 19219–19230. [Google Scholar] [CrossRef]
  20. Govindasam, R.; Ayappan, S. Study of Corrosion Inhibition Properties of Novel Semi carbazones on mild steel in acidic solutions. Chil. Chem. Soc. 2015, 60. [Google Scholar] [CrossRef]
  21. Duncan, J.B. Corrosion Study for the Effluent Treatment Facility for Chrome (VI) Reductant Solution Using 304 and 316L Stainless Steel; CH2M HILL Hanford Group, Inc.: Richland, WA, USA, 2007; Available online: https://digital.library.unt.edu/ark:/67531/metadc896721 (accessed on 7 October 2019).
  22. Ramkumar, K.D.; Krishnan, S.R.; Ramanand, R.; Logesh, S. Structure–property relationships of PCGTA welds of Inconel X750 in as-welded and post-weld heat treated conditions—A comparative study. J. Manuf. Process. 2015, 20, 1–14. [Google Scholar] [CrossRef]
  23. Farahani, F.; Shamanian, F.; Ashrafizadeh, A. Comparative study on direct and pulsed current gas tungsten arc welding of Alloy 617. AMAE Int. Manuf. Mater. Sci. 2012, 2, 1–6. [Google Scholar]
  24. Sahlaoui, H.; Makhlouf, K. Effects of ageing conditions on the precipitates evolution, chromium depletion and intergranular corrosion susceptibility of AISI 316L: Experimental and modeling results. Mater. Sci. Eng. A 2004, 372, 98–108. [Google Scholar] [CrossRef]
  25. Mylaudy, S.R.; Rajadurai; Naveen, S.; Afnas, M.; Arun, T.; Nirmal, K.; Surendhar, S. Methods to Avoid Material Sensitization During Welding for Developing Corrosion Resistant Exhaust System. Int. J. Recent Dev. Eng. Technol. 2015, 4. Available online: https://www.google.com/search?client=firefox-b-d&q=Methods+to+Avoid+Material+Sensitization+During+Welding+for+Developing+Corrosion+Resistant+Exhaust+System (accessed on 7 October 2019).
  26. López, B.; Rodriguez-Ibabe, J.M. Recrystallisation and grain growth in hot working of steels. In Microstructure Evolution in Metal Forming Processes; Woodhead Publishing Limited: Sawston, UK, 2012; pp. 67–113. [Google Scholar] [CrossRef]
  27. Atanda, P.O.; Fatudimu, A.; Oluwole, O. Sensitization Study of Normalized 316L Stainless Steel. J. Miner. Mater. Charact. Eng. 2010, 9, 13–23. [Google Scholar]
  28. Bansoda, A.V.; Patil, A.P.; Verma, J.; Shukla, S. Microstructure, Mechanical and Electrochemical Evaluation of Dissimilar low Ni SS and using Different Filler Materials. Mater. Res. 2019, 22. [Google Scholar] [CrossRef]
  29. Alqarni, N.D.; Wysocka, J.; El-Bagoury, N.; Ryl, J.; Amin, M.A.; Boukherroub, R. Effect of cobalt addition on the corrosion behavior of near equi atomic NiTi shape memory alloy in normal saline solution. RSC Adv. 2018, 34, 19289. [Google Scholar] [CrossRef]
  30. Anbarasan, N.; Jerome, S.; Arivazhagan, N. Argon and Argon-Hydrogen Shielding Gas effects on the Laves Phase Formation and corrosion behavior of Inconel 718 Gas Tungsten Arc Welds. J. Mater. Process. Technol. 2018, 263. [Google Scholar] [CrossRef]
  31. Li, L.; Dong, C.F.; Xiao, K. Effect of pH on pitting corrosion of stainless steel welds in alkaline salt Water. Constr. Build. Mater. 2014, 68, 709–715. [Google Scholar] [CrossRef]
  32. Verma, J.; Taiwade, R.V.; Kataria, R.; Kumar, A. Welding and electrochemical behavior of ferritic AISI 430 and austeno ferritic UNS 32205 dissimilar welds. J. Manuf. Process. 2018, 34, 292–302. [Google Scholar] [CrossRef]
  33. Brytan, Z.; Niagaj, J.; Reiman, L. Corrosion studies using potentiodynamic and EIS electrochemical techniques of welded lean duplex stainless steel UNS S82441. Appl. Surf. Sci. 2016, 388, 160–168. [Google Scholar] [CrossRef]
  34. ASM International. Corrosion of Weldments (05182G); ASM International: Materials Park, OH, USA, 2006; Available online: https://www.asminternational.org/documents/10192/1849770/ACFAB85.pdf (accessed on 16 January 2019).
  35. Kangazian, J.; Shamanian, M.; Ashrafi, A. Dissimilar welding between SAF 2507 stainless steel and Incoloy 825 Ni-based alloy: The role of microstructure on corrosion behavior of the weld metals Jalal. J. Manuf. Process. 2017, 29, 376–388. [Google Scholar] [CrossRef]
  36. Mani, C.; Karthikeyan, R.; Vincent, S. A study on corrosion resistance of dissimilar welds between Monel 400 and 316L austenitic stainless steel. IOP Conf. Ser. Mater. Sci. Eng. 2018, 346, 012025. [Google Scholar] [CrossRef] [Green Version]
  37. Mohd Touseef Nauman, S.; Mohideen, R.; Kaleem, N. Material characterization of 316L stainless steel after being subjected to cryogenic treatment. Int. J. Mech. Ind. Eng. 2012, 2, 2231–6477. [Google Scholar]
  38. Barron, R.F.; Thompson, R.H. Effect of cryogenic treatment on corrosion resistance. In Proceedings of the 8th International Cryogenic Materials Conference, Los Angeles, CA, USA, 24–28 July 1989. [Google Scholar]
Figure 1. Weld-groove configuration and sizes.
Metals 09 01088 g001
Figure 2. Locations for optical microscopy and Energy dispersive spectroscopy (EDS) for SS316L heat affected zone (HAZ), SS316L fusion line, weld zone, Monel fusion line, and Monel HAZ for heat-treated (HT) specimen (typical).
Metals 09 01088 g002
Figure 3. (a) Specimen cryo-treated (CT)-SS 316L HAZ; (b) specimen CT-SS 316L weld fusion; (c) specimen CT-weld zone; (d) specimen CT-weld fusion zone of Monel; (e) specimen CT-Monel 400 HAZ; (f) specimen HT-SS 316L HAZ; (g) specimen HT-weld fusion zone of SS 316L; (h) specimen HT-weld zone; (i) specimen HT-weld fusion of Monel; and (j) specimen HT-Monel 400 HAZ.
Metals 09 01088 g003aMetals 09 01088 g003b
Figure 4. EDS and SEM for CT specimen; (a) specimen CT-EDS mapping for SS HAZ; (b) specimen CT-SEM on SS HAZ area.
Metals 09 01088 g004
Figure 5. EDS and SEM for HT specimen; (a) specimen HT-EDS mapping for 316LSS HAZ; (b) specimen HT-SEM on SS HAZ area.
Metals 09 01088 g005
Figure 6. EDS and SEM for CT specimen; (a) specimen CT-EDS mapping for weld; (b) specimen CT-SEM on weld.
Metals 09 01088 g006
Figure 7. EDS and SEM for HT specimen; (a) specimen HT-EDS mapping for weld; (b) specimen HT-SEM on weld.
Metals 09 01088 g007
Figure 8. EDS and SEM for CT specimen; (a) specimen CT-EDS for Monel HAZ; (b) specimen CT-SEM on Monel HAZ; (c) specimen CT-EDS for Monel at weld dilution near HAZ.
Metals 09 01088 g008
Figure 9. EDS and SEM for HT specimen; (a) specimen HT-EDS for Monel HAZ; (b) specimen HT-SEM on Monel HAZ.
Metals 09 01088 g009
Figure 10. Polarization graphs—specimen CT.
Metals 09 01088 g010
Figure 11. Polarization graphs—specimen HT.
Metals 09 01088 g011
Figure 12. Nyquist plot for CT specimen.
Metals 09 01088 g012
Figure 13. Nyquist plot for HT specimen.
Metals 09 01088 g013
Figure 14. Bode plot for CT specimen.
Metals 09 01088 g014
Figure 15. Bode plot for HT specimen.
Metals 09 01088 g015
Figure 16. Phase angle variation for CT specimen.
Metals 09 01088 g016
Figure 17. Phase angle variation for HT specimen.
Metals 09 01088 g017
Figure 18. Schematic representation of the equivalent electric circuit.
Metals 09 01088 g018
Table 1. Chemical composition of base materials and filler wire.
MaterialCCrFeMnNiPSSiMoCuTiCoNb
SS 316L0.031765.642120.0450.030.752.50---
Monel 4000.3-2.5263-0.0240.5-31.676---
ENiCrFe-50.0414–176–101.0 70 (min)0.030.0150.35-0.5 0.121.5
Table 2. Comparison of EDS wt % of CT and HT specimens at HAZ and welds zones cited.
wt %SS HAZ after CorrosionWeld after CorrosionMonel HAZ after Corrosion
ComponentCTHTCTHTCTHT
Cr5.64.810.611.5-0.7
Fe19.712.19.111-2.4
Mn1.92.51.52.9-1.2
Ni3.94.434.522.121.8628.2
Mo---0.5--
Cu1.20.842.910.4812.7
Ti--1.40.6--
Cl16.226.2-6.51.8110.5
Nb--1.71.9--
Na18.524.62.311.86.7916.4
Table 3. Polarization parameters of Monel 400 and SS 316L for specimen’s CT and HT.
SpecimenZonesAreaEcorrJcorrIcorrTafel SlopeCorrosion RatePolarization Resistance
cm2VµA/cm2µAβaβc(mm/yr) × 10−6(M ohm)
Specimen CTSS 316L Base0.480.1657.536.850.053−0.1660.0792.54
SS 316L HAZ0.940.10456.4951.360.096−0.1460.5890.49
Weld Zone1.020.0900.320.290.296−0.6920.003313.10
Monel HAZ1.800.1112.051.860.151−0.0980.02013.80
Monel 400 Base0.900.0991.481.340.066−0.0730.01411.20
Specimen HTSS 316L Base1.040.182257.04233.670.028−0.1752.6790.04
SS 316L HAZ1.030.183562.34511.220.098−0.1345.8610.05
Weld Zone1.070.06213.5512.320.095−0.2570.1412.45
Monel HAZ1.090.13539.0835.530.105−0.2770.3780.93
Monel 400 Base1.010.09419.0517.320.049−0.1900.1840.99
Table 4. Summary of resistance and capacitance of equivalent circuit.
SpecimenSPECIMEN CTSPECIMEN HT
ZonesR1R2P1R1R2P1
OhmOhmFaradsOhmOhmFarads
Weld6.991915.50.0000621611880.00012
Monel Base5.64990.10.000274.257420.00023
Monel HAZ4.03741.290.000255.547040.00029
SS Base5.54704.280.000299.846100.00015
SS HAZ1.983750.00154.95550.0009

