Article

On Phenomenological Failure Loci of Metals under Constant Stress States of Combined Tension and Shear: Issues of Coaxiality and Non-Uniqueness

Department of Mechanical and Mechatronics Engineering, University of Waterloo, Waterloo, ON N2L 3G1, Canada
*
Author to whom correspondence should be addressed.
Metals 2019, 9(10), 1052; https://doi.org/10.3390/met9101052
Submission received: 30 August 2019 / Revised: 21 September 2019 / Accepted: 25 September 2019 / Published: 28 September 2019

Abstract

:
The present study investigates how the choice of characterization test and the composition of the stress state in terms of tension and shear can produce a non-unique failure locus in terms of stress triaxiality under plane stress conditions. Stress states that are composed of tensile and simple shear loadings result in a loss of proportionality between the cumulative strain and stress such that the principal frames become non-coaxial despite a constant stress triaxiality. Consequently, it is shown that the conventional interpretation of a failure locus in plane stress is based upon an implicit assumption of proportional coaxial loading. The use of simple shear tests along with traditional in-plane tensile tests for fracture characterization is only one “path” that can be taken in terms of the stress triaxiality, which may produce a bifurcation at uniaxial tension while the tension–torsion path does not. In general, the failure locus in terms of the equivalent strain is a failure surface and must consider the composition of the stress state that produces a given triaxiality. A comprehensive review of phenomenological fracture loci within a modified Mohr-Coulomb (MMC) framework is performed to highlight how the choice of stress states obtained using different characterization tests can change the apparent fracture locus of a material. The finite strain solutions for the work conjugate equivalent strain are derived for various loading paths that produce the same stress triaxiality. It is then shown that accounting for non-coaxiality leads to equivalent failure strains that are even higher than previously reported in tension–torsion tests within the literature. The equivalent plastic strains integrated from finite-element simulations are work-conjugate by definition. The equivalent strains estimated from the cumulative principal strains using DIC strain measurement depend upon a coaxial or non-coaxial assumption. Finally, an analytical solution for the onset of diffuse necking that accounts for the stabilizing influence of shear loading against a tensile instability is considered. Even under plane stress conditions, a failure surface arises in terms of the equivalent strain at necking, the stress triaxiality, and the severity of shear loading.

1. Introduction

The experimental characterization and numerical prediction of failure in sheet materials has undergone tremendous growth in the past decade with the aid of digital image correlation (DIC) techniques for strain measurement and the development of a phenomenological stress state dependent modelling framework from Bao et al. [1] and Bai and Wierzbicki [2,3,4] along with many advancements from the research group of Mohr [5,6,7,8,9,10,11,12,13]. The advent of DIC has led to many new test geometries for fracture characterization and a refinement of the analysis methods from simple shear [13,14,15,16,17] to plane strain tension using tight-radius bend tests [13,18] as well as uniaxial tension experiments using hole tensile and hole expansion tests [5,13,19,20,21]. Tests for combined tension and shear have also been developed using modified Arcan tests [22], butterfly-type specimens [6,9,21], or tension–torsion of tubes [11,12,23,24,25,26].
With the aid of DIC, the local displacement and strain fields on a surface of a test specimen can be directly measured at the fracture location and assuming a constitutive model, the stress state can be obtained analytically from the strain history if deformation is plane stress. Alternatively, the stress and strain history can be extracted from finite-element analysis. Repeating this procedure for various test specimen geometries that provide different proportional stress states, a phenomenological equation can then be calibrated to describe the fracture locus for proportional loading. There are many phenomenological models to choose from in the literature to describe the variation of the failure strain with the stress state, with notable examples including the Johnson–Cook (JC) [27], CrachFEM model [28], the modified Mohr Coulomb (MMC) model of Bai and Wierzbicki [2,3,4], the Hosford–Coulomb (HC) model of Mohr and Marcadet [10], and the models of Lou et al. [29,30,31,32]. If localization strains are used to calibrate the failure locus, then a type of generalized forming limit curve is obtained [2,31,32,33]. If fracture strains are used, it becomes a fracture locus.
The need to develop stress state-dependent failure models can be attributed to the fracture sensitivity of emerging high strength sheet materials, such as advanced high strength steel and aluminum alloys used for vehicle lightweighting. The failure behavior of these alloys can be markedly different in loading conditions of shear, uniaxial tension, and biaxial tension due to their complex microstructures. To capture this fracture sensitivity, Bai and Wierzbicki [2,3,4] postulated the existence of a failure locus in the stress space whose shape and magnitude could be approximated using the isotropic-asymmetric Mohr–Coulomb (MC) yield criterion. At first, this appears to be an odd choice. The MC model is not used to describe the yielding of sheet metals, which are largely insensitive to the hydrostatic stress. Instead, the MC model describes the yielding of geomaterials, such as soils and rocks, that have a higher yield strength in compression than tension. It is not a failure criterion for ductile metals. However, a key insight of Bai and Wierzbicki [2,3] was to recognize the potential of the functional form of the MC criterion to describe the failure locus of metals in stress space where the failure strains are much larger in compression than in tension. The underlying concept was that the yield surface of sheet metals, often assumed to be von Mises, will expand with hardening and intersect the failure locus described by the MC model. Since the MC formulation is asymmetric in tension and compression, the stress required to reach failure in compression can be set to a higher value than in tension and thus mimic the experimental fracture observations for sheet metals. The resulting failure locus in terms of the equivalent plastic strain, stress triaxiality, and Lode parameter is referred to as the modified Mohr Coulomb (MMC) model and has seen widespread adoption throughout the literature [34,35,36,37,38,39,40].
For the purpose of the present study, the entire class of recent failure models built upon a proportional failure locus and a damage accumulation function can be classified in broad terms to fall within the general MMC framework and operate in a similar fashion. The choice of invariants to define the stress state, assumed shape of the failure locus, and whether the scalar failure metric is stress or strain based can be different, but the same methodology and calibration procedures from the characterization test data are used. Consequently, the models share the same assumptions and limitations in terms of assuming a unique fracture locus in plane stress. Commonly, the equivalent plastic strain is taken as the failure metric and the stress state is characterized using the stress triaxiality, T, and the Lode parameter, L, that together provide a measure of three stress invariants. The variation in the failure strain with the stress state is:
ε p f = ε p f ( T , L ) .
For plane stress loading, the triaxiality and Lode parameter are not independent and the triaxiality is often used to define the stress state as ε p f = ε p f ( T ) . Along with the proportional failure locus in Equation (1), a tracking metric is required to indicate when the proportional failure limit has been reached. This metric is the so-called damage variable, D. At the start of plastic deformation, D = 0, and when D = 1, the failure limit has been reached. A general damage formulation using the equivalent strain as the failure metric can be written as:
D = d ε p ε p f ( T , L ) .
An incremental form of the tracking metric is used to generalize the proportional failure locus to non-proportional loading conditions where both linear and non-linear “damage accumulation” functions have been proposed [12,27,41,42]. It is emphasized that these damage accumulation functions contain no microstructural information and should be strictly interpreted as tracking metrics or damage counters. Although there are valid issues of modelling taste surrounding the use of these damage accumulation functions as highlighted by the numerical studies of Benzerga et al. [43] and Thomas et al. [44], both linear and non-linear damage functions are admissible when restricted to proportional loading conditions and predict the same failure strains.
For the purpose of the present study, the choice of an appropriate damage accumulation function is of secondary importance since the analyst must first obtain an accurate representation of the proportional fracture locus. Typically, the characterization experiments for sheet materials involve a variety of notched tensile tests along with a simple shear test and bulge/biaxial test [13,45,46]. Alternatively, the novel butterfly-type specimens of Mohr [24,47] can be used since only one geometry is required to cover stress states from simple shear to plane strain tension. Tension–torsion tests of tubes are also gaining interest since plane stress states from simple shear to plane strain tension can also be evaluated like the butterfly tests but with generally higher failure strains reported compared to in-plane testing of aluminum alloys by Papasidero et al. [12] for AA2024-T351 and by Scales et al. [26] for AA6061-T6. These tension–torsion tests were performed by maintaining a constant stress state through control of the axial extension and applied torsion and will be referred to as “constant tension–torsion” (CTT) tests.
The CTT tests of Haltom et al. [25] and Scales et al. [26] for AA6061-T6 tubes and the comparison of these failure strains with those reported by Beese et al. [46] for AA6061-T6 sheet are of particular interest. It was reported that the equivalent failure strains in the tension–torsion tests were higher across the range of plane stress states from shear to plane strain tension. As the stress state approached simple shear, the divergence between the two test methods for sheets and tubes increased. It is possible that the differences could be attributed to differences in the choice of test geometry, DIC analysis settings, and variations between sheet and tube material. For instance, in-plane shear tests are prone to edge cracking and the choice of DIC gage length [15,16]. However, given the widespread adoption of tensile-based coupons for characterization of sheet metals, the underlying mechanics of these structural tests for sheet and tubes warrants closer scrutiny.
It was the attempt to reconcile the difference in the failure strains between in-plane and CTT characterization tests that provided the initial motivation for the present study, which in turn, revealed larger issues with non-uniqueness within the MMC framework. It will be demonstrated that for ductile materials, a divergence between the test methods is not altogether unexpected since the stress states obtained in CCT tension–torsion tests do not maintain coaxiality in terms of the cumulative principal strain and principal stress directions. The stress state is constant, but loading is not strictly proportional. The cumulative strain components are not linearly related to the stress components since the microstructure is also rotating due to the simple shear loading of the applied torsion. Although the stress triaxiality can be constant along with the principal stress and principal strain ratios, the equivalent plastic strain is not necessarily proportional to the principal strains and may increase hyperbolically. This fact is not properly reflected in current failure models based upon the equivalent strain and stress triaxiality. A stress state composed only of tensile stresses or one of tensile and shear components is treated the same. An adjustment of the DIC failure strains to compensate for the assumption of coaxial proportional loading in the CTT tests of Scales et al. [26] is shown to increase the equivalent plastic strains in shear-dominated loading. No bifurcation or cusp in the fracture locus at uniaxial tension was observed in the CTT tests.
For low ductility materials, it will be shown that non-coaxiality effects are expected to be secondary since failure will occur at low strain levels when deformation is approximately coaxial. However, what the analysis of the CTT tests of Haltom et al. [25] and Scales et al. [26] reveals is that the underlying framework for failure characterization under a constant stress state as in MMC-type models contains inconsistencies that can result in non-unique failure loci. Theoretically, there are an infinite number of non-coaxial loading paths that will produce the same stress constant triaxiality under 3-D or plane stress conditions. Depending upon the material and its anisotropy and failure mechanisms, non-unique failure loci can be obtained that depend upon the choice of characterization tests. The general trends for the influence of shear in the CTT tests is also predicted by the diffuse necking model of Hillier [47]. The larger the applied shear, the more diffuse necking due to a tensile instability is suppressed such that the stress history will be more proportional in CTT tests until fracture than for a tensile-based test without shear, which will see localization occur at lower strains.
The balance of the paper is organized by first performing a comprehensive review of the methods used to characterize the stress states to generate a failure locus and a review of phenomenological failure models. The finite strain solution of the work-conjugate equivalent strain is then derived for general plane strain-plane stress loading conditions associated with CTT and butterfly tests, including an adjustment to the equivalent strains reported for tension–torsion tests of AA6061-T6 [25,26]. Observing that an experimental failure locus in proportional loading is effectively a principal strain criterion with respect to how it is obtained in the lab, it is shown how different non-coaxial loading paths can convert this failure locus to a plane stress failure surface in terms of the equivalent strain, stress triaxiality, and severity of the applied shear stress. Finally, the plastic work localization criterion of Hillier [47] is employed to predict the onset of diffuse necking for general plane stress loading, with an emphasis upon tension–torsion tests. The solution of Hillier for diffuse necking also predicts that a failure surface arises in plane stress as a function of the stress triaxiality and severity of shear loading. The potential implications of the influence of non-coaxiality on the current use of phenomenological failure criteria and micromechanical approaches to fracture modelling are then discussed.

2. Review of the Methodology for Failure Characterization using Stress Invariants and the Equivalent Stress or Strain

2.1. Characterization of the Stress State

Characterization of the stress state using three stress invariants is a convenient method to reduce the six unique stress components of the stress tensor to three parameters. Since the yielding of metals is generally insensitive to the hydrostatic stress, only the two non-zero deviatoric stress invariants, J2, and J3, are required. Despite the fact that the hydrostatic stress is typically ignored in plasticity models of sheet metals, it is a significant factor for characterizing the failure behavior in terms of material damage since it affects void growth and coalescence. Since J1 = 0 by definition, the first invariant of the stress tensor, I1, is used to account for the hydrostatic stress. The severity of hydrostatic loading, or stress triaxiality, T, incorporates the two invariants I1 and J2 and can be expressed in terms of the applied stresses as:
T = σ h y d σ e q v m = I 1 3 3 J 2 = 2 3 σ 11 + σ 22 + σ 33 ( σ 11 σ 22 ) 2 + ( σ 22 σ 33 ) 2 + ( σ 33 σ 11 ) 2 + 6 σ 12 2 + 6 σ 23 2 + 6 σ 13 2 .
For plane stress loading with σ 33 = 0 , the stress triaxiality values for typical stress states of shear (S), uniaxial tension (UT), plane strain tension (PST), and equal biaxial tension (EBT) are:
T S = 0 ,   T U T = 1 3 ,   T P S T = 1 3 0.58 ,   T E B T = 2 3 .
To characterize the severity of shear loading, the Lode parameter [48], L, or one of its alternative formulations of Bai and Wierzbicki [2,3,4], is used to provide information on the deviatoric stress state using the third invariant, J3. Three commonly used versions of the Lode parameter are:
L = 2 ( σ 2 σ 3 ) σ 1 σ 3 1 ,
L J 2 J 3 = 3 3 2 J 3 ( J 2 ) 3 2 = 27 2 J 3 ( σ e q v m ) 3 ,
θ ¯ L = 1 2 π cos 1 ( L J 2 J 3 ) ,
and all range from –1 to 1 with L θ ¯ L . The Lode parameters for typical plane stress loading conditions are:
L S = 0 ,   L U T = 1 ,   L P S T = 0 ,   L E B T = 1 ,
where L = 0 for both shear and plane strain tension as they are both types of generalized plane strain loading. For plane stress loading, only the triaxiality or the Lode parameter is required to characterize the stress state and they are related as shown by Bai and Wierzbicki [4] as:
L J 2 J 3 = cos [ π 2 ( 1 θ ¯ L ) ] = 27 2 T ( T 2 1 3 ) .
It is important to emphasize that by definition, the principal loading directions are excluded in the invariant representation of the stress state using the triaxiality and Lode parameter. For anisotropic materials, it is apparent that the stress state cannot be uniquely defined using invariants since yielding and fracture of the material will be dependent upon the loading direction relative to the material axes of orthotropy [8]. The stress invariants can also not differentiate between coaxial and non-coaxial stress states, such as between a pure shear (no spin) and simple shear, where the triaxiality and Lode parameter are both zero.

2.2. Phenomenological Descriptions of the Failure Locus

It is important to first review the major phenomenological failure models so that issues associated with the triaxiality and equivalent strain due to non-coaxiality can then be clearly identified. Due to the numerous failure models proposed in the literature, we will limit the discussion to more recent models that can explicitly differentiate between stress states using the three stress invariants. This excludes models such as Johnson–Cook [27], Cockcroft–Latham [49], Oyane and Sato [50], and Clift et al. [51], although they may perform well for some materials and applications. Additional comparisons between these and other failure models can be found in Wierzbicki et al. [52] and Lou et al. [34].
Arguably, the most popular ductile fracture criterion for sheet metals in the past decade has been the modified Mohr Coulomb (MMC) failure criterion of Bai and Weirzbicki [2,3,4], who used the Mohr–Coulomb (MC) yield locus to describe a fracture locus in stress-space. The Mohr–Coulomb yield criterion is an isotropic-asymmetric maximum shear stress criterion that can be written in terms of the major and minor principal stresses and its two material parameters, τ and c, as:
σ 1 σ 3 + c ( σ 1 + σ 3 ) = τ ,
where τ is the shear yield stress and c effectively controls the asymmetry of the yield stress between uniaxial tension and compression. Yielding is independent of the intermediate principal stress and the MC model is a constant principal stress criterion in the tensile quadrant. In the shear quadrant from uniaxial tension to uniaxial compression, the principal stress varies linearly. Using the MC model as a principal failure stress criterion leads to:
σ 1 f = { τ f 1 + c = constant σ 3 = 0 σ 2 σ 1 0 τ f ( 1 α ) + c ( 1 + α ) σ 2 = 0 α = σ 3 σ 1 0 .
Assuming a von Mises constitutive model and isotropic hardening law to describe the plastic behavior of the material, the yield locus will expand and intersect the MC failure locus at different equivalent stresses or equivalent plastic strains depending on the stress state. This is most pronounced for plane strain tension or compression as these are the extrema of the von Mises yield surface that will first intersect the MC locus at the lowest amount of hardening (Figure 1). To illustrate this mathematically, the MC criterion must first be expressed as a function of the von Mises equivalent stress. Adopting the terminology of Mohr and Marcadet [10], the ordered principal stresses, σ 1 3 , can be expressed as a function of the stress triaxiality and Lode parameter, θ ¯ L , as:
σ 1 = 3 J 2 ( T + f 1 ( θ ¯ L ) ) ,   σ 2 = 3 J 2 ( T + f 2 ( θ ¯ L ) ) ,   σ 3 = 3 J 2 ( T + f 3 ( θ ¯ L ) ) ,
f 1 ( θ ¯ L ) = 2 3 cos ( π 6 ( 1 θ ¯ L ) ) ,   f 2 ( θ ¯ L ) = 2 3 cos ( π 6 ( 3 + θ ¯ L ) ) ,   f 3 ( θ ¯ L ) = 2 3 cos ( π 6 ( 1 + θ ¯ L ) ) .
It is then straightforward to convert Equation (10) to obtain the MC failure criterion in stress space as:
σ v m f ( T , θ ¯ ) = τ f f 1 ( θ ¯ L ) f 3 ( θ ¯ L ) + c [ 2 T + f 1 ( θ ¯ L ) + f 3 ( θ ¯ L ) ] ,
where τ f is the failure shear stress that has the same value for both pure shear and simple shear. Experimentally, it is preferable to work with the equivalent plastic strain instead of the equivalent stress since the hardening response at strain levels associated with fracture is often uncertain. Assuming a power law hardening model, σ ¯   =   K ε n , and that at the onset of failure σ ¯ ( ε f )   =   σ e q f , Equation (14) can be converted to an equivalent failure strain locus to obtain the so-called Modified Mohr Coulomb failure model is obtained:
ε M M C f ( T , θ ¯ ) = [ τ f / K f 1 ( θ ¯ L ) f 3 ( θ ¯ L ) + c [ 2 T + f 1 ( θ ¯ L ) + f 3 ( θ ¯ L ) ] ] 1 n .
Recognizing that Equation (15) is simply a phenomenological form that can be calibrated to describe the failure strain data from the experiments, it can be generalized with three calibration parameters, C1C3, as:
ε f ( T , θ ¯ ) = C 1 ( f 1 ( θ ¯ L ) f 3 ( θ ¯ L ) + C 2 [ 2 T + f 1 ( θ ¯ L ) + f 3 ( θ ¯ L ) ] ) C 3 .
A coupling between the plasticity model and the failure locus of Equation (16) is established during the calibration procedure, where a yield function and hardening law must be assumed to integrate the stress state and equivalent strain at failure. Any phenomenological form or variation on Equation (16) can be used as long as it fits the failure strain data with flexible models proposed by Lou et al. [29,30,31,32]. The Hosford–Coulomb (HC) model of Mohr and Marcadet [10] is also phenomenological like the MMC model but is notable in that the functional form was determined from an exhaustive numerical study of the localization and failure of voided unit cells by Dunand and Mohr [7]. The MC model provided a reasonable approximation to the numerical failure data generated across a complete range of stress states from shear to tension. A modified form of the Hosford equivalent stress was then used to replace the Tresca equivalent stress to improve the agreement across the range of stress states. The resulting HC failure surface is:
σ v m f ( T , θ ¯ L ) = τ f ( 1 2 ( f 1 f 2 ) m + 1 2 ( f 2 f 3 ) m + 1 2 ( f 1 f 3 ) m ) 1 m + c [ 2 T + f 1 + f 3 ] .
Mohr and Marcadet [10] elected to use this three-parameter model in terms of τ f , c, and m as an equivalent failure stress model, but it can be readily converted to an equivalent strain-based criterion for a given hardening law.
The review of the development of MMC-type stress-state-dependent fracture loci is important to highlight the common themes in their construction. The models themselves do not contain any underlying physics to guide their fracture predictions. However, with physically relevant data, such as from the micromechanical study of Dunand and Mohr [7], they can be calibrated to describe those results. This is not intended to be critical of the models that have been successfully applied in the literature to describe the failure behavior of sheet materials, including by the authors in Anderson et al. [21] and Omer et al. [53]. Instead, it is to emphasize that the framework is largely empirical and built upon failure characterization in a constant stress state that treats coaxial and non-coaxial loading conditions equally since they are based upon isotropic yield functions. Consequently, the composition of the stress state in terms of the shear and normal stresses will produce the same equivalent fracture stress. Consequently, a systemic bias can be introduced into the models based upon the choice of characterization tests and if they are strictly proportional (coaxial) or non-proportional but with a constant stress state (non-coaxial).

2.3. MMC Failure Criterion and Assumptions of Proportional Loading

A brief demonstration of the operation of an MMC-type failure model in plane stress will reveal the potential bias in the model towards the assumption of proportional coaxial loading. Let us assume a von Mises material with an arbitrary power law hardening law of σ ¯ ( M P a ) = 750 ( 1 + 0.9 ε p ) 0.20 and the Mohr–Coulomb failure locus in Equation (10). The equivalent failure strain in uniaxial tension is assumed to be 0.50 to fix the MC locus in the tensile quadrant and then the influence of the c parameter in Equation (10) can be highlighted, where c = 0 corresponds to the Tresca failure locus. The von Mises yield surface and MC failure loci in a principal plane stress representation are shown in Figure 1, where the intersection of the yield surface and failure loci generates the corresponding failure locus in terms of the equivalent strain and triaxiality shown in Figure 2. The discontinuity in the MC failure locus in the principal stress space at uniaxial tension creates a corresponding cusp in the failure strain locus.
Whether there is experimental evidence to suggest that a cusp at uniaxial tension is real or an artefact of the MC failure locus description is an open question. The fracture locus in plane stress (Figure 2) is a 2D projection in terms of the stress triaxiality that is taken from the 3D failure locus (Figure 3) so the appearance of a cusp in the 2D representation can also be attributed to the fracture sensitivity of a material to the Lode parameter. In Section 4, it will be shown that a cusp may be predicted as a natural consequence of using simple shear (non-coaxial) tests from shear to uniaxial tension and then using in-plane tension tests (coaxial) from uniaxial tension to equal-biaxial tension. Using constant tension–torsion tests of tubular materials, no cusp in the experimental plane stress fracture locus was observed by Haltom et al. [25], Papasidero et al. [11,12], and Scales et al. [26].
A schematic of the proportional failure surface in terms of the stress triaxiality and Lode parameter is shown in Figure 3 where the failure locus for plane stress is highlighted. This leads us to then formally establish what constitutes proportional loading conditions associated with this failure surface and the underlying implications on the assumed failure behavior of the material. All failure models that follow the general MMC-type framework, such as the MMC model in Equation (15), are making assumptions regarding failure of the material that correspond to either:
Postulate 1:
The equivalent failure strain or equivalent failure stress of a material is independent of the composition of the stress state. In other words, the equivalent failure strain of a material element subjected to normal stresses will be identical for a material element subjected to normal and shear stresses. For instance, the equivalent failure strain will be the same for pure shear and for simple shear despite having a strain field that evolves differently under the same stress triaxiality.
Postulate 2:
The failure surface in terms of the equivalent stress or equivalent strain only describes failure for general stress states that satisfy the conditions for coaxial proportional loading. In practice, the model treats coaxial and non-coaxial stress states equally as in Postulate 1 since simple shear tests are used in the model calibration.
To the best of the authors’ knowledge, the exact interpretation of these failure loci in the literature has not been previously specified aside from “proportional loading”. Coaxial proportional loading in Postulate 2 is tacitly assumed in the consistent labelling of the shear condition as pure shear [17] despite the use of simple shear characterization tests that only approximate pure shear for low strain levels. Pure shear is strictly proportional in that the total strain is proportional to the stresses and the principal stress and strain directions remain aligned. The equivalent strain in pure shear is linearly related to the cumulative principal strain.
An implicit assumption of coaxial proportional loading is commonly invoked in the deconstruction of a failure locus in terms of the equivalent strain and stress triaxiality into the principal strains under proportional loading [3,9,32,33,34]. In principal strain space, the failure locus may be called a fracture forming limit diagram (FFLD) or a generalized forming limit curve (GFLC) if limit strains are the failure metric. In these conversions to principal space, the equivalent strain is decomposed under coaxial proportional loading such that the equivalent strain is proportional to the principal strains. This representation is inconsistent with the characterization tests from shear to uniaxial tension since simple shear, butterfly, or CTT tests would be used in those stress states. The equivalent strain needs to be decomposed into its principal strains that takes non-coaxiality into account to be consistent with the experiments.
There is no inconsistency between the experiments and analysis if combined shear and tensile stress states are excluded like in the conversion of a classical forming limit diagram (restricted to proportional tensile loading) into a form, such as the polar effective plastic strain (PEPS) model of Stoughton and Yoon [54]. Due to the use of both coaxial and non-coaxial characterization tests in practice, the balance of the paper will assume that MMC-type failure models are based upon Postulate 1, where only a constant stress state is required for a test to be admissible and loading may be coaxial or non-coaxial. Consequently, non-unique failure loci may result depending upon the choice of characterization test.

3. Proportional Loading: Coaxial and Non-Coaxial Deformation

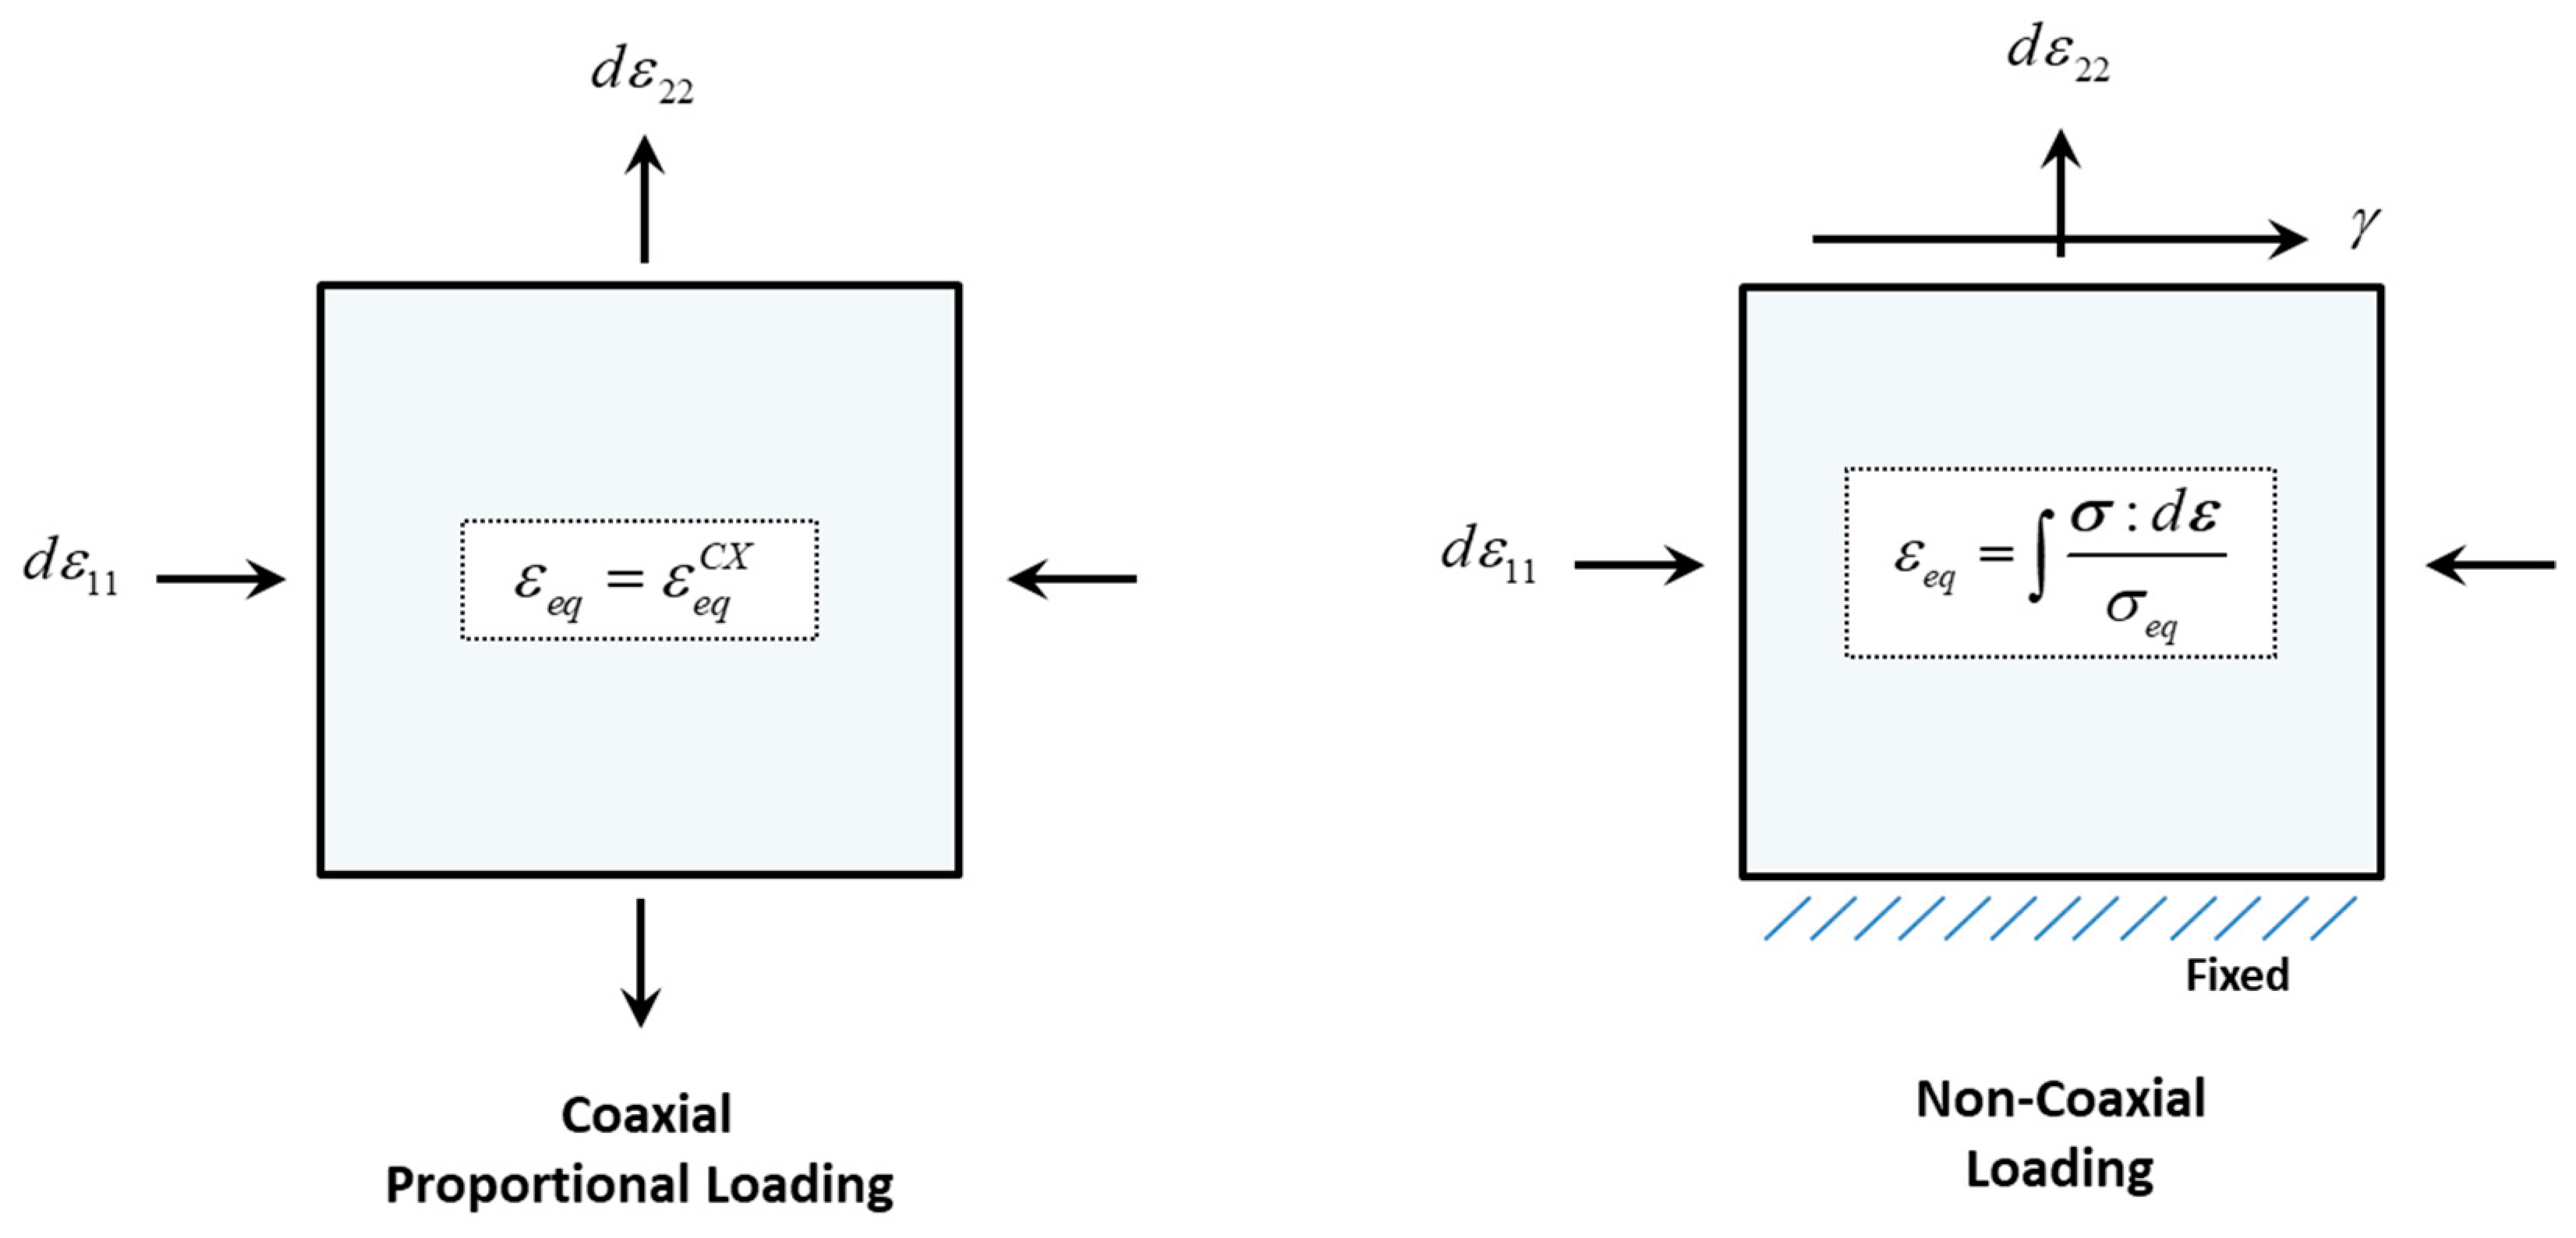
3.1. Definition of Proportional Coaxial Loading and Equivalent Strain

We must first provide a strict definition for the proportional coaxial loading condition that must satisfy three requirements:
  • Monotonic loading is applied in the same direction(s) for the duration of the test.
  • The components of the stress and cumulative strain tensors can be expressed as constant ratios of one another. Consequently, the equivalent plastic strain is proportional to the principal plastic strain.
  • The axes of the principal stress and the cumulative principal strains are aligned (coaxial). The incremental principal strain and the principal stresses are always aligned.
The first requirement is straightforward and is typically satisfied for all fracture characterization tests, such as a notched tension or hydraulic bulge test where there is no reversed loading. The second requirement for proportional loading has been defined in terms of constant ratios of the components of the stress and strain tensors as used by Hillier [47], and not in terms of the principal stress or strain ratios. In coaxial proportional loading, the two methods are identical. In simple shear of a rigid plastic material, the principal strain and stress ratios remain constant, but individual stress and total strain components do not maintain a constant ratio due to the induced rotation of the strain field [17]. A constant principal stress and cumulative strain ratio is a necessary but not sufficient condition to define proportional loading.
As an example, consider a uniaxial tensile test of an anisotropic material where the R−value significantly evolves with deformation as observed in the rare-earth ZEK100 magnesium alloy by Abedini et al. [55]. The characterization of this material would be strictly classified as coaxial but non-proportional since the strain increments in the thickness and width directions are not a constant ratio of the extensional strain increment. However, the stress triaxiality and Lode parameters are constant in the tensile test prior to necking. A constant stress state in terms of these invariants is a necessary but insufficient condition to identify proportional coaxial loading and thus the third requirement given above is needed. Of course, a uniaxial tension test prior to diffuse necking is both coaxial and proportional if the R−value remains constant.
In this study, we will focus upon an isotropic rigid plastic material described by the von Mises constitutive model as closed-form solutions can be obtained for the work-conjugate equivalent plastic strain in proportional loading. The same analysis can be performed with an anisotropic material model but will likely require numerical integration, and the choice of yield function and its calibration can lead to other complexities, especially in shear and plane strain [17,56,57]. The von Mises work-conjugate equivalent strain in proportional coaxial loading can be expressed in terms of the ordered principal strains and will be denoted with a CX superscript to indicate coaxiality as:
ε e q C X = 2 3 ( ε 1 ε 2 ) 2 + ( ε 2 ε 3 ) 2 + ( ε 3 ε 1 ) 2 .
Equation (18) may also be referred to as the “effective strain”, which is used to reflect that the total strains are used, which is a convenient approximation when the strain paths are approximately proportional [58]. Otherwise, for general loading conditions that may be non-coaxial and/or non-proportional, the work-conjugate equivalent plastic strain is integrated according to an incremental plastic work balance as:
ε e q = σ : d ε σ e q = 2 3 d ε : d ε .
Note that the plastic work balance used in Equation (19) assumes that yielding is independent of the hydrostatic stress and the material is incompressible. It is important to note that the equivalent plastic strain obtained within commercial FEA codes, such as LS-DYNA and ABAQUS, are work-conjugate by definition and are integrated from an incremental plastic work balance.
To first demonstrate the importance of coaxiality on the equivalent strain, we will briefly review the issue of non-coaxial loading in shear using the solution of Butcher and Abedini [16] and then extend this analysis to tension–torsion and other non-coaxial loading conditions.

3.2. Shear Loading: Equivalent Stress States with Different Work-Conjugate Equivalent Strains

A simple and pure shear boundary condition is shown in Figure 4. For the pure shear case, the vorticity or spin is zero and loading is strictly proportional unlike simple shear where the material undergoes a deformation-induced rotation. The stress triaxiality is zero for both loading conditions as is the incremental and cumulative principal strain ratio, ε 2 / ε 1 = 1 .
The corresponding von Mises equivalent plastic strains for each shear state in terms of the major principal strain as derived in Butcher and Abedini [17] are not equivalent. The two extreme cases for pure shear loading correspond to either imposing a symmetric deformation gradient with respect to the applied shear deformation, γ , or by imposing equal and opposite extensions within the plane defined by the amount of stretching, λ . In both cases, there is no spin, deformation is proportional and coaxial, and the von Mises equivalent strain takes its familiar form:
F Pure   shear = [ 1 γ / 2 0 γ / 2 1 0 0 0 1 ] ,   F Pure   shear = [ λ 0 0 0 1 / λ 0 0 0 1 ] ,   ε e q Pure   Shear = 2 3 ε 1 .
Conversely, simple shear applies the shear deformation on one boundary while the parallel boundary is fixed, which induces a rotation (spin), and the von Mises equivalent strain can be written as:
F Simple   shear = [ 1 γ 0 0 1 0 0 0 1 ] ,   ε e q Simple   Shear = γ 3 = 2 3 sinh ε 1 .
Only the pure shear loading condition is proportional in Equation (20) with respect to the principal strain whereas the equivalent strain for simple shear in Equation (21) is non-linear and hyperbolic. The hyperbolic nature for simple shear arises from the finite-strain solution for the logarithmic strain tensor that accounts for rotation effects. For finite-strain levels, the relationship between the applied shear, γ , and the principal logarithmic strain is ε 1 = sinh 1 ( γ / 2 ) . Numerical integration of a single element of a rigid plastic von Mises constitutive model in simple shear to large strain levels is consistent with the solution of Equation (21) as shown in Butcher and Abedini [17]. The principal stress and strain directions do not remain aligned in simple shear as shown in Figure 5 and loading is non-coaxial. It can be alternatively described as non-proportional but under a constant stress state. For major principal strains lower than 50%, the difference in the equivalent strain for simple and shear is negligible. From an experimental perspective where shear tests are performed under simple shear conditions, non-coaxiality can become important for the large failure strains in shear. Most importantly, this leads to calibration of a failure locus using a non-proportional shear failure strain, which will then predict failure in pure shear to occur at the same equivalent strain.

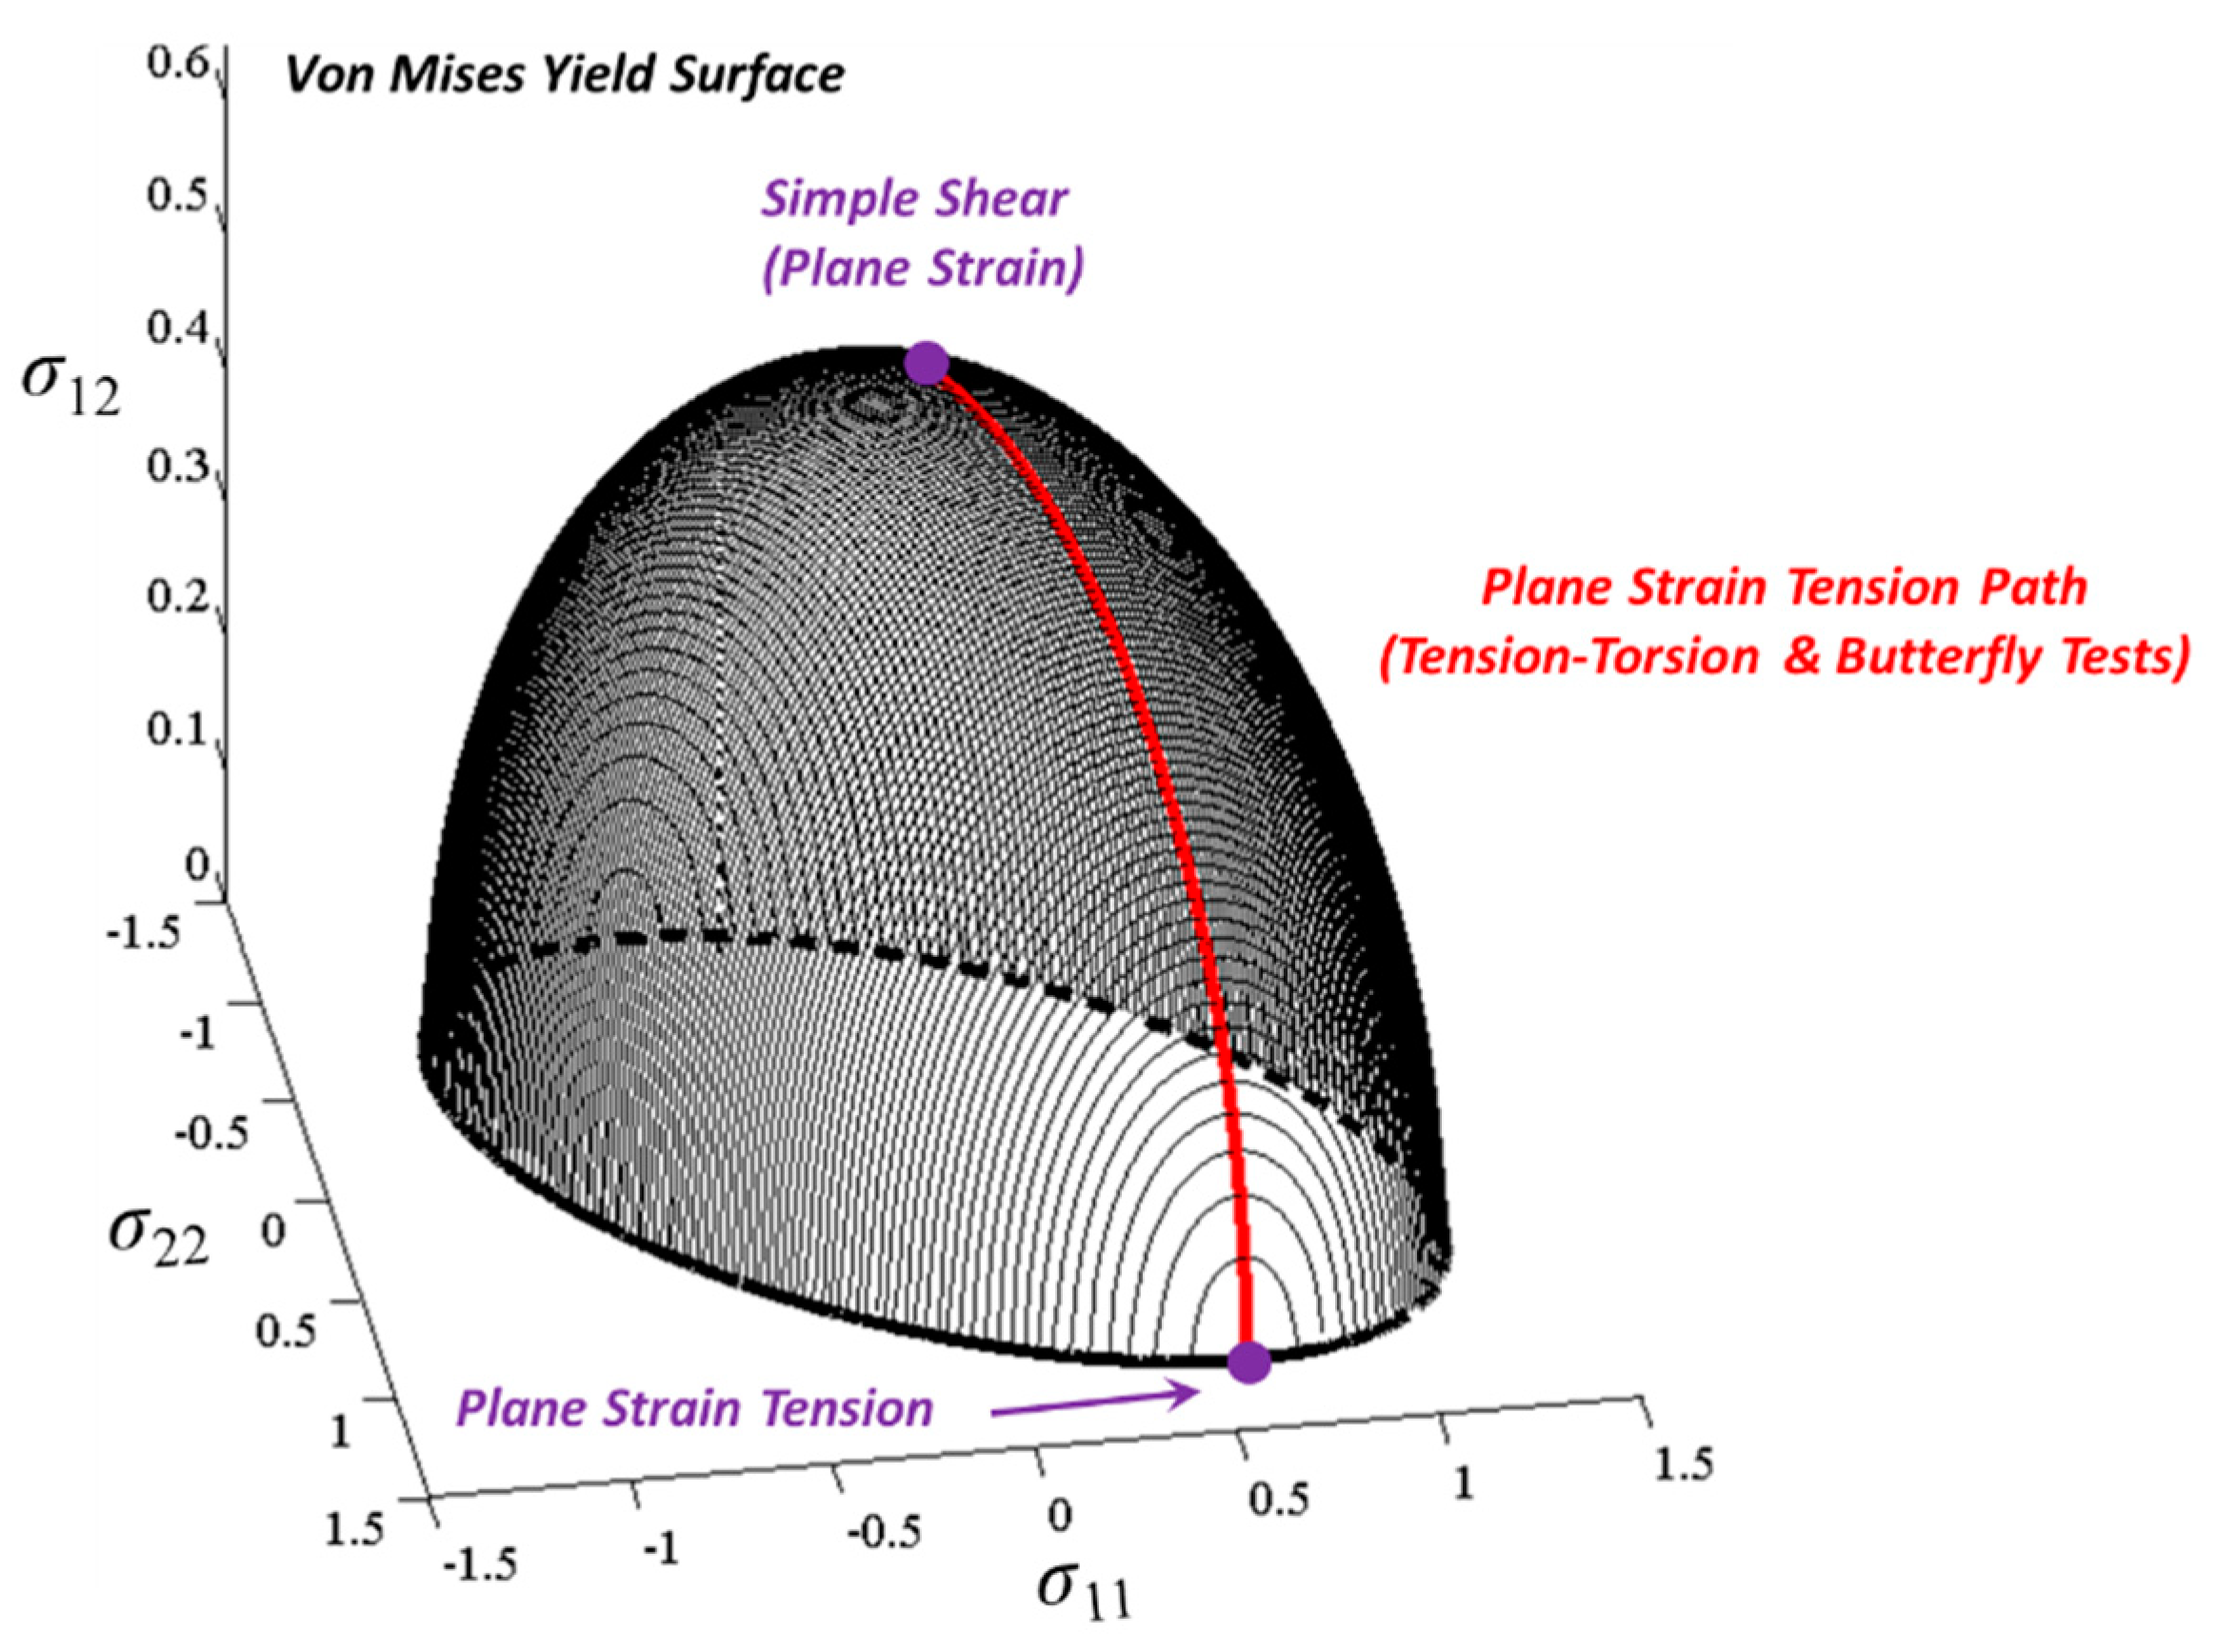
3.3. Mechanics of Combined Plane Strain Tension and Simple Shear in Plane Stress

It is worthwhile to now investigate the mechanics of constant tension–torsion and butterfly tests for fracture characterization, which use shear and tensile loads to change the stress triaxiality under plane stress conditions (Figure 6). Experimentally, the equivalent strains obtained in these tests using DIC are expected to be non-linearly related to the principal strains depending on the severity of the applied shear. More importantly, as the experimental CTT results of Scales et al. [26] suggest, should a failure locus calibrated using these tests from simple shear to plane strain tension be different than if a series of proportional coaxial tests were performed?
The stress states obtained with CTT tests using hollow cylindrical tubes as done by Haltom et al. [25], Papasidero et al. [11,12], and Scales et al. [26] are non-coaxial since deformation is one of simple shear (torsion) with a superimposed plane strain extension. Since these experiments involve the tensile loading of tubes with a reduced thickness section, the tensile loading is approximately a plane strain extension where the circumferential strain is approximately zero. A range of stress triaxialities from shear to plane strain tension can be obtained by controlling the ratio of applied torsion and extension.
Similarly, the in-plane butterfly test geometries of Mohr and Henn [9] and Dunand and Mohr [6] as well as the in-plane Arcan test geometry [22] provide the same range of stress states as the tension–torsion tests. In these specimens, the thickness in the gage region is reduced and the sample position is rotated from 0° to 90° so that 0° corresponds to simple shear whereas 90° corresponds to plane strain tension. To determine the loading angle to obtain a target stress triaxiality, Mohr and Henn [9] derived a relation based upon the gage region being in a state of simultaneous plane strain and plane stress. If it was possible to create a characterization test that provided a pure shear with a superimposed tension until fracture, the stress state would be coaxial as shown in Figure 7 but experimentally, we are imposing a simple shear that leads to a non-coaxial stress state.
To understand the influence of non-coaxiality in combined shear and tensile loading in plane stress states, the tests are idealized as a superposition of an applied simple shear deformation in the 1–2 plane with a magnitude of γ, and a plane strain extension with a magnitude, λ, applied in the 2-direction as shown for the element in Figure 8.
The deformation gradient for this combined loading condition and the deformation ratio of the applied shear to the applied stretch, χ, can be written as:
F = [ 1 γ 0 0 λ 0 0 0 1 / λ ] ,   χ = γ λ ,
where the initial configuration corresponds to γ = 0 and λ = 1 . The velocity gradient, L, vorticity, W, and strain rate tensor, D, are readily obtained as:
L = F ˙ · F 1 = [ 0 d γ / λ 0 0 d λ / λ 0 0 0 d λ / λ ] ,
W = 1 2 ( L L T ) = [ 0 d γ / 2 λ 0 d γ / 2 λ 0 0 0 0 0 ] ,
D = 1 2 ( L + L T ) = [ 0 d γ / 2 λ 0 d γ / 2 λ d λ / λ 0 0 0 d λ / λ ] .
The material is assumed to be rigid plastic so that D is equivalent to the plastic strain rate tensor, Dp. The Eulerian logarithmic strain tensor can be obtained from the left Cauchy–Green tensor, B, that is related to the left stretch tensor, V, as B = F · F T = V 2 so that:
ε = ln V = 1 2 ln ( B ) .
The principal logarithmic strains are the eigenvalues of Equation (26) with corresponding values of:
ε 1 = 1 2 ln ( A + B ) ,   ε 2 = 1 2 ln ( A B   ) ,   ε 3 = 1 2 ln ( 1 λ 2 ) ,   A = λ 2   + γ 2 +   1 2 ,   B = 1 2 ( λ 2 + γ 2 ) 2   2 λ 2 +   2 γ 2   +   1 .
The ordering of ε 2 and ε 3 may change depending on the loading condition and are stated in Equation (27) in descending order for plane strain tension. The stress state in combined tension and shear loading as in the CTT test is effectively a superposition of the stress states and follows the experimental procedure of Scales et al. [26] who monitored the applied torsion and extension to maintain a constant stress state. The resulting stress tensor is:
σ = σ shear + σ tension = [ σ 11 0 0 0 σ 22 0 0 0 0 ] + [ 0 σ 12 0 σ 12 0 0 0 0 0 ] = [ σ 11 σ 12 0 σ 12 σ 22 0 0 0 0 ] ,
where the stress state can be expressed in terms of two constant stress ratios for tension and shear with respect to the stress in the extension direction, σ 22 , as:
α = σ 11 σ 22 ,
β = σ 12 σ 22 .
Note that the rigid plastic assumption prevents the development of significant normal stresses in simple shear [17]. The incremental equivalent plastic strain, d ε e q , can be obtained from the plastic work balance for plane stress with σ 33 = 0 as a function of the extensional strain increment, D22:
d ε e q D 22 = ( 1 + α ρ + 2 β ω ) ( σ 22 σ e q ) ,
where σ e q is the equivalent stress for an arbitrary yield function, and ρ and ω are the applied plastic strain ratios for normal and shear loading:
ρ = D 11 D 22 ,
ω = D 12 D 22 .
For CTT tests, substitution of the strain rate components of D in Equation (25) into Equation (31) leads to ρ = 0 , and the equivalent strain ratio can be expressed in terms of the applied deformation ratio, d η , from the experiments as:
d ε e q D 22 = ( 1 + β d η ) ( σ 22 σ e q ) ,
d η = d γ d λ .
For an arbitrary constitutive model, the stress state will have to be identified by performing a numerical stress integration defined by Equations (22)–(31). However, for a von Mises material, the yield function and equivalent strain have simple analytical expressions in terms of the applied stress and strain ratios as:
σ e q v m σ 22 = α 2 α + 1 + 3 β 2 ,
d ε e q v m D 22 = 2 3 1 + ρ + ρ 2 + ω 2 .
The normal stress ratio for plane strain tension of a pressure-independent material is α = 1/2 as derived in Butcher and Abedini [57] so it is straightforward to obtain:
σ e q v m σ 22 = 3 4 + 3 β 2 ,
d ε e q v m D 22 = 2 3 1 + ( d η ) 2 4 .
Substitution of the equivalent stress and equivalent strain ratios into Equation (31) leads to direct relationships between the applied shear stress, strain, and deformation ratios:
ω = 2 β = D 12 D 22 = 2 σ 12 σ 22 ,
d η = d γ d λ = 4 β .
Assuming the normal and shear stress ratios are held constant to provide a constant stress triaxiality during the test, the equivalent plastic strain increment is a linear function of the extensional strain increment, D22:
d ε e q v m = 2 3 1 + 4 β 2 D 22 ,
where the correct incremental forms for the equivalent plastic strain for simple shear ( β ) and plane strain tension ( β = 0 ) are recovered as:
d ε e q v m ( β ) = 2 3 ( 2 β D 22 ) = 2 3 D 12 = d γ 3 ,   d ε e q v m ( β = 0 ) = 2 3 D 22 .
Recognizing that D 22 = d λ / λ from Equation (25), the cumulative work-conjugate equivalent strain can be obtained by integrating Equation (42) in terms of the applied plane strain extension as:
ε e q v m = ( 2 3 1 + 4 β 2 ) d λ λ = 2 3 1 + 4 β 2 ln ( λ ) .
Consequently, the von Mises equivalent strain can be determined for a given stress triaxiality and is controlled by either β or , for a specified extension, λ. In the tension–torsion or butterfly tests, it would be possible to obtain these measures from the DIC software to directly compute the principal strains in Equation (27) and more importantly, the work-conjugate equivalent strain using Equation (44).
It is essential to recognize that the incremental equivalent strain in Equation (42) cannot be directly integrated in terms of D22 for a general tension–torsion type test because the imposed simple shear induces the non-zero vorticity in Equation (24). The rate of the deformation tensor, D , is the objective co-rotational rate of the logarithmic strain and must be integrated using the logarithmic spin tensor, Ω log , within a rate-form constitutive framework [59,60,61]. The logarithmic rate is the only objective rate that can integrate the logarithmic strain to the exact solution for finite strains and is also work-conjugate with the Cauchy stress [59,60]. Assuming mid-point integration, the cumulative logarithmic strain tensor must be integrated in a hypo-plastic framework as:
ε n + 1 = ε n + Δ ε = ε n + D n + 1 / 2 + Ω n + 1 / 2 log · ε n ε n · Ω n + 1 / 2 log ,
with the general solution for the logarithmic spin tensor, Ω log , for the numerical implementation provided in Bruhns et al. [61]. The cumulative logarithmic strain tensor will be incorrectly integrated with commercial finite-element codes, such as Abaqus and LS-DYNA, that employ the Jaumann rate by default and the principal stress and strain directions will be erroneous at large strains. Consequently, a comparison of the logarithmic surface strains in an FEA model with those obtained using digital image correlation may be in conflict due to the choice of spin tensor used in the strain integration.
The stress triaxiality of Equation (3) can be determined using the shear stress ratio or from the applied loading rate parameter as:
T = 1 3 1 1 + 4 β 2 ,
and the non-coaxial “path” traced out by the triaxialities obtained in tension–torsion and butterfly tests is visualized in Figure 9 for the von Mises yield criterion where proportional coaxial loading conditions are along the meridian of the yield surface where there is no applied shear stress.
In the characterization experiments to identify the proportional failure locus, the local failure strains are typically measured using the principal strains as done in Mohr and Henn [9] and then converted to an equivalent strain assuming coaxial loading as done by Scales et al. [26]. To demonstrate the influence of non-coaxiality, the evolution of the equivalent strain using Equation (44) is presented in Figure 10 for stress triaxialities from simple shear to plane strain tension until a major principal strain of 200%. For simple shear, Equation (44) reverts to its hyperbolic form given in Equation (21). As the stress state approaches plane strain tension, the equivalent strain becomes linear with the principal strain and coaxial loading is achieved. The importance of accounting for non-coaxiality to determine the equivalent strain experimentally, such as using DIC, depends upon the stress state and the ductility of the material. Non-coaxiality effects on the equivalent strain are secondary or negligible when the major strain is lower than 50%. Material anisotropy and deformation-induced anisotropy may also influence the equivalent strain, which has been neglected in the present analysis.
As stress state-dependent fracture characterization is predominantly used for high strength, low ductility alloys, such as AA2024-T351 aluminum used by Bao and Wierzbicki [1] and later by Papasidero et al. [12], employing tension–torsion tests, the influence of non-coaxiality on determining the equivalent strain from the experimental strains is marginal. However, when the more ductile AA6061-T6 was considered in the CTT tests of Haltom et al. [25] and Scales et al. [26], the influence of non-coaxiality became more significant.

3.4. Application of Non-Coaxial Equivalent Strain to the Tension–Torsion Results of Haltom et al. (2013) and Scales et al. (2016) for AA6061-T6

Haltom et al. [25] developed the novel experimental methodology for the constant tension–torsion tests and used strain-grid measurements to obtain the failure strains. It was observed that this experimental failure locus did not show the typical “cusp” or discontinuity found in MMC models between shear and uniaxial tension. Rather, the failure strain decreased with the stress triaxiality from shear to plane strain tension similar to a Johnson–Cook [27] failure locus. The experiments of Haltom et al. [25] were then revisited by Scales et al. [26] for the same alloy but with the aid of DIC strain measurement, where even higher strains were reported but with the same trend for the failure locus. These two companion studies were comprehensive experimental investigations and no inverse finite-element modelling was performed to analyze the tests and construct the failure locus. Haltom et al. [25] computed the equivalent plastic strains from the principal strains using a coaxial assumption while noting that it may not be the optimal choice of strain measure for the aluminum alloy, and the study of Scales et al. [26] followed suit. In this case, the equivalent strain of Haltom et al. [25] and Scales et al. [26] should be interpreted as an effective strain that was intentionally selected to evaluate the experiment results and investigate the shape of the fracture locus. It is also noted that a non-quadratic anisotropic yield function would be preferable for the aluminum tubes at the cost of additional complexity in the analysis of the experiments. The principal strain and stress directions in the tubes will also vary with the stress state and could influence the fracture response but is anticipated to be a second-order effect.
Fortunately, both studies provided detailed test data on the experimental stress triaxiality and the equivalent strain. By calculating the major principal strain from the reported coaxial equivalent strains reported in the experiments, the work-conjugate equivalent strain can be determined using the analysis in Section 3.3 for a given stress triaxiality. Keeping with the assumption that AA6061-T6 obeys the von Mises yield criterion, the resulting work conjugate equivalent strain and the coaxial equivalent strain for both studies are shown in Figure 11 and is detailed for the Scales et al. [26] data in Table 1.
The adjustment in the equivalent strain for non-coaxiality leads to a dramatic increase at stress states close to simple shear before converging to the coaxial solution as the triaxiality approaches plane strain tension. The general trend for the fracture locus is unchanged, which still follows an exponential relationship between the failure strain and triaxiality from shear to plane strain tension. In light of these results, where the equivalent strains in shear-dominant stress states are now even higher than previously reported, there is additional evidence to support the observations of Ghahremaninezhad and Ravi-Chandar [62] and Scales et al. [26] that there is not strong evidence of a cusp or bifurcation in the fracture locus at uniaxial tension and that shear failure strains can be very large. In light of these results, the lower shear failure strains in shear reported by Beese et al. [46] for AA6061-T6 sheet could be due to premature edge cracking in the shear tests or due to DIC gauge length issues reported by Rahmaan et al. [16].

4. Dependence of Failure Loci on the Characterization Tests

It can be argued that the influence of non-coaxiality is trivial since many practical sheet metals used for structural applications will have relatively low ductility so that a coaxial approximation is acceptable. However, it is the recognition that non-coaxial stress states exist and are admissible in the framework that leads to larger implications upon the general methodology for failure characterization using stress invariants. For materials with high ductility, the divergence of the coaxial and non-coaxial equivalent strains for a given principal strain demonstrates that there is a fundamental inconsistency in the framework and the measured failure loci may not be unique. In other words, the plane stress failure locus for a general material must in fact be a surface. Depending upon the choice of characterization tests, a “path” is traced out in the stress space that may be entirely coaxial, partially coaxial, or entirely non-coaxial. It is worth exploring this idea considering that the characterization tests for combined tension and shear of sheet metals involve simple shear. In essence, the stress state is admissible since it remains constant but the strain history, and thus the microstructure of a material, will not deform in the same manner or be a linearly related to the applied stress state. The choice of characterization tests used to calibrate the failure locus, whether they be coaxial, non-coaxial, or a combination, will be applied to all other stress states with the same triaxiality.

4.1. Construction of a Coaxial Failure Locus Based Upon the Major Principal Strain

The development of so-called “path-dependent” failure loci due to non-coaxiality can be demonstrated with a simple thought experiment where we can theoretically perform a characterization test in any plane stress state. For simplicity, the constitutive behavior of the ductile sheet material is again assumed to be rigid plastic and obey the von Mises yield criterion. Only plane stress states are considered since the same non-coaxial effects follow for three-dimensional stress states. To maintain consistency with an MMC-type framework, no information about the fracture mechanism is required but it is assumed to be a ductile-type fracture. The continuum or macroscopic fracture strains of the material are measured using DIC and are a function of the applied strain state. In the MMC-based framework, the influence of microstructural evolution and any internal damage is independent of the plasticity model.
In this virtual laboratory, a series of proportional coaxial tests from pure shear to equal-biaxial tension are conducted. The failure metric is taken as the major principal strain since it can be experimentally measured using DIC along with the minor strain to obtain the principal strain path. In general, the equivalent strain is not a measured quantity but is calculated based upon the assumed yield function and the principal strain. For an assumed constitutive model, the constant linear strain path in terms of the principal strains is converted to a constant stress triaxiality and the major principal strain is converted to a work-conjugate equivalent strain. This is the common experimental methodology in proportional failure locus characterization and from its construction, it can be viewed as a failure criterion based upon a critical principal strain that varies with the stress state as ε 1 f ( T ) . It can then be converted to an equivalent strain for use in finite-element codes where it can be coupled with an assumed damage law to generalize it for non-proportional loading.
We must now assume a representative coaxial failure locus for our model material in terms of the principal strain and triaxiality. The assumed shape of the major strain failure locus will influence the subsequent results when converted to equivalent strains, such as if we assume a cusp exists at uniaxial tension. To minimize bias in this regard, we elected to base the failure locus of the model material on the results of Scales et al. [26] where the variation in the failure strain is exponential without a sharp cusp at uniaxial tension as shown in Figure 12. With an assumed hardening law and yield function, Figure 12 could also be converted to a failure locus in terms of the principal stresses as in the MC description of Equation (10) or in terms of the principal stress and stress triaxiality. What is important here is that it is not expressed in terms of the equivalent strain or equivalent stress, but as the major principal strain, which is the measured quantity in the tests.
A phenomenological form for the variation in the coaxial equivalent failure strain with the stress state was adopted from Bai and Wierzbicki [4] that has five parameters, c1c5. This choice of phenomenological form for the failure locus is arbitrary and an HC description could also have been used. For a given normal stress ratio, α, both T, and θ ¯ L , are readily obtained using Equation (3) and Equation (7) and the principal failure strain can be computed as:
ε 1 f ( α ) = c 2 ( 2 α 2 α 2 α + 1 ) [ c 3 + 3 2 3 ( c x c 3 ) ( sec ( π θ ¯ L ( α ) 6 ) 1 ) ] × ( 1 + c 1 2 3 cos ( π θ ¯ L ( α ) 6 ) + c 1 [ T ( α ) + 1 3 sin ( π θ ¯ L ( α ) 6 ) ] ) 1 c 5 c x = { 1 θ ¯ L 0 c 4 θ ¯ L < 0 .
The coefficients for the principal strain failure locus of the model material are c1 = 0.687; c2 = 1.10; c3 = 0.998; c4 = 0.926; and c5 = 0.239.

4.2. Generation of Failure Loci Based Upon the Equivalent Plastic Strain

The experimental coaxial failure locus in terms of the major principal strain can now be converted to an equivalent strain along different paths based upon the choice of characterization tests. We will consider five paths as shown in Figure 13 that are defined as:
1
Coaxial path from pure shear to equal biaxial tension;
2
Conventional path from simple shear to uniaxial tension and then equal biaxial tension;
3
Tension–torsion path from simple shear to plane strain tension and then equal biaxial tension;
4
Biaxial path from simple shear to equal biaxial tension; and
5
Shear path from pure shear to simple shear where the stress triaxiality remains zero.
The so-called “conventional path” refers to the typical path traced out using common experimental strategies that include a simple shear test along with a variety of tensile-based tests that are coaxial, such as central hole tension, standard uniaxial tensile, notched tension, and biaxial punch tests [1,5,13,43,63]. The tension–torsion path corresponds to using butterfly or tension–torsion tests from simple shear to plane strain tension followed by the addition of a biaxial punch or bulge test. The other two paths for simple shear to pure shear and from simple shear to biaxial tension are fictitious paths that do not currently have characterization tests for sheet metals, and may not be possible to achieve experimentally, but could potentially arise in a forming operation and are considered for completeness.
Following the procedure of Section 3.3 on the mechanics of tension–torsion tests, the relationships between the normal and shear stress and strain ratios along with the incremental equivalent strain ratio were determined and are tabulated in Table 2. Additional details on the deformation gradients and principal strains for the different loading paths are provided in the Appendix.
It is of interest to first analyze the coaxial, conventional, and tension–torsion paths, and the resulting failure loci in terms of the equivalent strain and triaxiality are shown in Figure 14. Remarkably, the three failure loci are not unique but a bifurcation or cusp at uniaxial tension appears whereas the equivalent failure strains are indeed higher along the tension–torsion path. Conventional test methods calibrate the failure locus using simple shear and tensile-type tests so the appearance of a cusp can be directly attributed to non-coaxiality in this example. This result was not anticipated and would provide some supporting evidence to the selection of the initial MMC formulation of Bai and Wierzbicki [3] where a cusp occurs in uniaxial tension due to the discontinuity in the MC criterion. Experimentally, a cusp could also occur due to the failure mechanism being markedly different in shear-dominant loadings or potentially due to errors in the specimen geometry, such as edge cracking, that would lead to under-reporting of the failure strains. The measured shear failure strain can also be very sensitive to the gage length used in the measurement during collapse of the shear band into a micro-shear band prior to fracture [16].
Perhaps most importantly, these results demonstrate that although the stress triaxiality or the principal stress ratio can uniquely define the plane stress state, it cannot differentiate whether the equivalent strain was accumulated in coaxial or non-coaxial conditions despite the stress state remaining constant. The choice of characterization tests used to determine the failure locus may not be unique and may help explain the observations of Scales et al. [26], who employed CTT in contrast to Beese et al. [46]. The failure strains are higher in CTT over the same range of triaxialities and no cusp is observed at uniaxial tension.

4.3. Characterization of the Plane Stress State for Coaxial and Non-Coaxial Proportional Loading

It appears that another parameter aside from the stress triaxiality is required to characterize general plane stress loading conditions. The severity of the applied shear stress component should be considered along with an invariant measure, such as the stress triaxiality or Lode parameter. For a general plane stress yield surface, the stress state with components σ 11 , σ 22 , and σ 12 can be alternatively defined in a spherical coordinate system, where the equivalent stress, σ e q ( σ ) , is the radius and with two angles, ψ S and ϕ N , to define the shear and normal stress components. The stress components are:
σ 12 = σ e q ( σ ) cos ψ S ,   σ 11 = σ e q ( σ ) cos ϕ N sin ψ S ,   σ 22 = σ e q ( σ ) sin ϕ N sin ψ S ,
and the angles to define the stress state can be readily obtained as:
ϕ N = atan 2 ( σ 22 , σ 11 ) ,   cos ψ S = | σ 12 | σ e q ( σ ) ,
where positive and negative shears are treated equally here. The shear angle can be normalized for a specific yield function by introducing a shear angle parameter, ξ , that ranges from 0 to 1 with a normalized shear angle, ψ ¯ , from 90° to 0° as:
ζ = cos ( ψ ¯ S ) = cos ( κ ψ S ) ,   κ = σ e q ( σ 12 ) | σ 12 | ,
where κ is a constant that is specific to the yield criterion, with κ = 3 for the von Mises yield criterion. To maintain familiarity with conventional descriptions of the failure locus, the stress triaxiality, T, will be used along with the shear angle parameter, ζ , to define the plane stress state. To describe an anisotropic failure locus, it may be preferable to instead use the normal stress angle, ϕ N, since this measure can differentiate between rolling and transverse directions whereas the stress triaxiality cannot.
The plane stress state could have been defined in terms of the two principal stresses or as a single principal stress ratio. However, the use of the principal stresses has the shear stress embedded within whereas the spherical representation allows for the separation of the normal and applied shear stresses. In this study, a coaxial stress state lies on the meridian and only contains normal stresses. A principal stress-based representation would be similar to the results for the stress triaxiality and equivalent strain in Figure 14. The stress triaxiality is also a function of the principal stress ratio and thus the fracture loci for the different paths would be projected into the same plane as in Figure 14.
Specific to this study is that all shear stress components are the result of a superimposed simple shear that is inherently non-coaxial, but coaxial shear stress components must also be admissible. For example, a coordinate transformation of a uniaxial tensile test to a new coordinate system defined by an angle, θ, using a rotation matrix, R, will create a coaxial shear stress from σ θ = R σ R T . It is unclear what is the best strategy to differentiate between coaxial and non-coaxial shear stress components considering that experimental or numerical failure data is required to first characterize the failure surface of a material in terms of the equivalent strain, stress triaxiality, and shear parameter. One possibility could be to modify Equation (50) by introducing a second parameter, fCX, as:
ζ = cos ( ψ ¯ S ) f C X ,
that could be a function of the deformation gradient based on a symmetry test to detect coaxiality or taken as a function of the principal stress and strain directions as:
f C X ( θ σ ϕ ε ) = { 0 θ σ = ϕ ε 1 θ σ ϕ ε ,   θ σ ϕ ε = tan 1 ( 2 σ 12 σ 11 σ 22 ) tan 1 ( 2 ε 12 ε 11 ε 22 ) ,
where the divergence from coaxiality could be tracked. The five plane stress paths described in Figure 13 and the resulting failure loci are now presented in Figure 15 in the representation using T and ζ . Each path traces out a different line along the unknown failure surface and can then be projected into a two-dimensional representation in terms of the stress triaxiality except for the path from simple to pure shear where the triaxiality is constant. Theoretically, there are infinite paths that can be traversed that will construct a failure surface in terms of the equivalent strain even though the initial failure locus was defined in terms of a critical principal strain criterion obtained under coaxial proportional loading.
These results are interesting due to their implications on the phenomenological MMC-type framework where various levels of non-coaxiality are used in the characterization tests to calibrate a failure model that is only strictly valid for coaxial proportional loading. Issues of non-uniqueness revealed here demonstrate that the fundamental description of the stress state using only the triaxiality appears to be insufficient. It was unexpected that the coaxial principal strain failure locus of the model material in plane stress, ε 1 f ( T ) , transforms to a failure surface in terms of the equivalent strain or stress. A damage indicator model that is a function of the triaxiality and equivalent strain, D ( T , ε e q ) , as currently used throughout the literature, would be biased on the path used for its calibration and not capture the failure surface created by admitting non-coaxial stress states. Conversely, a damage indicator in terms of the principal strain, D ( T , ε 1 ) , as used by Mohr and Henn [9] for butterfly tests, would lead to different equivalent failure strains depending on the path.
The choice to use a principal strain-based failure criterion was to be consistent with the steps involved with experimental fracture characterization in which the strain path is proportional, and the major and minor principal strains are measured in different tests. The principal strain-based failure locus is then converted to an equivalent strain representation under proportional coaxial loading, which may or may not be appropriate based on the choice of characterization test. If the failure locus was instead assumed be a unique function between the equivalent strain and the stress triaxiality, then its decomposition into principal strains would result in a surface in terms of the principal strains and the severity of the applied simple shear. Certainly, more experimental data is required in combined tension–torsion tests and to investigate the choice of failure locus whether it be a function of the stress triaxiality, major principal stresses, or plastic strain or work.
It is also important to note that there is no physical fracture mechanism assumed in this simple thought experiment and it is possible that real materials will have a more complex fracture response or for low ductility alloys may not show any sensitivity to different non-coaxial stress paths. Nevertheless, the underlying methodology behind MMC-type failure models may require modification to account for general plane stress states where the model can then be reduced to a simpler form if the experiment data warrants. Moreover, the test data used to calibrate current MMC-type failure models can lead to different failure loci especially when CTT tests are used compared to in-plane tests of sheet materials. The CTT test results of Haltom et al. [25] and Scales et al. [26] were essential in providing the experimental evidence to identify the potential for the non-uniqueness of failure loci. Alternatively, MMC-type models could be restricted to only consider proportional coaxial loading since they cannot resolve non-coaxial states. In this case, the use of simple shear or CTT tests would be excluded for ductile materials.

5. Onset of Diffuse Necking in Combined Tensile and Shear Stress States

For a material with low ductility, the influence of non-coaxiality is negligible and the plane stress fracture locus would appear to be unique in terms of the equivalent strain and triaxiality. In this case, should there be any expected difference between the failure strain obtained in a CTT tension–torsion test compared to an in-plane test for the same stress triaxiality?
It is difficult to answer due to the complexities of the fracture of real materials and that analytical approaches generally require an assumed fracture criterion as done in Section 4 in terms of the principal strain. Fortunately, we can investigate plane stress failure in shear and tensile states from an analysis of the plastic work rate required for the onset of diffuse necking using the relatively overlooked solution of Hillier [47]. Hillier [47] derived a general criterion for the onset of diffuse necking for arbitrary stress states, including combined tension and shear for tubular materials. Hillier’s solution was derived from the analysis of the plastic work rate and was found to be a 3-D generalization of the instability criteria of Considère [64], Swift [65], and Zener-Holloman [66] that is also valid in shear stress states. Hillier [47] then expressed this inequality in an alternate form based on the hardening rate and the parameter z that is the critical sub-tangent to the work hardening curve at the onset of instability when:
1 σ ¯ d σ ¯ d ε e q 1 z .
The solution for the critical sub-tangent for CTT of a von Mises material is a function of the applied normal and shear stress ratios:
z = 4 ( 1 α + α 2 + 3 β 2 ) 3 2 4 + 4 α 3 3 α 2 3 α + 3 β 2 ( α + 1 ) .
Equation (54) corresponds to the onset of diffuse necking and the start of localization when: Both the applied normal and shear loads reach a maximum, one load is constant while the other reaches a maximum or when both loads are constant. The larger the value of the subtangent, z, the higher the strain to reach localization. If a power law hardening model was assumed with σ ¯ = K ε e q n , then the equivalent strain at localization becomes a multiple of the hardening exponent as ε e q L = z ( σ i j ) n where z = 1 for uniaxial tension.
According to Equation (54), the onset of diffuse necking for general plane stress states is a surface due to its dependence upon both the normal and shear stress ratios. Hillier [47] noted that the addition of a shear stress appeared to stabilize the material to delay the onset of localization. For pure shear conditions, α = 1 , β = 0 , or for simple shear, β α , then the localization strain is infinite for a power law hardening material and is consistent with the physics of shear testing where a tensile instability cannot occur. We can re-cast the solution in terms of the stress triaxiality to obtain loci for diffuse necking in different paths and the equivalent strain corresponds to the termination of proportional loading conditions. Acute localization under plane stress would follow along with a change in the stress and strain state and a transition towards plane strain prior to fracture.
The evolution of the critical sub-tangent, and thus the equivalent failure strain for both coaxial and tension–torsion paths are shown in Figure 16 along with an application to a model material based upon a DP980 steel in Figure 17. As expected from the previous analysis on coaxiality in Figure 17, the equivalent strains at the onset of diffuse necking in CTT tension–torsion are higher than for in-plane loading, which is supported by the experimental observations of Scales et al. [26]. Furthermore, the onset of localization coincides with a change in the stress state and its evolution towards plane strain so the CTT tests would be expected to follow a more proportional path than a tensile-based test with the same triaxiality. This difference is clearly illustrated for uniaxial tension and if a triaxiality of 1/3 is obtained using tension–torsion or uniaxial tension.
Although the solution of Equation (54) is only for diffuse necking, it does indicate that the termination of proportional loading conditions due to the onset of localization would be a surface in-plane stress and has an explicit dependence upon the applied shear stress. It cannot tell us if the same equivalent strain will be reached at fracture, but it does indicate that a different stress and strain history would be experienced in a tension–torsion test if diffuse necking occurs prior to fracture. If the material fracture mechanism is sensitive to the stress state, then it can be anticipated that a difference would be observed in the failure strains. If the surface is expressed in terms of the equivalent strain and stress triaxiality, as shown in Figure 18, the lowest strains occur in coaxial loading where there is no shear to mitigate the tensile instability. This is in general agreement with the case study of Section 3.4 where a plane stress failure surface was also obtained.

6. Discussion and Implications on Phenomenological Fracture Characterization

The goal of the present study was to systematically analyze the underlying mechanics and choice of characterization tests for combined tension and shear within the context of a phenomenological modelling strategy where the failure strain is a function of the stress triaxiality in plane stress conditions. It was demonstrated that the influence of non-coaxiality may have a significant impact on the analysis of the experiments when the stress state is misidentified as coaxial. The inability of the stress triaxiality to differentiate between a coaxial or non-coaxial loading condition was highlighted, where the principal failure strain can be transformed into various failure loci in terms of the equivalent strain for the same stress triaxiality. Furthermore, the divergence in the failure strains obtained using in-plane and tension–torsion tests is not to be unexpected but could be due to non-coaxiality and/or the suppression of diffuse necking to higher strain levels. Depending on the path defined by the characterization tests, the plane stress failure locus in terms of the equivalent strain and triaxiality may show the formation of a cusp or bifurcation at uniaxial tension.
The results of this study are in broad agreement with that of Scales et al. [26] that fracture characterization in CTT can provide higher failure strains across the range of stress states and that a cusp is not observed along the tension–torsion path at a triaxiality of 1/3 corresponding to uniaxial tension. However, a cusp can be introduced as an artefact of the MMC model where the stress-based fracture locus has a bifurcation at uniaxial tension due to its underlying Mohr–Coulomb foundation as shown in Figure 1. It was also found that a cusp could be formed due to calibration of the fracture loci using both coaxial and non-coaxial tests, such as simple shear and then uniaxial tension-based tests. The dependence of the fracture mechanism of a material to the Lode parameter may also influence whether a cusp will form and its severity.
It is important to state that the fundamental analysis used in this study has focused upon an idealized isotropic rigid plastic material with the plane stress assumption to evaluate the underlying mechanics and methodologies for failure characterization from a theoretical perspective. Real materials will have defects, anisotropy, and potentially multiple fracture mechanisms that can be sensitive to the stress state that may disagree with the presented results. The solutions presented herein are intended to assist in the development and refinement of failure characterization and damage-based models.
Non-coaxial stress states can be investigated numerically within a micromechanics framework using voided unit cells [7,24,67,68,69,70,71]. The evolution of a material microstructure containing voids and particles will be different under coaxial and non-coaxial loading with the same stress triaxiality. Figure 19 shows how an initially spherical void could evolve under coaxial and non-coaxial deformations that provide the same stress triaxiality, but the failure strains are expected to be different. Dunand and Mohr [7] reported that the failure strains obtained from the loading of an isotropic unit cell with an initially spherical void in radial (coaxial) and co-rotational (non-coaxial) were indeed different at low stress triaxialities but similar otherwise. At low stress triaxialities, the non-coaxial stress states had lower failure strains due to the severe shape change and induced anisotropy whereas the coaxial loaded voids would want to elongate and close up. Although MMC-type damage models do not account for the microstructure or its evolution, the experimental fracture strains can be expected to have a dependence upon whether loading is coaxial or non-coaxial. Consequently, it is possible that a non-unique experimental fracture locus could be obtained experimentally if the failure strain is expressed as a function of the triaxiality. Future work is required to evaluate the development of plane stress fracture loci under coaxial and non-coaxial loading with the same triaxiality from both a numerical and experimental perspective.

7. Conclusions

The primary conclusions from this study are as follows:
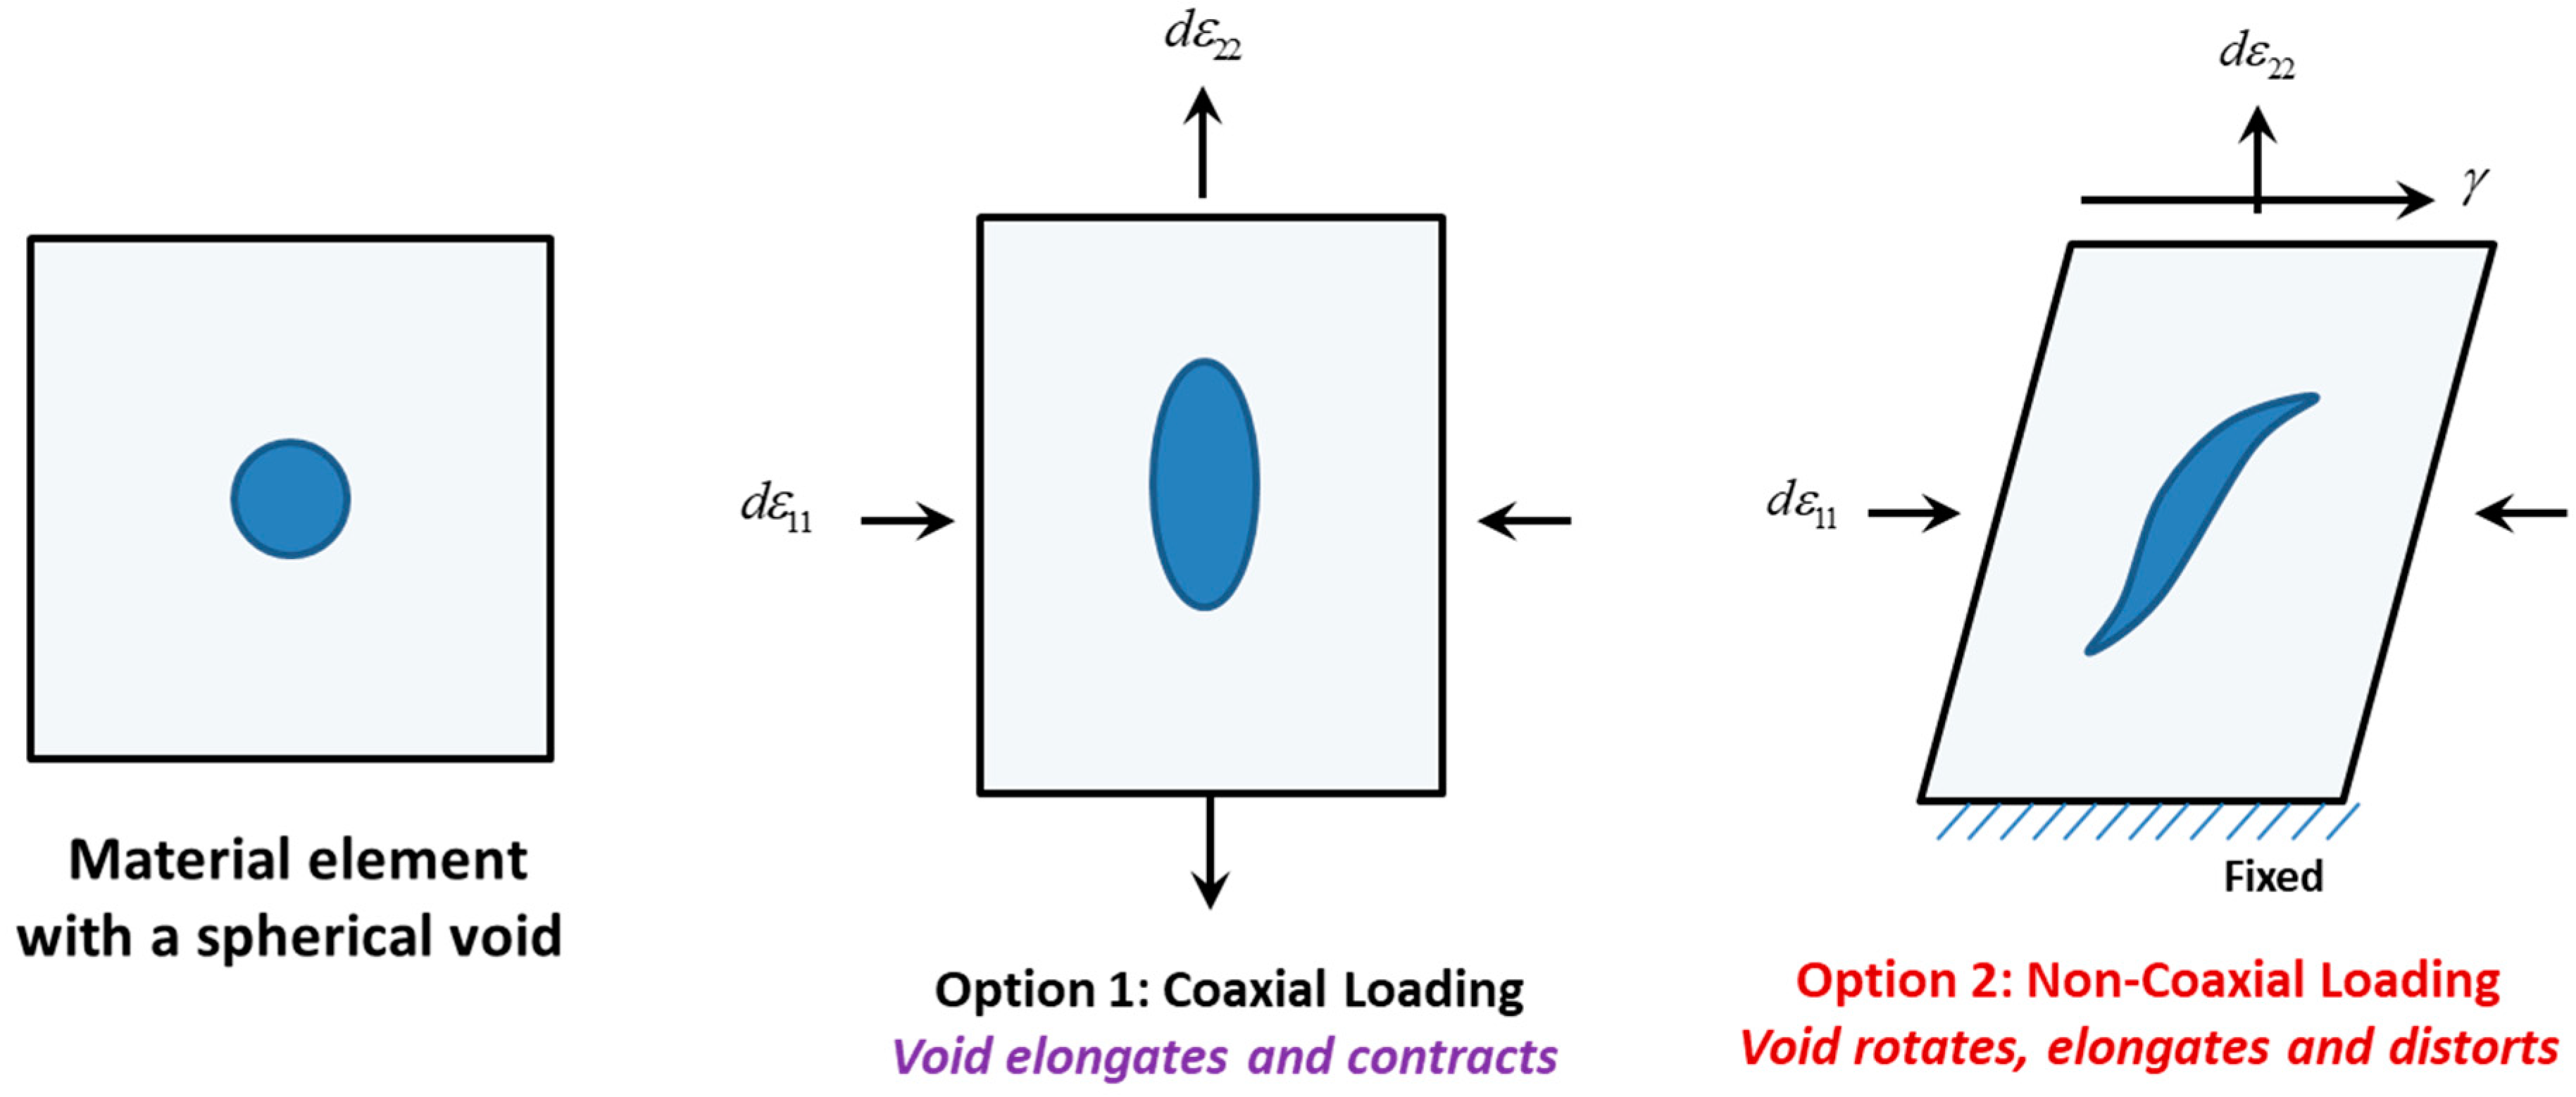
  • Stress states composed of a simple shear and superimposed tension, such as constant tension–torsion and butterfly tests, provide a constant stress state in terms of the stress invariants but are not strictly proportional. A constant stress state where the equivalent strain is not proportional to the cumulative principal strains due to the presence of a simple shear component has been denoted as non-coaxial. The presence of normal tensile stress with pure shear (no spin) is coaxial and proportional.
  • It is recommended to differentiate between pure and simple shear since only pure shear is proportional and coaxial, which can be important for fracture since the microstructure will evolve differently. For plastic yielding, this distinction may not be as important.
  • The failure loci in terms of the equivalent strain and stress triaxiality may depend upon the choice of characterization tests and if non-coaxial or coaxial test data was used in the calibration.
  • General loading conditions for failure characterization cannot be uniquely defined by the stress triaxiality and Lode parameters. Thus, the current MMC-type framework may only be unique for coaxial proportional stress states, which appears to exclude the use of simple shear and non-coaxial characterization tests. This is an inconsistency with the fracture characterization tests used to calibrate the models.
  • The analytical solution of Hillier [47] for the onset of a tensile instability in a constant tension–torsion test predicts that the onset of localization is delayed or suppressed in combined shear and tensile stress states in comparison with a tensile stress state with the same triaxiality. This is in general agreement with the observations of Scales et al. [26] where the failure strains in CTT tests were significantly higher than those from in-plane tests for the same alloy and no cusp is observed at the triaxiality for uniaxial tension.

Author Contributions

C.B. and A.A. contributed in the technical analysis and preparation of the manuscript.

Funding

Financial support for this study was partially provided by the National Science and Engineering Research Council of Canada through the Discovery Grant Program.

Conflicts of Interest

The authors declare no conflict of interest.

Nomenclature

Stress and Strain-Related Tensors and Parameters
ε Logarithmic (true) strain tensor
ε 1 3 Principal strains in descending order
ρ Ratio of the incremental normal strain components
ω Ratio of shear stress to normal stress in the applied stress direction
ϕ ε Angle of the principal strain directions
ε e q Work-conjugate Equivalent plastic strain
ε e q C X Coaxial equivalent strain or Effective strain computed using cumulative strains
ε p f Equivalent plastic strain at failure
ε 1 f Maximum principal strain at failure
σ True (Cauchy) stress tensor
α Ratio of the normal stress components
β Ratio of shear stress to normal stress in the applied stress direction
ψ S , ϕ N Angles to define the normalized shear and normal stress in polar coordinates
ξ Parameter for the severity of shear loading under plane stress
σ 1 3 Principal stresses in descending order
σ 1 f Maximum principal stress at failure
σ h y d Hydrostatic stress
σ e q v m Von mises equivalent stress
I 1 First invariant of the stress tensor
J 1 3 Three invariants of the deviatoric stress tensor
L Lode parameter: General parameter as there are multiple definitions
L J 2 J 3 Lode parameter computed from the deviatoric stress invariants
T Stress triaxiality
θ ¯ L Lode parameter computed by normalizing the Lode angle
θ σ Angle of principal stress directions in plane stress
τ Maximum shear stress
τ f Maximum shear stress at fracture
Hardening, Instability and Fracture Model Parameters
σ ¯ Flow stress
c Parameter in the Mohr-Coulomb yield function
c 1 4 Parameters in failure locus of Bai and Wierzbicki (2010)
D Damage parameter
K , n Strength coefficient and hardening exponent in the Holloman hardening model
z Critical sub-tangent for onset of instability
Mechanics of Deformation
FDeformation gradient tensor
VLeft stretch tensor
RRotation tensor
BLeft Cauchy-Green stretch tensor
LVelocity gradient tensor
WVorticity tensor
DRate of deformation tensor or logarithmic strain rate
Ω log Logarithmic spin tensor
γ Applied shear deformation in deformation gradient
λ Applied extensional stretch in deformation gradient
χ Ratio of the applied shear deformation to the extensional stretch
η Ratio of the incremental applied shear deformation to the incremental stretch
Acronyms
CTT Constant Tension Torsion tests
MMC Modified Mohr Coulomb
FEA Finite-element analysis

Appendix A: Mechanics of Coaxial and Non-Coaxial Strain Paths in Proportional Loading

Following the same procedure outlined in Section 3.4 for plane strain tension with a superimposed simple shear, details on the mechanics of other proportional paths of Section 4 are presented here. For brevity, only the deformation and velocity gradient tensors, principal strains, and von Mises work-conjugate equivalent strains are presented. The logarithmic principal strains are:
ε 1 = 1 2 ln ( A + B ) ,   ε 2 = 1 2 ln ( A B ) ,   ε 3 = C ,
where A, B, C will depend upon the chosen path. The incremental work-conjugate von Mises equivalent strain ratio can be written as:
d ε e q D 22 = 1 + α ρ + 2 β ω α 2 α + 1 + 3 β 2 = 2 3 1 + ρ + ρ 2 + ω 2 ,
where the normal stress is selected for the given path, such as uniaxial tension, α = 0 . The corresponding normal strain ratio, shear strain, and stress ratios can then be readily determined for the von Mises constitutive model for a given stress triaxiality.

Appendix A.1. Proportional Loading from Simple Shear to Pure Shear

This deformation corresponds to simple shear applied in the 12-direction with a magnitude, γ , with a superimposed pure shear deformation that corresponds to an elongation, λ , in the 22-direction and an equivalent contraction in the 11-direction. Deformation is plane strain with a deformation gradient, velocity gradient, and logarithmic strain rate tensors of:
F = [ 1 / λ γ / λ 0 0 λ 0 0 0 1 ] ,
L = [ d λ / λ d γ / λ 2 0 0 d λ / λ 0 0 0 0 ] ,
D = [ d λ / λ d γ / 2 λ 2 0 d γ / 2 λ 2 d λ / λ 0 0 0 0 ] .
The parameters related to the logarithmic principal strains are:
A = λ 4   +   γ 2   +   1 2 λ 2 ,   B = ( λ 4   +   γ 2 ) 2 2 λ 4   +   2 γ 2   +   1 2 λ 2 ,   C = 0 .
The incremental and cumulative von Mises equivalent strain is readily obtained since α = ρ = 1 as:
d ε e q D 22 = 2 3 1 + β 2 ,
ε e q = 2 3 1 + β 2 ln λ .
The stress triaxiality is zero for all loading conditions along this path from simple to pure shear.

Appendix A.2. Proportional Loading from Simple Shear to Uniaxial Tension

This deformation corresponds to simple shear applied in the 12-direction with a magnitude, γ , with a superimposed uniaxial extension, λ , in the 22-direction with corresponding contractions in the 11 and 33-directions of 1 / λ . The deformation gradient, velocity gradient, and logarithmic strain rate tensors are:
F = [ 1 λ γ λ 0 0 λ 0 0 0 1 λ ] ,
L = [ d λ 2 λ d γ λ 3 / 2 0 0 d λ λ 0 0 0 d λ 2 λ ] ,
D = [ d λ 2 λ d γ 2 λ 3 / 2 0 d γ 2 λ 3 / 2 d λ λ 0 0 0 d λ 2 λ ] .
The parameters for the logarithmic principal strains are:
A = λ 3   +   γ 2   +   1 2 λ ,   B = ( λ 3 + γ 2 ) 2 2 λ 3   +   2 γ 2   +   1 2 λ ,   C = 1 2 ln λ .
The normal stress ratio for uniaxial tension is α = 0 and the incremental and cumulative von Mises equivalent strains for this loading condition are:
d ε e q D 22 = 1 + 3 β 2 ,
ε e q = 1 + 3 β 2 ln λ .
The applied shear stress and shear strain ratios can be determined for a desired triaxiality as:
β = 1 3 1 9 T 2 1 ,
ω = 3 2 β ,   0 < T 1 3 .

Appendix A.3. Proportional Loading from Simple Shear to Equal Biaxial Tension

This deformation corresponds to simple shear loading applied in the 12-direction with a magnitude, γ , with a superimposed equal biaxial stretch in the 11- and 22-directions of λ with thinning in the 33-direction of 1 / λ 2 . The resulting deformation gradient, velocity gradient, and logarithmic strain rate tensors are:
F = [ λ γ / λ 0 0 λ 0 0 0 1 / λ 2 ] ,
L = [ d λ λ λ d γ     d λ γ λ 3 d λ λ γ 0 0 d λ λ 0 0 0 2 d λ λ ] ,
D = [ d λ λ λ d γ ( γ + γ λ 2 ) d λ 2 λ 3 0 λ d γ ( γ + γ λ 2 ) d λ 2 λ 3 d λ λ 0 0 0 2 d λ λ ] .
The logarithmic principal strain parameters are:
A = λ 2 ( 1 + γ 2 2 ) ,   B = λ 2 γ γ 2   +   4 2 ,   C = 2 ln λ .
The normal stress ratio for equal biaxial tension is α = 1 and the incremental and cumulative von Mises equivalent strains for this loading condition are:
d ε e q D 22 = 2 1 + 3 β 2 ,
ε e q = 2 1 + 3 β 2 ln λ .
For a given triaxiality, the shear stress and shear strain ratios are:
β = 1 3 4 9 T 2 1 ,
ω = 3 β ,     0 < T 2 3 .
For this path, the ratio of the applied shear to extension, d η = d γ / d λ , has to be continually adjusted during deformation to maintain a constant shear strain ratio if integrating the stress state using the applied deformation gradient. The applied shear strain ratio is:
ω = D 12 D 22 = 1 2 [ 1 λ d η γ ( 1 λ 2 + 1 ) ] .

References

  1. Bao, Y.; Wierzbicki, T. On the fracture locus in the equivalent strain and stress triaxiality space. Int. J. Mech. Sci. 2004, 46, 81–98. [Google Scholar] [CrossRef]
  2. Bai, Y. Effect of Loading History in Necking and Fracture. Ph.D. Thesis, Massachusetts Institute of Technology, Cambridge, MA, USA, 2008. [Google Scholar]
  3. Bai, Y.; Wierzbicki, T. A new model of metal plasticity and fracture with pressure and lode dependence. Int. J. Plast. 2008, 24, 1071–1096. [Google Scholar] [CrossRef]
  4. Bai, Y.; Wierzbicki, T. Application of extended Mohr-Coulomb criterion to ductile fracture. Int. J. Fract. 2010, 161, 1–20. [Google Scholar] [CrossRef]
  5. Dunand, M.; Mohr, D. Hybrid experimental-numerical analysis of basic fracture experiments for sheet metals. Int. J. Solids Struct. 2010, 47, 1130–1143. [Google Scholar] [CrossRef]
  6. Dunand, M.; Mohr, D. Optimized butterfly specimen for the fracture testing of sheet materials under combined normal and shear loading. Eng. Fract. Mech. 2011, 78, 2919–2934. [Google Scholar] [CrossRef]
  7. Dunand, M.; Mohr, D. Effect of Lode parameter on plastic flow localization after proportional loading at low stress triaxialities. J. Mech. Phys. Solids 2014, 66, 133–153. [Google Scholar] [CrossRef]
  8. Gu, G.; Mohr, D. Anisotropic Hosford-Coulomb fracture initiation model: Theory and application. Eng. Fract. Mech. 2015, 147, 480–497. [Google Scholar] [CrossRef]
  9. Mohr, D.; Henn, S. Calibration of stress-triaxiality dependent crack formation criteria: A new hybrid experimental-numerical method. Exp. Mech. 2007, 47, 805–820. [Google Scholar] [CrossRef]
  10. Mohr, D.; Marcadet, S.J. Micromechanically-motivated phenomenological Hosford-Coulomb model for predicting ductile fracture initiation at low stress triaxialities. Int. J. Solids Struct. 2015, 67–68, 40–55. [Google Scholar] [CrossRef]
  11. Papasidero, J.; Doquet, V.; Mohr, D. Determination of the Effect of Stress State on the Onset of Ductile Fracture through Tension–torsion Experiments. Exp. Mech. 2013, 54, 137–151. [Google Scholar] [CrossRef]
  12. Papasidero, J.; Doquet, V.; Mohr, D. Ductile fracture of aluminum 2024-T351 under proportional and non-proportional multi-axial loading: Bao-Wierzbicki results revisited. Int. J. Solids Struct. 2015, 69–70, 459–474. [Google Scholar] [CrossRef]
  13. Roth, C.C.; Mohr, D. Ductile fracture experiments with locally proportional loading histories. Int. J. Plast. 2016, 79, 328–354. [Google Scholar] [CrossRef]
  14. Abedini, A.; Butcher, C.; Worswick, M.J. Fracture characterization of rolled sheet alloys in shear loading: Studies of specimen geometries, anisotropy, and rate sensitivity. Exp. Mech. 2017, 57, 75–88. [Google Scholar] [CrossRef]
  15. Peirs, J.; Verleysen, P.; Degrieck, J. Novel technique for static and dynamic shear testing of Ti6Al4V sheet. Exp. Mech. 2012, 52, 729–741. [Google Scholar] [CrossRef]
  16. Rahmaan, T.; Abedini, A.; Butcher, C.; Pathak, N.; Worswick, M.J. Experimental investigation of strain rate effect on fracture characteristics of DP600 and AA5182-O sheet metal alloys under shear loading. Int. J. Impact Eng. 2017, 108, 303–321. [Google Scholar] [CrossRef]
  17. Butcher, C.; Abedini, A. Shear Confusion: Identification of the Appropriate Equivalent Strain in Simple Shear using the Logarithmic Strain Measure. Int. J. Mech. Sci. 2017, 273–283. [Google Scholar] [CrossRef]
  18. Cheong, K.; Omer, K.; Butcher, C.; George, R.; Dykeman, J. Evaluation of the VDA 238-100 Tight Radius Bending Test using Digital Image Correlation Strain Measurement, Proceedings of 36th International Conference of the International Deep Drawing Research Group (IDDRG 2017). J. Phys. Conf. Ser. 2017, 896, 012075. [Google Scholar] [CrossRef]
  19. Butcher, C.; Anderson, D.; Worswick, M. Predicting failure during sheared edge stretching using a damage-based model for the shear-affected zone. Int. J. Mater. Manuf. 2013, 6, 304–312. [Google Scholar] [CrossRef]
  20. Pathak, N.; Butcher, C.; Worswick, M.J.; Bellhouse, E.; Gao, J. Damage evolution in complex-phase and dual-phase steels during edge stretching. Materials 2017, 10, 346. [Google Scholar] [CrossRef]
  21. Anderson, D.; Butcher, C.; Pathak, N.; Worswick, M.J. Failure parameter identification and validation for a dual-phase 780 steel sheet. Int. J. Solids Struct. 2017, 124, 89–107. [Google Scholar] [CrossRef]
  22. Gruben, G.; Fagerholt, E.; Hopperstad, O.; Borvik, T. Fracture Characteristics of a Cold-Rolled Dual-Phase Steel. Eur. J. Mech. A Solids 2011, 30, 204–218. [Google Scholar] [CrossRef]
  23. Barsoum, I.; Faleskog, J. Rupture mechanisms in combined tension and shear—Experiments. Int. J. Solids Struct. 2007, 44, 1768–1786. [Google Scholar] [CrossRef]
  24. Barsoum, I.; Faleskog, J. Rupture mechanisms in combined tension and shear—Micromechanics. Int. J. Solids Struct. 2007, 44, 5481–5498. [Google Scholar] [CrossRef]
  25. Haltom, S.S.; Kyriakides, S.; Ravi-Chandar, K. Ductile fracture under combined shear and tension. Int. J. Solids Struct. 2013, 50, 1507–1522. [Google Scholar] [CrossRef]
  26. Scales, M.; Tardif, N.; Kyriakides, S. Ductile failure of aluminum alloy tubes under combined torsion and tension. Int. J. Solids Struct. 2016, 97–98, 116–128. [Google Scholar] [CrossRef]
  27. Johnson, G.R.; Cook, W.H. Fracture characteristics of three metals subjected to various strains, strain rates, temperatures and pressures. Eng. Fract. Mech. 1985, 21, 21–48. [Google Scholar] [CrossRef]
  28. Hooputra, H.; Gese, H.; Dell, H.; Werner, H. A comprehensive failure model for crashworthiness simulation of aluminum extrusions. Int. J. Crashworthiness 2004, 9, 449–463. [Google Scholar] [CrossRef]
  29. Lou, Y.; Huh, H.; Lim, S.; Pack, K. New Ductile Fracture Criterion for Prediction of Fracture Forming Limit Diagrams of Sheet Metals. Int. J. Solids Struct. 2012, 49, 3605–3615. [Google Scholar] [CrossRef]
  30. Lou, Y.; Huh, H. Extension of a Shear-Controlled Ductile Fracture Model Considering the Stress Triaxiality and the Lode Parameter. Int. J. Solids Struct. 2013, 50, 447–455. [Google Scholar] [CrossRef]
  31. Lou, Y.; Chena, L.; Clausmeyer, T.; Tekkayaa, E.; Yoon, J.W. Modeling of ductile fracture from shear to balanced biaxial tension for sheet metals. Int. J. Solids Struct. 2017, 112, 169–184. [Google Scholar] [CrossRef]
  32. Park, N.; Huh, H.; Lim, S.J.; Lou, Y.; Kang, Y.S.; Seo, M.H. Fracture-based forming limit criteria for anisotropic materials in sheet metal forming. Int. J. Plast. 2017, 96, 1–35. [Google Scholar] [CrossRef]
  33. Li, Y.; Luo, M.; Gerlach, J.; Wierzbicki, T. Prediction of shear-induced fracture in sheet metal forming. J. Mater. Process. Technol. 2010, 210, 1858–1869. [Google Scholar] [CrossRef]
  34. Luo, M.; Wierzbicki, T. Numerical failure analysis of a stretch-bending test on dual phase steel sheet using a phenomenological fracture model. Int. J. Solids Struct. 2010, 47, 3084–3102. [Google Scholar] [CrossRef]
  35. Malcher, L.; Andrade Pires, F.M.; Cesar de Sa, J.M.A. An assessment of isotropic constitutive models for ductile fracture under high and low stress triaxiality. Int. J. Plast. 2012, 30, 81–115. [Google Scholar] [CrossRef]
  36. Gurben, G.; Hopperstad, O.S.; Borvik, T. Evaluation of uncoupled ductile fracture criteria for dial-phase steel Docol 600DL. Int. J. Mech. Sci. 2012, 62, 133–146. [Google Scholar] [CrossRef]
  37. Cao, T.S.; Gaillac, A.; Montmitonnet, P.; Bouchard, P.O. Identification methodology and comparison of phenomenological ductile damage models via hybrid numerical-experimental analysis of fracture experiments conducted on a zirconium alloy. Int. J. Solids Struct. 2013, 24, 3984–3999. [Google Scholar] [CrossRef]
  38. Kofiani, K.; Nonn, A.; Wierzbicki, T. New Calibration method for high and low triaxiality and validation on SENT specimens of API X70. Int. J. Press. Vessel. Pip. 2013, 111–112, 187–201. [Google Scholar] [CrossRef]
  39. Lian, J.; Sharaf, M.; Archie, F.; Munstermann, S. A hybrid approach for modelling of plasticity and failure behaviour of advanced high-strength steel sheets. Int. J. Damage Mech. 2013, 22, 188–218. [Google Scholar] [CrossRef]
  40. Rousselier, G.; Lou, M. A fully coupled void damage and Mohr-Coulomb based ductile fracture model in the framework of a reduced texture methodology. Int. J. Plast. 2014, 55, 1–24. [Google Scholar] [CrossRef]
  41. Neukamm, F.; Feucht, M.; Haufe, A. Consistent Damage Modelling in the Process Chain of Forming to Crashworthiness Simulations. In Proceedings of the 7th LS-DYNA Anwenderforum, Bamberg, Germany, 30 September–1 October 2008. [Google Scholar]
  42. Basaran, M.; Wolkerling, S.D.; Feucht, M.; Neukamm, F.; Weichert, D. An Extension of the GISSMO Damage Model Based on Lode Angle Dependence. In Proceedings of the 9th LS-DYNA Anwenderforum, Bamberg, Germany, 12–13 October 2010. [Google Scholar]
  43. Benzerga, A.A.; Surovik, D.; Keralavarma, S.M. On the path-dependence of the fracture locus in ductile materials—Analysis. Int. J. Plast. 2012, 37, 157–170. [Google Scholar] [CrossRef]
  44. Thomas, N.; Basu, S.; Benzerga, A.A. On fracture loci of ductile materials under non-proportional loading. Int. J. Mech. Sci. 2016, 117, 135–151. [Google Scholar] [CrossRef] [Green Version]
  45. Jia, Y.; Bai, Y. Ductile fracture prediction for metal sheets using all-strain-based anisotropic eMMC model. Int. J. Mech. Sci. 2016, 115–116, 516–531. [Google Scholar] [CrossRef]
  46. Beese, A.M.; Luo, M.; Li, Y.; Bai, Y.; Wierzbicki, T. Partially coupled anisotropic fracture model for aluminum sheets. Eng. Fract. Mech. 2010, 77, 1128–1152. [Google Scholar] [CrossRef]
  47. Hillier, M.J. Tensile Plastic Instability Under Complex Stress. Int. J. Mech. Sci. 1963, 5, 57–67. [Google Scholar] [CrossRef]
  48. Lode, W. Versuche über den Einfluss der mittleren Hauptspannung auf das Fliessen der Metalle Eisen, Kupfer, und Nickel. Z. Phys. 1926, 36, 913–939. [Google Scholar] [CrossRef]
  49. Cockcroft, M.G.; Latham, D.J. Ductility and the workability of metals. J. Inst. Met. 1968, 96, 33–39. [Google Scholar]
  50. Oyane, M.; Sato, T.; Okimoto, K.; Shima, S. Criteria for ductile fracture and their applications. J. Mech. Work. Technol. 1980, 4, 65–81. [Google Scholar] [CrossRef]
  51. Clift, S.E.; Hartley, P.; Sturgess, C.E.N.; Rowe, G.W. Fracture prediction in plastic deformation processes. Int. J. Mech. Sci. 1990, 32, 1–17. [Google Scholar] [CrossRef]
  52. Wierzbicki, T.; Bao, Y.B.; Lee, Y.-W.; Bai, Y.L. Calibration and evaluation of seven fracture models. Int. J. Mech. Sci. 2005, 47, 719–743. [Google Scholar] [CrossRef]
  53. Omer, K.; ten Kortenaar, L.; Butcher, C.; Worswick, M.J.; Detwiler, D.; Malcolm, S. Testing of a Hot Stamped Axial Crush Member with Tailored Properties—Experiments and Models. Int. J. Impact Eng. 2017, 103, 12–28. [Google Scholar] [CrossRef]
  54. Stoughton, S.; Yoon, J.W. Path independent forming limits in strain and stress spaces. Int. J. Solids Struct. 2012, 49, 3616–3625. [Google Scholar] [CrossRef] [Green Version]
  55. Abedini, A.; Butcher, C.; Nemcko, M.J.; Kurukuri, S.; Worswick, M.J. Constitutive characterization of a rare-earth magnesium alloy sheet (ZEK100-O) in shear loading: Studies of anisotropy and rate sensitivity. Int. J. Mech. Sci. 2017, 128–129, 54–69. [Google Scholar] [CrossRef]
  56. Abedini, A.; Butcher, C.; Rahmaan, T.; Worswick, M.J. Evaluation and calibration of anisotropic yield criteria in shear loading: Constraints to eliminate numerical artefacts. Int. J. Solids Struct. 2017. [Google Scholar] [CrossRef]
  57. Butcher, C.; Abedini, A. On anisotropic plasticity models using linear transformations on the deviatoric stress: Physical constraints on plastic flow in generalized plane strain. Int. J. Mech. Sci. 2019, 161–162, 105044. [Google Scholar] [CrossRef]
  58. Gorji, M.; Berisha, B.; Hora, P.; Barlat, F. Modeling of localization and fracture phenomena in strain and stress space for sheet metal forming. Int. J. Mater. Form. 2016, 9, 573–584. [Google Scholar] [CrossRef]
  59. Reinhardt, W.D.; Dubey, R.N. Application of Objective Rates in Mechanical Modeling of Solids. J. Appl. Mech. 1996, 118, 692–698. [Google Scholar] [CrossRef]
  60. Xiao, H.; Bruhns, O.T.; Meyers, A. Logarithmic strain, logarithmic spin and logarithmic rate. Acta Mech. 1997, 124, 89–105. [Google Scholar] [CrossRef]
  61. Bruhns, O.T.; Xiao, H.; Meyers, A. Self-consistent Eulerian rate type elasto-plasticity models based upon the logarithmic stress rate. Int. J. Plast. 1999, 15, 479–520. [Google Scholar] [CrossRef]
  62. Ghahremaninezhad, A.; Ravi-Chandar, K. Ductile failure behavior of polycrystalline Al 6061-T6 under shear dominant loading. Int. J. Fract. 2013, 180, 23–39. [Google Scholar] [CrossRef]
  63. Gruben, G.; Morin, D.; Langseth, M.; Hopperstad, O.S. Strain localization and ductile fracture in advanced high-strength steel sheets. Eur. J. Mech. A Solids 2017, 61, 315–329. [Google Scholar] [CrossRef]
  64. Considère, A. L’Emploi du Fer et de L’Acier dans les Constructions. Ann. Ponts Chaussees 1968, 9, 574. [Google Scholar]
  65. Swift, H.W. Plastic instability under plane stress. J. Mech. Phys. Solids 1952, 1, 1–16. [Google Scholar] [CrossRef]
  66. Zener, C.; Hollomon, J.H. Effect of strain rate upon plastic flow of steel. J. Appl. Phys. 1944, 15, 22–32. [Google Scholar] [CrossRef]
  67. Scheyvaerts, F.; Onck, P.R.; Tekoglu, C.; Pardoen, T. The growth and coalescence of ellipsoidal voids in plane strain under combined shear and tension. J. Mech. Phys. Solids 2011, 59, 373–397. [Google Scholar] [CrossRef]
  68. Tvergaard, V. Shear deformation of voids with contact modelled by internal pressure. Int. J. Mech. Sci. 2008, 50, 1459–1465. [Google Scholar] [CrossRef]
  69. Tvergaard, V. Behavior of voids in a shear field. Int. J. Fract. 2009, 158, 41–49. [Google Scholar] [CrossRef]
  70. Tvergaard, V. Effect of stress-state and spacing on voids in a shear field. Int. J. Solids Struct. 2012, 49, 3047–3054. [Google Scholar] [CrossRef]
  71. Tvergaard, V. Behavior of porous ductile solids at low stress triaxiality in different modes of deformation. Int. J. Solids Struct. 2015, 60–61, 28–34. [Google Scholar] [CrossRef]
Figure 1. Plane stress representation of the von Mises yield function with isotropic hardening and its interaction with Mohr–Coulomb failure loci. The MC failure loci have been adjusted so that the tensile quadrant is constant with a value of 1338 MPa to show the influence of the c parameter.
Metals 09 01052 g001
Figure 2. Plane stress failure loci in terms of the equivalent failure strain and stress triaxiality obtained using the MC criterion as a failure locus and a von Mises plasticity model with isotropic power law hardening. The MC failure loci have been adjusted so that the same tensile quadrant is constant with an equivalent failure strain of 0.50 at uniaxial tension to show the variation in the c parameter.
Metals 09 01052 g002
Figure 3. Schematic representation of a Modified Mohr Coulomb (MMC) failure surface for proportional loading showing the variation of the equivalent failure strain with respect to the stress triaxiality and Lode parameter.
Metals 09 01052 g003
Figure 4. Shear loading conditions of a rigid plastic plane stress element with equivalent stress states for pure and simple shear.
Metals 09 01052 g004
Figure 5. (a) Divergence in the principal stress and strain directions in simple shear loading and (b) the corresponding divergence in the equivalent strain with respect to the principal strain.
Metals 09 01052 g005
Figure 6. Schematic of loading conditions in tension–torsion tests of hollow tubes and butterfly tests that produce a non-coaxial plane stress state of combined plane strain tension and simple shear.
Metals 09 01052 g006
Figure 7. Boundary conditions for combined tension and shear loading of rigid plastic plane stress elements. The stress state, principal stress, and strain ratios are constant for both coaxial and non-coaxial loading.
Metals 09 01052 g007
Figure 8. Initial and deformed configurations of a plane stress material element of a unit length subjected to a combined simple shear and plane strain extension.
Metals 09 01052 g008
Figure 9. Half-plane view of the von Mises yield surface showing the range of admissible plane stress states that corresponds to plane strain loading from simple shear to plane strain tension. The shear stress, σ12, in this figure is taken to be due to a superimposed simple shear.
Metals 09 01052 g009
Figure 10. Evolution of the von Mises equivalent strain for different stress triaxialities in the combined loading condition of plane strain tension with simple shear.
Metals 09 01052 g010
Figure 11. Comparison of the equivalent strain computed using the assumption of coaxiality and the work-conjugate solution of Equation (44) for the tension–torsion tests of Haltom et al. [25] and Scales et al. [26] for AA6061-T6 tubes.
Metals 09 01052 g011
Figure 12. Representative failure locus of the model material for proportional coaxial loading in terms of the major principal strain and stress triaxiality. The failure locus was based upon the data of Scales et al. (2016) to obtain a physically representative shape and magnitudes of the failure strains.
Metals 09 01052 g012
Figure 13. Half-plane view of the von Mises yield surface showing the range of admissible plane stress states that corresponds to the various paths used to construct a failure locus. The shear stress, σ12, in this representation is due to a superimposed simple shear.
Metals 09 01052 g013
Figure 14. Failure loci generated along coaxial, tension–torsion, and conventional paths. In the conventional path, a cusp or bifurcation occurs at uniaxial tension whereas higher equivalent strains are obtained along the tension–torsion path at low triaxiality. The non-coaxial paths converge for simple shear with a triaxiality of zero and an equivalent failure strain of 7.72.
Metals 09 01052 g014
Figure 15. Three-dimensional and two-dimensional representations of the failure loci obtained from traversing different paths of an isotropic material under plane stress loading conditions with a superimposed simple shear.
Metals 09 01052 g015
Figure 16. Hillier’s [47] solution for the critical subtangent to initiate the onset of diffuse necking in proportional plane stress loading corresponding to a coaxial path and non-coaxial paths. The higher the value of Z, the higher the strain until diffuse localization begins, and the more constant the stress history.
Metals 09 01052 g016
Figure 17. Predicted loci for the onset of diffuse necking of a von Mises material with a power law hardening law in both coaxial and non-coaxial stress states.
Metals 09 01052 g017
Figure 18. Variation of the equivalent strain at the onset of diffuse localization using Equation (54) in terms of the stress triaxiality and shear parameter with the coaxial, conventional, and tension–torsion paths indicated. The equivalent plastic strains at the onset of localization were obtained for a power law hardening material with n = 0.10.
Metals 09 01052 g018
Figure 19. Schematic of void evolution of an initially spherical void subjected to an intermediate triaxiality of combined tension and shear for both coaxial and non-coaxial boundary conditions. The stress triaxiality imposed on the unit cells is the same for both cases.
Metals 09 01052 g019
Table 1. Comparison of the experimental tension–torsion results of Scales et al. [26] with the major, minor, and work conjugate equivalent strains that account for non-coaxial loading.
Experiment Data of Scales et al. (2016)Finite Strain Combined Plane Strain & Simple Shear
TriaxialityCoaxial von Mises
Eq. Strain (DIC max.)
Major True StrainMinor True StrainVon Mises
Work Conjugate Eq. Strain
0.0721.501.39−1.181.94
0.1061.701.62−1.252.31
0.1391.371.32−0.971.66
0.1461.621.58−1.122.10
0.2051.121.10−0.721.26
0.2580.920.92−0.530.98
0.2621.021.02−0.581.11
0.3080.860.86−0.440.90
0.3480.750.75−0.350.77
0.4110.730.72−0.260.74
0.4470.690.67−0.200.70
0.480.660.63−0.150.67
0.5060.550.52−0.100.55
0.5170.580.54−0.090.58
0.5770.400.350.000.40
Table 2. Values and relationships for the stress and strain states for the different plane stress paths for a von Mises material.
Loading ConditionNormal Strain RatioNormal Stress RatioShear Stress RatioShear Strain RatioEquivalent Strain Ratio
ω ( α ) = d ε 11 d ε 22 α ( T ) = σ 11 σ 22 β ( T ) = σ 12 σ 22 ω ( β ) = d ε 12 d ε 22 d ε e q D 22 = f ( α , β )
Pure & Simple Shear−1−1 ω ω = β 2 3 1 + β 2
Uniaxial Tension & Simple Shear−0.50 1 3 1 9 T 2 1 ω = 3 2 β 1 + 3 β 2
Plane Strain Tension & Simple Shear01/2 1 2 1 3 T 2 1 ω = 2 β 2 3 1 + 4 β 2
Biaxial Tension & Simple Shear11 1 3 4 9 T 2 1 ω = 3 β 2 1 + 3 β 2
Coaxial Loading 2 α 1 2 α T 2 ( α 2 α + 1 ) 2 ( 1 + α 3 ) 2 = 0 00 2 ( α 2 α + 1 ) ( 2 α ) α 2 α + 1

