Article

Low Cycle Fatigue and Relaxation Performance of Ferritic–Martensitic Grade P92 Steel

Bundesanstalt für Materialforschung und -prüfung (BAM), Division 5.2: Experimental and Model Based Mechanical Behaviour of Materials, 12205 Berlin, Germany
*
Author to whom correspondence should be addressed.
Metals 2019, 9(1), 99; https://doi.org/10.3390/met9010099
Submission received: 12 December 2018 / Revised: 9 January 2019 / Accepted: 10 January 2019 / Published: 18 January 2019
(This article belongs to the Special Issue Creep and High Temperature Deformation of Metals and Alloys)

Abstract

:
Due to their excellent creep resistance and good oxidation resistance, 9–12% Cr ferritic–martensitic stainless steels are widely used as high temperature construction materials in power plants. However, the mutual combination of different loadings (e.g., creep and fatigue), due to a “flexible” operation of power plants, may seriously reduce the lifetimes of the respective components. In the present study, low cycle fatigue (LCF) and relaxation fatigue (RF) tests performed on grade P92 helped to understand the behavior of ferritic–martensitic steels under a combined loading. The softening and lifetime behavior strongly depend on the temperature and total strain range. Especially at small strain amplitudes, the lifetime is seriously reduced when adding a hold time which indicates the importance of considering technically relevant small strains.

1. Introduction

The growing share of renewable energy sources in the electricity markets has forced many power plants into a more “flexible” operation with frequent load shifts and shutdowns. The associated temperature and stress gradients lead to complex loading scenarios in plant components, which may result in superimposed creep deformation, creep-fatigue, and thermo-mechanical fatigue [1]. A fundamental understanding of the mechanical behavior and damage evolution in 9–12% Cr ferritic–martensitic steels under a combined static and cyclic loading, at a high temperature is, therefore, required.
Comprehensive analyses of the mechanical behavior of 9–12% Cr steels have been carried out during the market introduction of these steels [2,3], but they focused on creep and creep-rupture testing, in line with the constant operation modes of the power plants at these times. With the introduction of the so-called “second generation” Cr steels, like P91 and HCM12 [4], more attention was paid to the material behavior under combined loading scenarios involving creep and low-cycle fatigue. For P91, the seminal work of Kim and Weertman [5] identified a number of key effects of fatigue loading on subsequent mechanical behavior and microstructure evolution. As a most obvious feature of fatigue on P91, substantial initial softening of the specimens was observed in strain-controlled testing. It continued throughout the fatigue experiments, though with decreasing rates, leading to reductions of the stress range exceeding 250 MPa [5]. Hold times at the peak tensile or compressive strain were found to reduce the number of cycles to fracture by, nearly, a factor of two. While stress relaxation during these holds was pronounced, it hardly affected the peak stress in the subsequent cycles. Aging of the specimens for 5000 h, at 593 °C, prior to testing, showed little effect on time to fracture in fatigue testing [5]. Transmission electron microscopy (TEM) revealed that aging indeed had no obvious effect on the ferritic–martensitic microstructure, while a rapid loss of the original lath type microstructure, by a formation of equiaxed dislocation cells and carbide coarsening, was observed, after only few hours of fatigue loading [5].
In the following decades, the fatigue behavior and microstructure evolution have been investigated in more detail in P91 [6,7], as well as in other 9–12% Cr-steels [8,9,10]. The topic of combined loading (creep-fatigue) has been extensively studied for P91 [11]. Generally, these studies confirmed the above-mentioned trends and indicated qualitatively similar behaviors for all ferritic–martensitic steel grades. However, the number of studies dealing with fatigue and creep-fatigue of these materials is still quite limited, compared to the great efforts spent on characterizing the creep behavior [12], especially when considering the large parameter fields which would need to be covered for a thorough analysis of the material behavior, under the different combined loadings. Consequently, the amount of available fatigue data is quite restricted, as is reflected, for example, in the number of creep data and fatigue data sheets provided by NIMS in Japan [13].
Recently, combined loading involving creep and cyclic fatigue loads has received increased attention due to the more flexible operation of power plants in many countries. Consequently, reliable data on the fatigue and creep-fatigue behavior are required for current construction materials. Since cyclic operation may especially affect thick-walled components (due to the build-up of thermal stresses [1]), the common material grades for live steam piping, headers, etc., need to be comprehensively tested. One current candidate material is P92, an optimized version of the 9% Cr grades with an increased tungsten content. Due to its enhanced creep resistance, compared to earlier grades, P92 can be used up to maximum operation temperatures of 620 °C [14]. A number of studies on the fatigue behavior of P92 have been published recently [15,16,17,18]. It was found that P92 exhibits a considerable cyclic softening, as it is known from P91. No quantitative comparison of the effect was given but it was confirmed that softening depends on a number of parameters, like the amount of plastic strain and temperature. The lifetime data were found to well follow the Coffin-Manson relationship. The effect of hold times has been previously investigated [19]; it was demonstrated that hold times may result in significantly reduced lifetime, as is known from P91.
However, it turns out that existing studies are quite restricted in terms of the investigated parameter fields. Considering the actual operation modes of power plants, which involve frequent warm starts or load variations for fast reaction to changing demands, data are required for (a) intermediate temperatures in the 300 °C range, (b) low-strain amplitudes [20], and (c) hold times at these conditions which resemble periods of constant operation [21]. In the present contribution, the fatigue behavior of a 9% Cr steel (P92) was investigated, with a focus on these loading types and ranges of parameters. Standard low-cycle fatigue (LCF) tests were carried out to create a database of fatigue data and to establish the Coffin-Manson coefficients, at different temperature levels, in addition to those that have been tested so far. In a second step, hold times under strain control were included into the LCF test procedures to study the influence of combined fatigue/relaxation processes on lifetime. Symmetric load and hold profiles with strain ratios of Rε = −1 and low-peak strains were applied in the current work to simulate the constrained thermal expansion and contraction of plant components, which may occur during fast load shifts due to inhomogeneous temperature distributions in the plant structure. In contrast to classical creep deformation, due to live steam pressure with continuously rising strain, the load scenario is then characterized by almost constant strains and related stress relaxation.

2. Materials and Methods

The material used for the mechanical tests is the ferritic–martensitic steel P92 (X12CrMoWVNbN10-1), according to DIN-EN 10216-2 [22]. The chemical composition of the investigated batch, as measured by spark spectrometry, is given in Table 1. All specimens were extracted from fully annealed sections of steam pipes with a wall thickness of 47 mm. The microstructure consists of tempered martensite, which results from a typical heat treatment, including normalizing (1040–1080 °C) and tempering (730–800 °C). During normalizing, austenite is formed and carbonitrides are dissolved. During subsequent air-cooling, the austenite transforms to martensite with a high density of free dislocations. To soften the material and to precipitate fine carbonitrides, a tempering treatment follows, leading to partial rearrangement of dislocations and formation of subgrains. The as-received microstructure is shown in Figure 1a,b; a schematic view of the typical substructure of a prior austenite grain is shown based on [23]; corresponding schemes have also been suggested elsewhere [6,24]. The prior austenite grains, which are transformed to a ferritic condition during tempering, still exhibit signs of the previous hierarchical martensitic structure with packets, blocks, and elongated cells that are often denominated as “laths”. M23C6 carbides are formed at lath, packet, and at prior austenite grain boundaries (PAGB). They are elongated in shape, with a length of 60–150 nm. Very fine MX-type carbonitrides (20–80 nm) are homogeneously distributed in the matrix within the laths [25,26].
For mechanical testing, cylindrical specimens of 18 mm gauge length and 6 mm gauge diameter (Figure 2) were machined from the pipe in a tangential direction. After testing, some specimens were prepared for metallographic inspection. For this purpose, the tested specimens were sectioned parallel to the loading direction, using a laboratory cutting machine. The relevant pieces were mounted in resin, and then ground and mechanically polished.
All tests were conducted on servo-hydraulic testing machines of type MTS Landmark with 100 kN force transducers. The machines were equipped with induction heating systems, which allowed fast heating of the test pieces. Initial heating and soaking was completed in less than 10 minutes at all test temperature levels. Strain was measured with high-temperature extensometers (water-cooled, MTS- 632.51F.04), with a gauge length of 12 mm. The temperature variation in the gauge length section of the specimens was max. ±5 °C. Four thermocouples of type S were spot-welded to the specimens, to measure the temperature. The control thermocouple was placed in the center of the gauge section, a second thermocouple was placed also in the middle, but at a 90° rotated position. The two other thermocouples were placed 5 mm above and below the control thermocouple. In preceding tests, it was verified that the thermocouples did not have a systematic influence on the crack initiation of the specimens.
In a first campaign, standard low-cycle fatigue (LCF) tests according to ISO 12106 [27] were carried out. The tests were conducted in air, under strain control, with constant strain rates of 1.0 × 10⁻³ 1/s. Mechanical strains of ±0.2% to ±0.6% were applied in the test series. A triangular wave form with a mechanical strain ratio of Rε = −1 was employed (Figure 3a). The failure criterion was a 10% drop in the peak tensile stress, following the procedure discussed in Reference [15]. LCF-tests were conducted at three temperature levels: 300 °C, 500 °C, and 620 °C. In a second step, hold periods th under strain control (at the maximum and minimum strain) were included in the LCF-test procedure (Figure 3b). They will be referred to as the relaxation-fatigue (RF) tests in the following, since the hold period allows for stress relaxation while the strain is kept constant. The hold time was 3 min, unless otherwise noted.
In Figure 4, all important mechanical parameters have been defined with the help of an example hysteresis loop. The stress range Δσ is defined by the maximum and minimum stress (Equation (1)), as well as the mean stress σm (Equation (2)). The total strain range, Δεt, is equal to twice the strain amplitude, εa,t, and consists of an elastic (Δεe), and a plastic part (Δεp) (Equations (3) and (4)). Assuming that the elastic deformation of the material follows Hooke’s law, the elastic and plastic contributions can be separated with the help of a straight line representing the unloading modulus (Equation (5)). Therefore, it is very important to determine the modulus of elasticity correctly. In this work, it was measured by the sonic resonance method in accordance to ASTM E 1875:2013 [28]. The values obtained at the different test temperatures are given in Table 2. In this study, the plastic strain contribution was determined at a stabilized cycle, which was at half-lifetime. At high temperatures, time-dependent processes take place. The total strain then consists of an elastic strain contribution, an instantaneous plastic strain, and a time-dependent creep strain. The sum of plastic strain and creep strain is the inelastic strain (Equation (6)). The energy dissipated during a cycle represents the plastic work, Wp, and is the area within the hysteresis loop (Equation (7)).
Δ σ =   σ m a x σ m i n = 2 σ a
σ m =   σ m a x   +   σ m i n 2
Δ ε t =   Δ ε e +   Δ ε p =   2 ε a , t
ε a , t =   ε a , e +   ε a , p
E =   σ a ε a , e
Δ ε t =   Δ ε e + Δ ε p + Δ ε c r Δ ε i n
W p =     σ d ε

3. Results

An overview of all low-cycle fatigue (LCF) and relaxation fatigue (RF) tests performed in this work, including the test conditions and the lifetimes reached, is given in Table 3.

3.1. Cyclic Stress Response Behavior of the LCF-Tests

Ferritic–martensitic steels, such as P92, show a continuous cyclic softening behavior in LCF testing. In Figure 5a, the maximum and minimum stress of each cycle are plotted, exemplarily, for one LCF test. The curves can be divided into three phases. In the initial part, which lasted for about the first 250 cycles in the given example, the major part of the softening occurred. After this pronounced initial drop of stress, a stabilized part followed. It was characterized by a small but continuous further change in the stress values. Towards the end of the test, a final failure part, with rapidly falling stress values followed. The curves of the peak cyclic stress, at the different total strains and the three temperature levels investigated here, have been presented in Figure 5b–d. For reasons of clarity, only the maximum peak stress has been plotted, and the number of cycles has been given in a logarithmic scale to better display the initial material behavior. Due to the temperature dependency of the mechanical properties the maximum stresses are highest at 300 °C, Figure 5b. Additionally, the maximum stresses at 300 °C were spaced more closely between the different strain amplitudes than at higher temperatures and the softening was similar. At 500 °C and 620 °C, the range of initial maximum stresses was wider than that in Figure 5b, due to the extended range of the total strain ranges. Tests at total strain ranges below ±0.3% result in considerably reduced maximum stresses, especially at the highest test temperature (Figure 5d). For example, at 620 °C, the maximum stresses ranged between 340 MPa and 360 MPa for tests with Δεt ≥ ±0.3%, whereas they ranged from 260 MPa to 340 MPa for strain ranges between ±0.2% and ±0.3%. Although the maximum stresses at N = 1, for the different total strain ranges differed by 35 MPa, at 300 °C and 100 MPa at 620 °C, the transition from the second phase (gradual lowering of the maximum stress) to the third phase (sudden decrease of stress towards the end of the test) occurred nearly at the same stress level, at each temperature.
The results given in Figure 5 indicate that the softening is more pronounced at higher temperatures. To quantify this observation the amount of softening was expressed according to the following equation:
s o f t e n i n g   r a t i o =   σ m a x   σ m a x , 50 % N f σ m a x   100
σmax is the overall maximum stress of the complete test, whereas σmax,50%Nf is the maximum stress of the stabilized cycle at half-lifetime. The equation was adapted from References [15,23], which used the maximum stress of the first cycle (see chapter 4. Discussion). In Table 4, the values for the softening ratio for all LCF tests have been summarized. For total strain ranges between ±0.3% and ±0.6%, the ratio appeared to be independent of the total strain for each temperature, but it decreased for ranges smaller than ±0.3%. It seems that a minimum amount of inelastic strain is required to cause significant softening. This can also be seen in Figure 5d, where the initial maximum stress of the cyclic softening curves is nearly independent of the applied strain for Δεt ≥ ±0.3%.
To further analyze the cyclic stress response, the inelastic strain contribution calculated by Equations (5) and (6) is considered. As shown in Figure 6, linear correlations exist between the inelastic strain amplitude and the total strain amplitude of P92, at each test temperature. The constants of the fitted linear functions are also given in the diagram, for all temperatures. At each temperature level, the inelastic strain amplitude increased with the rising total strain amplitude, because the amount of elastic strain remained nearly the same. In turn, this led to rising relative contributions of inelastic strain. For example, at 500 °C and a total strain amplitude of 0.2% the inelastic strain amplitude was 0.03%, representing a relative share of 15%. At a total strain amplitude of 0.4%, the inelastic strain amplitude was 0.2%, which was a relative amount of 49.5%. Similarly, the inelastic contribution rose with temperature. This was obviously due to a reduced strength of the material at higher temperatures.
This increasing amount of plasticity could also be detected in the hysteresis loops. In Figure 7, the hysteresis loops for 500 °C and the different total strain ranges are plotted (first cycle and at half-lifetime). Qualitatively similar hysteresis loops were obtained at 300 °C and 620 °C and are, therefore, not shown. With increasing total strain range, the hysteresis loops became wider. The plot also shows how the stress–strain hysteresis loops developed, upon subsequent unloading and reloading. The maximum tension and compression stresses at half-lifetime were reduced, compared to the first cycle, while the width of the loops systematically increased upon cycling. This was a clear visual indication of the cyclic softening of P92.
The plastic work, Wp, at half-lifetime, as a function of the total strain amplitude is shown in Figure 8, for all three temperature levels. The data suggest that there was a linear correlation with the applied total strain. The parameters for the fitted linear functions are also listed in the plot. The fitted linear curves suggest that there was an intersection point around a strain amplitude of 0.4%. For smaller strain amplitudes, the plastic work at 620 °C exceeded the corresponding values for the 500 °C and 300 °C tests. For strain amplitudes higher than 0.4%, the relation was opposite. This phenomenon could be rationalized by an interplay of reduced mechanical strength at high temperature and material softening. At 300 °C and 500 °C, the mechanical strength was higher than at 620 °C, which meant that the main part of the applied total strain amplitude could be established via elastic deformation. As a result, the hysteresis loops below 0.4% were narrow for 300 °C and 500 °C. At Δεt/2 = 0.5%, the plastic strain contributions at 300 °C and 500 °C were higher. Consequently, the hysteresis loops were wider in the x-direction and in the y-direction (due to the simultaneous increase of maximum stress). At 620 °C, the plastic strain contribution was again higher, and the hysteresis loops were broader, but the maximum stresses were now lower, due to the strong softening at this temperature level.

3.2. Lifetime Behavior of LCF-Tests

In Table 3, the lifetimes of the LCF-tests on P92 are listed, for each temperature level. As would be expected, the lifetime decreased with increasing temperatures, at the same total strain range. Within each temperature level, the lifetime decreased with a rising total strain range. The lifetime curves could be described by the Manson-Coffin Basquin relationship. It is given by the following equation [29]:
Δ ε t 2 =   σ f E     ( 2 N f ) b +   ε f     ( 2 N f ) c
The first part is known as the Basquin relationship and corresponds to the lifetime dependence on elastic strain. The second part, known as the Manson-Coffin relationship, represents the influence of the plastic strain. 2 N f is the number of strain reversals (1 cycle = 2 reversals), σ f is the fatigue ductility coefficient, b is the fatigue strength exponent, ε f is the fatigue strength coefficient, and c is the fatigue ductility exponent. The respective parameters, resulting from the present tests, are given in Table 5 for all three temperature levels. In Figure 9, the plots of both individual relationships are shown together with the total strain amplitude for all temperature levels. The values are in good agreement with the values recently reported by Zhang et al. [16]. Moreover, the values at 300 °C are in good accordance with the values at room temperature that were obtained by Zhang et al. This suggests that, at medium temperatures, no major changes in the mechanical behavior, compared to deformation at room temperature, occur.

3.3. Effect of Hold Times

Introducing periodic hold times turns a strain-controlled LCF-test into a relaxation fatigue (RF) test, which simulates the effects of combined cyclic and monotonous loads. The strain is kept constant at the maximum and minimum strain and, as exemplified in Figure 10 for the initial cycles of an RF-test, considerable stress relaxation both in tension and compression might be obtained under these conditions. In the present work, the hold time was 3 min, unless otherwise noted. The obtained (absolute) amounts of the stress relaxation are listed in Table 6. The results showed that, within tests at one temperature level, the amount of stress relaxation within the first cycle increased with the total applied strain range. With increasing cycle numbers, the stress relaxation decreased as is reflected in the smaller relaxation at N = Nf/2. Relaxation generally tended to be higher during the compressive holds than in tension. In the first cycle, the absolute differences between the amount of relaxation at εmin and εmax might reach considerable values of up to 63 MPa, in tests with low total strain range (±0.2%, 620 °C) and extended hold times of 10 min. However, this asymmetry in relaxation was only observed in the initial cycle. Already in the second cycle, the stress relaxation at εmax was almost similar to the values at εmin, for all tests. However, the values at εmax were still up to 10 MPa lower than those at εmin.
In Figure 11, the maximum stress of each cycle has been plotted for the RF-tests. Compared to the corresponding LCF-tests, cf. Figure 5, all RF-tests exhibited a qualitatively similar cyclic softening behavior. But some parameters resulted in a more pronounced softening and strongly reduced lifetime, as has been outlined in the following section.

3.3.1. Influence of Hold Times at Different Temperatures

In Figure 12a, the cyclic softening curves of three LCF-tests (one for each temperature level) and the corresponding RF-tests are plotted. At 300 °C, the LCF- and RF-test followed the same path. The corresponding values for softening ratio and lifetime are listed in Table 7. The softening ratio, as well as the lifetime (in terms of cycle number), did not significantly change as a result of the hold time at 300 °C. However, at 500 °C and 620 °C, the softening in the RF-tests was more pronounced, compared to the LCF-tests, leading to a continuously growing separation of the RF/LCF softening curves. The lifetime was not strongly affected, but the lifetime of the RF-tests was systematically lower than that of the LCF-tests. In Figure 12b, the corresponding hysteresis loops at half-lifetime are illustrated. The hysteresis loop at 300 °C showed only a very small stress relaxation (31–33 MPa), during both hold times. Apparently, the temperature was too low to cause significant effects of any time-dependent processes. In contrast, at 500 °C and 620 °C, a clearly detectable stress relaxation occurred during the hold time, due to stronger thermal activation. Relaxations of around 80 MPa (absolute) were obtained at the 50% lifetime, at both temperatures, cf. Table 6. This corresponded to relative relaxations of about 23% at 500 °C and 44% at 620 °C, since the maximum stress decreased with increasing temperature. The values for the relaxation in compression were similar.

3.3.2. Influence of Hold Times at Different Total Strain Ranges

In Table 8, the softening ratio and lifetime, as well as the lifetime ratio of all LCF- and RF-tests at 500 °C and 620 °C are listed for the different applied total strain ranges. Lifetimes (in terms of cycle number) of the RF-tests are systematically reduced, compared to the respective LCF-values. A clear dependence on imposed strain is obtained—the lifetime ratios show that, at smaller total strain ranges, the lifetime is decreased to a greater extent in the RF-tests than at higher total strain ranges. In Figure 13a, the cyclic softening curves of an LCF-test with a small total strain range and a large total strain range (solid lines), as well as the corresponding RF-test curves (dashed lines), at 620 °C, are plotted. In the RF-test with a total strain range of ±0.2% (red curves), an initial increase in maximum stress, between the first and the second cycle, occurred. It was marked by an arrow inside the figure. Consequently, the maximum stress of the RF-test remained higher than the stress of the LCF-test for the first 50 cycles, although the curve of the RF-test had a significantly higher (negative) slope than that of the LCF-test. This was also supported by the values for the softening ratio in Table 8, which were about two times higher for the RF-test. At a total strain range of ±0.4%, the maximum stress of the RF-test ran constantly below the stress of the LCF-test. Moreover, the transition to failure occurred at a lower stress in all RF-tests than in the LCF-tests. Figure 13b shows the hysteresis loops of the first cycle for all four tests of Figure 13a (presented is a full cycle, plus the loading to the second tensile strain maximum, following thereafter). Due to the stress relaxation, the hysteresis loops of the RF-tests showed an expansion in the x-direction of the diagram suggesting that the inelastic strain was larger. Again, in the diagram the initial increase in the maximum stress between the first and the second cycle, at the RF-test with ±0.2%, is marked by an arrow. The diagram also illustrates that this increase in peak stress already occurred in the preceding compression segment, where the stress minimum of the RF-test with ±0.2% was lower than the stress minimum of the related LCF-test. In conjunction with the strong relaxation, the subsequent tensile loading led to a higher maximum stress value, marked by an arrow in Figure 13b, than in the first tensile loading. An error in the strain control was excluded since the effect of the initial hardening between the first and the second cycle could be reproduced in a subsequent test with a 10 min hold time, at the same strain amplitude (Figure 14).

3.3.3. Influence of the Length of a Hold Time

In Figure 14a, the cyclic softening curves of RF-tests, at a similar temperature (620 °C) but different hold times of 3 min and 10 min, are plotted. Two total strain range levels of ±0.2% and ±0.4% were considered. The corresponding values for the softening ratio and lifetime are given in Table 9. Only little differences were obtained in the lifetime ratios for the extended hold time, yet with a clear tendency towards a stronger lifetime reduction (in terms of cycle number), at the extended hold time. In the hysteresis loops of the first cycles in Figure 14b, it can be seen that most of the stress relaxation occurred within the first 3 min of the hold time, resulting in pronounced stress drops at the extremes of the loops. Only a little further variation of the stress values was obtained at the extended hold times. For the tests with a total strain range of ±0.2%, the stress initially relaxed by 98 MPa, in the first 3 min and by another 12 MPa, between minute 3 and 10.

3.4. Fracture Characteristics

None of the presented fatigue tests was carried out to the final failure of the specimen, because after a significant stress drop of more than 75%, the specimens still did not fail. Instead, all specimens were subsequently loaded to fracture at room temperature, after the test. This needs to be considered for the analyses of the fracture surfaces.
In Figure 15 micrographs of the fracture surfaces for both the LCF- and RF-specimens, tested at different total strain ranges at 620 °C, are shown. The surfaces were oxidized and, therefore, appear dark grey and dull. On all fracture surfaces, fracture paths can be seen. The surfaces of the tests conducted at the smaller total strain range (±0.2%) still exhibit a residual fracture surface. For the LCF-specimen, the residual fracture surface lies in the upper half and covers about one-third of the entire fracture surface. For the RF-specimen, the residual fracture surface of about 12% was represented by the bright and sharply demarcated area, left from the center of the fracture surface. This is a clear indication that, for the RF-test, cracks were initiated all around the specimen surface. In contrast to the LCF-specimen, several points of crack initiation could be identified. For the LCF-tests at ±0.2%, the fracture paths led back to one point, at the surface at the 6 o’clock-position, with one exception at the 11 o’clock position, where a small residual area with a semicircular shape existed. At higher total strain range (±0.4%), the crack paths originated all around the specimen surfaces, for both tests. Especially in case of the RF-tests, the cracks seemed to start from different planes, at all strain levels. This led to rugged fracture surfaces, whereas, for the LCF-tests, the fracture surfaces were comparably smooth, at all strain levels.
The fractured surfaces were also analyzed by SEM. In Figure 16, detailed views of the crack growth zone of some specimens are shown. They exhibit the typical failure characteristics of a fatigue fracture, including fatigue striations and sometimes secondary cracking, as well as steps. Since no straight edges of the crystallites were visible, the crack propagation was assumed to be transgranular. Figure 16a,b,d shows the central part of the fractured surface. In general, in all specimens, the fracture surface edges were more severely coated with oxide layers than the center, which meant that the respective cracks were opened long before the final failure took place. An example is given in Figure 16c, in which an image taken at the edge of a fractured surface is shown. Here, the surface appeared to be very rough and coated. Furthermore, the visible steps in Figure 16c indicates that multiple cracks of the LCF-test started on different planes. On the surfaces of the samples with high total strain ranges (Figure 16b,d), periodic striations were observed. With the hold time, the distance between these striations seems to increase, as was systematically observed in different locations, all over the fracture surface. In the specimens from tests at a small total strain range, the striations could not be clearly identified, since, for example, the fracture surface in Figure 16a appeared to be more inhomogeneous and was not as smooth as the surfaces of tests with a higher total strain range. There were more steps visible indicating that the crack diverted during the propagation. All typical failure characteristics appeared to be diminished and finer.
In Figure 17, longitudinal cross-sections of the LCF- and RF-specimens tested at different strain ranges at 620 °C, are plotted. The micrographs show a representative section of the gauge length of the failed specimens; the sketch in the middle of Figure 17 indicates in which area of the specimen the micrographs were taken. The images show the polished specimens surrounded by mounting resin (in black). Based on these images, it could be concluded that higher the total strain range, higher was the number of cracks that developed. Additionally, as usual in fatigue testing, it could be concluded that the cracks initiated at the surface of the specimens. Moreover, in Figure 17c, the remaining pieces of the spot-welded thermocouple could be seen at the specimen surface, near the fracture edge. There were small cracks that initiated from the thermocouple, but obviously they did not accelerate or initiate the failure of the specimen. Comparing the LCF- and RF-specimens (see Figure 17b,d), it was obvious that in the RF-specimen, longer cracks had developed, compared to the LCF-specimen.
More detailed micrographs of these sections are shown in the upper part of Figure 18. The micrographs show that there were short cracks (up to 250 µm), as well as the long cracks (up to 700 µm). In the detailed view, it is possible to see that the cracks of the LCF-test are filled with oxides. Additionally, the oxide layer at the outer specimen surface partially spalled off. The possibility that this happened during the sample preparation could not be excluded, but the SEM micrographs below the longitudinal sections in Figure 18c,d, which show the shell surface of the specimens, indicate that the oxide layer was already missing, immediately after the LCF-test and probably spalled off during the fatigue test. Moreover, both micrographs indicate that the oxides breached out of the cracks and the surface, especially for the RF-test. The cracks of the LCF-specimen were narrow and straight with slight branching. In the RF-specimen, in addition to some short and straight cracks, very broad long and partially fork shaped cracks were present. From the two big cracks at the RF micrographs, secondary cracks had formed. These side cracks probably formed due to a strong oxidation inside the cracks, during the tensile hold time. During compressive loading, these oxides were pressed together. It seems possible that the side cracks have developed during this step. Generally, the broader cracks of the RF specimens reflected the more pronounced oxide formation in these tests of longer duration. However, the images in Figure 18, especially the area which is marked by an arrow, show that it is impossible to say if the smaller cracks were fatigue cracks which directly formed at the specimen’s surface or cracks that had formed out of an oxidation pit.

4. Discussion

4.1. Softening Behavior

In Figure 19, the softening ratio values (cf. Equation (8)) for all conducted LCF- and RF-tests at 500 °C and 620 °C have been plotted as a function of the applied strain amplitude. In the case of the LCF-tests (filled symbols), the softening ratio clearly increased with increasing strain amplitude, but with varying intensity. While a strong dependence was obvious at the lower applied strains, only a little further variation was obtained at the total strain amplitudes of 0.4% or higher, after reaching a softening ratio of about 20% (at 500 °C) and 30% (at 620 °C), respectively. As indicated by the cyclic stress response curves in 
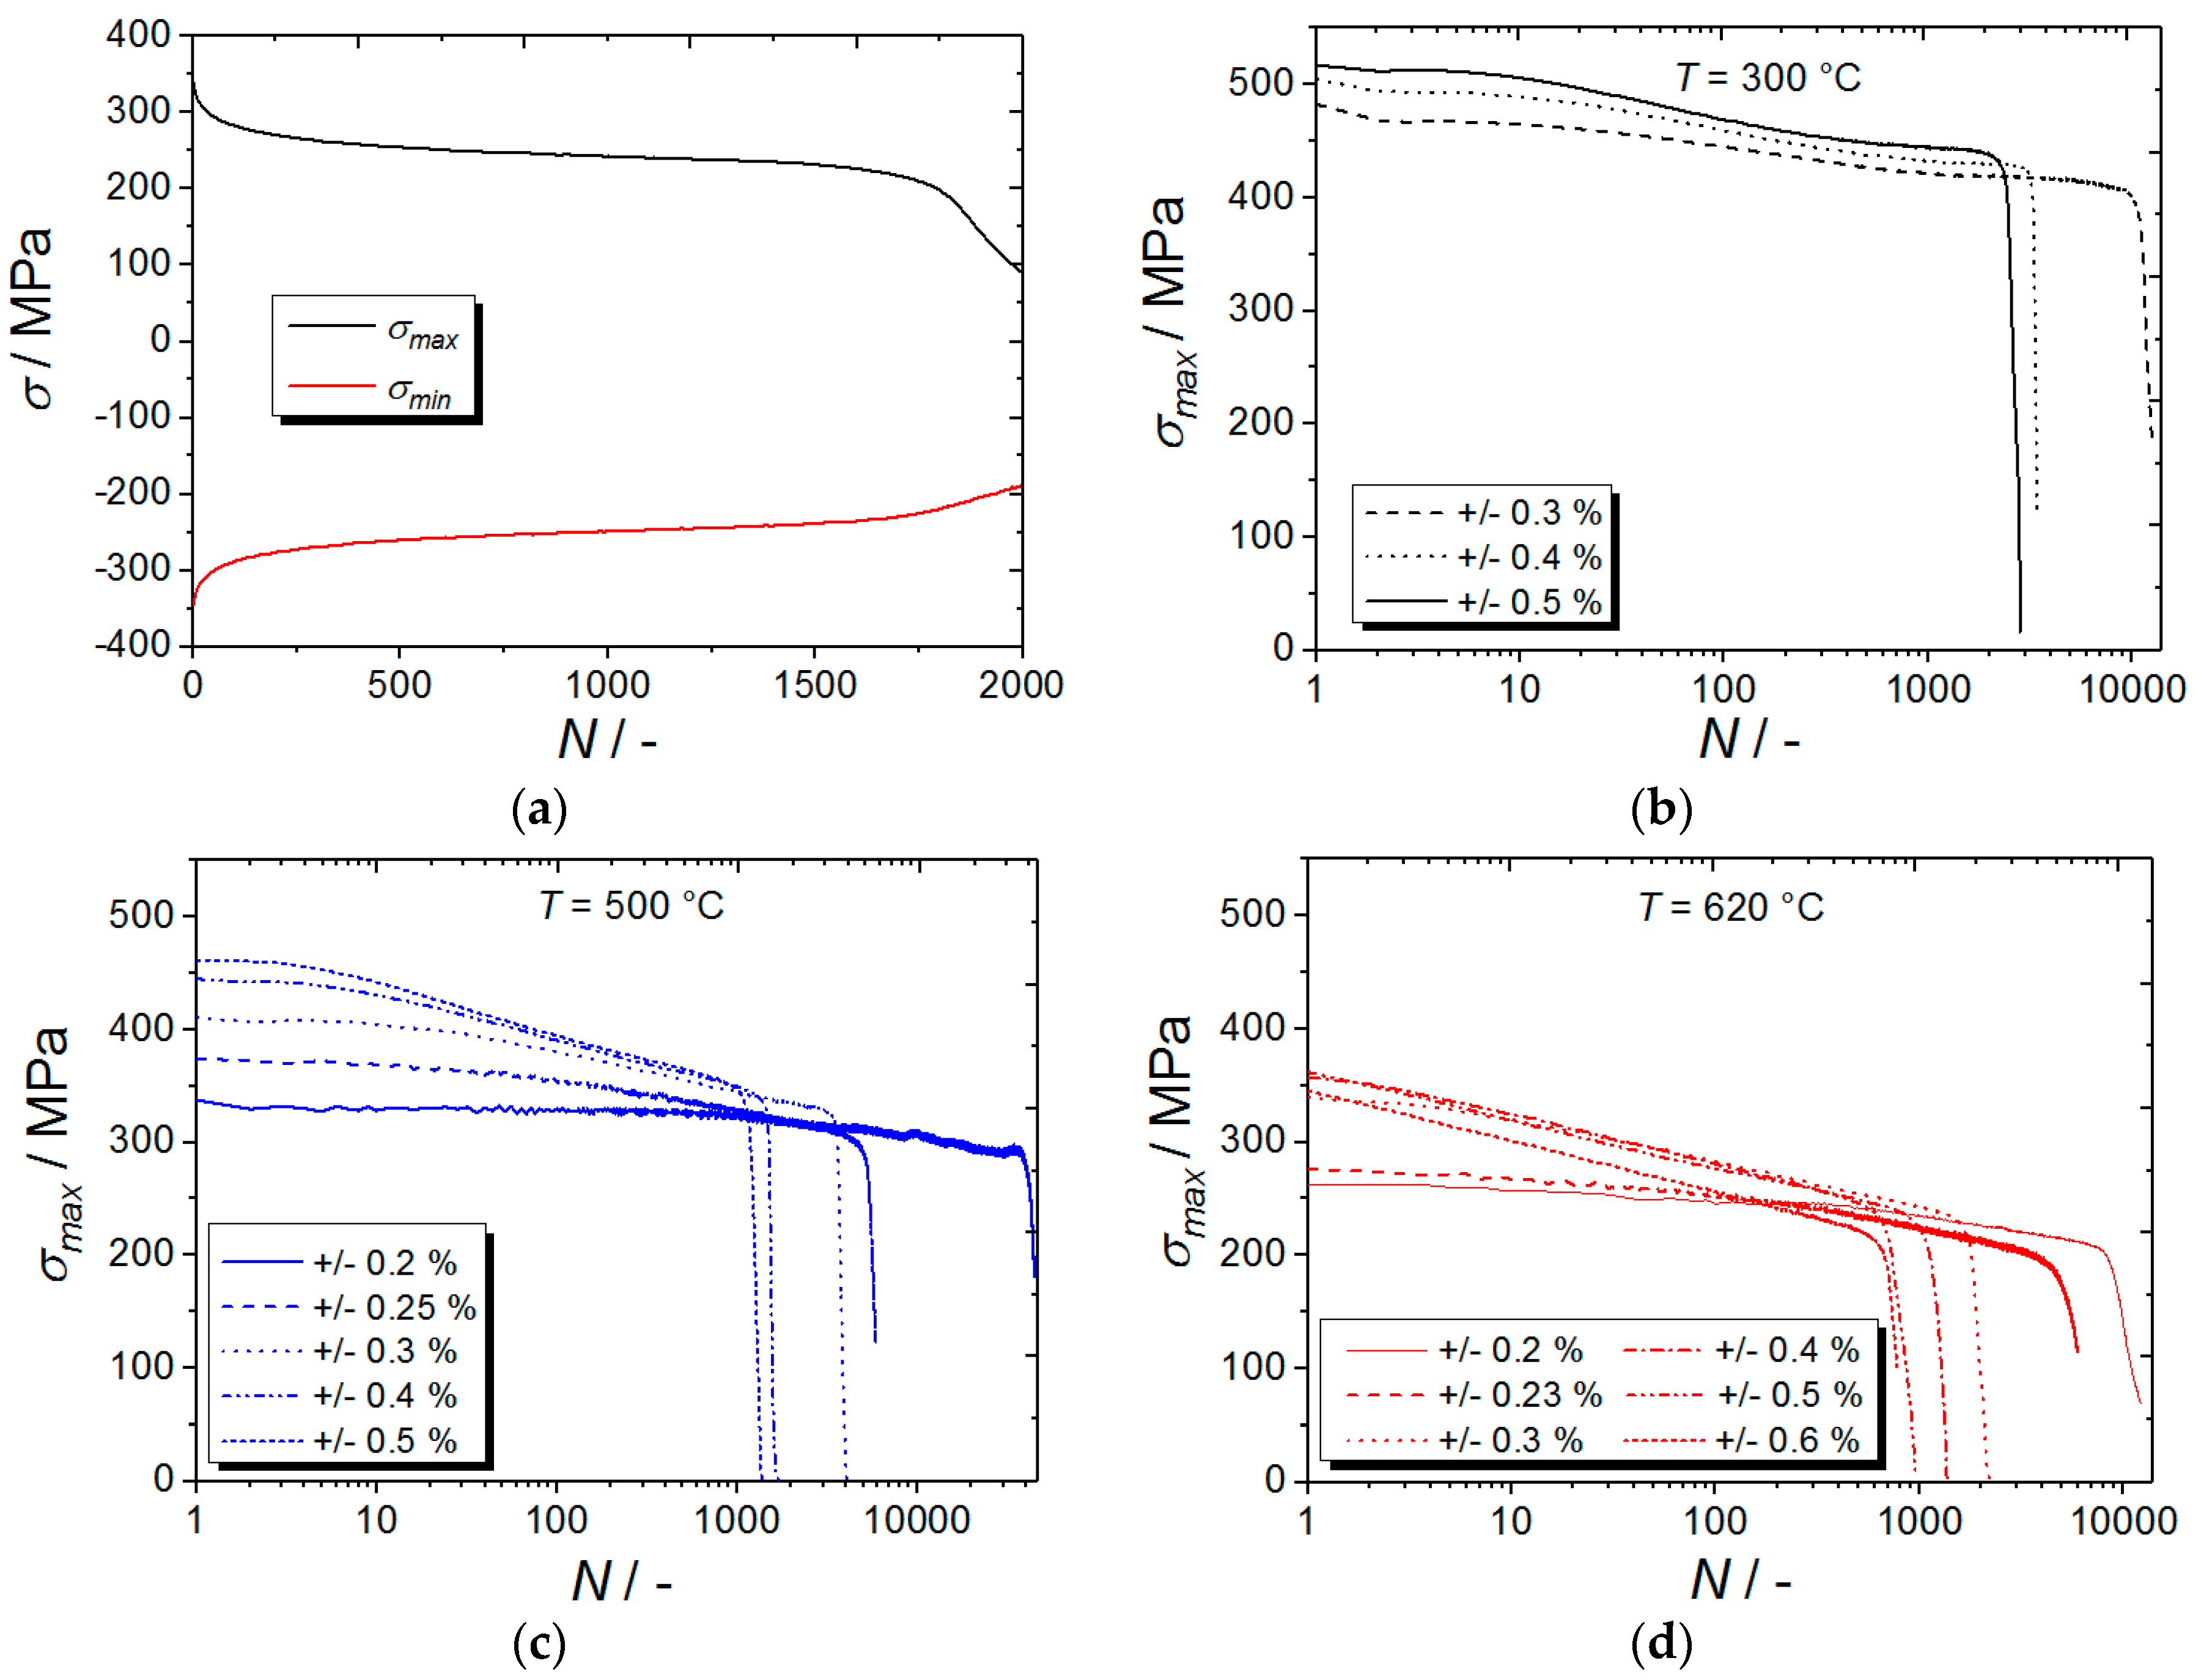
Figure 5c,d, the tests at this intermediate strain amplitude level were characterized by quite high initial stress levels. In fact, any further increase in strain amplitude led to little or no change of the observed initial maximum stress, suggesting a direct relation between this initial value and the subsequent stress evolution. This phenomenon of nearly similar maximum stresses at different (but rather high) strain amplitudes could be rationalized on the basis of the hysteresis loops plotted in Figure 7. They show that higher amplitudes forced the specimens into plastic deformation, and that this plastic flow occurred at only moderately growing stresses.
When adding a hold time (RF-tests), the softening was more pronounced, as was reflected in the softening ratio-values which were up to 20 percentage points higher than that in the continuous (LCF) tests. The RF results in Figure 19 (open symbols) suggest that, within the range of strain amplitudes employed here, the softening ratio was nearly independent of the total strain. Especially in case of the tests at 620 °C, no clear dependence could be inferred from the data, anymore. However, it should not be overlooked that the phenomenon of initial hardening (as outlined in Section 3.3.2) contributed to the softening ratio values of these tests, since the overall maximum stress was taken for the calculation of the ratio in all cases (Equation (8)). The magnitude and varying impact of the hardening effect at different strain amplitudes is best demonstrated in
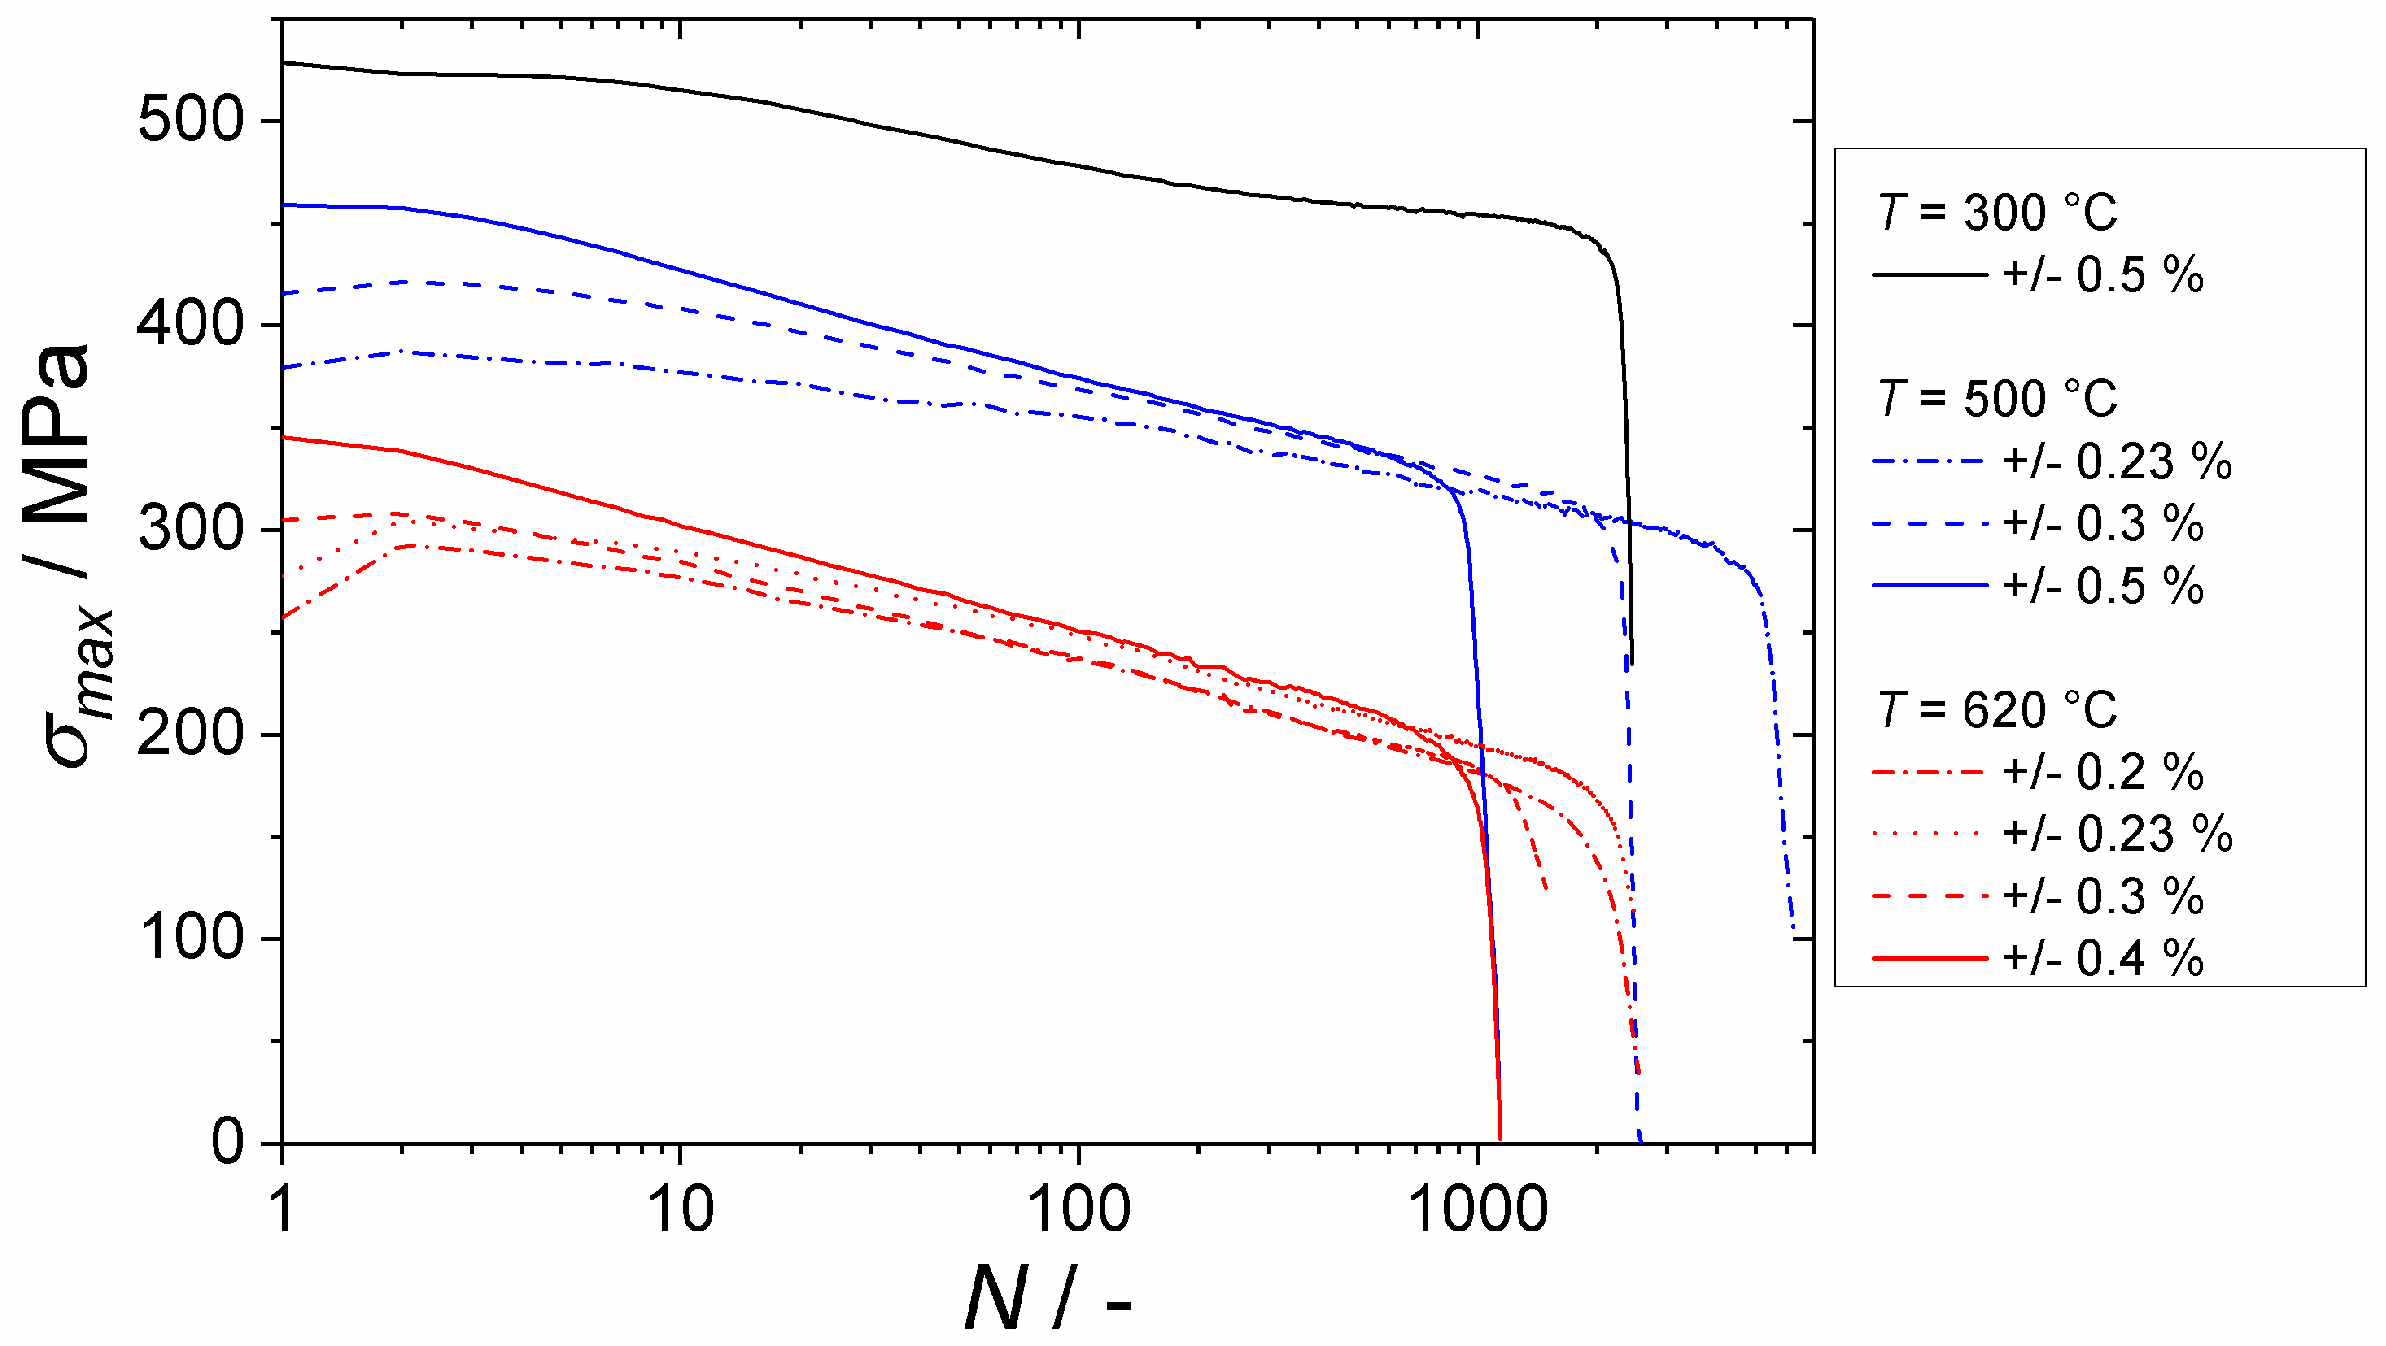
 Figure 11. At N = 1 the maximum stress was very different for the RF-tests performed at the same temperature. At 620 °C, for example, it was 258 MPa for a total strain range of ±0.2% and 345 MPa for ±0.4%. Due to the initial hardening during the first cycle of the test performed at 620 °C and a total strain range of ±0.2%, the maximum stress level of the test was raised to 295 MPa and approached the stress level of the other RF-tests performed at higher total strain ranges. From there on, a nearly similar softening trend was apparent for all tests. In other studies on ferritic–martensitic steels, e.g., [15,23], the softening ratio was often calculated on the basis of the maximum stress of the first cycle, neglecting the possibility that the global maximum stress was reached in a later cycle. If the maximum stress of the first cycle is taken for calculation, the softening ratio, in the present work, would result in values of 29.9% (for the RF-test at 620 °C and ±0.2%) and 31.1% (at 620 °C and ±0.23%). Returning to Figure 19, these values would represent a softening to strain amplitude dependence that would be more similar to the curves of the LCF-tests. The real material behavior under a combined static and cyclic loading, which is obviously a result of a competing hardening phenomenon, Figure 11, and pronounced softening, Figure 13a, would however, not have been recognized.
This leads to the question of why the initial hardening took place at smaller strain amplitudes. The hardening already occurred within the first cycle—after the first (tensile) hold time, a higher stress value in the compression was reached, Figure 13b. A hardening also occurs during the first stage of a creep test on ferritic–martensitic steels [30]. In these tests, the specimen was subjected to a constant stress and through solid solution hardening (W, Mo) and precipitation hardening (M23C6, MX, Laves-phase) the microstructure was stabilized [31,32]. Moreover, during the primary creep, an increase of the dislocation density due to deformation takes place, which results in a hardening. Similar mechanisms might also cause the short initial hardening in the RF-tests. The hold time resembles a creep deformation (elastic strains are substituted by creep strains, see discussion below) and, therefore, similar microstructural changes could take place. After the first tensile hold time, the strain at σ = 0 was 0.1% for the RF-test with ±0.2%, at 620 °C. To compensate for this extension, the material underwent a stronger deformation when switching into compression. Consequently, a higher stress value was reached. In the RF-test with ±0.4%, the specimen also exhibited a remaining deformation (0.28%) when unloading to σ = 0. In addition to that, at higher strain amplitudes (>0.3%) hardly no dependence of the maximum stress on the applied strain existed anymore (see Figure 12b and Figure 13b). Therefore, in Figure 13b, despite the following strong deformation during the compression, plastic deformation occurred only at moderate growing stress. Consequently, the LCF- and RF-tests with ±0.4% reached the same minimum stress level, in contrast to the LCF- and RF-tests with ±0.2%.
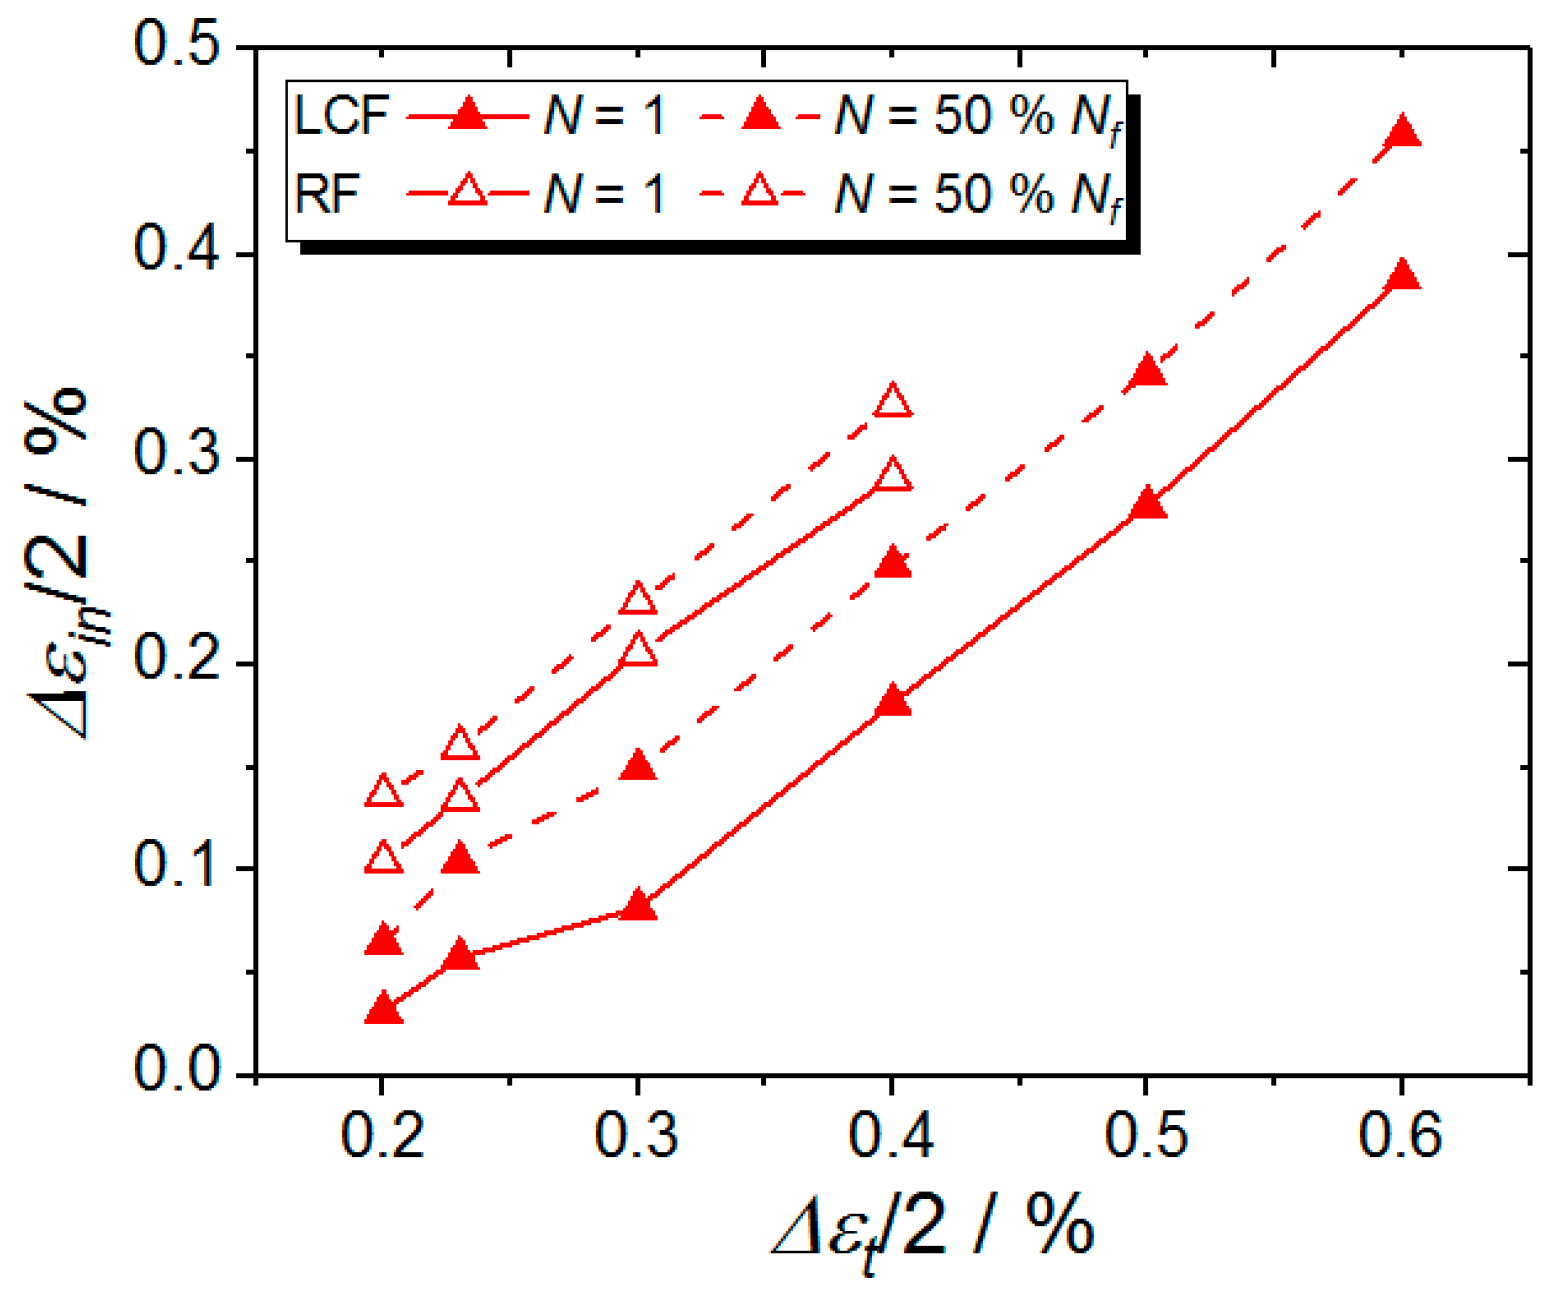
During the hold time of an RF-test, a stress relaxation occurs and elastic strains are substituted by creep strains. With the development of creep strains during the hold time, the inelastic strain, being the sum of plastic strain and creep strain (Equation (6)), also increases. This increase in inelastic strain has been illustrated in Figure 20, where the inelastic strain amplitude for the first cycle (solid lines) and the cycle at 50% of lifetime (dashed lines) was plotted as a function of the total strain amplitude for all the LCF- and RF-tests, at 620 °C. Both in the LCF- (full symbols) and the RF-tests (open symbols) the inelastic strain amplitude increased between the first cycle and half-lifetime. The reason for this was the pronounced softening that occurred in both test types. When assuming constant elastic material properties in a first-order approximation, the continuously decreasing stresses resulted in similarly lower elastic strain contributions while the total strain limit was kept constant. The material, therefore, underwent more and more plastic deformation during a cyclic test. This also meant that the softening ratio and the increasing inelastic strain were closely linked, which could be shown by further evaluating the data in Figure 20. For the LCF-tests, the increase of inelastic strain amplitude between the first cycle and the cycle at 50% lifetime was constant, with an absolute value of 0.07%, for a strain amplitude of 0.3% and higher, whereas, at the lower strain amplitudes of 0.23% and 0.2%, it was considerably smaller. The same applied for the values of the softening ratio (Figure 19) as described in the previous paragraphs. For the RF-test, the increase of inelastic strain amplitude during the first half of lifetime was smaller than that of the LCF-test, although the inelastic strain level was generally higher. The increase was identical (0.03%-points) for all RF-tests, at different strain amplitudes, which was again in line with the constant softening ratios given in Figure 19. No larger increase was obtained, since the initial inelastic strain amplitude for the first cycle of the RF-tests already included the increase of inelastic strain, which was created during the hold time. Between N = 1 and N = 50% Nf, the composition of the inelastic strain changed for the RF-test. The creep strain which was accumulated during each hold period decreased (due to the generally lower stress level), while the plastic strain increased due to the softening process, as outlined before. Therefore, the inelastic strain did not increase as strongly as could be expected, due to the high softening ratio values of almost 40% (Figure 19). In other words, the increase of plastic strain was compensated by the decrease of the creep strain.
The results regarding the lifetime, softening ratio, and maximum stresses of the LCF-tests were in a good agreement with the results obtained by Zhang et al. [23] and Wang et al. [
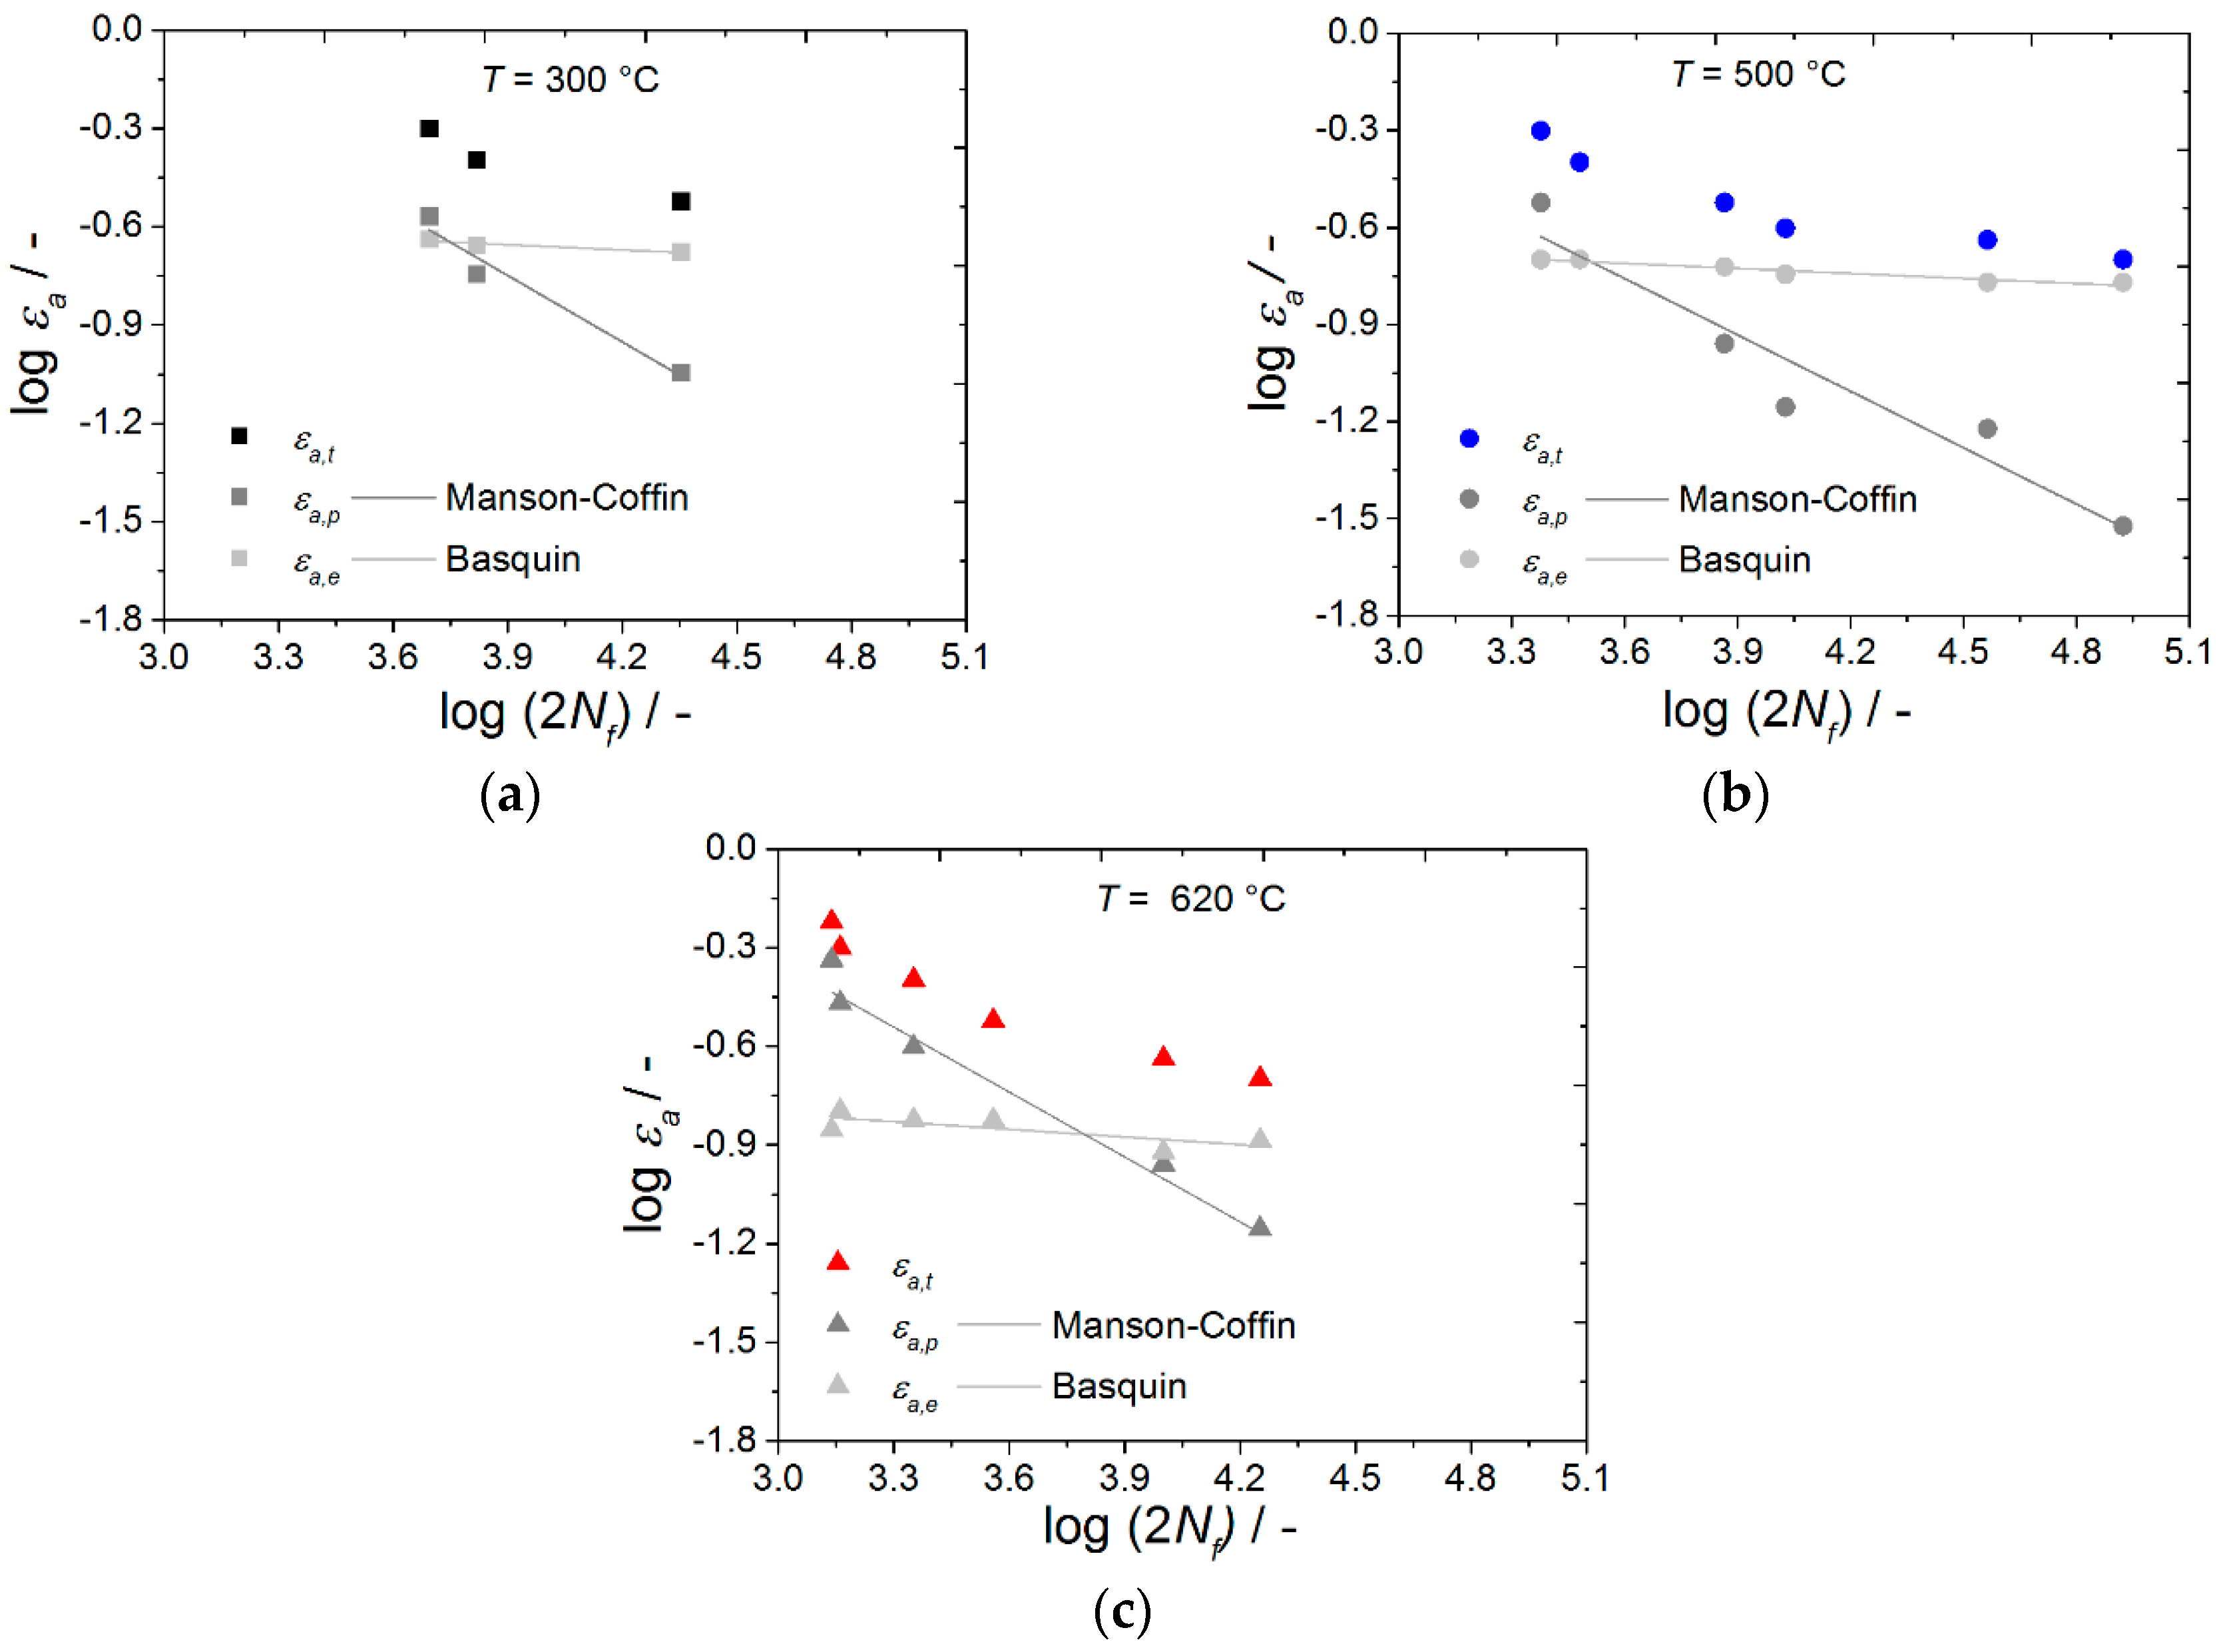
15]. It should be mentioned that the tests results of the LCF-tests at 300 °C, in this work, were similar to those obtained at room temperature by Zhang et al., which showed in the values of the softening ratio and the constants of the Basquin Manson-Coffin relationship. Literature findings on the behavior of P92 under combined static and cyclic loading, and especially regarding the softening characteristics under these conditions, are rather scarce. Moreover, they appear to be partly in disagreement with the current findings. In fact, the cyclic softening results recently published by Gopinath et al. [19] explicitly suggest similar softening behavior during the LCF- and RF-tests at 600 °C, while the present work showed that clear differences in the softening behavior could be identified, e.g., in Figure 13a. However, the results of Gopinath et al. were obtained at only one rather high strain amplitude level (±0.6%). The results obtained at higher strain amplitudes, in this study, had also shown no dramatic influence of hold times on lifetime. Only when also considering small strain amplitudes, the influence on softening behavior can be studied in detail. Therefore, our results clearly demonstrate how important it is to consider small strains, and also because they are more realistic during the operation of a real power plant.
The cyclic softening of the ferritic–martensitic steels is attributed to the changes in the microstructure. After the initial heat treatment, a high dislocation density exists in the initial material condition. The rapid softening during the first loading cycles is, therefore, often attributed to a decrease of free dislocation density [6,17,33]. Especially at high temperatures, a microstructural recovery due to thermally activated deformation mechanisms, such as dislocation climb, cross-slip, and thermal recovery, may be expected [23]. The recovery results in the formation of a sub-grain structure, where the dislocations get arranged in cell walls [34]. Consequently, the dislocation density inside the grains declines. Moreover, upon mechanical cycling, the low-angle boundaries might disappear and, therefore, the initial lath structure coarsens [35]. However, this trend is partly counterbalanced by opposite effects—subgrains are typically not free of dislocations since they may get pinned by small and homogeneously distributed precipitates inside the subgrains [19,23]. Shankar et al. [33] reported that the application of a hold time promotes the formation of subgrains. Moreover, hold time tests also promote coarsening and morphological changes of carbides. This subgrain and carbide modification underlines that a unique and fast microstructure evolution might be obtained in the case of RF-testing, thereby, justifying the present finding of different softening behaviors in the LCF and RF experiments.
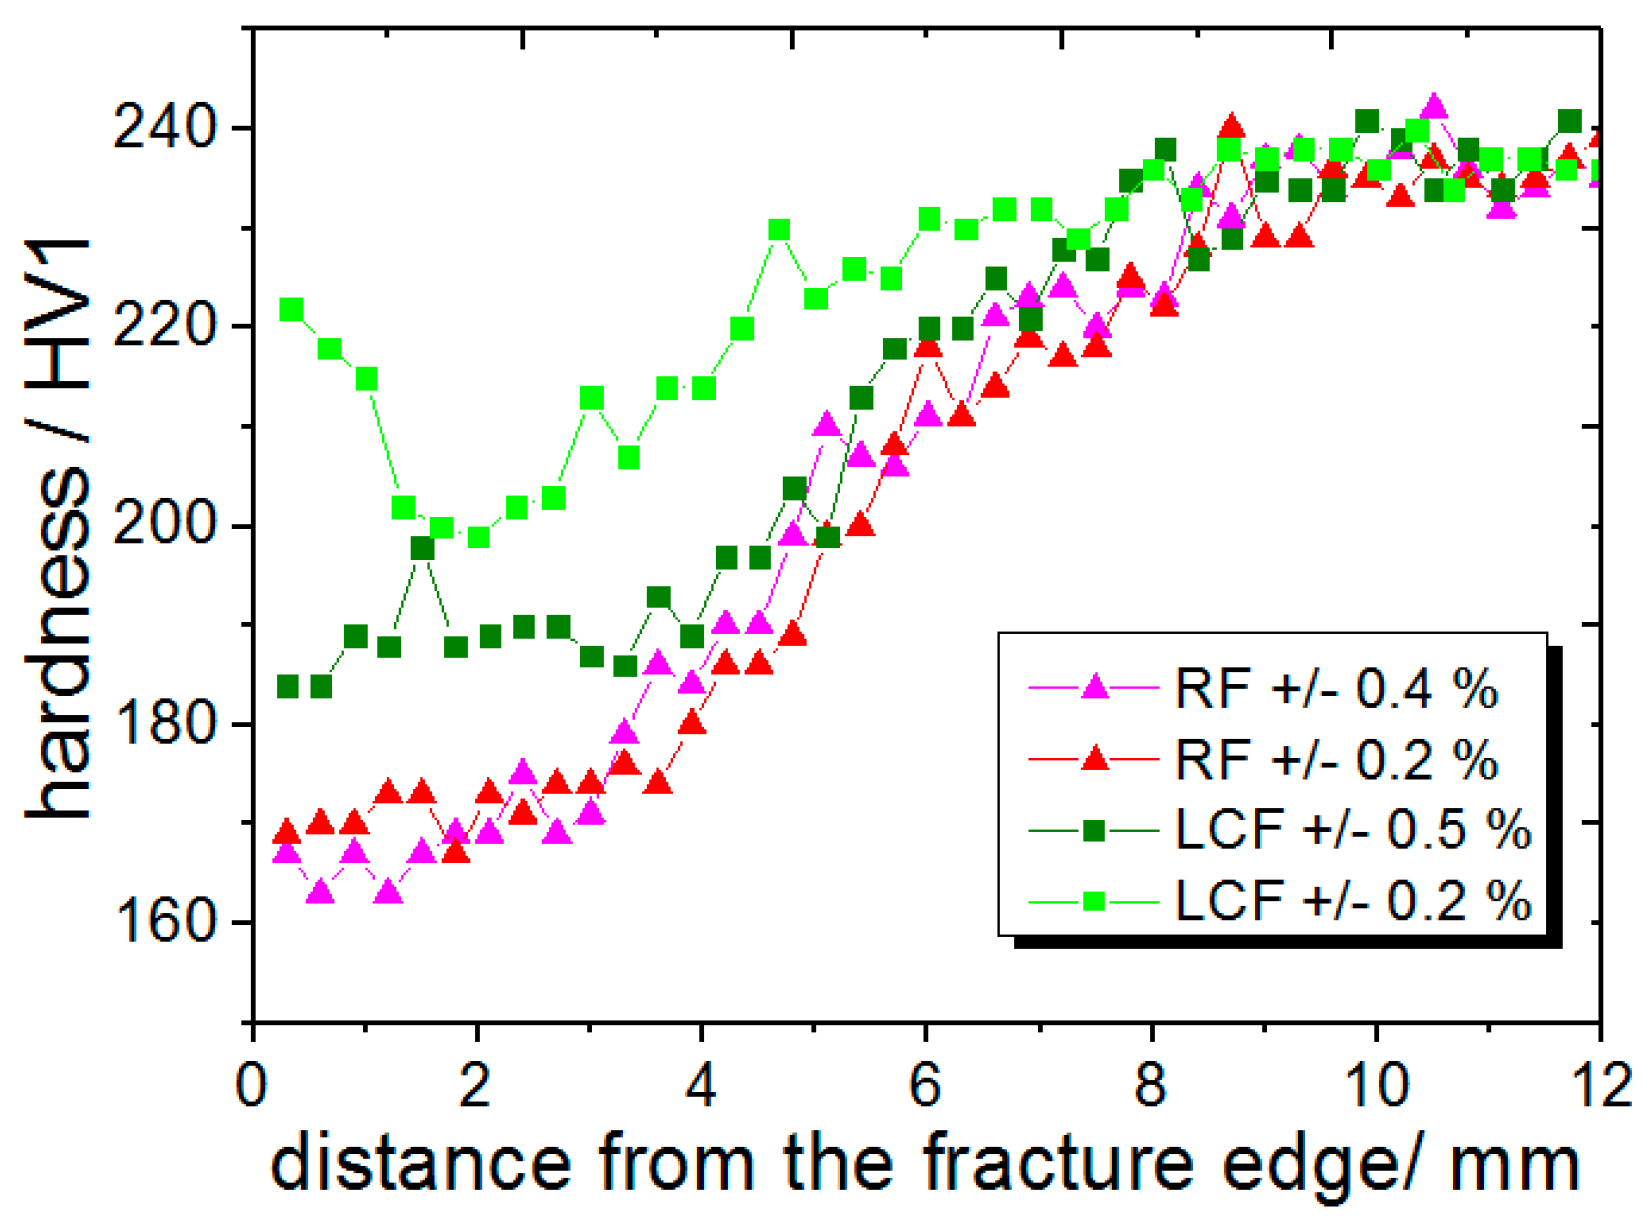
The microstructural changes which possibly represent the origin of the softening phenomenon might also be characterized by means of (micro) hardness measurements. The hardness was measured at the longitudinal sections of the failed specimens. In Figure 21 the course of the hardness from the fracture surface of the fatigue specimen to the end of its gauge length has been plotted for the different LCF- and RF-tests. For the first 4–5 mm distance, the hardness values were constantly low, except for the LCF-specimen tested at ±0.2%. It is very likely that the largest softening had taken place in this region. Then, with an increasing distance from the fracture surface, the hardness increased, eventually reaching a common value which corresponded to the original hardness in all specimens, at a position close to the end of the gauge length, right before the onset of the transition zone to the specimen head. The general shape of the hardness profiles was probably related to the corresponding temperature profiles in the specimens. The temperature was controlled at the center of the specimen and up to ±5 mm distance from the middle. After 5 mm, i.e., outside the controlled region, the temperature continuously decreased, due to the heat flow into the applied water-cooled grips. With decreasing temperature, the softening also decreased, as might be assumed from the data in Figure 19. The hardness level of the RF-tests was the lowest within the first 5 mm distance, which was consistent with the more pronounced softening in the tests with hold time. Additionally, for both RF-tests with higher and lower strain amplitudes, not only the hardness levels but also the softening ratio (Figure 19) were similar. This indicated that in all RF-specimens of the present study the microstructure might have evolved towards a similar condition. Moreover, the lower hardness of the RF- vs. LCF-specimens indicated that a coarser microstructure with less subgrains might have been present in the RF-specimen, since the subgrain walls, which consisted of arranged dislocations, were one of the hardest regions of the microstructure and would reduce the plastic flow during the hardness testing. For the LCF-tests, the hardness values seemed to depend on the applied strain amplitudes, with a trend towards a softer material condition, at a higher applied strain. For the test with a total strain range of ± 0.2%, the hardness first decreased and then increased after passing the 4 mm position. To ensure validity of this particular result, the hardness profile measurements were repeated both at a different place on the same surface, as well as after re-polishing the cross-section’s surface. The same trend of hardness was obtained in all measurements, indicating that the microstructure softening might be rather inhomogeneous at the smaller strain amplitude. The need for a more detailed microstructure characterization to fully rationalize this finding was acknowledged.

4.2. Lifetime Behavior

In Figure 22, the lifetimes of all conducted tests were plotted as a function of the applied strain amplitude. Like generally known, lifetime decreased with increasing strain range and temperature. The addition of a hold time might reduce the lifetime drastically. The reduction of lifetime, firstly, depends on the temperature. According to the rule of Tammann, a transition from time-independent to time-dependent processes takes place at a temperature of T > 0.4 · Tm (Tm = melting temperature in K) [36]. At 300 °C, no lifetime reduction due to holds could be identified, based on the limited available data. Additionally, nearly no stress relaxation occurred during the hold time, Figure 12b, which meant that nearly no additional inelastic strain, in the form of creep strain, developed. In contrast, at 500 °C and 620 °C, a stress relaxation associated with the development of creep strains was detected. Interestingly, there was only a slight lifetime reduction due to hold periods for tests at higher total strains. This observation suggests that the development of creep strains did not cause a reduction in lifetime under all loading conditions. An extension of the hold time from 3 minutes to 10 minutes only led to a small but further reduction in lifetime.
The stronger reduction of lifetime at small strain amplitudes was possibly related to the more pronounced softening, as described in the previous chapter. At small strain amplitudes (620 °C), the softening ratio increased the most, compared to the LCF-tests (cf. Figure 19) and, similarly, the greatest influence on lifetime was obtained at ±0.2%, in Figure 19. The following considerations might explain the high hold-time-related reduction of lifetime at low strain amplitudes. In Figure 23. the composition of strain amplitude has been illustrated for the first cycle and the stabilized cycle (which is at half-lifetime), for the LCF- and RF-tests, at a small and a large strain amplitude. As a consequence of the hold time, all RF-tests exhibited a higher inelastic strain fraction than the corresponding LCF-test. Without a hold time at a total strain range of ±0.2%, there was a fraction of 16% of inelastic strain at N = 1, whereas, the fraction was 52% in the RF-test with hold time. This means that due to the hold time, the inelastic strain was 3.25 times higher in the RF-test than in the LCF-test. For the total strain range of ±0.4%, the inelastic strain fraction for the LCF-test was 45%, in the first cycle, significantly greater than that for ±0.2%. The hold time resulted in a 1.6 times higher inelastic strain for the RF-test in the first cycle—which was a much lower variation—than that for ±0.2%. This more prominent increase of the fraction of inelastic strain at small strain amplitudes could be a reason for the strong lifetime reduction due to hold time, at low strain amplitudes. Since inelastic strain is directly related to microstructural recovery (as discussed above), hold times at small amplitudes result in a more pronounced/accelerated microstructure modification. The respective values obtained at 50% Nf suggest that the higher level of inelastic strain in the RF-tests was indeed maintained throughout the tests, until fracture. The share of the inelastic strain grew with cycle number in the four experiments displayed in Figure 23. Nevertheless, the inelastic strains of the LCF-tests at 50% Nf did not even reach the level of the first RF cycle, despite their much higher number of accomplished reversals at half-lifetime.
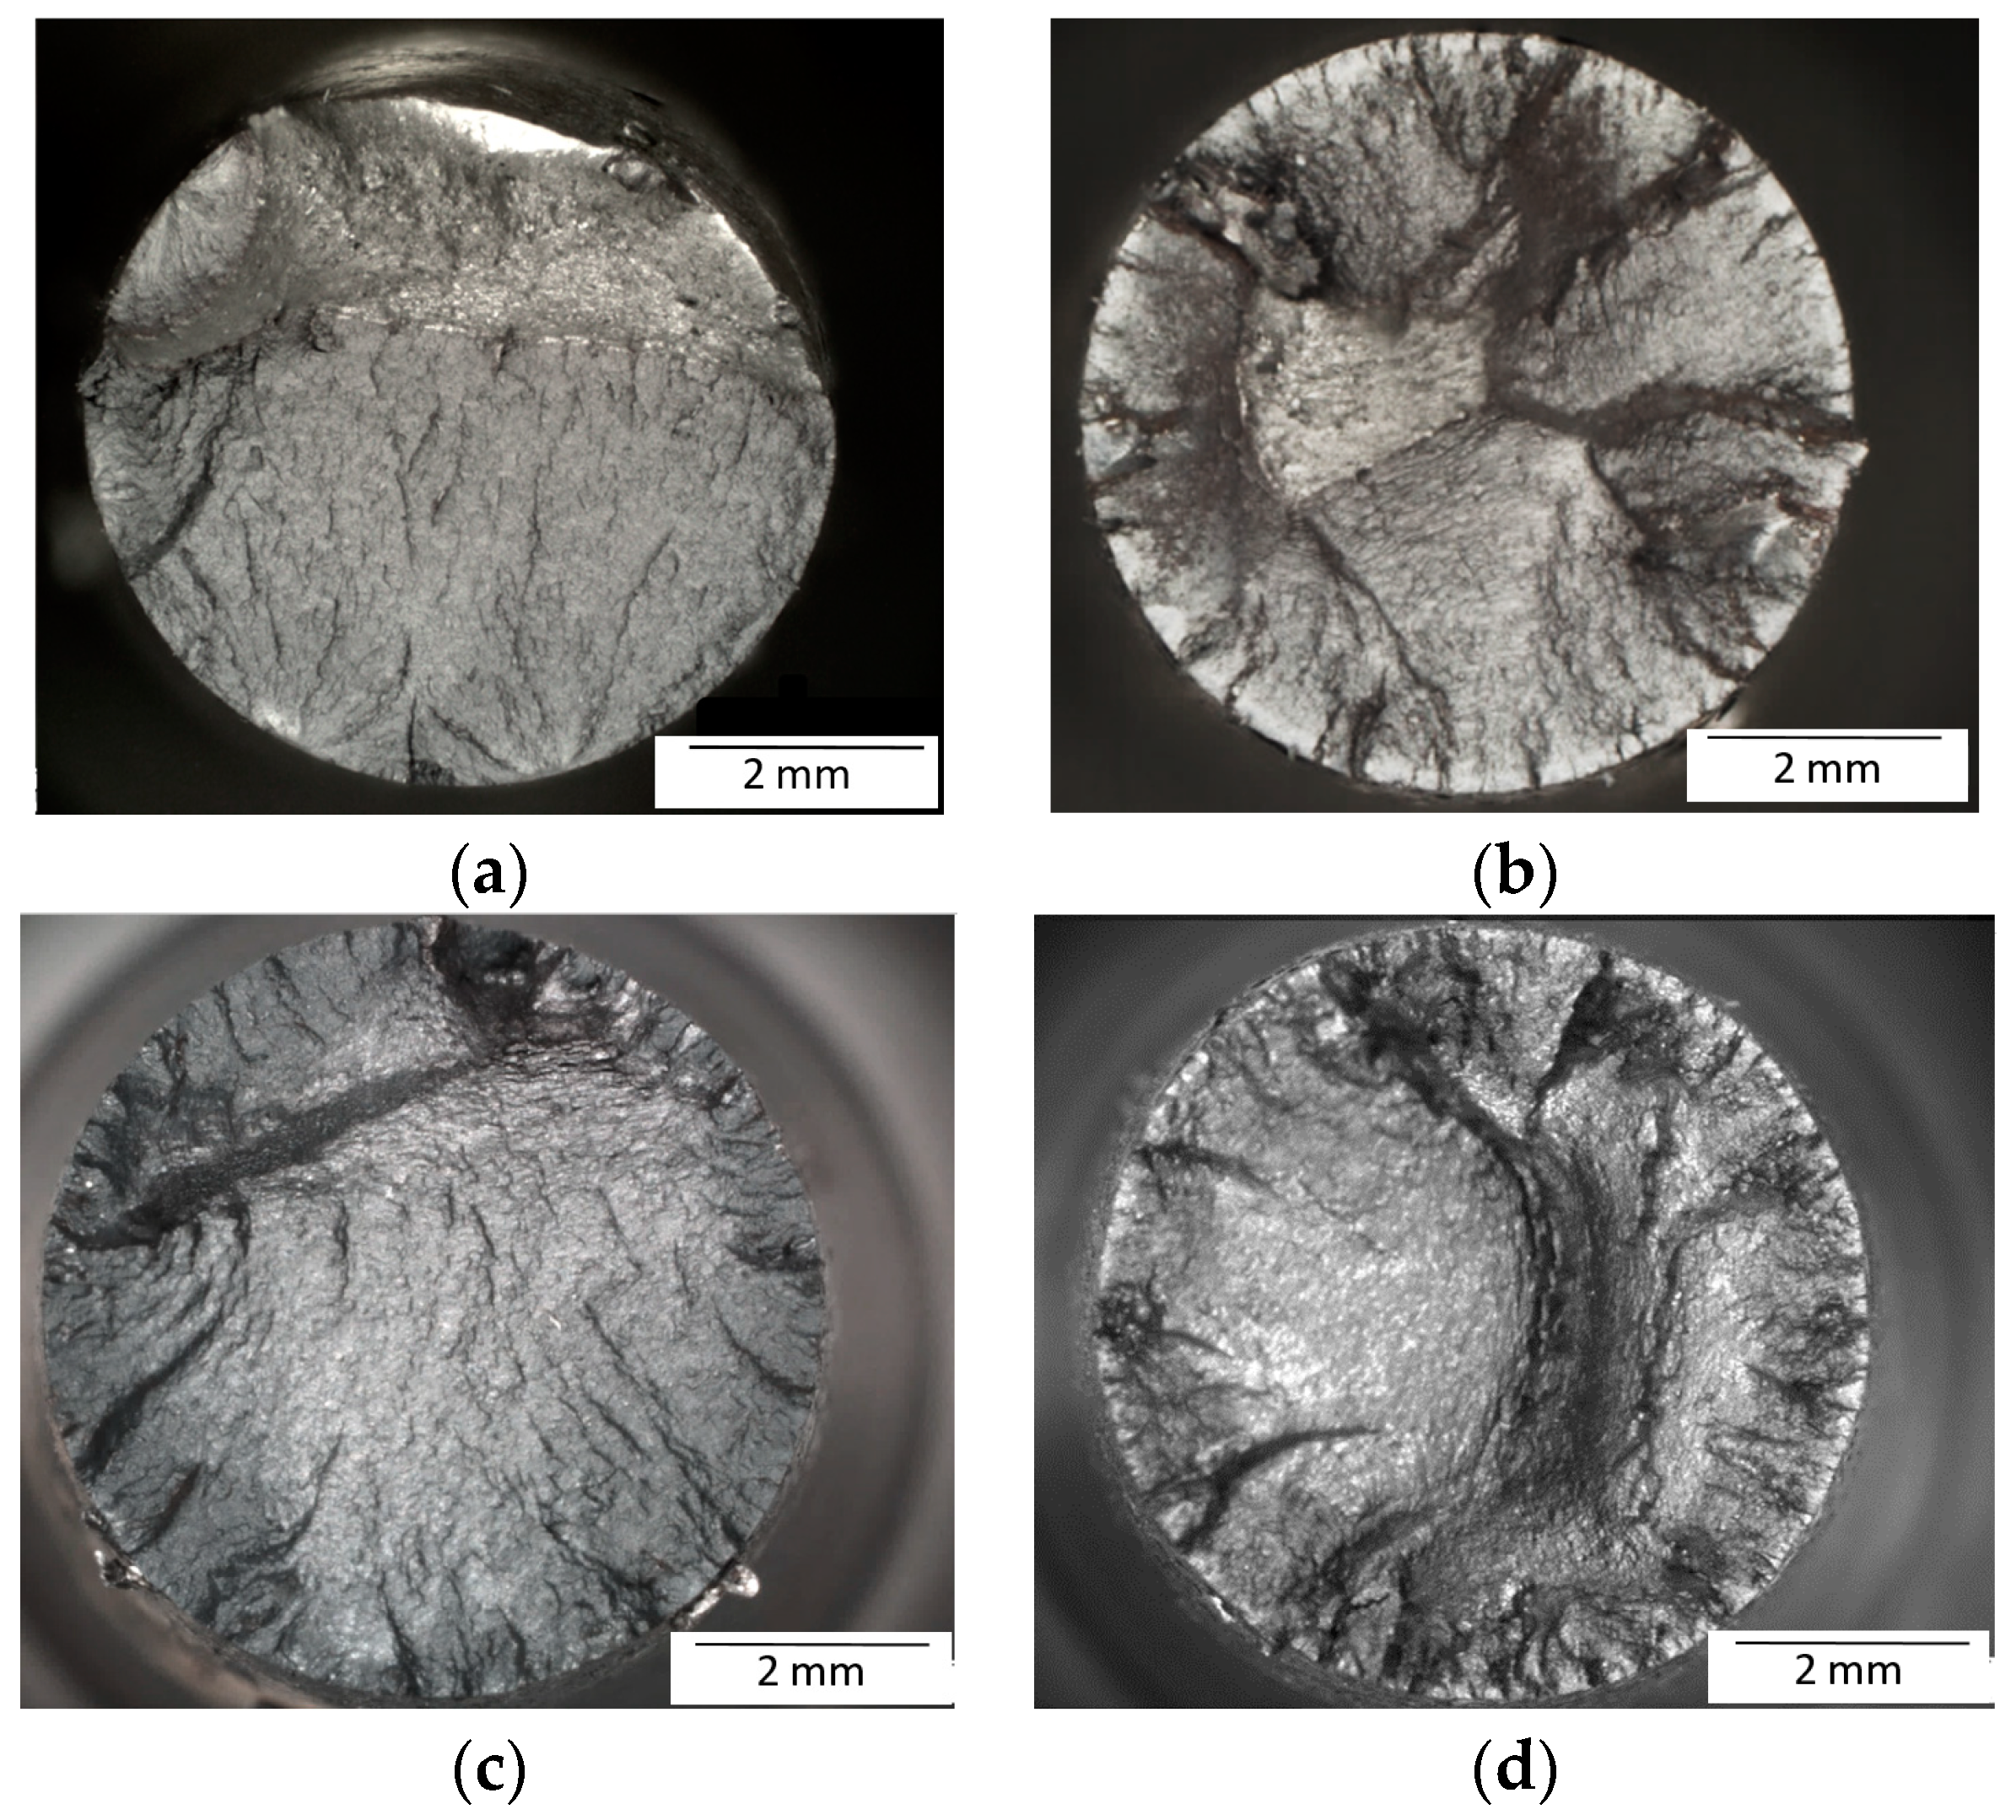
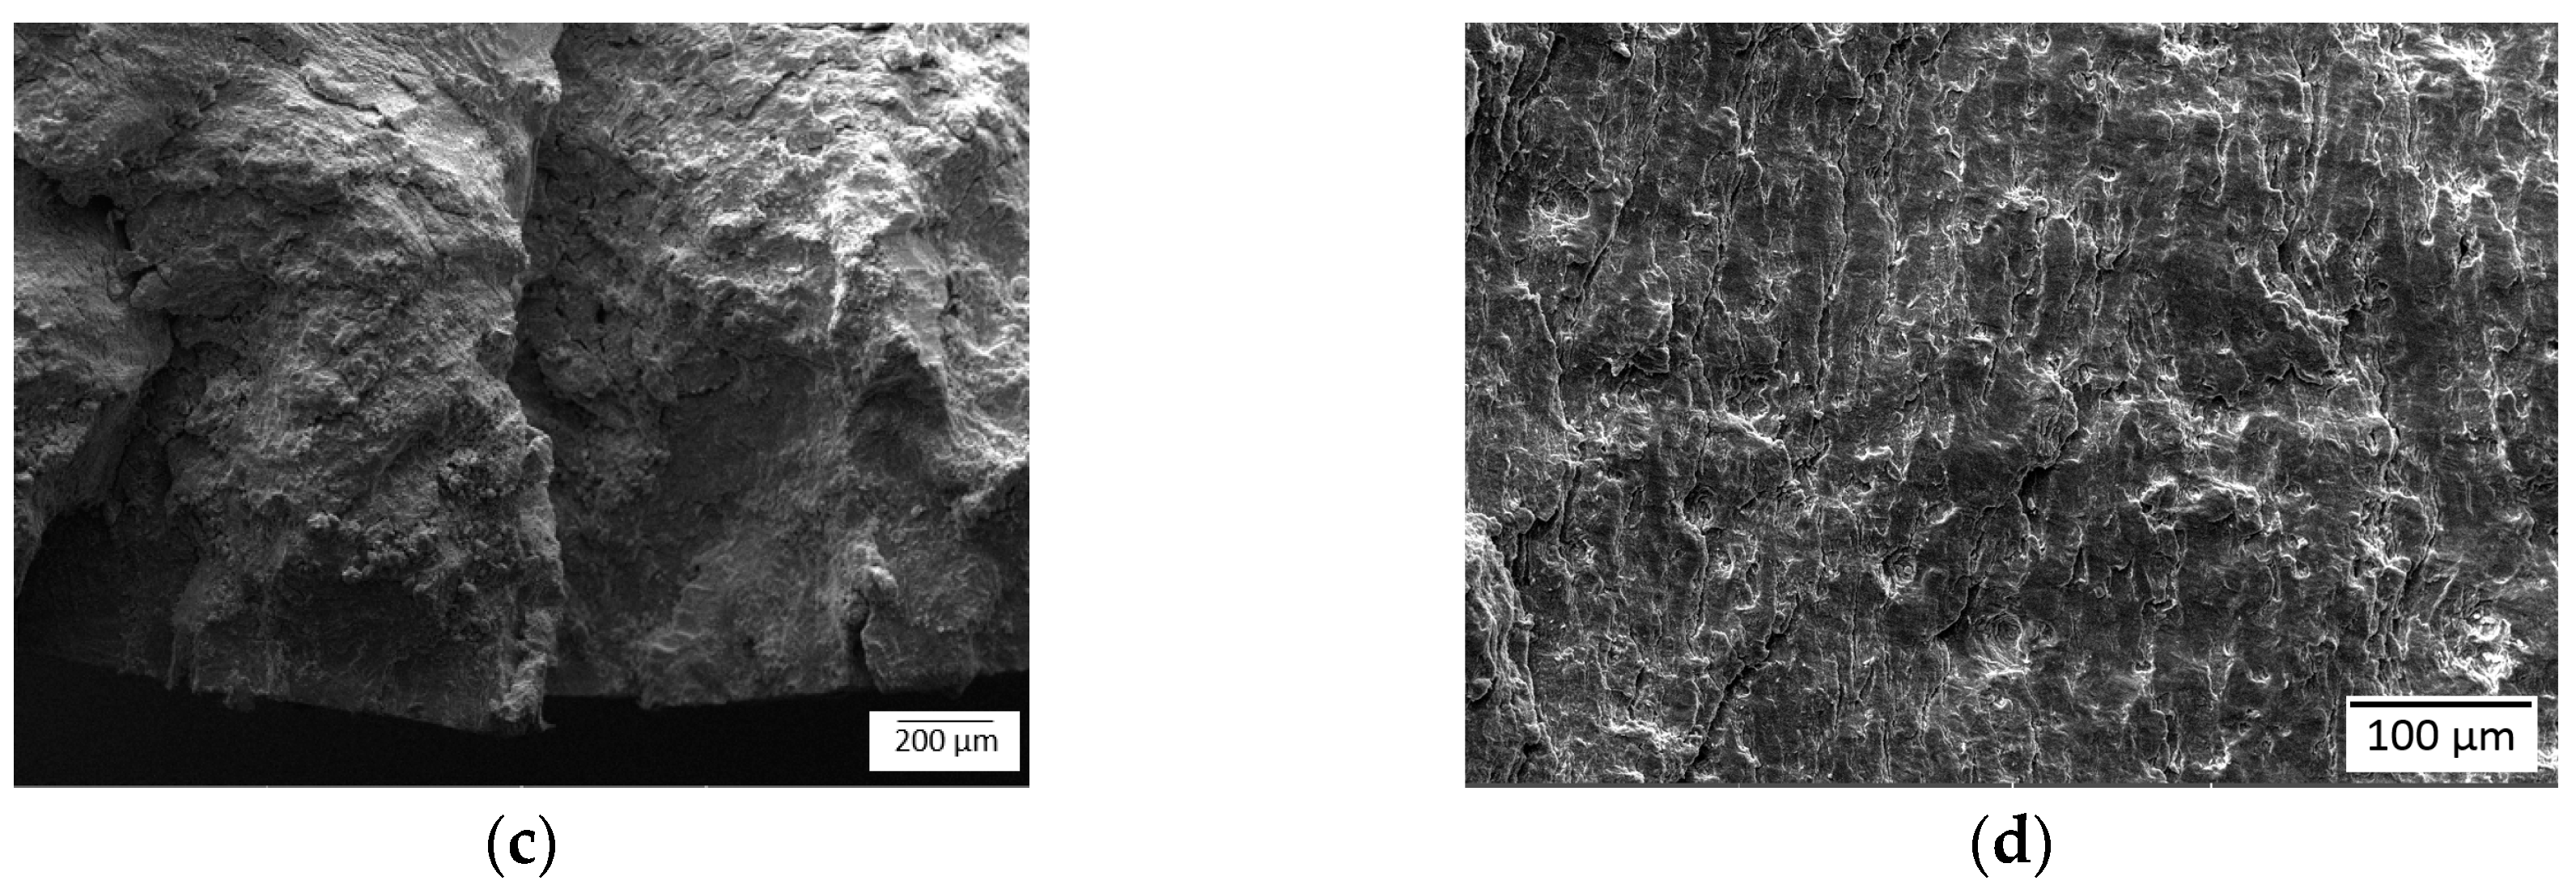
The fracture surfaces of the specimen did not show any evidence for a creep damage, such as intergranular crack growth or the formation of pores. Additionally, no mix of transgranular (fatigue damage) and intergranular (creep damage) crack growth was found. A possible explanation is that the strain rate of the conducted tests was too high. According to Skelton et al. [37], only at small enough strain rates, creep damage might become predominant. However, a significantly higher number of cracks was found in the RF-specimens which were exposed to static loading phases. With more cracks, it might be expected that the RF-specimens would already fail earlier at a higher stress level than the LCF-specimens. This did not agree with the observation that in RF-tests, the transition from gradual lowering of the maximum stress to a sudden decrease at the end of the cyclic softening curves (Figure 13) occurred at a lower stress level than that in the LCF-tests. Therefore, it is tempting to assume that the more pronounced softening is a direct mechanical consequence of more cracks that developed during the RF-tests which reduce the load-carrying cross section of the specimen.
On the other hand, there are some facts that seem to disagree with this interpretation, First, the micrographs of Figure 17 indicate that more cracks developed during the RF-tests at higher strain amplitudes, but since the softening ratio of all RF-tests at 620 °C (Figure 19) was the same, the number of cracks should be similar. Second, the hardness profiles in Figure 21 suggest a lower hardness for the RF-specimen. This lower hardness could not result from cracking, since an unaffected central cross-section (not the outer shell) was investigated. Third, if more cracks would reduce the load-carrying cross-section of the specimen, an asymmetry in tension and compression (when the cracks were closed) would be the result, which was not the case. Therefore, the lower hardness at the RF-tests was apparently related to microstructure modification and not to the formation of multiple cracks.
In conclusion, the more pronounced softening under the RF conditions can mainly be attributed to changes in the microstructure. The dislocations are rearranged in a lower energy configuration, such as cells and subgrains [38]. It is important to consider that the test duration of the RF-tests was longer, although lifetime in terms of number of cycles was less than that in the LCF-tests, Table 3. During these far longer tests (e.g., T = 620 °C, ±0.2%: LCF = 19.8 h, RF = 209.6 h), the enhanced (time-dependent) dislocation rearrangement result in a more pronounced softening. Considerable mechanical stress is, however, a second prerequisite to allow for this microstructure evolution in the ferritic–martensitic steels, since it acts as the primary driving force. The finding that 10 min hold times did not considerably change the material reaction, compared to the tests with only 3 min hold times (Figure 14), indicates that the remaining stresses after 3 min were already insufficient to stimulate further short-term microstructure evolutions even though they still exceed the 150 MPa level, Figure 14b.

5. Conclusions

A series of strain-controlled LCF tests in the temperature range of 300 °C to 620 °C and total strain ranges ±0.2%–±0.6% were carried out on the ferritic–martensitic grade P92 steel to assess its fatigue behavior. In a second step, hold times under strain control were included into the test procedures to simulate superimposed static and cyclic loading. The following conclusions can be drawn:
  • P92 exhibits pronounced cyclic softening during fatigue loading. Its amount is increasing with increasing temperature and total strain. The softening depends on the maximum stress. It reaches a saturation at higher total strain amplitudes (>0.3%).
  • Hold times enhance cyclic softening. At small total strain amplitudes (<0.3%), tests with a hold time show an initial hardening. This results in the same pronounced softening as in RF-tests with high total strains (>0.3%). A new definition for the softening ratio was therefore proposed in which the initial maximum stress σ0 is replaced by the overall maximum stress σmax.
  • The influence of hold times on lifetime depends on temperature and strain amplitude. At 300 °C, no significant influence on lifetime is observed. At 500 °C and 620 °C, the influence on lifetime depends on the strain amplitude. At smaller and technically most relevant total strains of 0.2%, the lifetime is strongly reduced.
  • Hold times modify the damage mechanisms of ferritic-martensitic steels; a clear trend to multiple cracking and oxidation-related crack propagation is obtained. However, the number of cracks could not be related to the softening and lifetime behavior. Instead, these characteristic features depend on fatigue-related modifications of the ferritic-martensitic microstructure.
To extend the investigations towards even more realistic service conditions for flexible power plant operation including cyclic temperature variation, the thermomechanical fatigue (TMF) behavior of P92 will be studied in future work.

Author Contributions

Conceptualization, M.J., J.O., and B.F.; Funding acquisition, J.O.; Investigation, M.J.; Writing—original draft, M.J. and J.O.; Writing—review and editing, B.F., and B.S.

Funding

This research was funded by the German Federal Ministry of Education and Research, Grant Number 03SF0474.

Acknowledgments

The authors wish to acknowledge the support of M. Gerloff (metallographic preparation and microscopy of longitudinal sample sections), M. Buchheim (SEM images), C. Krimmling (hardness measurements), and M. Finn (Young’s modulus measurements). The authors would like to thank P. Uhlemann, O. Kahlcke, and W. Wedell for their experimental support. We wish to thank B. Rehmer, D. Bettge, and G. Nolze for fruitful discussions. We are grateful to Vallourec Deutschland GmbH and Lausitz Energie Bergbau AG (LEAG) for providing the testing material and technical information, respectively.

Conflicts of Interest

The authors declare no conflict of interest.

References

  1. Farragher, T.P.; Scully, S.; O’Dowd, N.P.; Leen, S.B. Development of life assessment procedures for power plant headers operated under flexible loading scenarios. Int. J. Fatigue 2013, 49, 50–61. [Google Scholar] [CrossRef] [Green Version]
  2. Masuyama, F. History of Power Plants and Progress in Heat Resistant Steels. ISIJ Int. 2001, 41, 612–625. [Google Scholar] [CrossRef]
  3. Viswanathan, R.; Bakker, W. Materials for ULTRASUPERCRITICAL coal power plants-boiler materials: Part 1. J. Mater. Eng. Perform. 2001, 10, 81–95. [Google Scholar] [CrossRef]
  4. Hald, J. Metallurgy and creep properties of new 9-12%Cr steels. Steel Res. 1996, 76, 369–374. [Google Scholar] [CrossRef]
  5. Kim, S.; Weertman, J.R. Investigation of Microstructural Changes in a Ferritic Steel Caused by High Temperature Fatigue. Metall. Mater. Trans. A 1988, 19A, 999–1007. [Google Scholar] [CrossRef]
  6. Pineau, A.; Antolovich, S.D. High temperature fatigue: behaviour of three typical classes of structural materials. Mater. High Temp. 2015, 32, 298–317. [Google Scholar] [CrossRef]
  7. Saad, A.A.; Sun, W.; Hyde, T.H.; Tanner, D.W.J. Cyclic softening behaviour of a P91 steel under low cycle fatigue at high temperature. Procedia Eng. 2011, 10, 1103–1108. [Google Scholar] [CrossRef] [Green Version]
  8. Mishnev, R.; Dudova, N.; Kaibyshev, R. Low cycle fatigue behavior of a 10Cr-2W-Mo-3Co-NbV steel. Int. J. Fatigue 2016, 83, 344–355. [Google Scholar] [CrossRef]
  9. Masuyama, F.; Komai, N. Evaluation of Long-Term Creep Rupture Strenght of Tungsten-Strengthened Advanced 9–12%Cr Steels. Key Eng. Mater. 1999, 171–174, 179–188. [Google Scholar] [CrossRef]
  10. Earthman, J.C.; Eggeler, G.; Ilschner, B. Deformation and Damage Processes in a 12-Percent-Cr-Mo-V Steel under High-Temperature Low-Cycle Fatigue Conditions in Air and Vacuum. Mater. Sci. Eng. A 1989, 110, 103–114. [Google Scholar] [CrossRef]
  11. Fournier, B.; Dalle, F.; Sauzay, M.; Longour, J.; Salvi, M.; Caes, C.; Tournie, I.; Giroux, P.F.; Kim, S.H. Comparison of various 9-12%Cr steels under fatigue and creep-fatigue loadings at high temperature. Mater. Sci. Eng. A 2011, 528, 6934–6945. [Google Scholar] [CrossRef]
  12. Abe, F. Creep Behavior, Deformation Mechanisms and Creep Life of Mod.9Cr-1Mo Steel. Metall. Mater. Trans. A 2015, 46A, 16. [Google Scholar]
  13. National Institute for Material Science. MatNavi—NIMS Materials Database. Available online: http://mits.nims.go.jp/index_en.html. (accessed on 15 July 2018).
  14. Penalba, F.; Gomez-Mitxelena, X.; Jimenez, J.A. Effect of Temperature on Mechanical Properties of 9% Cr Ferritic Steel. ISIJ Int. 2016, 56, 1662–1667. [Google Scholar] [CrossRef]
  15. Wang, X.; Jiang, Y.; Gong, J. Characterization of Low Cycle Fatigue of Ferritic–martensitic P92 Steel: Effect of Temperature. Steel Res. Int. 2015, 87, 761–771. [Google Scholar] [CrossRef]
  16. Zhang, Z.; Hu, Z.; Fan, L. Low Cycle Fatigue Behavior and Cyclic Softening of P92 Ferritic–martensitic Steel. J. Iron Steel Res. Int. 2015, 22, 534–542. [Google Scholar] [CrossRef]
  17. Giroux, P.F.; Dalle, F.; Sauzay, M.; Caes, C.; Fournier, B.; Morgeneyer, T.; Gourgues-Lorenzon, A.F. Influence of strain rate on P92 microstructural stability during fatigue tests at high temperature. Procedia Eng. 2010, 2, 2141–2150. [Google Scholar] [CrossRef] [Green Version]
  18. Wang, X.W.; Gong, J.M.; Zhao, Y.P.; Wang, Y.F.; Yu, M.H. Characterization of Low Cycle Fatigue Performance of New Ferritic P92 Steel at High Temperature: Effect of Strain Amplitude. Steel Res. Int. 2015, 86, 1046–1055. [Google Scholar] [CrossRef]
  19. Gopinath, K.; Gupta, R.K.; Sahu, J.K.; Ray, P.K.; Ghosh, R.N. Designing P92 grade martensitic steel header pipes against creep-fatigue interaction loading condition: Damage micromechanisms. Mater. Des. 2015, 86, 411–420. [Google Scholar] [CrossRef]
  20. Zhang, W.; Wang, X.; Jiang, Y. Thermal-mechanical fatigue behaviour of P92 T-piece and Y-piece pipe. Mater. High Temp. 2017, 33, 609–616. [Google Scholar] [CrossRef]
  21. Scholz, A.; Berger, C. Deformation and life assessment of high temperature materials under creep fatigue loading. Materialwiss. Werkstofftech. 2005, 36, 722–730. [Google Scholar] [CrossRef]
  22. DIN. Nahtlose Stahlrohre für Druckbeanspruchungen—Technische Lieferbedingungen—Teil 2: Rohre aus Unlegierten und Legierten Stählen mit Festgelegten Eigenschaften bei Erhöhten Temperaturen; Deutsche Fassung EN-10216-2:2013; Beuth Verlag GmbH: Berlin, Germany, 2013. [Google Scholar]
  23. Zhang, Z.; Hu, Z.; Schmauder, S. Low-Cycle Fatigue Properties of P92 Ferritic–martensitic Steel at Elevated Temperature. J. Mater. Eng. Perform. 2016, 25, 1650–1662. [Google Scholar] [CrossRef]
  24. Fournier, B.; Sauzay, M.; Pineau, A. Micromechanical model of the high temperature cyclic behavior of 9–12%Cr martensitic steels. Int. J. Plast. 2011, 27, 1803–1816. [Google Scholar] [CrossRef]
  25. Klueh, R.L. Elevated temperature ferritic and martensitic steels and their application to future nuclear reactors. Int. Mater. Rev. 2005, 50, 287–310. [Google Scholar] [CrossRef] [Green Version]
  26. Shibli, A.; Gostling, J.; Starr, F. Damage to Power Plants Due to Cycling; Product ID: 1001507; EPRI: Palo Alto, CA, USA, 2001. [Google Scholar]
  27. ISO 12106: Metallic Materials—Fatigue Testing—Axial-Strain-Controlled Method; International Organization for Standardization: Geneva, Switzerland, 2017.
  28. ASTM E 1875: Standard Test Method for Dynamic Young’s Modulus, Shear Modulus, and Poisson’s Ratio by Sonic Resonance; ASTM International: West Conshohocken, PA, USA, 2013.
  29. Suresh, S. Fatigue of Materials; Press Syndicate of the University of Cambridge: Cambridge, UK, 1998. [Google Scholar]
  30. Sklenicka, V.; Kucharova, K.; Svoboda, M.; Kloc, L.; Bursik, J.; Kroupa, A. Long-term creep behavior of 9–12%Cr power plant steels. Mater. Charact. 2003, 51, 35–48. [Google Scholar] [CrossRef]
  31. Prat, O.; Garcia, J.; Rojas, D.; Carrasco, C.; Inden, G. Investigations on the growth kinetics of Laves phase precipitates in 12% Cr creep-resistant steels: Experimental and DICTRA calculations. Acta Mater. 2010, 58, 6142–6153. [Google Scholar] [CrossRef]
  32. Rojas, D.; Garcia, J.; Prat, O. Design and Characterization of Microstructure evolution during creep of 12%Cr heat resistant Steels. Mater. Sci. Eng, A 2010, 527, 3864–3876. [Google Scholar] [CrossRef]
  33. Shankar, V.; Bauer, V.; Sandhya, R.; Mathew, M.D.; Christ, H.J. Low cycle fatigue and thermo-mechanical fatigue behavior of modified 9Cr-1Mo ferritic steel at elevated temperatures. J. Nucl. Mater. 2012, 420, 23–30. [Google Scholar] [CrossRef]
  34. Nagesha, A.; Kannan, R.; Sastry, G.V.S.; Sandhya, R.; Singh, V.; Rao, K.B.S.; Mathew, M.D. Isothermal and thermomechanical fatigue studies on a modified 9Cr-1Mo ferritic–martensitic steel. Mater. Sci. Eng. A 2012, 554, 95–104. [Google Scholar] [CrossRef]
  35. Sauzay, M.; Brillet, H.; Monnet, I.; Mottot, M.; Barcelo, F.; Fournier, B.; Pineau, A. Cyclically induced softening due to low-angle boundary annihilation in a martensitic steel. Mater. Sci. Eng. A 2005, 400, 241–244. [Google Scholar] [CrossRef]
  36. Meetham, G.W.; Van de Voorde, M.H. Materials for High Temperature Engineering Applications; Springer: Berlin, Germany, 2000. [Google Scholar]
  37. Skelton, R.P.; Gandy, D. Creep-fatigue damage accumulation and interaction diagram based on metallographic interpretation of mechanisms. Mater. High Temp. 2008, 25, 27–54. [Google Scholar] [CrossRef]
  38. Shankar, V.; Valsan, M.; Rao, K.B.S.; Kannan, R.; Mannan, S.L.; Pathak, S.D. Low cycle fatigue behavior and microstructural evolution of modified 9Cr-1Mo ferritic steel. Mater. Sci. Eng. A 2006, 437, 413–422. [Google Scholar] [CrossRef]
Figure 1. Microstructure of P92, (a) an optical micrograph and (b) schematic view of the internal substructure within prior austenite grains of ferritic–martensitic steels (adapted by permission from Springer Nature Customer Service Centre GmbH: MDPI AG, Journal of Materials Engineering and Performance, Low-Cycle Fatigue Properties of P92 Ferritic–Martensitic Steel at Elevated Temperature, Z. Zhang et al., Copyright license 4432511224994, 2016).
Metals 09 00099 g001
Figure 2. Specimen dimensions (unit: mm).
Metals 09 00099 g002
Figure 3. Schematic representation of loading waveform for one cycle of (a) a low-cycle fatigue (LCF)-test and (b) a LCF-test with a hold time of 3 min in tension and compression.
Metals 09 00099 g003
Figure 4. Schematic hysteresis loop for LCF-tests with characteristic quantities.
Metals 09 00099 g004
Figure 5. Cyclic stress response curves of one LCF test at 620 °C, ±0.3% (a), and of all LCF-tests at (b) 300 °C, (c) 500 °C and (d) 620 °C.
Metals 09 00099 g005
Figure 6. Relation between total strain amplitude and inelastic strain amplitude for the LCF-tests at N = 50% Nf.
Metals 09 00099 g006
Figure 7. Evolution of the hysteresis loops at 500 °C and different total strain ranges in first cycle (left) and at half-lifetime (right).
Metals 09 00099 g007
Figure 8. Relationship between the total strain amplitude and plastic work for the LCF-tests (cycles at 50% lifetime).
Metals 09 00099 g008
Figure 9. Manson-Coffin Basquin plots for the LCF-tests conducted at (a) 300 °C, (b) 500 °C, and (c) 620 °C.
Metals 09 00099 g009
Figure 10. Stress and strain evolutions during the initial cycles of a tension–compression relaxation fatigue (RF) test with strain-controlled holds (th = 3 min).
Metals 09 00099 g010
Figure 11. Cyclic stress response curves for the different RF-tests with tensile and compressive holds of 3 min.
Metals 09 00099 g011
Figure 12. Cyclic stress response curves (a) and hysteresis loops at half-lifetime (b) of different LCF- and RF-tests.
Metals 09 00099 g012
Figure 13. Cyclic softening curves (a) and hysteresis loops of the first cycle (b) for selected LCF- and RF-tests at 620 °C.
Metals 09 00099 g013
Figure 14. Cyclic softening curves (a) and hysteresis loops of the first cycle (b) for selected RF-tests with different hold times.
Metals 09 00099 g014
Figure 15. Optical micrographs of the fractured surfaces of the different LCF- and RF-tests, at 620 °C (a) LCF ±0.2%, (b) RF ±0.2%, (c) LCF ±0.4%, and (d) RF ±0,4%.
Metals 09 00099 g015
Figure 16. SEM micrographs of the fracture surfaces for different total strain ranges at 620 °C (a) LCF ±0.23%, (b,c) LCF ±0.4%, (d) RF ±0.4%; (a,b,d) were taken at the central part of the fracture surface, (c) was taken at the edge of the fracture surface.
Metals 09 00099 g016aMetals 09 00099 g016b
Figure 17. Optical micrograph of the longitudinal sections for the different total strain ranges at 620 °C (a) LCF ±0.2%, (b) LCF ±0.5%, (c) RF ±0.2%, and (d) RF ±0.4%. Fracture surfaces are left. Yellow rectangles indicate the regions which are shown in a higher magnification in Figure 18a,b.
Metals 09 00099 g017
Figure 18. Optical micrographs of the longitudinal sections showing the regions marked by yellow rectangles in Figure 17c,d in a higher magnification. (a) LCF ±0.5% and (b) RF ±0.4%. SEM micrographs of the shell surface of the LCF and RF specimens, at the edge of the main crack, (c) LCF ±0.5% and (d) RF ±0.4%.
Metals 09 00099 g018
Figure 19. Softening ratio as a function of strain amplitude of all LCF- and RF-tests (3 min hold time) at 500 °C and 620 °C.
Metals 09 00099 g019
Figure 20. Inelastic strain amplitude at N =1 and at N = 50% Nf of the LCF- and RF-tests at 620 °C.
Metals 09 00099 g020
Figure 21. Hardness profiles measured on longitudinal gauge sections of specimens from different LCF- and RF-tests.
Metals 09 00099 g021
Figure 22. Lifetimes of all LCF- and RF-tests vs. the applied strain amplitude as a function of temperature.
Metals 09 00099 g022
Figure 23. Calculated fractions of the composition of strain amplitude for LCF- and RF-tests at 620 °C.
Metals 09 00099 g023
Table 1. Chemical composition of P92 (mass percent, %) measured by spark spectrometry.
CSiMnPSCrNiMoCoNbVW
0.1260.1140.4460.0120.0058.930.1670.50.0190.0920.1691.95
Table 2. Young’s modulus, E, of P92 at different temperatures obtained by sonic resonance.
Temperature [°C]E [GPa]
24216
300197
500178
620162
Table 3. Test parameters and lifetime of all conducted tests.
Test TypeTemperature [°C]Total Strain Range [%]Lifetime [-]Test Duration [h]
LCF300±0.31127637.6
LCF300±0.4339715.1
LCF300±0.5247413.7
LCF500±0.24188093.1
LCF500±0.231820046.5
LCF500±0.25531714.8
LCF500±0.3366012.2
LCF500±0.415106.7
LCF500±0.511906.6
LCF620±0.2892019.8
LCF620±0.23501112.8
LCF620±0.318096.0
LCF620±0.411245.0
LCF620±0.57254.0
LCF620±0.66894.6
RF (3 min)300±0.52305243.3
RF (3 min)500±0.235320545.6
RF (3 min)500±0.32307238.4
RF (3 min)500±0.5955100.8
RF (3 min)620±0.22050209.6
RF (10 min)620±0.21582530.8
RF (3 min)620±0.232230224.4
RF (3 min)620±0.31324136.8
RF (3 min)620±0.4996104.0
RF (10 min)620±0.4883298.3
Table 4. Softening ratio as a function of total strain range and temperature for all conducted LCF-tests.
T [°C]Δεt [%]
±0.2±0.23±0.3±0.4±0.5±0.6
300--14.2%14.7%14.1%-
50012.4%16%18%20.2%21.5%-
62017.9%24.6%27.8%30.8%29.5%33.3%
Table 5. Parameters for the Basquin and Manson-Coffin relationship.
T [°C] σ f / E b ε f c
3000.003573−0.0530.7712−0.676
5000.002984−0.0520.2158−0.581
6200.002672−0.0780.427−0.698
Table 6. Amounts of stress relaxation in the different RF-tests, given in absolute values. For comparison purposes, the individual values obtained in tension and compression for N = 1 and N = Nf/2 are given.
T [°C]Δεt [%]Stress Relaxation [MPa]
N = 1N = ½ Nf
εmaxεminεmaxεmin
300±0.331323333
500±0.2366875555
±0.3751136868
±0.51031087782
620±0.21071568081
±0.2 (th = 10 min)1171809297
±0.231291708086
±0.3 1532008294
±0.4 1611928096
±0.4 (th = 10 min)184210105116
Table 7. Softening ratio, lifetime, and lifetime ratio for the different LCF- and RF-tests.
T [°C]Δεt [%]Softening Ratio [%]Lifetime, Nf [-] N f , R F N f , L C F   [ ]
LCFRFLCFRF
300±0.5%14.414.8247423050.93
500±0.5%21.524.611909550.80
620±0.4%30.238.611249960.89
Table 8. Softening ratio, lifetime, and lifetime ratio for different LCF- and RF-tests.
T [°C]Δεt [%]Softening Ratio [%]Lifetime Nf [-] N f , R F N f , L C F   [ ]
LCFRFLCFRF
500±0.2316.422.41820053200.29
±0.318.023.0366023070.63
±0.521.525.111909550.80
620±0.217.538.2892020500.23
±0.327.837.6180913240.73
±0.430.238.611249960.89
Table 9. Softening ratio and lifetime for the RF-tests at different hold times and total strain ranges.
Δεt [%]Softening Ratio [%]Liftetime Nf [-] N f , R F N f , L C F   [ ]
3 min10 min3 min10 min3 min10 min
±0.238.237.6205015820.230.18
±0.438.640.79968830.890.79

