Abstract
In this article we discuss the effect of different test parameters on the analysis of retained austenite in TRIP590, TRIP780 and X90 steels, by means of Electron Backscattered Diffraction (EBSD) and X-ray Diffraction (XRD), respectively. By analyzing the measuring retained austenite content under different conditions, the optimal test parameters were obtained. The retained austenite content measured both by the EBSD and XRD methods were also compared. The results showed that the test parameters had a great influence on the measured results of retained austenite content in steel by the EBSD method. The higher the indexing rate, the better the precision of the measured results. The step size used for EBSD analysis should not exceed 1/5 of the average grain size of retained austenite. The scanning area for EBSD retained austenite analysis in TRIP and pipeline steels should be no less than 0.068 mm2, which is recommended to be performed by multiple small fields.
1. Introduction
In recent years, retained austenite has been widely used in many steels, such as transformation induced plasticity (TRIP) steel, quenching and partitioning (QP) steel and so on [1,2,3,4]. When subjected to external force, the retained austenite in these steels will transfer into martensite to induce high plasticity, namely TRIP effect [5,6,7,8,9]. At present, the retained austenite content in steel is mainly measured by the XRD method [10,11,12], which is performed according to the standards YB/T 5338-2006 [13] and ASTM E975-13 [14]. Both standards have some limitations in the process of use: Firstly, the measured result is greatly affected by the crystallographic orientation or texture in steel [15,16,17]; secondly, the shape and distribution of retained austenite cannot be characterized; thirdly, the lower detection limit is high (1% or more [14]) and the trace retained austenite cannot be measured by the XRD method. Considering the limitations of the XRD method, EBSD method is a good solution to perform the quantitative analysis of retained austenite in steel [18,19,20,21,22]. Firstly, the EBSD method is not influenced by the crystallographic orientation or texture in steel. Moreover, it can provide not only the content of retained austenite, but also the distribution and morphology of the austenite phase.
Many studies have shown that the EBSD method could be used to serve the purpose of microstructure characterization for both quantitative and qualitative analyses in TRIP steels and other advance high strength steels (AHSS), which mainly focused on the substructure and microstructures characterization [23,24,25,26,27] and the subgrain and grain characterization [28,29,30]. About retained austenite characterization and quantification, previous research [3,5,6,7,8,18,19,20,26,31,32] showed that EBSD test parameters had a vital impact on the test results: High indexing rates, small step sizes and more field number are necessary for the analysis of retained austenite content in steel by the EBSD method. However, little research by far showed the specific quantitative results, such as the critical index rate, the relationship between step size and grain size of retained austenite, and the needed filed number for different magnifications and retained austenite contents. Furthermore, the retained austenite analysis is very complicated due to its small size, its various morphologies, its distribution and the microstructures of matrix [16,23,24,25,26,27]. Main parameters used to identify these complicated structures are the image quality (IQ) factor. The IQ factor represents a quantitative description of the sharpness of the bands in the EBSD pattern. A lattice distorted by crystalline defects, such as dislocations and sub-grain boundaries affect Kikuchi pattern quality leading to lower IQ values [7,25,33,34]. Moreover, when EBSD is used at high resolution, it shows the instabilities in the specimen stage and electron beam during the long periods of measurements. Poor diffraction means that the beam has to dwell for a longer period at the same position and any instability will make the results useless [24]. That is why there are no international standards for measuring retained austenite by the EBSD method by far. Therefore, it is very necessary to further study different test parameters on the EBSD analysis of retained austenite for different steels. In this case, in future maybe we can set up a general guideline on how to select optimal test parameters in the analysis of retained austenite in steel by the EBSD method.
Thus, the objective of this paper is to first study different test parameters for three types of steels (TRIP590, TRIP780 and X90 steels) on the measured results of retained austenite content, and then obtain the optimal test parameters for the EBSD analysis of retained austenite in TRIP and pipeline steels.
2. Materials and Methods
The materials used in this study were three types of steels, which had different retained austenite content level: High (TRIP780 steel), medium (TRIP590 steel) and low (X90 steel). The steel sheet experienced cold rolling annealing treatment for TRIP590 and TRIP780 steels and hot rolling treatment for X90 steel, respectively. The chemical compositions of test steels are shown in Table 1. The size of specimen for all steels was 10 mm × 10 mm × 1 mm. Prior to the experiments, the surface of the specimen was first mechanically polished by silicon carbide (SiC) paper from 150 grit progressively up to 2000 grit and then mechanically polished with 7 μm polishing paste and finally electrolytic polished to remove the surface residual stress. LectroPol-5 electrolytic polishing instrument (Struers Aps, Ballerup, Denmark) was used to perform electrolytic polishing for different specimens. The electrolyte was 20% perchloric acid alcohol solution. The electrolyte temperature was between 4 °C and 7 °C. The voltage, current and polishing time were 9~12 V, 0.5~1 A and 7~10 s, respectively. Then, the specimen was carefully washed with deionized water, cleaned with alcohol and finally dried.

Table 1.
The chemical composition of test steels (wt%).
JSM-7001F Field Emission Scanning Electron Microscope (FE-SEM, JEOL, Tokyo, Japan) equipped with NordlysF400 EBSD accessory from Oxford Instruments (UK) were employed for EBSD analysis. The HKL Fast Acquisition software (Oxford Instruments, Oxford, UK) was used to acquire the EBSD data under different experimental conditions. After the test, the retained austenite was analyzed by Project Manager Channel 5 software (Oxford Instruments, Oxford, UK). The working parameters of the microscope and EBSD patterns acquisition parameters are shown in Table 2. The indexing rate in this paper is defined as the percentage of the indexed area to the total scanning area. The distance between adjacent EBSD data acquisition points is defined as step size in this paper.
Table 2.
The parameters used in this study for Electron Backscattered Diffraction (EBSD) analysis.
X-ray Diffractometer from Bruker Corporation (Ettlingen, Germany) equipped with one-dimensional array detector was used for XRD test, with a type of D8 ADVANCE. Cobalt target Kα radiation was used with a tube voltage of 35 kV and a tube current of 40 mA. The step size, scanning speed and the scanning angle range were 0.02°, 2°/min and 45~115°, respectively. After the experiment, the retained austenite content was analyzed by TOPAS software (V5, Bruker Corporation, Ettlingen, Germany).
3. Results and Discussion
3.1. Effect of Indexing Rate
3.1.1. TRIP590 Steel
In our previous research [18], the optimal parameters for the analysis of retained austenite in TRIP590 steel by the EBSD method are summarized in Table 3. It could be found that high indexing rate, small step size and more field number (In this paper, the field number is defined as the number of the scanning maps) were necessary for the EBSD analysis of retained austenite content in TRIP590 steel.
Table 3.
The optimal parameters for analyzing retained austenite in TRIP590 steel (reproduced from [18], with permission from Springer, 2019).
3.1.2. TRIP780 Steel
Figure 1 shows the morphology and distribution of the retained austenite in TRIP780 steel at different indexing rates under other conditions unchanged (the same field of view, the same magnification 2000× (scan area 64 μm × 44 μm for each field) and the same step size 0.08 μm). In this paper, the indexing rate was changed by changing camera settings, such as binning, gain, time per frames, number of bands detected and so on. Normally, for the same area, long time scanning will cause the surface contamination which results in the indexing rate decrease for the same camera settings [24]. Therefore, in order to study the effect of indexing rate in the same area, the high indexing rate was performed first and then low indexing rate, in order to obtain as high as possible of indexing rate.
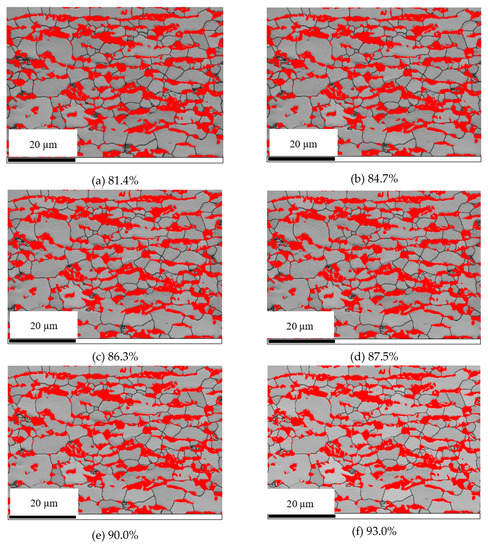
Figure 1.
The morphology and distribution of retained austenite in TRIP780 steel at different indexing rates (a: 81.4%; b: 84.7%; c: 86.3%; d: 87.5%; e: 90.0%; f: 93.0%).
It can be seen from Figure 1 that as the indexing rate increased, the morphology and distribution of retained austenite became more and more clean and clear. However, due to too much retained austenite in TRIP780 steel, its morphology and distribution did not show much difference for different indexing rates.
In order to characterize the variation of the calculated retained austenite content with the increase of indexing rate in Figure 1, the increasing rate of retained austenite content is defined as the following Equation [18]:
where, Ai and Aj are the calculated retained austenite contents under the indexing rate i (IRi) and j (IRj), respectively; GRij is the increasing rate of retained austenite content when the indexing rate increases from IRi to IRj. Here, two adjacent measuring data points are used to calculate the increasing rate of retained austenite content, i.e., j = i + 1. If the calculated content of retained austenite decreases when the indexing rate increases, the absolute value of GRij is defined as the decline rate of retained austenite content. In this paper, the increasing rate and the decline rate of other parameters are also calculated according to Equation (1).
According to Equation (1), the curves of the measured retained austenite content in TRIP780 steel and its increasing rate with indexing rate are shown in Figure 2. It can be seen from Figure 2a that as the indexing rate increased, the measured retained austenite content increased rapidly first and then increased slowly. In theory, as the indexing rate increases, the percentage of non-indexing area decreases. The measurement precision is mainly depending on the percentage of non-indexing area. The lower the percentage of non-indexing area is, the higher the measurement precision is. If the indexing rate is 100%, the measurement results for many times in the same area should be the same theoretically. Therefore, the curves of retained austenite content show typical saturation behavior as the indexing rate increases. As shown in Figure 2b, when the indexing rate was 81.4%, the increasing rate of retained austenite content was about 10%. As the indexing rate increased, the increasing rate of retained austenite content decreased. When the indexing rate reached 86.3% or more, the increasing rate of retained austenite content became very small (≤0.5%) and tended to be stable. Therefore, in order to obtain stable and reliable data, the indexing rate for the EBSD analysis of retained austenite in TRIP780 steel should be no less than 86.3%.
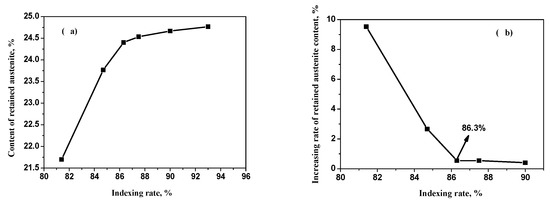
Figure 2.
Curves of the measured retained austenite content (a) in TRIP780 steel and its increasing rate (b) with indexing rate.
3.1.3. X90 Steel
The morphology and distribution of retained austenite in X90 steel at different indexing rates are shown in Figure 3. It can be seen that as the indexing rate increased, the morphology and distribution of retained austenite became more and more clear, and the amount of retained austenite detected in the field of view became more and more. When the indexing rate was equal or less than 85.1%, the retained austenite was not visible in the area surrounded by a blue circle in Figure 3. When the indexing rate was 88.6%, the retained austenite began to appear in the area surrounded by a blue circle. When the indexing rate reached 90.5% and more, the retained austenite in the area surrounded by a blue circle became very noticeable.
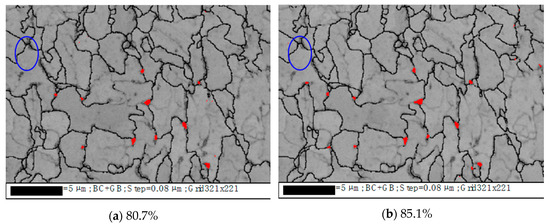
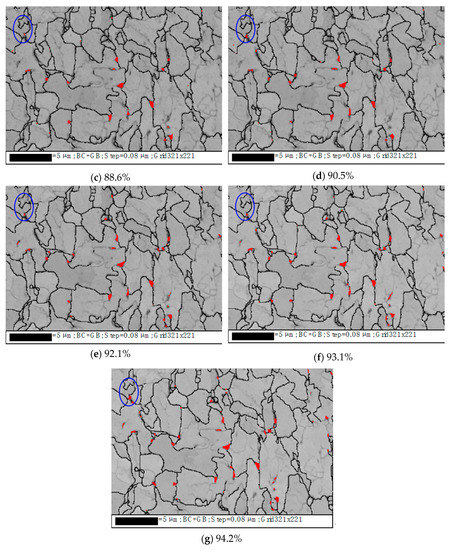
Figure 3.
The morphology and distribution of retained austenite in X90 steel at different indexing rates (a: 80.7%; b: 85.1%; c: 88.6%; d: 90.5%; e: 92.1%; f: 93.1%; g: 94.2%).
The measured retained austenite content in X90 steel and its increasing rate at different indexing rates are shown in Figure 4. It was obvious from Figure 4a that as the indexing rate increased, the measured retained austenite content gradually increased. As the indexing rate increased, the increasing rate of retained austenite content decreased first rapidly, then slowly, then rapidly, then slowly again and finally tended to be stable, as shown in Figure 4b.
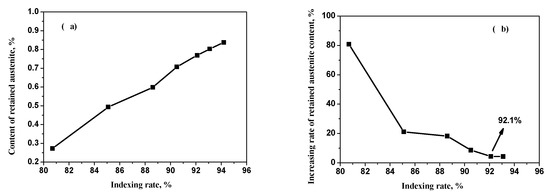
Figure 4.
Curves of the measured retained austenite content (a) in X90 steel and its increasing rate (b) with indexing rate.
When the indexing rate was 80.7%, the increasing rate of retained austenite content was very large, exceeding 80%. The increasing rate of retained austenite content decreased rapidly for the indexing rate ranging from 80.7% to 85.1% while it decreased slowly as the indexing rate was between 85.1% and 88.6%. Starting from 88.6%, the increasing rate of retained austenite content decreased rapidly again. When the indexing rate increased to 92.1% and higher, as the indexing rate increased, the increasing rate of retained austenite content nearly did not change and became stable. Therefore, in order to obtain stable and reliable data, the indexing rate for the EBSD analysis of retained austenite in X90 steel should be no less than 92.1%.
3.1.4. Minimum Indexing Rate for EBSD Retained Austenite Analysis
From the above discussion, it could be concluded that:
(1) In the curves of the retained austenite content and its increasing rate with indexing rate, there was a critical indexing rate. Below the critical indexing rate, as the indexing rate increased, the measured retained austenite content increased rapidly. Once the indexing rate reached the critical value or higher, the increasing rate of retained austenite content became very small and tended to be stable.
(2) The critical indexing rate was related to the content of retained austenite in steel. As the retained austenite content decreased, the critical indexing rate increased. The critical indexing rates for the TRIP780, TRIP590 and X90 steels were 86.3%, 88.9% and 92.1%, respectively.
In theory, the higher the indexing rate, the lower the zero solution (non-indexed area), the better the quality of EBSD scanning data and the more accurate the test results. Therefore, in order to improve the measurement precision, the appropriate specimen preparation method should be chosen to obtain as high as possible of the indexing rate.
3.2. Effect of Step Size
As we know, it is not reasonable to select a step size that is too small or too large for EBSD analysis, because too small step size will result in too long test time while it is easy to miss small grain information when the step size is too large. Therefore, the appropriate step size for EBSD retained austenite analysis is necessary.
3.2.1. TRIP590 Steel
From Table 3, the suitable step size for EBSD analysis of retained austenite in TRIP 590 steel should be no more than 0.12 µm.
3.2.2. TRIP780 Steel
Figure 5 shows the morphology and distribution of retained austenite in TRIP780 steel at different step sizes. It was obvious that when the step size was 1.0 μm, the grain boundary of ferrite was very ambiguous, and only a small amount of retained austenite could be seen. As the step size decreased, the ferrite grain boundary gradually became clear. At the same time, more retained austenite could be seen in the field of view. When the step size decreased to 0.25 μm, the ferrite grain boundary has become very obvious, and the amount of retained austenite became more and more. Continuing to decrease step size from 0.25 μm to lower, the distribution of retained austenite did not change substantially.
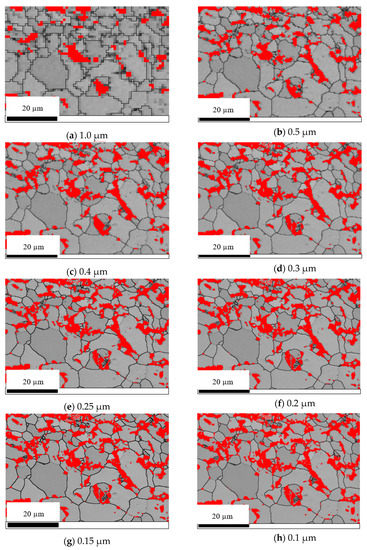
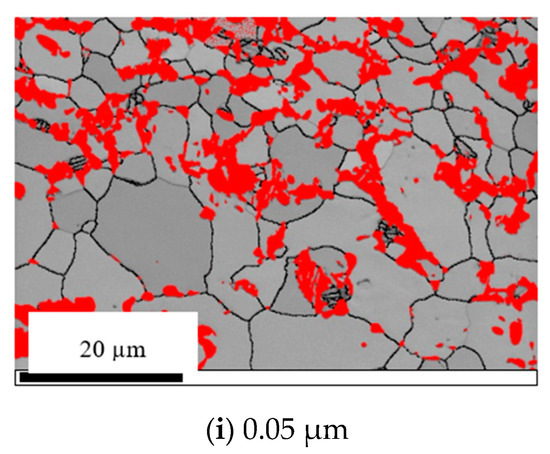
Figure 5.
The morphology and distribution of retained austenite in TRIP780 steel at different step sizes (a: 1.0 μm; b: 0.5 μm; c: 0.4 μm; d: 0.3 μm; e: 0.25 μm; f: 0.20 μm; g: 0.15 μm; h: 0.10 μm; i: 0.05μm).
The variation curves of the measured retained austenite content in TRIP780 steel and its decline rate with the step size are shown in Figure 6. It could be clearly seen from Figure 6a that as the step size increased, the measured content of retained austenite gradually decreased, showing a downward trend of the “S” type. As the step size increased, the retained austenite content decreased slowly in the initial stage, then rapidly and finally slowly again. As shown in Figure 6b, when the step size was equal or less than 0.25 μm, the decline rate of retained austenite content was very small (≤2.2%) and changed little with the increase of the step size, while it increased gradually when the step size was greater than 0.25 μm. The decline rate of retained austenite content has exceeded 30% at a step size of 0.5 μm. Therefore, in order to obtain stable and reliable data, the step size for the EBSD analysis of retained austenite in TRIP780 steel should be no more than 0.25 μm.
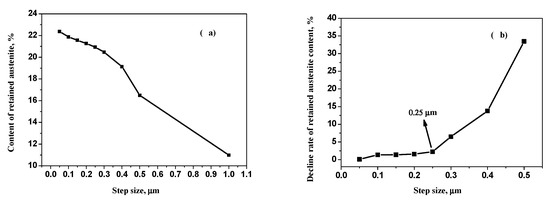
Figure 6.
Curves of the measured retained austenite content (a) in TRIP780 steel and its decline rate (b) with step size.
3.2.3. X90 Steel
For X90 steel, the morphology and distribution of retained austenite in it at different step sizes are shown in Figure 7. It can be obviously seen that when the step size was 0.3 μm, the grain boundary of the matrix was unclear and no retained austenite was observed. Till the step size was reduced to 0.2 μm, the retained austenite began to appear in the field of view. Thereafter, with the decrease of step size, the grain boundaries of the matrix gradually became clear, the overall appearance of the image becomes clearer and clearer, and more retained austenite could be seen in the field of view. When the step size declined to 0.06 μm or less, the grain boundary of the matrix has become very obvious, and at the same time the distribution of retained austenite was no longer changed substantially.
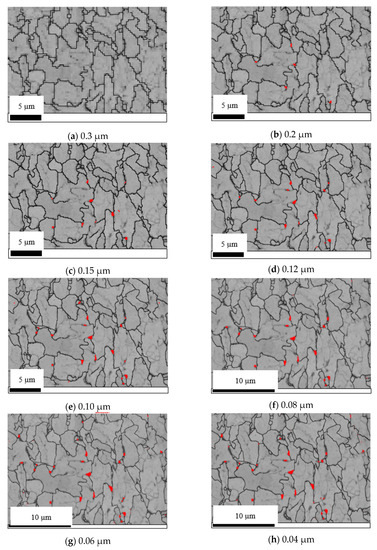
Figure 7.
The morphology and distribution of retained austenite in X90 steel at different step sizes (a: 0.3 μm; b: 0.2 μm; c: 0.15 μm; d: 0.12 μm; e: 0.10 μm; f: 0.08 μm; g: 0.06 μm; h: 0.04 μm).
Figure 8 shows the measured retained austenite content in X90 steel and its decline rate as a function of the step size. It can be clearly seen from Figure 8a that as the step size increased, the retained austenite content gradually decreased, similar to the variation curve (“S” type) of the TRIP780 steel in Figure 6a. It can be seen from Figure 9b that as the step size was no more than 0.06 μm, the decline rate of retained austenite content changed little with the increase of the step size, while the retained austenite gradually increased with the increase of the step size when the step size was greater than 0.06 μm. When the step size increased up to 0.2 μm, the decline rate of the retained austenite content has reached 100%. Therefore, the step size for the EBSD analysis of retained austenite in X90 steel should not exceed 0.06 μm.
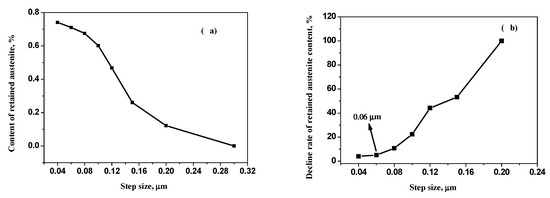
Figure 8.
Curves of the measured retained austenite content (a) in X90 steel and its decline rate (b) with step size.
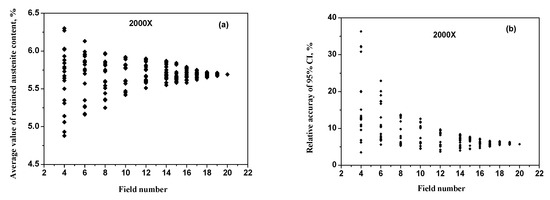
Figure 9.
The average value of retained austenite content (a) and the relative accuracy of 95% confidence interval (b) for different fields.
3.2.4. Maximum Step Size for EBSD Retained Austenite Analysis
In order to find the relationship between the maximum step size allowed for the EBSD analysis and the retained austenite grain size, 10 fields with a magnification of 1000× (scan area 128 μm × 88 μm for each field) were first randomly taken for each steel. Then, the grain size (or called grain diameter) of retained austenite in all fields for three types of steels was counted, as shown in Table 4. It was obvious that the variation rule for the proportion of retained austenite with different grain sizes for different steels were similar, that is small grains account for the majority (more than half). Table 5 shows the statistical results of the average grain size and maximum grain size for different steels in Table 4. It could be found that the average grain size of retained austenite in three steels were very small (less than 1.2 μm). The average grain size of retained austenite in X90 steel was only about 1/2 of TRIP590 steel and 1/4 of TRIP780 steel.
Table 4.
The proportion of retained austenite (P) with different grain sizes (d).
Table 5.
The statistical results of average grain size and maximum grain size.
In order to clearly show the relationship between the maximum step size (SZm) for the EBSD retained austenite analysis in different steels discussed above and the average grain size () of retained austenite in Table 5, the ratio of which are calculated, as shown in Table 6. It can be seen that for each steel, the ratio () of the maximum step size to the average grain size of retained austenite was between 0.20 and 0.25, i.e., the maximum step size for the EBSD analysis was between1/5 and 1/4 of the average grain size of the retained austenite.
Table 6.
The relationship between the maximum step size and the average grain size of retained austenite.
Taking the minimum value 0.202 in Table 6 as the most suitable ratio. That is to say, the maximum step size allowed for EBSD retained austenite analysis is about 1/5 of the average grain size of retained austenite, shown as follows:
3.3. Effect of Scanning Area
3.3.1. TRIP590 Steel
As shown in Table 3, in order to obtain stable and reliable data, the needed field number should be equal or higher than 5 for TRIP590 steel at a magnification of 1000×.
In order to study the field number required to obtain stable and reliable data for different magnifications, 20 fields were randomly tested at a magnification of 2000×. The average value of the measured retained austenite content and the relative accuracy corresponding to the 95% confidence interval are shown in Figure 9. It could be seen that with the increase of the field number, the average value of the retained austenite content and the relative accuracy of the 95% confidence interval converged, that is, the fluctuation amplitude decreased, but the convergence amplitude decreased as the field number increased. When the field number was small, the relative accuracy of the average retained austenite content and the 95% confidence interval were relatively large. As the field number increased, the fluctuation range of both decreased rapidly and then decreased slowly.
Referring to Equation (1), the average value of the 95% confidence interval relative accuracy corresponding to different field number in Figure 9b and its decline rate are calculated, as shown in Figure 10. It can be seen from Figure 10a that as the field number increased, the relative accuracy of 95% confidence interval gradually decreased. As shown in Figure 10b, when the field number was 4, the decline rate of the 95% confidence interval relative accuracy was relatively high and it decreased rapidly with increasing field number from 4 to 6. The decline rate of the 95% confidence interval relative accuracy gradually decreased for the field number ranging from 6 to 14 while it quickly decreased again when the field number is between 14 and 17. Since the field number reached 17 and higher, the decline rate of the 95% confidence interval relative accuracy almost did not change and tended to be stable. In this case, it could be considered that the fluctuation enters the steady state, and it is meaningless to continue to increase the field number. Therefore, the needed field number for TRIP590 steel was equal or greater than 17 at a magnification of 2000×.
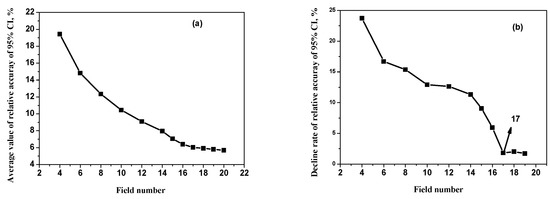
Figure 10.
The variation curves of the average relative accuracy of 95% confidence interval (a) and its decline rate (b) with different fields for TRIP590 steel.
3.3.2. TRIP780 Steel
In the same way, the average value of the measured retained austenite content in TRIP780 steel and the relative accuracy corresponding to the 95% confidence interval are also calculated, as shown in Figure 11. It can be seen from Figure 11a that as the field number increased, the relative accuracy of the 95% confidence interval gradually decreased, with a rapid decrease at the beginning and thereafter slow decrease. As shown in Figure 11b, when the field number was 2, the decline rate of the 95% confidence interval relative accuracy was very high (about 65%), while it decreased rapidly for the field number increasing from 2 to 4. As the field number was equal or higher than 4, the decline rate of the 95% confidence interval relative accuracy nearly did not change and tended to be stable. Therefore, the needed field number for TRIP780 steel was equal or greater than 4 at a magnification of 1000×.
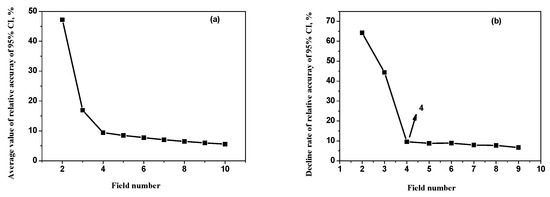
Figure 11.
The variation curves of the average relative accuracy of 95% confidence interval (a) and its decline rate (b) with different fields for TRIP780 steel.
3.3.3. X90 Steel
Figure 12a,b shows the average value of the measured retained austenite content in X90 steel and the relative accuracy of the 95% confidence interval, respectively. It can be seen from Figure 12a that as the field number increased, the relative accuracy of the 95% confidence interval gradually decreased, showing a trend of rapid decline first and then slow decline. When the field number was 2, the decline rate of the 95% confidence interval relative accuracy was very high (about 70%, as shown in Figure 12b) and it decreased rapidly when the field number increased from 2 to 3. As the field number increased from 3 to 6, the decline rate of the 95% confidence interval relative accuracy decreased first slowly, then rapidly and finally slowly again. When the field number was equal or higher than 6, the decline rate of the relative accuracy of the 95% confidence interval did not change substantially and became steady. Therefore, for X90 steel, 6 or more fields were necessary for obtaining reliable results.
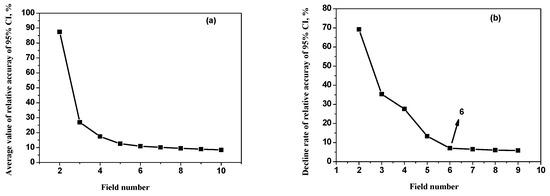
Figure 12.
The variation curves of the average relative accuracy of 95% confidence interval (a) and its decline rate (b) with different fields for X90 steel.
3.3.4. Minimum Scan Area for EBSD Retained Austenite Analysis
Based on the above discussion, for TRIP590 steel, the required field number to obtain stable and reliable data varies from magnification. Even at the same magnification, the necessary field number is also different for different steels, as shown in Table 7. In view of the choice of magnification and the uncertainty of the field number required, the total scanning area is used in this study instead of the different magnifications and field number. The scanning area for each field and total scanning area for obtaining stable and reliable data are also listed in Table 7.
Table 7.
The needed field number and scanning area for different steels.
Comparing the results at a magnification of 1000×, the required field number for different steels was between 4 and 6, with the least for TRIP780 steel and the highest for X90 steel. That is to say, the lower the retained austenite content in steel, the more fields required to obtain stable and reliable data, and the larger the total scanning area required.
Taking the maximum value of the total scanning area in Table 7 as the lowest scanning area, namely the scanning area for EBSD retained austenite analysis should be no less than 0.067584 mm2. For the purpose of easy calculation for multiple fields, the minimum scanning area is selected as 0.068 mm2. As we know, for certain total scanning area, one large field can be selected, or multiple small fields can be added together. Generally, with the field number increases, the relative error reduces, so in order to reduce the accidental error, scanning multiple fields are recommended.
3.4. Analysis of Retained Austenite by EBSD Method
3.4.1. Optimal Parameters for EBSD Retained Austenite Analysis
Based on the above discussion, high indexing rate, small step size and large scanning area are necessary in order to obtain high precision of the retained austenite content in steel. The indexing rate should be larger than the critical value, the higher, the better. The maximum step size for EBSD analysis should be no more than 1/5 of the average grain size of retained austenite. The total scanning area for EBSD retained austenite analysis should be no less than 0.068 mm2, which can be performed by one large field of view or multiple small fields. It is recommended to scan multiple fields for inducing accidental error.
3.4.2. Analysis of Retained Austenite in Three Types of Steels
According to the optimal parameters discussed in Section 3.4.1, the retained austenite content in three types of steels were analyzed, with the test parameters shown in Table 8. The morphology and distribution of retained austenite in three types of steels for one field are shown in Figure 13. As the morphology and distribution of retained austenite in all fields are similar, here shows only one field for each steel. In Figure 13, the gray phase was the matrix and the red phase was the retained austenite which is mainly distributed on the grain boundaries of the matrix, in the form of a block or long strips.
Table 8.
The test parameters for analyzing retained austenite in three steels.
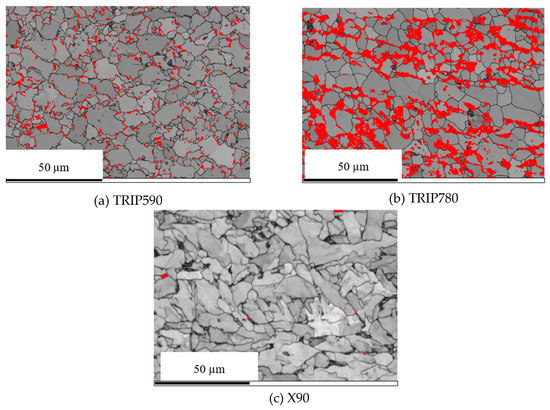
Figure 13.
The morphology and distribution of retained austenite in three steels (a: TRIP590; b: TRIP780; c: X90).
It can be seen from Figure 13 that the content and grain size of the retained austenite in three steels are significantly different. The amount and the size of retained austenite observed in TRIP780 steel was most and largest, while the X90 steel had the lowest content and the smallest size of retained austenite, which can only be seen faintly. The average retained austenite content, 95% confidence interval (95% CI) and the relative accuracy (%RA) for three steels are calculated, as shown in Table 9. The content of retained austenite for TRIP780 steel was highest while it is lowest for X90 steel, which is in accordance with the distribution of retained austenite in Figure 13.
Table 9.
The measured retained austenite content in three steels by the EBSD method.
3.5. Analysis of Retained Austenite by XRD Method
In order to verify the correctness of EBSD test results of retained austenite content, the XRD method was employed and the measured XRD patterns are shown in Figure 14. It was obvious that three diffraction peaks of ferrite and four diffraction peaks of retained austenite could be clearly observed for TRIP780 and TRIP590 steels. Relatively speaking, the intensity of the diffraction peaks of retained austenite in the TRIP780 steel were higher than that in TRIP590 steel. However, only three diffraction peaks of ferrite (or other phases with bcc structures) were observed in the XRD pattern of X90 steel, and the diffraction peak of retained austenite was not observed.
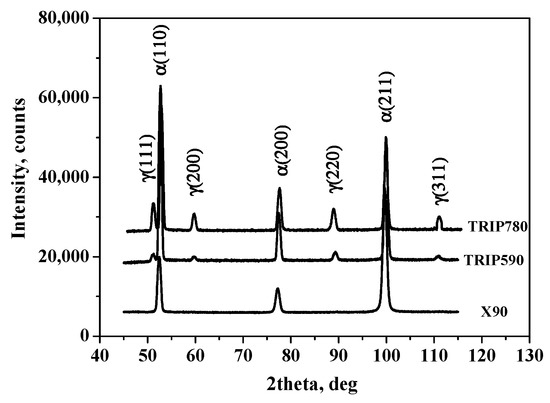
Figure 14.
The measured XRD patterns for different steels (α, ferrite or other phases with bcc structures; γ, retained austenite phase).
For each steel, 10 positions were tested at the center and at the edges (the XRD pattern for each position was similar to Figure 14, therefore here only gives one XRD pattern). Due to texture in presence of TRIP590 and TRIP780 steels, both standards YB/T 5338-2006 [13] and ASTM E975-13 [14] are not applicable for them, therefore, the “Rietveld Refinement Method” was used to calculate the retained austenite content in both steels [18,32,35,36,37]. The average retained austenite content for 10 test positions, 95% confidence interval and the relative accuracy are listed in Table 10. It can be seen from Table 10 that the retained austenite content in TRIP780 steel was the highest. As the retained austenite content in X90 steel was too low (no retained austenite diffraction peaks were detected in Figure 14), it cannot be measured by the XRD method.
Table 10.
The measured retained austenite content in three steels by XRD.
Comparing Table 9 and Table 10, it could be found that the measured retained austenite content in TRIP590 and TRIP780 steels both by the EBSD and XRD methods were close, indicating that both methods are applicable for the analysis of retained austenite content in steel, which is also confirmed by the research results of Zhang et al. [18], Grajcar et al. [23] and Parish et al. [38]. Moreover, it can be also seen that the trace retained austenite in X90 steel could not be measured by the XRD method (see Table 10 and Figure 14), while it could be measured by the EBSD method (see Table 9 and Figure 13c). Furthermore, the EBSD method can not only provide the content of retained austenite (see Table 9), but also provides its morphology, distribution and grain size (see Figure 13). Therefore, EBSD is a comprehensive method in the analysis of retained austenite in steel, which has been already confirmed by the previous studies from Zhang et al. [18], Godet et al. [19], Lomholt et al. [20], Nakajima et al. [21] and Li et al. [22].
4. Conclusions
In this paper, the effect of different test parameters on the analysis of retained austenite in TRIP590, TRIP780 and X90 steels by means of the EBSD and XRD methods, respectively. The following conclusion can be drawn:
(1) The critical indexing rate was related to the content of retained austenite in steel. As the retained austenite content decreased, the critical indexing rate increased. The critical indexing rates for the TRIP780, TRIP590 and X90 steels were 86.3%, 88.9% and 92.1%, respectively.
(2) The step size used for EBSD analysis should not exceed 1/5 of the average grain size of retained austenite.
(3) The scanning area for EBSD retained austenite analysis for TRIP and pipeline steels should be no less than 0.068 mm2. It is recommended to scan multiple fields for inducing accidental error.
Author Contributions
Conceptualization, Y.Z. and X.J.; Methodology, Y.Z.; Software, Y.Z.; Validation, Y.Z. and X.J.; Formal Analysis, P.L. and G.C.; Investigation, P.L., H.J. and G.C.; Resources, Y.Z.; Data Curation, Y.Z.; Writing—Original Draft Preparation, Y.Z.; Writing—Review and Editing, Y.Z.; Visualization, Y.Z.; Supervision, X.J.; Project Administration, X.J.
Funding
This research received no external funding.
Conflicts of Interest
The authors declare no conflict of interest.
References
- Raabe, D.; Ponge, D.; Dmitrieva, O.; Sander, B. Designing Ultrahigh Strength Steels with Good Ductility by Combining Transformation Induced Plasticity and Martensite Aging. Adv. Eng. Mater. 2010, 11, 547–555. [Google Scholar] [CrossRef]
- Bleck, W.; Papaefthymiou, S.; Frehn, A. Microstructure and Tensile Properties in Dual Phase and Trip Steels. Steel Res. Int. 2004, 75, 704–710. [Google Scholar] [CrossRef]
- Clarke, A.J.; Speer, J.G.; Matlock, D.K.; Rizzo, F.C.; Edmonds, D.V.; Santofimia, M.J. Influence of Carbon Partitioning Kinetics on Final Austenite Fraction during Quenching and Partitioning. Scr. Mater. 2009, 61, 149–152. [Google Scholar] [CrossRef]
- Shi, W.; Li, L.; Yang, C.X.; Fu, R.; Wang, L.; Wollants, P. Strain-Induced Transformation of Retained austenite in Low-Carbon Low-Silicon TRIP Steel Containing Aluminum and Vanadium. Mater. Sci. Eng. A 2006, 429, 247–251. [Google Scholar] [CrossRef]
- Wang, J.; Zwaag, S.V.D. Stabilization Mechanisms of Retained Austenite in Transformation-Induced Plasticity Steel. Metall. Mater. Trans. A 2001, 32, 1527–1539. [Google Scholar] [CrossRef]
- Thiessen, R.G.; Sietsma, J.; Palmer, T.A.; Elmer, J.W.; Richardson, I.M. Phase-Field Modelling and Synchrotron Validation of Phase Transformations in Martensitic Dual-Phase Steel. Acta Mater. 2007, 55, 601–614. [Google Scholar] [CrossRef]
- Zaefferer, S.; Ohlert, J.; Bleck, W. A Study of Microstructure, Transformation Mechanisms and Correlation between Microstructure and Mechanical Properties of a Low Alloyed TRIP Steel. Acta Mater. 2004, 52, 2765–2778. [Google Scholar] [CrossRef]
- Hidalgo, J.; Findley, K.O.; Santofimia, M.J. Thermal and Mechanical Stability of Retained Austenite Surrounded by Martensite with Different Degrees of Tempering. Mater. Sci. Eng. A 2017, 690, 337–347. [Google Scholar] [CrossRef]
- Krizan, D.; de Cooman, B.C. Analysis of the Strain-Induced Martensitic Transformation of Retained Austenite in Cold Rolled Micro-Alloyed TRIP Steel. Steel Res. Int. 2008, 79, 513–522. [Google Scholar] [CrossRef]
- Zhao, L.; Dijk, N.H.V.; Brück, E.; Sietsma, J.; der Zwaag, S. Magnetic and X-ray Diffraction Measurements for the Determination of Retained austenite in TRIP Steels. Mater. Sci. Eng. A 2001, 313, 145–152. [Google Scholar] [CrossRef]
- Blonde, R.; Jimenez-Melero, E.; Zhao, L.; Wright, J.P.; Brück, E.; van der Zwaag, S.; van Dijk, N.H. High-Energy X-ray Diffraction Study on the Temperature-Dependent Mechanical Stability of Retained austenite in Low-Alloyed TRIP Steels. Acta Mater. 2012, 60, 565–577. [Google Scholar] [CrossRef]
- Dijk, N.H.V.; Butt, A.M.; Zhao, L.; Sietsma, J.; Offerman, S.E.; Wright, J.P.; van der Zwaag, S. Thermal Stability of Retained austenite in TRIP Steels Studied by Synchrotron X-ray Diffraction during Cooling. Acta Mater. 2005, 53, 5439–5447. [Google Scholar]
- YB/T 5338-2006. Retained Austenite in Steel—Quantitative Determination—Method of X-Ray Diffractometer (in Chinese); ASTM International Standards Organization: West Conshohocken, PA, USA, 2006. [Google Scholar]
- ASTM E975-13. Standard Practice for X-Ray Determination of Retained Austenite in Steel with Near Random Crystallographic Orientation; ASTM International Standards Organization: West Conshohocken, PA, USA, 2018. [Google Scholar]
- Ball, C.J.; Kelly, P.M. X-ray Method for Determination of Retained austenite in Steels with Pronounced Texture. Met. Sci. 1982, 16, 332–334. [Google Scholar] [CrossRef]
- Murugesan, S.; Kuppusami, P.; Mohandas, E.; Vijayalakshmi, M. X-ray Diffraction Rietveld Analysis of Cold Worked Austenitic Stainless Steel. Mater. Lett. 2012, 67, 173–176. [Google Scholar] [CrossRef]
- Zhang, M.X.; Kelly, P.M.; Bekessy, L.K.; Gates, J.D. Determination of Retained austenite Using an X-ray Texture Goniometer. Mater. Charact. 2000, 45, 39–49. [Google Scholar] [CrossRef]
- Zhang, Y.C.; Meng, Y.; Cui, G.B.; Jia, H.P.; Ju, X.H.; Jiang, Z.H.; Ma, Z.J. Analysis of Retained austenite in TRIP590 Steel by Electron Backscattered Diffraction Method. J. Iron Steel Res. Int. 2019. (accepted by Springer in 2019). [Google Scholar]
- Godet, S.; Kim, B.K.; Jacques, P.J.; Szpunar, J.; Jonas, J.J.; Delannay, F. Microtextural Study of Variant Selection by EBSD in a Bainitic Steel Containing Retained austenite. J. Phys. IV 2003, 112, 309–312. [Google Scholar] [CrossRef]
- Lomholt, T.N.; Adachi, Y.; Bastos, A.; Pantleon, K.; Somers, M. Partial Transformation of Retained austenite in Al-Mn-Si TRIP Steel upon Tensile Straining: An in-situ EBSD Study. Mater. Sci. Technol. 2013, 29, 1383–1388. [Google Scholar] [CrossRef]
- Nakajima, M.; Uematsu, Y.; Kakiuchi, T.; Akita, M.; Tokaji, K.; Murasaki, T. Effects of Strain-Induced Martensitic Transformation on Fatigue Behavior of Type 304 Stainless Steel and Phase Transformation Analysis by EBSD. J. Jpn. Soc. Test. Mater. 2011, 60, 796–802. [Google Scholar] [CrossRef]
- Li, W.S.; Gao, H.Y.; Nakashima, H.; Hata, S.; Tian, W. In-situ EBSD Study of Deformation Behavior of Retained austenite in a Low-Carbon Quenching and Partitioning Steel via Uniaxial Tensile Tests. Mater. Charact. 2016, 118, 431–437. [Google Scholar] [CrossRef]
- Grajcar, A.; Radwanski, K.; Hanna, K.J. Microstructural Analysis of a Thermomechanically Processed Si-Al TRIP Steel Characterized by EBSD and X-Ray Techniques. Solid State Phenomena 2013, 203–204, 34–37. [Google Scholar] [CrossRef]
- Ryde, L. Application of EBSD to Analysis of Microstructures in Commercial Steels. Met. Sci. J. 2013, 22, 1297–1306. [Google Scholar] [CrossRef]
- Petrov, R.; Kestens, L.; Wasilkowska, A.; Houbaert, Y. Microstructure and Texture of a Lightly Deformed TRIP-Assisted Steel Characterized by means of the EBSD Technique. Mater. Sci. Eng. A 2007, 447, 285–297. [Google Scholar] [CrossRef]
- Humphreys, F.J. Characterisation of Fine-Scale Microstructures by Electron Backscatter Diffraction (EBSD). Scr. Mater. 2004, 51, 771–776. [Google Scholar] [CrossRef]
- Hurley, P.J.; Humphreys, F.J. The Application of EBSD to the Study of Substructural Development in a Cold Rolled Single-Phase Aluminium Alloy. Acta Mater. 2003, 51, 1087–1102. [Google Scholar] [CrossRef]
- Humphreys, F.J.; Huang, Y.; Brough, I.; Harris, C. Electron Backscatter Diffraction of Grain and Subgrain Structures-Resolution Considerations. J. Microsc. 1999, 195, 212–216. [Google Scholar] [CrossRef] [PubMed]
- Humphreys, F.J. Review Grain and Subgrain Characterisation by Electron Backscatter Diffraction. J. Mater. Sci. 2001, 36, 3833–3854. [Google Scholar] [CrossRef]
- Melero, E.J.; Dijk, N.H.V.; Zhao, L. Martensitic Transformation of Individual Grains in Low-Alloyed TRIP Steels. Scr. Mater. 2007, 56, 421–424. [Google Scholar] [CrossRef]
- Melero, E.J.; Dijk, N.H.V.; Zhao, L.; Sietsma, J.; Offerman, S.E.; Wright, J.P.; van der Zwaag, S. Characterization of Individual Retained austenite Grains and Their Stability in Low-Alloyed TRIP Steels. Acta Mater. 2007, 55, 6713–6723. [Google Scholar] [CrossRef]
- Nowell, M.M.; Wallace, S.W.; Rafaelsen, J.; Nylese, T.L.; de Kloe, R.; Wright, S.I. Correlating Complementary Data for Improving Electron Backscatter Diffraction (EBSD) Microstructural Characterization of Geological Materials. Microsc. Microanal. 2017, 23, 2166–2167. [Google Scholar] [CrossRef][Green Version]
- de Diego-Calderón, I.; Rodriguez-Calvillo, P.; Lara, A.; Molina-Aldareguia, J.M.; Petrovd, R.H.; de Knijf, D.; Sabirov, I. Effect of Microstructure on Fatigue Behavior of Advanced High Strength Steels Produced by Quenching and Partitioning and the Role of Retained Austenite. Mater. Sci. Eng. A 2015, 641, 215–224. [Google Scholar] [CrossRef]
- Timokhina, I.B.; Hodgons, P.D.; Pereloma, E.V. Effect of Microstructure on the Stability of Retained Austenite in Transformation-Induced-Plasticity Steels. Metall. Mater. Trans. A 2004, 35, 2331–2341. [Google Scholar] [CrossRef]
- Deardo, A.J.; Garcia, C.I.; Cho, K.; Hua, M. New Method of Characterizing and Quantifying Complex Microstructures in Steels. Mater. Manuf. Process. 2010, 25, 33–40. [Google Scholar] [CrossRef]
- Zhou, Y.; Song, W.; Zeng, X.; Xie, C. Quantitative X-ray Rietveld Analysis of Metallic Aluminum Content in Nano-Aluminum Powders. Mater. Lett. 2012, 67, 177–179. [Google Scholar] [CrossRef]
- Mccusker, L.; Mccusker, L.; Cox, D.R.; Louër, D.; Scardi, P. Rietveld Refinement Guidelines. J. Appl. Crystallogr. 1999, 32, 36–50. [Google Scholar] [CrossRef]
- Parish, C.; Watkins, T.; Rios, O.; Mackiewicz-Ludtka, G.; Ludtka, G.; Cavin, O. Characterization of Retained Austenite and Carbides in Stainless Steel by Combined EBSD, EDS, and XRD. Microsc. Microanal. 2011, 17, 410–411. [Google Scholar] [CrossRef]


© 2019 by the authors. Licensee MDPI, Basel, Switzerland. This article is an open access article distributed under the terms and conditions of the Creative Commons Attribution (CC BY) license (http://creativecommons.org/licenses/by/4.0/).