Article

Variation of Magnetic Memory Signals in Fatigue Crack Initiation and Propagation Behavior

1
College of Mechanical and Transportation Engineering, China University of Petroleum-Beijing, Beijing 102200; China
2
CNOOC Research Institute, Beijing 100029, China
*
Author to whom correspondence should be addressed.
Metals 2019, 9(1), 89; https://doi.org/10.3390/met9010089
Submission received: 13 December 2018 / Revised: 9 January 2019 / Accepted: 11 January 2019 / Published: 16 January 2019

Abstract

:
To monitor fatigue crack initiation and propagation, and to judge the fatigue damage status of ferromagnetic material, fatigue bending tests of four-point single edge notch bend (SENB4) specimens were carried out. Metal magnetic memory signals were measured during the whole fatigue process. The results showed that the fatigue process could be divided into four stages by observing the morphology of the fracture surface. With the increase of fatigue loading cycles, the tangential component of the magnetic field (Hx) and the normal component of the magnetic field (Hy) increased. At the notch Hx presented a “trough” shape and had a maximum value at the midpoint, while Hy at the notch rotated clockwise around the midpoint. Compared with the tangential characteristic parameters, the variation of normal characteristic parameters (i.e., maximum gradient value of Hy (Ky-max) and the variation range of Hy at the notch (∆Hyn), with the fatigue loading cycles are more similar to the variation of fatigue crack length with loading cycles), both Ky-max and ∆Hyn had a good linear relationship with fatigue crack length. Plastic deformation accumulated on both sides of the fatigue crack, and metal magnetic memory (MMM) signals measured from the specimens were able to indicate the location of the fatigue crack and the variation of the fatigue crack length. Furthermore, the distribution of magnetic signals was analyzed according to the theories of stress magnetization and magnetic flux leakage.

1. Introduction

Under the action of alternating loads, micro-cracks are formed in the local stress concentration area when ferromagnetic components undergo a certain number of fatigue loading cycles, with the propagation of crack components fracturing last. Fatigue damage has the characteristics of sudden occurrence in time, limitation in position, and sensitivity to the environment. Therefore, it can be difficult to find in time and can result in the occurrence of accidents [1,2,3]. In order to prevent ferromagnetic components from failure due to fatigue fracture, they should be periodically inspected to obtain their fatigue damage status. This has great significance to ensure the safe operation of components.
Traditional nondestructive testing (NDT) methods such as ultrasonic testing (UT), radiographic inspection, and eddy current testing can effectively detect macroscopic cracks and defects, but these methods cannot judge the early damage degree of ferromagnetic components caused by stress concentration [4,5]. Metal magnetic memory testing (MMMT) technology was firstly proposed by Russian researchers at the 50th International Welding Conference in 1997 [6,7]. This technology is a kind of testing method which not only judges the stress concentration degree but also inspects the existing defects for ferromagnetic components [8,9].
The principle of MMMT is the stress magnetization effect. Many researchers have made great efforts to explain the stress magnetization effect [10,11] including: self-magnetic flux leakage theory based on magnetism machinery effect, magnetic permeability theory based on micro magnetization, and energy balance theory based on ferromagnetism. In total, under the combined action of external loads and geomagnetic fields, the orientation and irreversible reorientation of the magnetic domain wall with magnetostriction will result in the variation of the magnetic field at the stress concentration and defect region. The tangential component of a magnetic field Hx has the maximum value, while the normal component of the magnetic field Hy changes the polarity and crosses the zero point, which are typical features of MMMT. At the same time, it should be noted that metal magnetic memory (MMM) technique is a weak magnetic field detection method, where the geomagnetic field acts as the magnetic field excitation instead of an artificial magnetic field.
Shi [12] and Leng [13] investigated the magnetic signals’ variations in ferromagnetic components under cyclic tensile and bending loads, which provided the basis for the application of MMMT to fatigue testing. Huang [14] and Li [15] investigated the relationship between crack length and gradient of Hy by carrying fatigue bending tests. Chowdhury [16] and Hu [17] also investigated the mechanisms of fatigue crack growth and studied the magnetic field variation. In previous studies, the variations of magnetic signals in different stages of the fatigue process were not deeply discussed or fully understood. In this paper, four-point single-edge notch bend (SENB4) specimens were used for fatigue bending tests, and both the tangential component Hx and normal component Hy measured from the notch were investigated. The magnetic hysteresis loop induced by alternating loads with the increase of fatigue loading cycles is discussed. Plastic deformation was accumulated in the stress concentration area and on both sides of the fatigue crack, and magnetic flux leakage of the specimen increased with the increase of fatigue crack length.

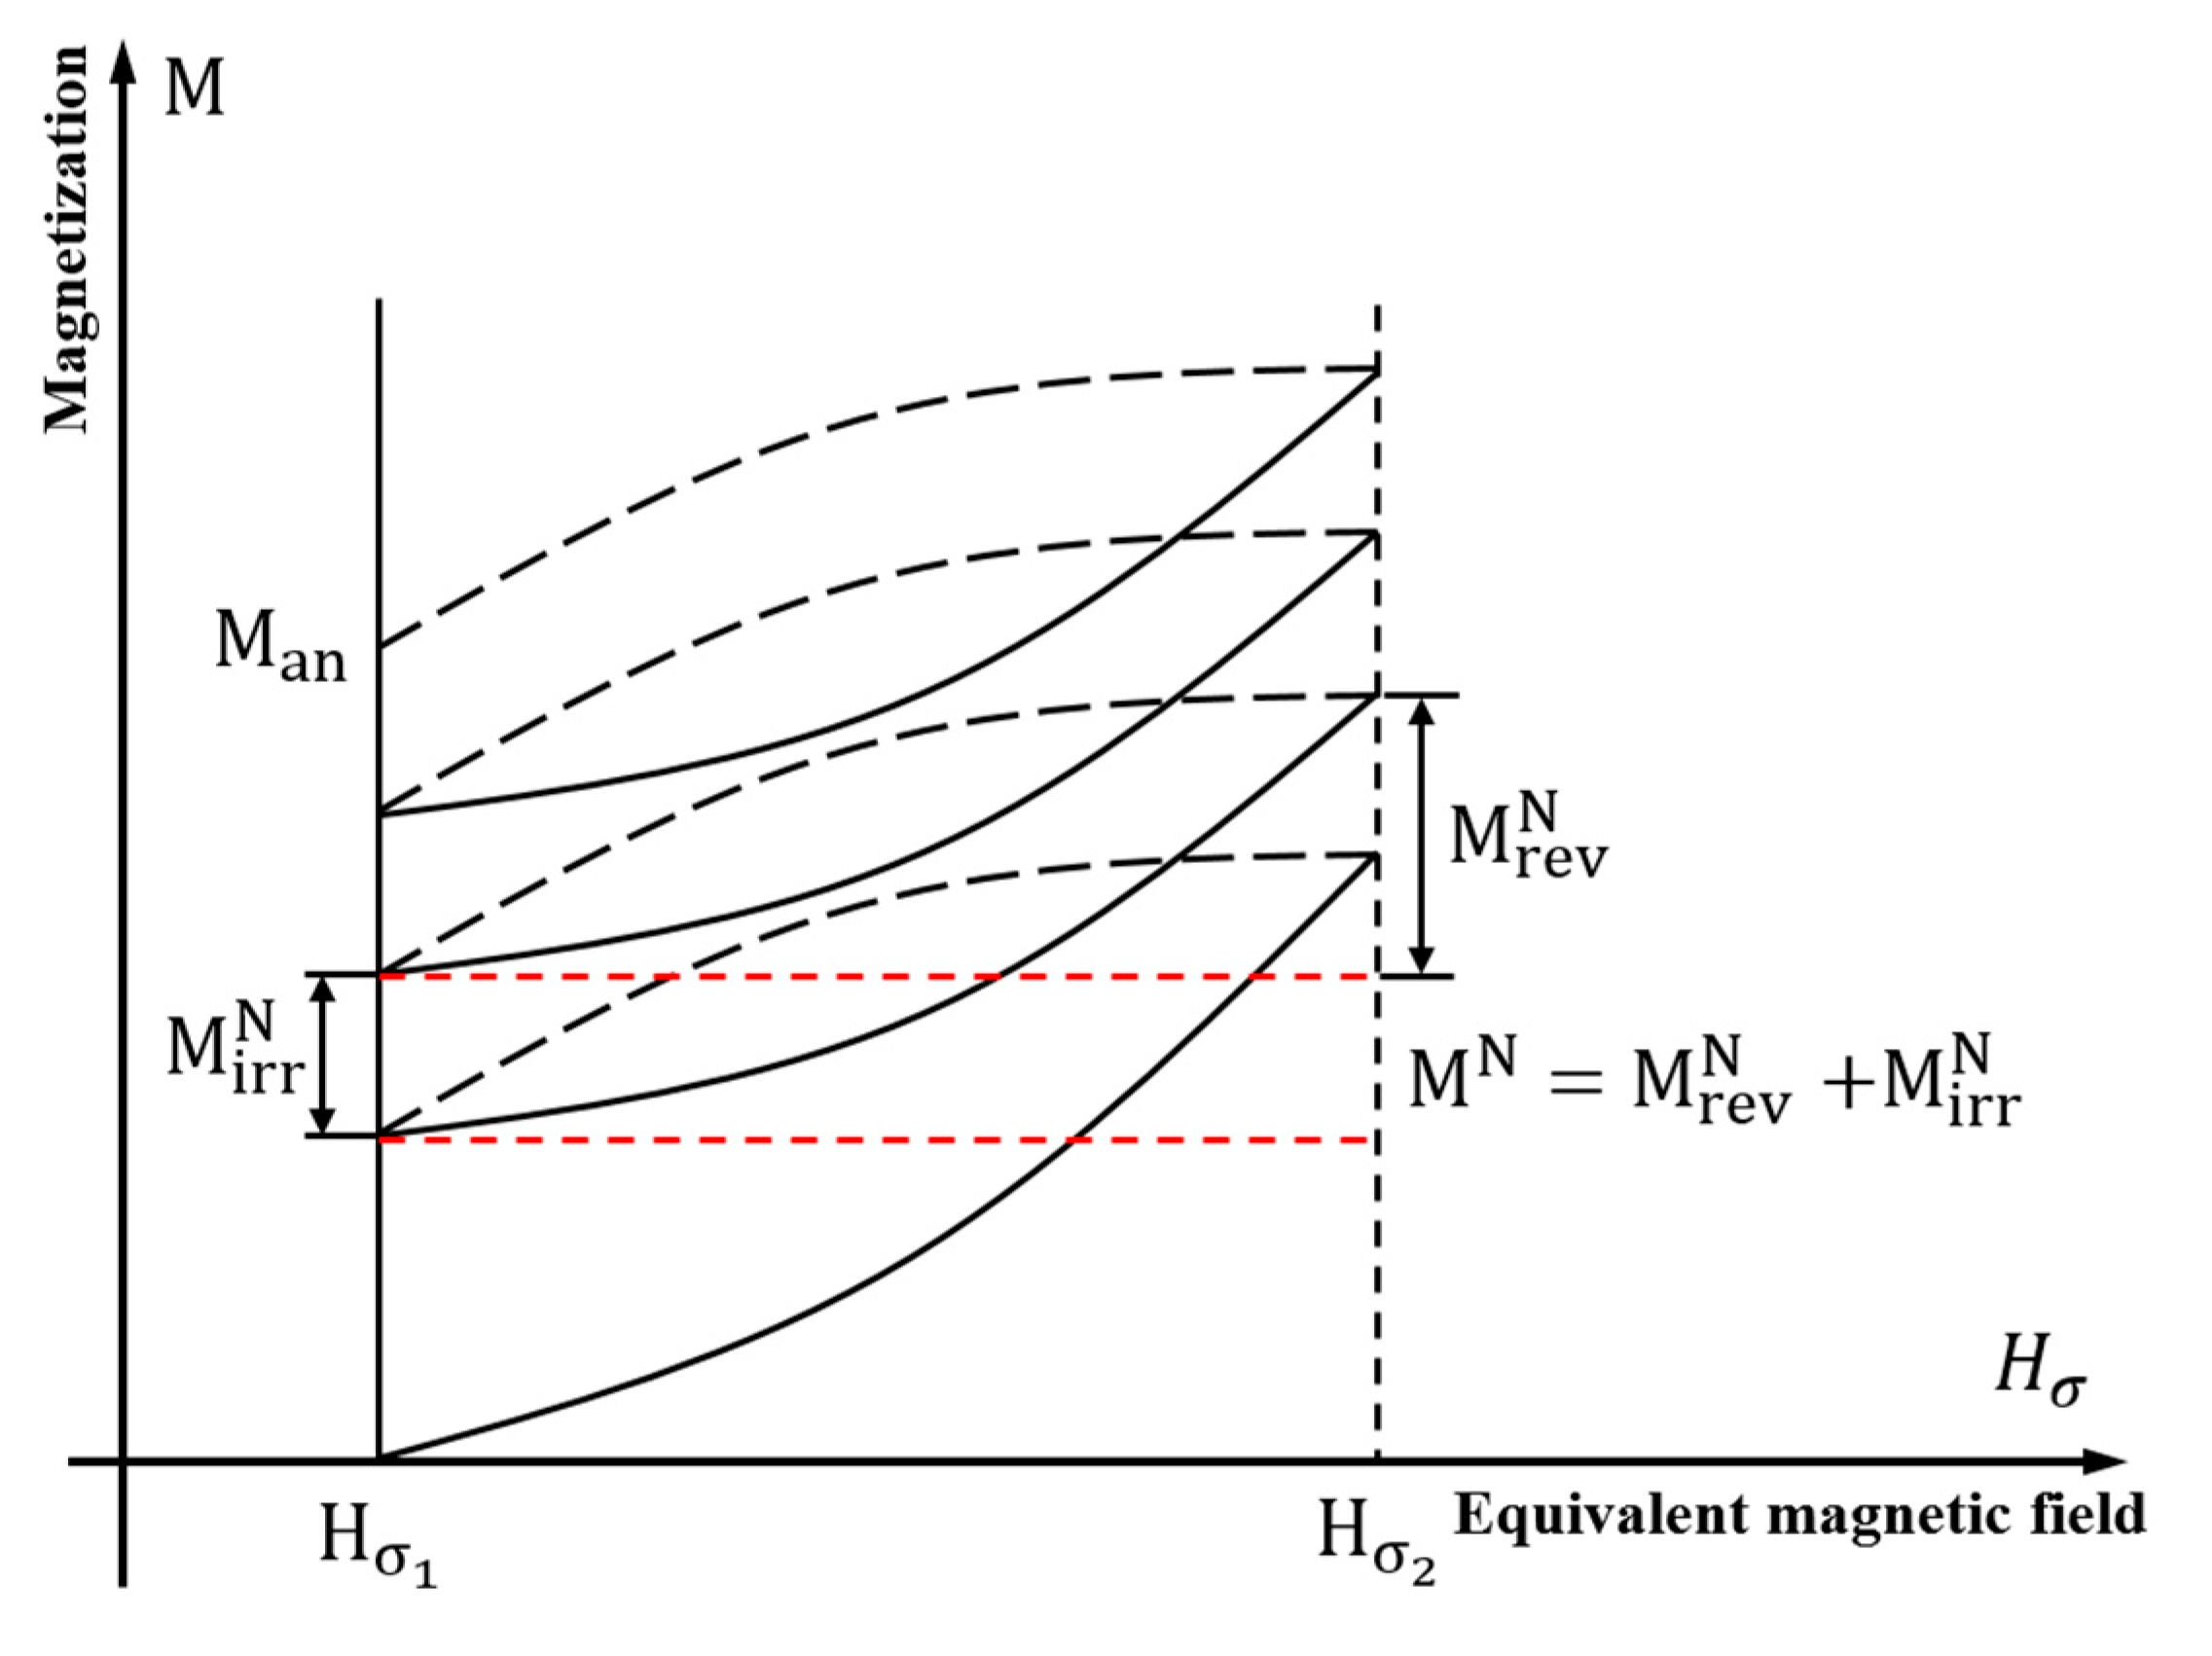
2. Theoretical Modeling

Based on the model by Jiles and Atherton [18,19,20], when a ferromagnetic material is subjected to stress its magnetization state will change. The application of stress not only produces plastic deformation but also causes magnetostriction strain. The effect of applying stress to ferromagnetic materials is equivalent to applying an effective magnetic field on them. The equivalent magnetic field under the action of the stress can be expressed as [21]:
H σ = 3 2 σ μ 0 ( d λ dM ) σ = 3 2 σ 0 μ 0 ( d λ dM ) σ ( cos 2 θ υ sin 2 θ ) ,
where θ is the angle between the axis of the applied stress and the magnetic field, λ is magnetostrictive coefficient, M is magnetization, υ is Poisson’s ratio, and μ0 is the permeability of vacuum.
The total effective magnetic field Heff, including the contribution of magnetic field H and stress σ, can be represented as:
H eff = H + α M an + H σ .
Anhysteretic magnetization Man at field H and stress σ are identical to the anhysteretic magnetization at field H + Hσ and zero stress. In the isotropic limit. Man can be expressed as:
M an ( H , σ ) = M s [ coth ( H + H σ + α M a ) a aH + H σ + α M ] ,
where Ms is saturation magnetization, a is the shape factor of the hysteresis loop related to the dislocation density of the stress concentration region, and α quantifies the amount of domain coupling.
In the fatigue process, maximum stress caused by fatigue loads is still in the elastic stage. Assuming that the minimum and maximum stress are σ1 and σ2, according to Equation (1) equivalent magnetic fields Hσ1, Hσ2 under the action of σ1 and σ2 can be expressed as:
H σ 1 = 3 2 σ 1 μ 0 ( d λ dM ) σ 1 = 3 2 σ 0 μ 0 ( d λ dM ) σ 1 ( cos 2 θ 1 υ sin 2 θ 1 ) ,
H σ 2 = 3 2 σ 2 μ 0 ( d λ dM ) σ 2 = 3 2 σ 0 μ 0 ( d λ dM ) σ 2 ( cos 2 θ 2 υ sin 2 θ 2 ) .
Anhysteretic magnetization Man1, Man2 at the geomagnetic field and stress σ1, σ2 based on Equation (3) can be represented as:
M an ( H , σ 1 ) = M S [ cot h ( H + H σ 1 + α M a ) a H + H σ 1 + α M ] ,
M an ( H , σ 2 ) = M S [ cot h ( H + H σ 2 + α M a ) a H + H σ 2 + α M ] .
The magnetization intensity of a ferromagnetic material is not only related to the external magnetic field H and stress σ, but also the history of magnetization. The relationship between magnetization M, reversible magnetization Mrev, irreversible magnetization Mirr, and anhysteretic magnetization Man can be listed as:
M rev = c ( M an M irr ) ,
M = M rev + M irr .
Through the above equations, Figure 1 shows the magnetic hysteresis loop caused by σ1, σ2, where N is the fatigue loading cycles. It can be seen that with the increase of fatigue loading cycles the magnetic field is accumulated with the history of magnetization. The orientation and irreversible reorientation of magnetic domains occurs in the stress concentration and deformation regions. The magnetic charge density of ferromagnetic material increases and when the magnetic charge density reaches saturation magnetic charge density, it will not change with the increase of fatigue loading cycles. In this paper, because the V-notch accelerated the process of fatigue crack initiation and propagation, before magnetic charge density reached its saturation state, the specimen had already fractured, and so the magnetic field increased with fatigue loading cycles N under the action of alternating loads.

3. Experiment

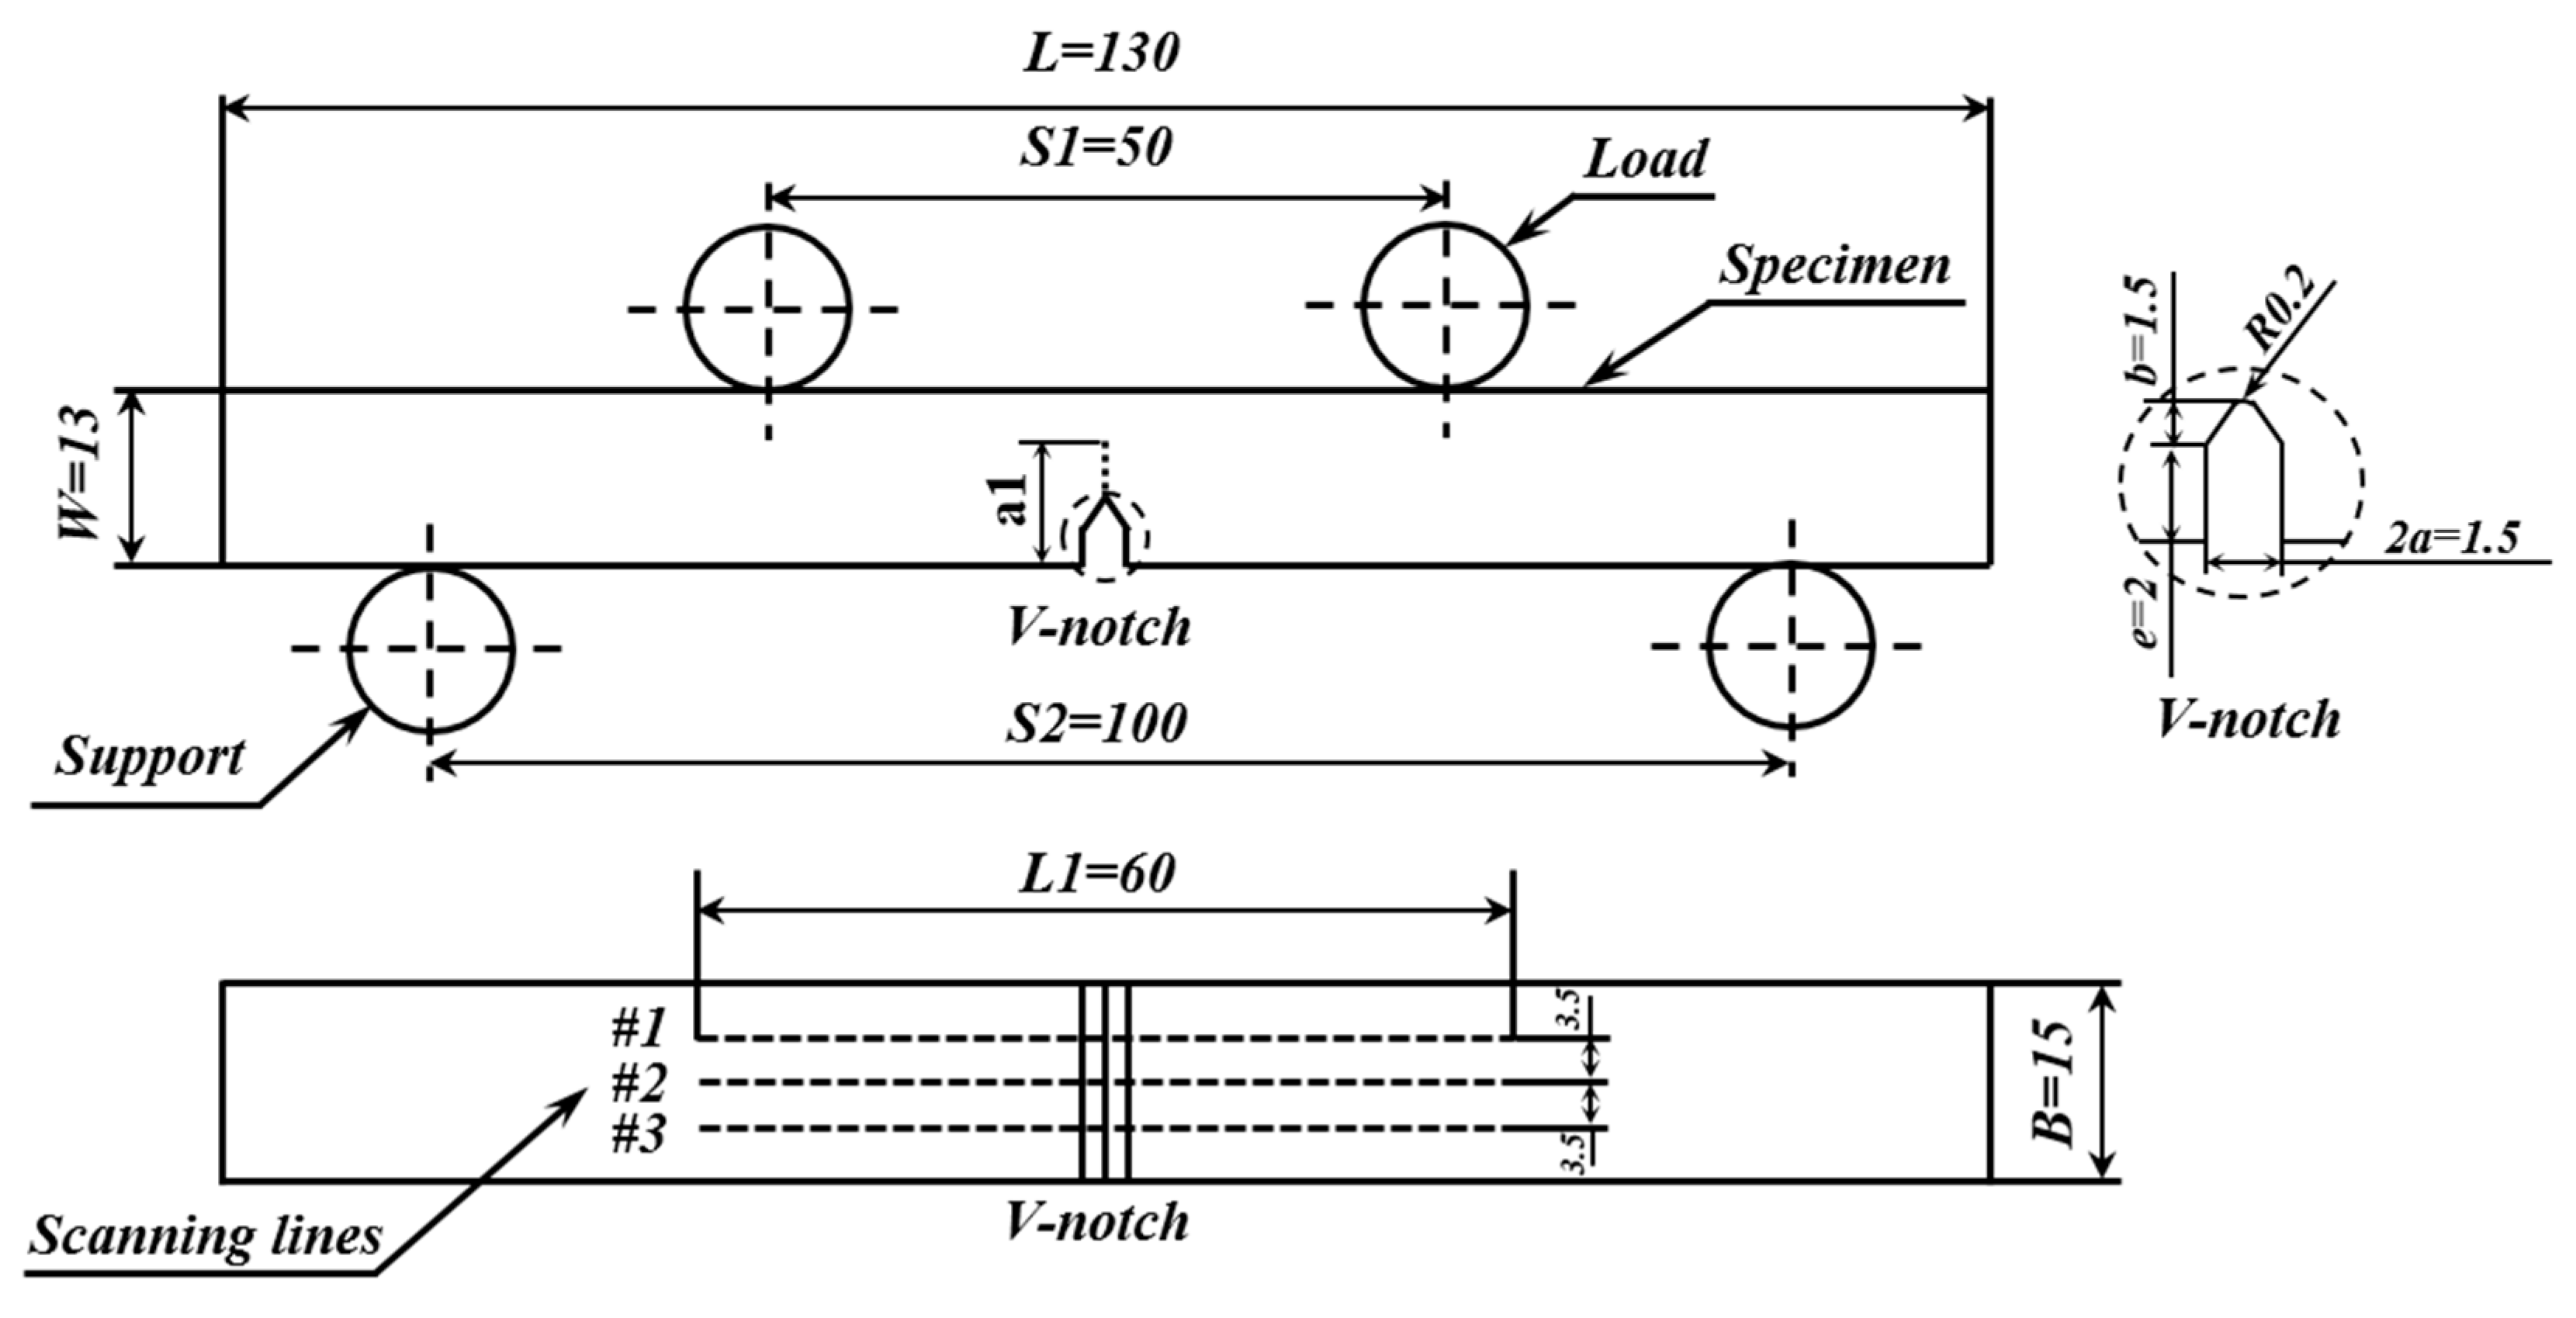
3.1. Specimen Preparation

SENB4 specimens were cut from a plate made by X80 steel, which has high strength, excellent ductility, and corrosion resistance. Its chemical composition and mechanical properties are given in Table 1 and Table 2, where σ0.2 is the yield strength, σb is the tensile strength, ψ is the elongation, and σ0.2b is the yield ratio. In order to accelerate the initiation of a fatigue crack, a V-notch was fabricated at the center of the specimen, and the dimensions are shown in Figure 2. Scanning lines #1 to #3 were three parallel lines on the surface of the specimen for MMMT; #2 was located at the center of the specimen, while #1 and #3 were distributed symmetrically on both sides of the center line.

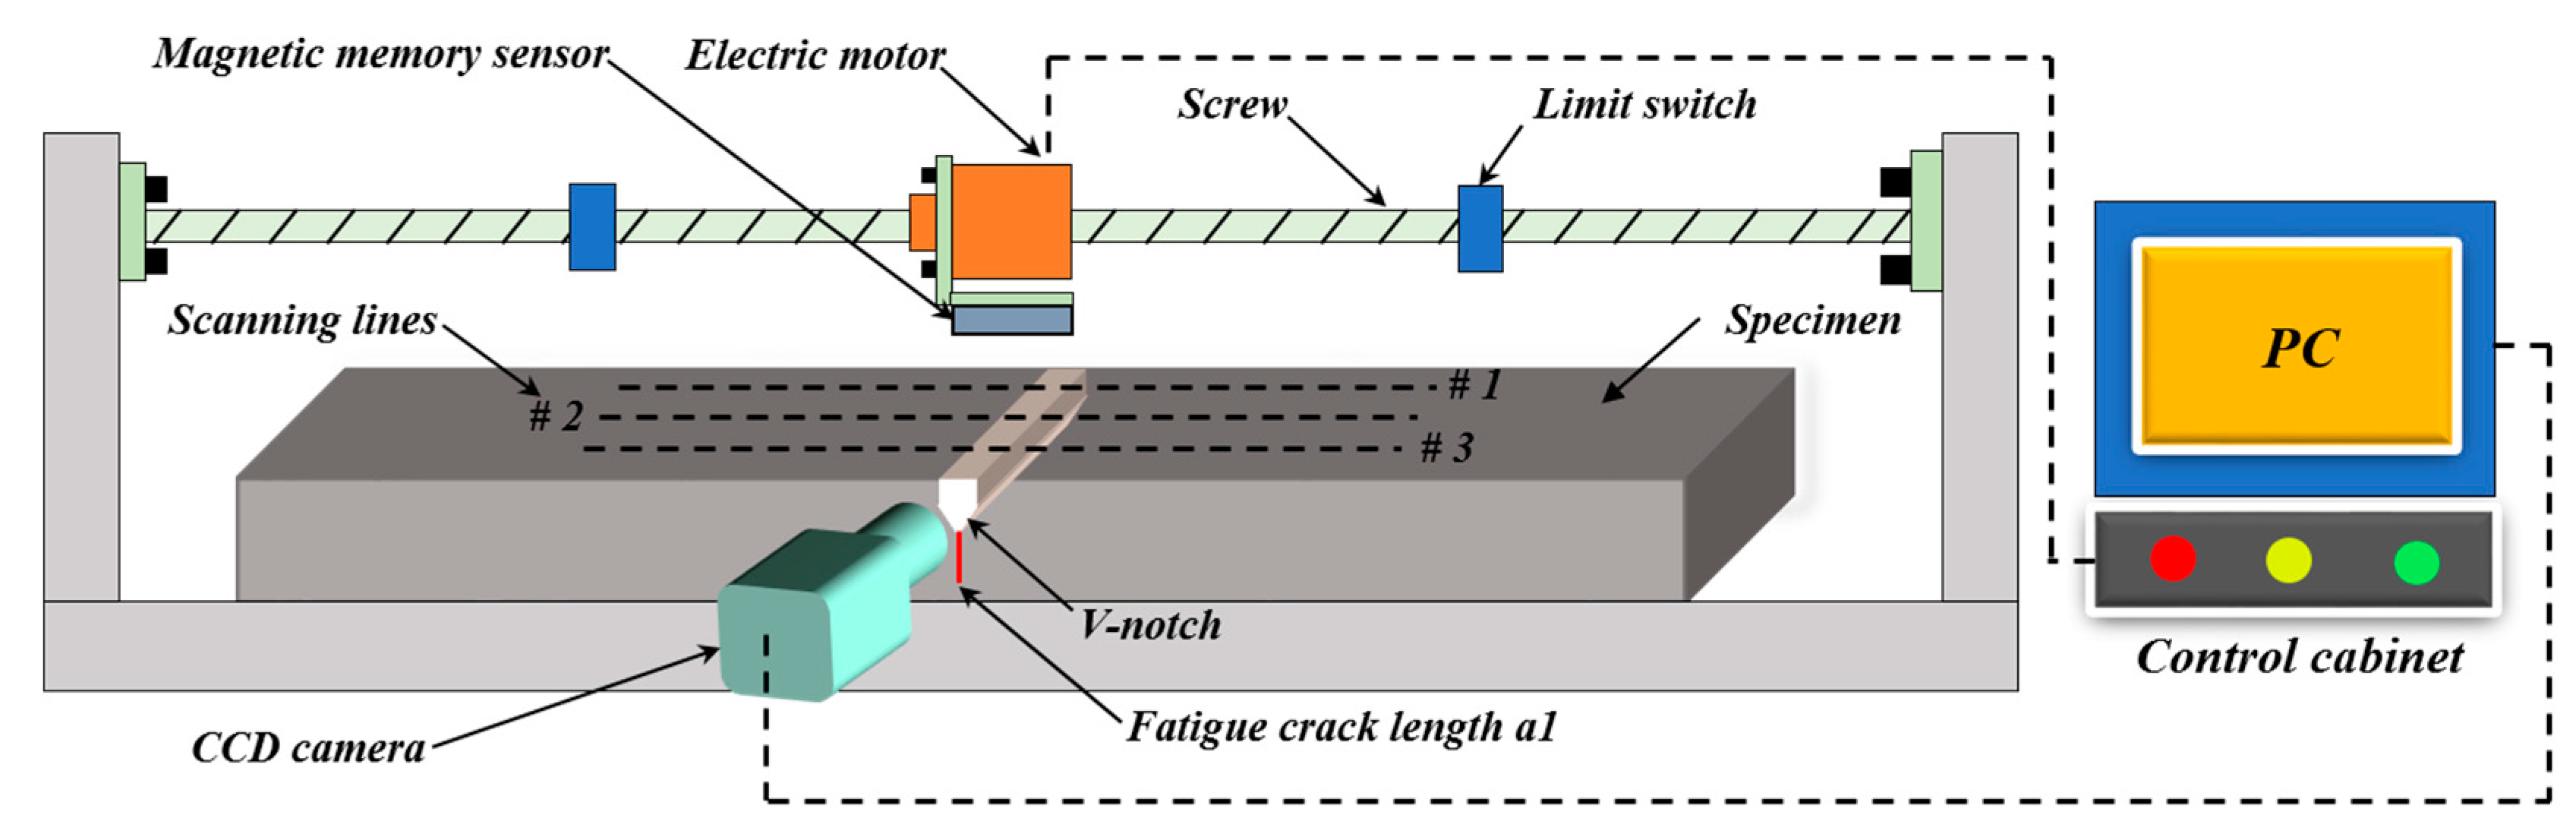
3.2. Instrument and Testing Method

Before fatigue bending tests, the specimen was polished to observe fatigue crack length by using an industrial CCD camera (ISH300, TUCSEN, Fuzhou, China), then demagnetized through an alternating current demagnetizing machine (APS1102, GWINSTEK, Taiwan, China) to eliminate the effect of machining magnetization. The tests were carried out on the MTS810-25 (MTS, Eden prairie, MN, USA) servo hydraulic universal testing machine. A stress ratio (R = σminmax) of 0.1, maximum load of 10 kN, minimum load 1 kN, sinusoidal waveform, and a frequency of 15 Hz were selected in all the tests. After the specimen underwent a certain number of fatigue loading cycles, it was removed from the fatigue testing machine and placed on a non-ferromagnetic 3D testing platform along the direction of north–south. At this time the specimen was only affected by the geomagnetic field.
As shown in Figure 3, the magnetic field could be measured by a giant magneto resistance (GMR)-type magnetic memory sensor. The sensor of Hx was parallel to the specimen’s surface, while the sensor of Hy was perpendicular to the surface, with a lift-off value of 1 mm. Magnetic memory signals were measured with a uniform scanning speed (i.e., 6 mm/s) and the testing route was precisely controlled by limit switches. A CCD camera installed on an optical microscope through a special CCD interface U-PMTVC was used to observe the fatigue crack length. After collecting magnetic signals and measuring the crack length, the specimen was put back in the fatigue testing machine and underwent a certain number of fatigue loading cycles. The signals and crack length were measured again and the procedure above was repeated until the specimen was close to fracture.

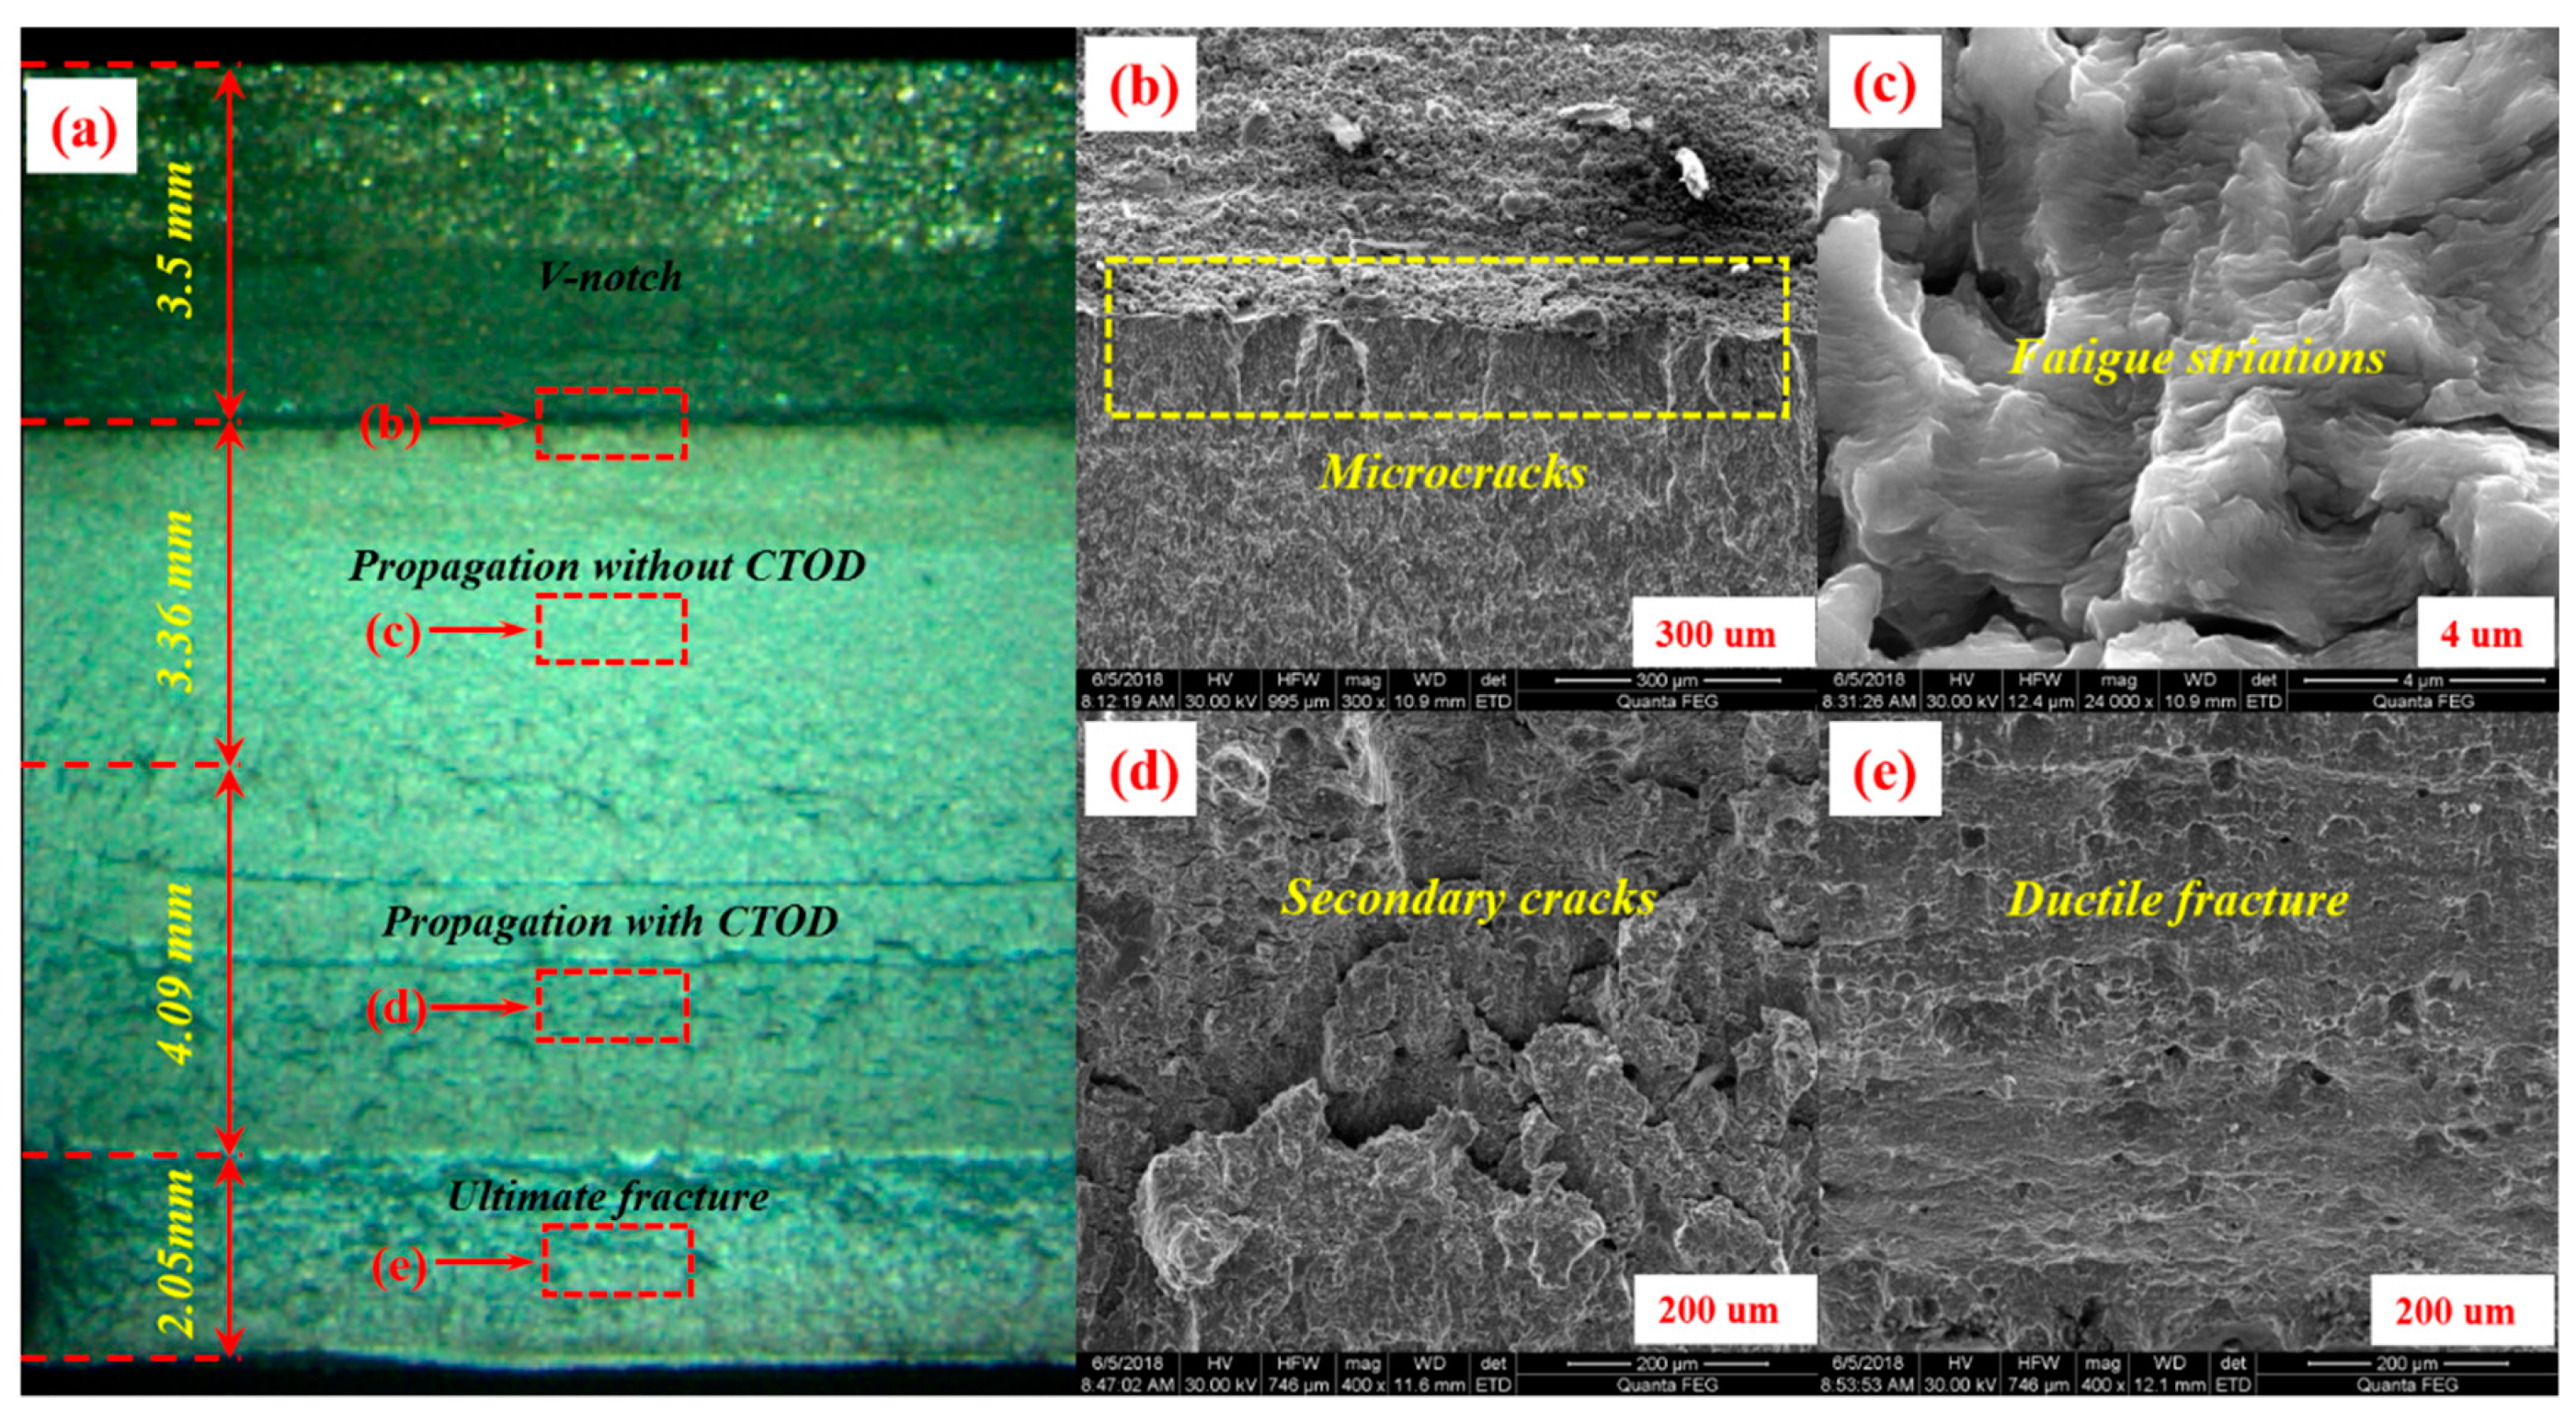
4. Results and Discussion

It should be noted that three specimens with the same shape and dimensions were applied to fatigue bending tests. The results of the three specimens were almost the same. Hx and Hy measured from the three parallel scanning lines of one specimen were almost similar. Considering the space limitations, only the results of one specimen’s scanning line #2 are discussed in this paper. The symbol of the magnetic field only represents polarity.

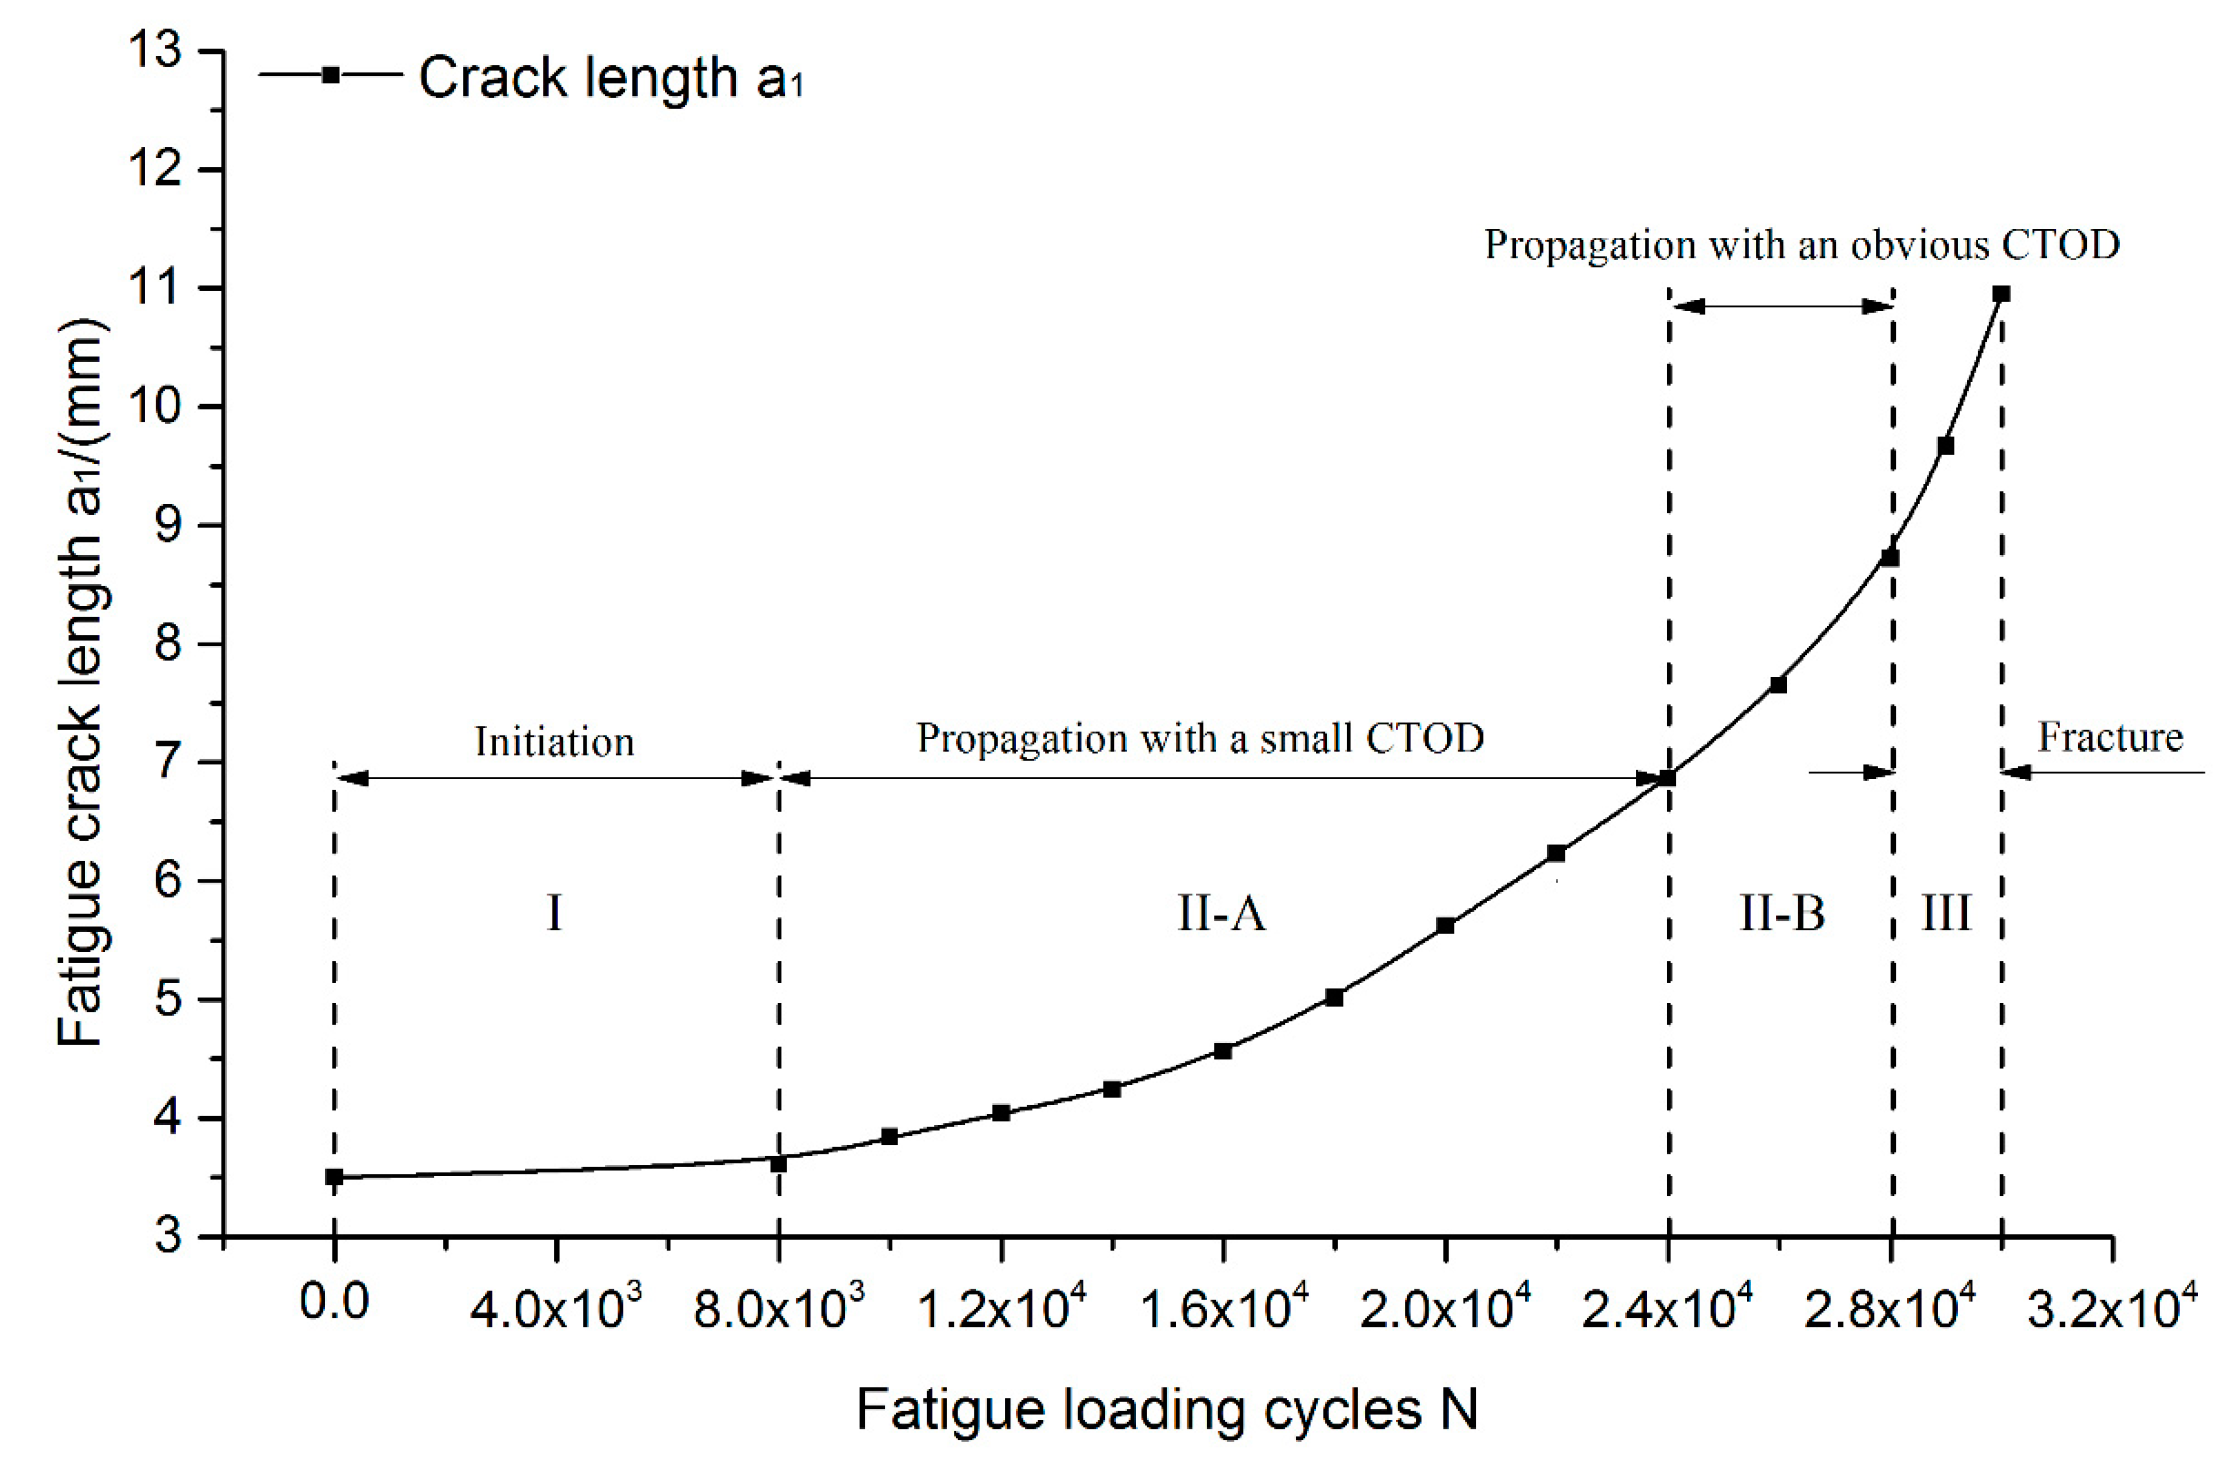
4.1. Four-Point Fatigue Bending Test

The specimen fractured after experiencing 3.0 × 10⁴ fatigue loading cycles and the crack length varied from an initial length of 3.5 mm to a fracture length of 10.95 mm. Through the observation of the fatigue crack propagation process and the analysis of fracture morphology, the whole fatigue process could be divided into four stages: initiation stage (I), propagation with a small crack tip opening displacement (CTOD) stage (II-A), propagation with an obvious CTOD stage (II-B), and fracture stage (III).
Figure 4 shows the scanning electron microscope (SEM) micrograph of the fatigue fracture surface, and the overall morphology is shown. The figure is divided into four parts, and the length of each part is noted (Figure 4a). Microcracks were formed at the root of the notch; with the increase of fatigue loading cycles microcracks beginning to form fatigue crack in stage I (Figure 4b). When the fatigue crack began to propagate, fatigue striations were observed by SEM in stage II-A (Figure 4c). The size of fatigue striations increased and some large secondary cracks could be observed in stage II-B (Figure 4d). The fracture sectional area decreased with the fatigue crack propagation, and when the stress reached the fracture strength, ductile fracture occurred in stage III (Figure 4e).
Figure 5 shows the relationship between fatigue crack length and fatigue loading cycles. Before fatigue loading cycles reached 8.0 × 10³, a1 had little change, as shown in stage I. Fatigue loading cycles varied from 8.0 × 10³ to 2.4 × 10⁴ and the slope of the curve increased slowly as shown in stage II-A. After 2.4 × 10⁴ fatigue loading cycles, a1 propagated fast as shown in stage II-B. When fatigue loading cycles reached 3.0 × 10⁴, a1 reached the maximum length in stage III.

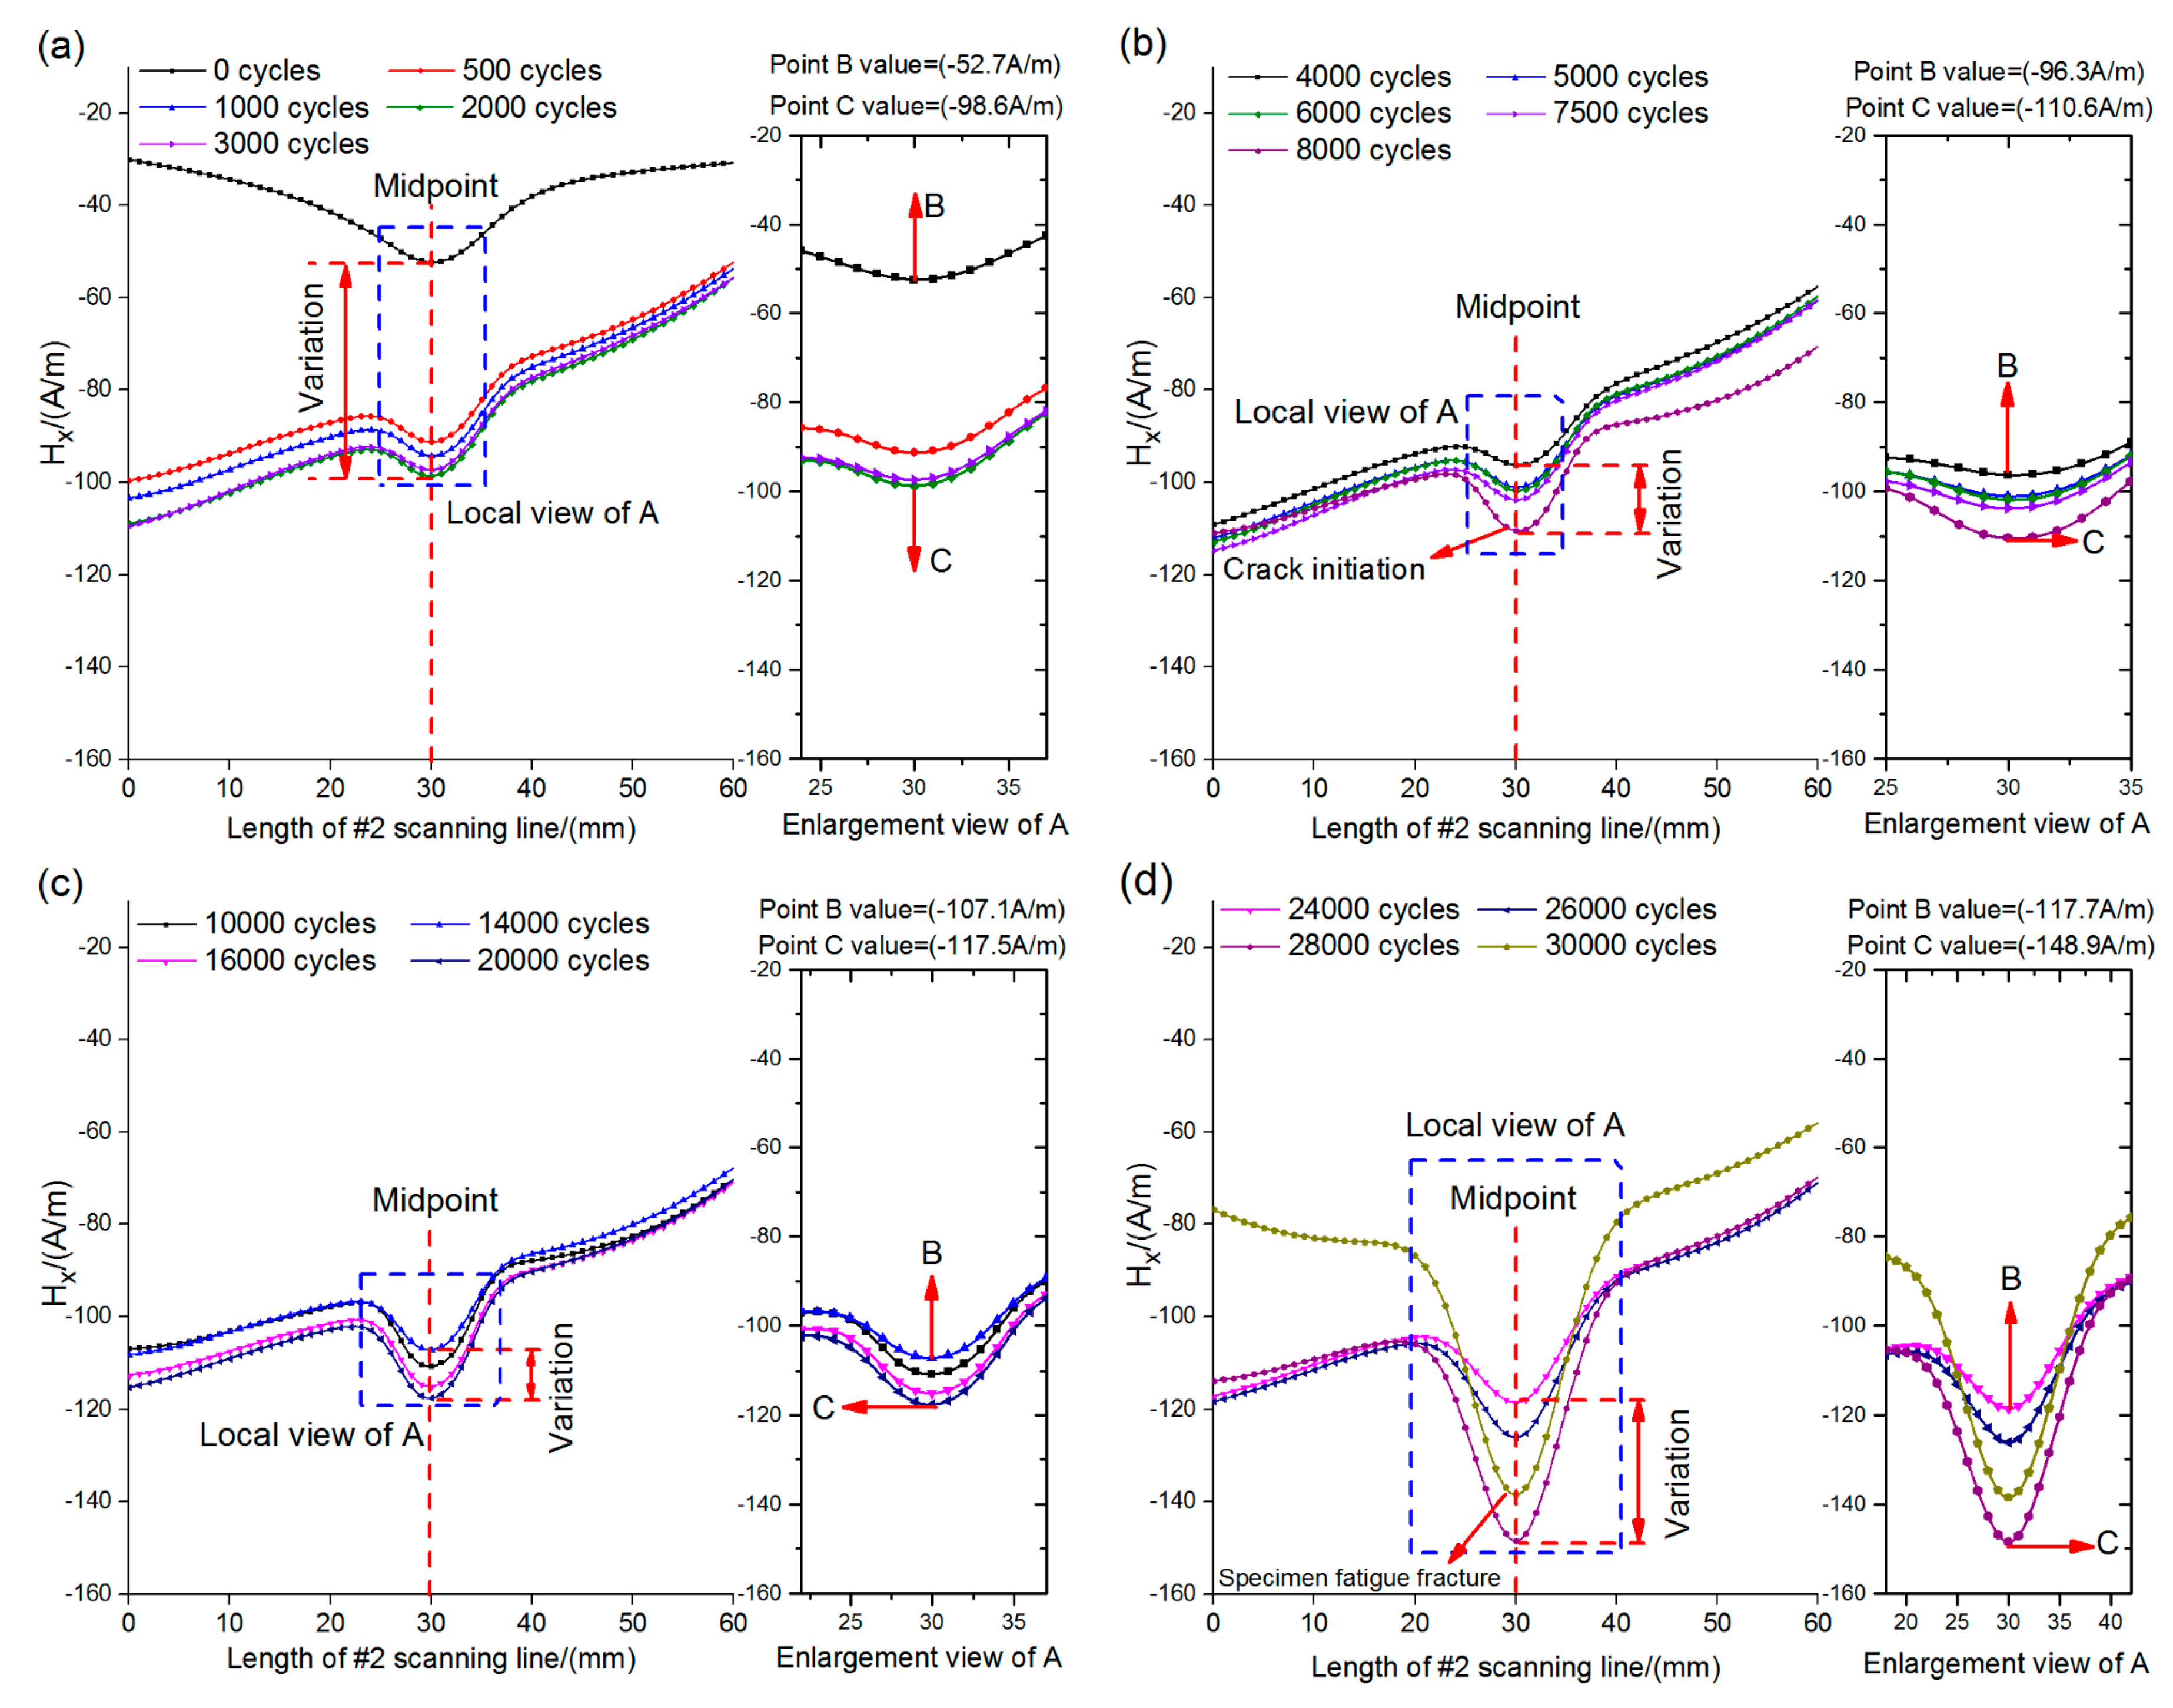
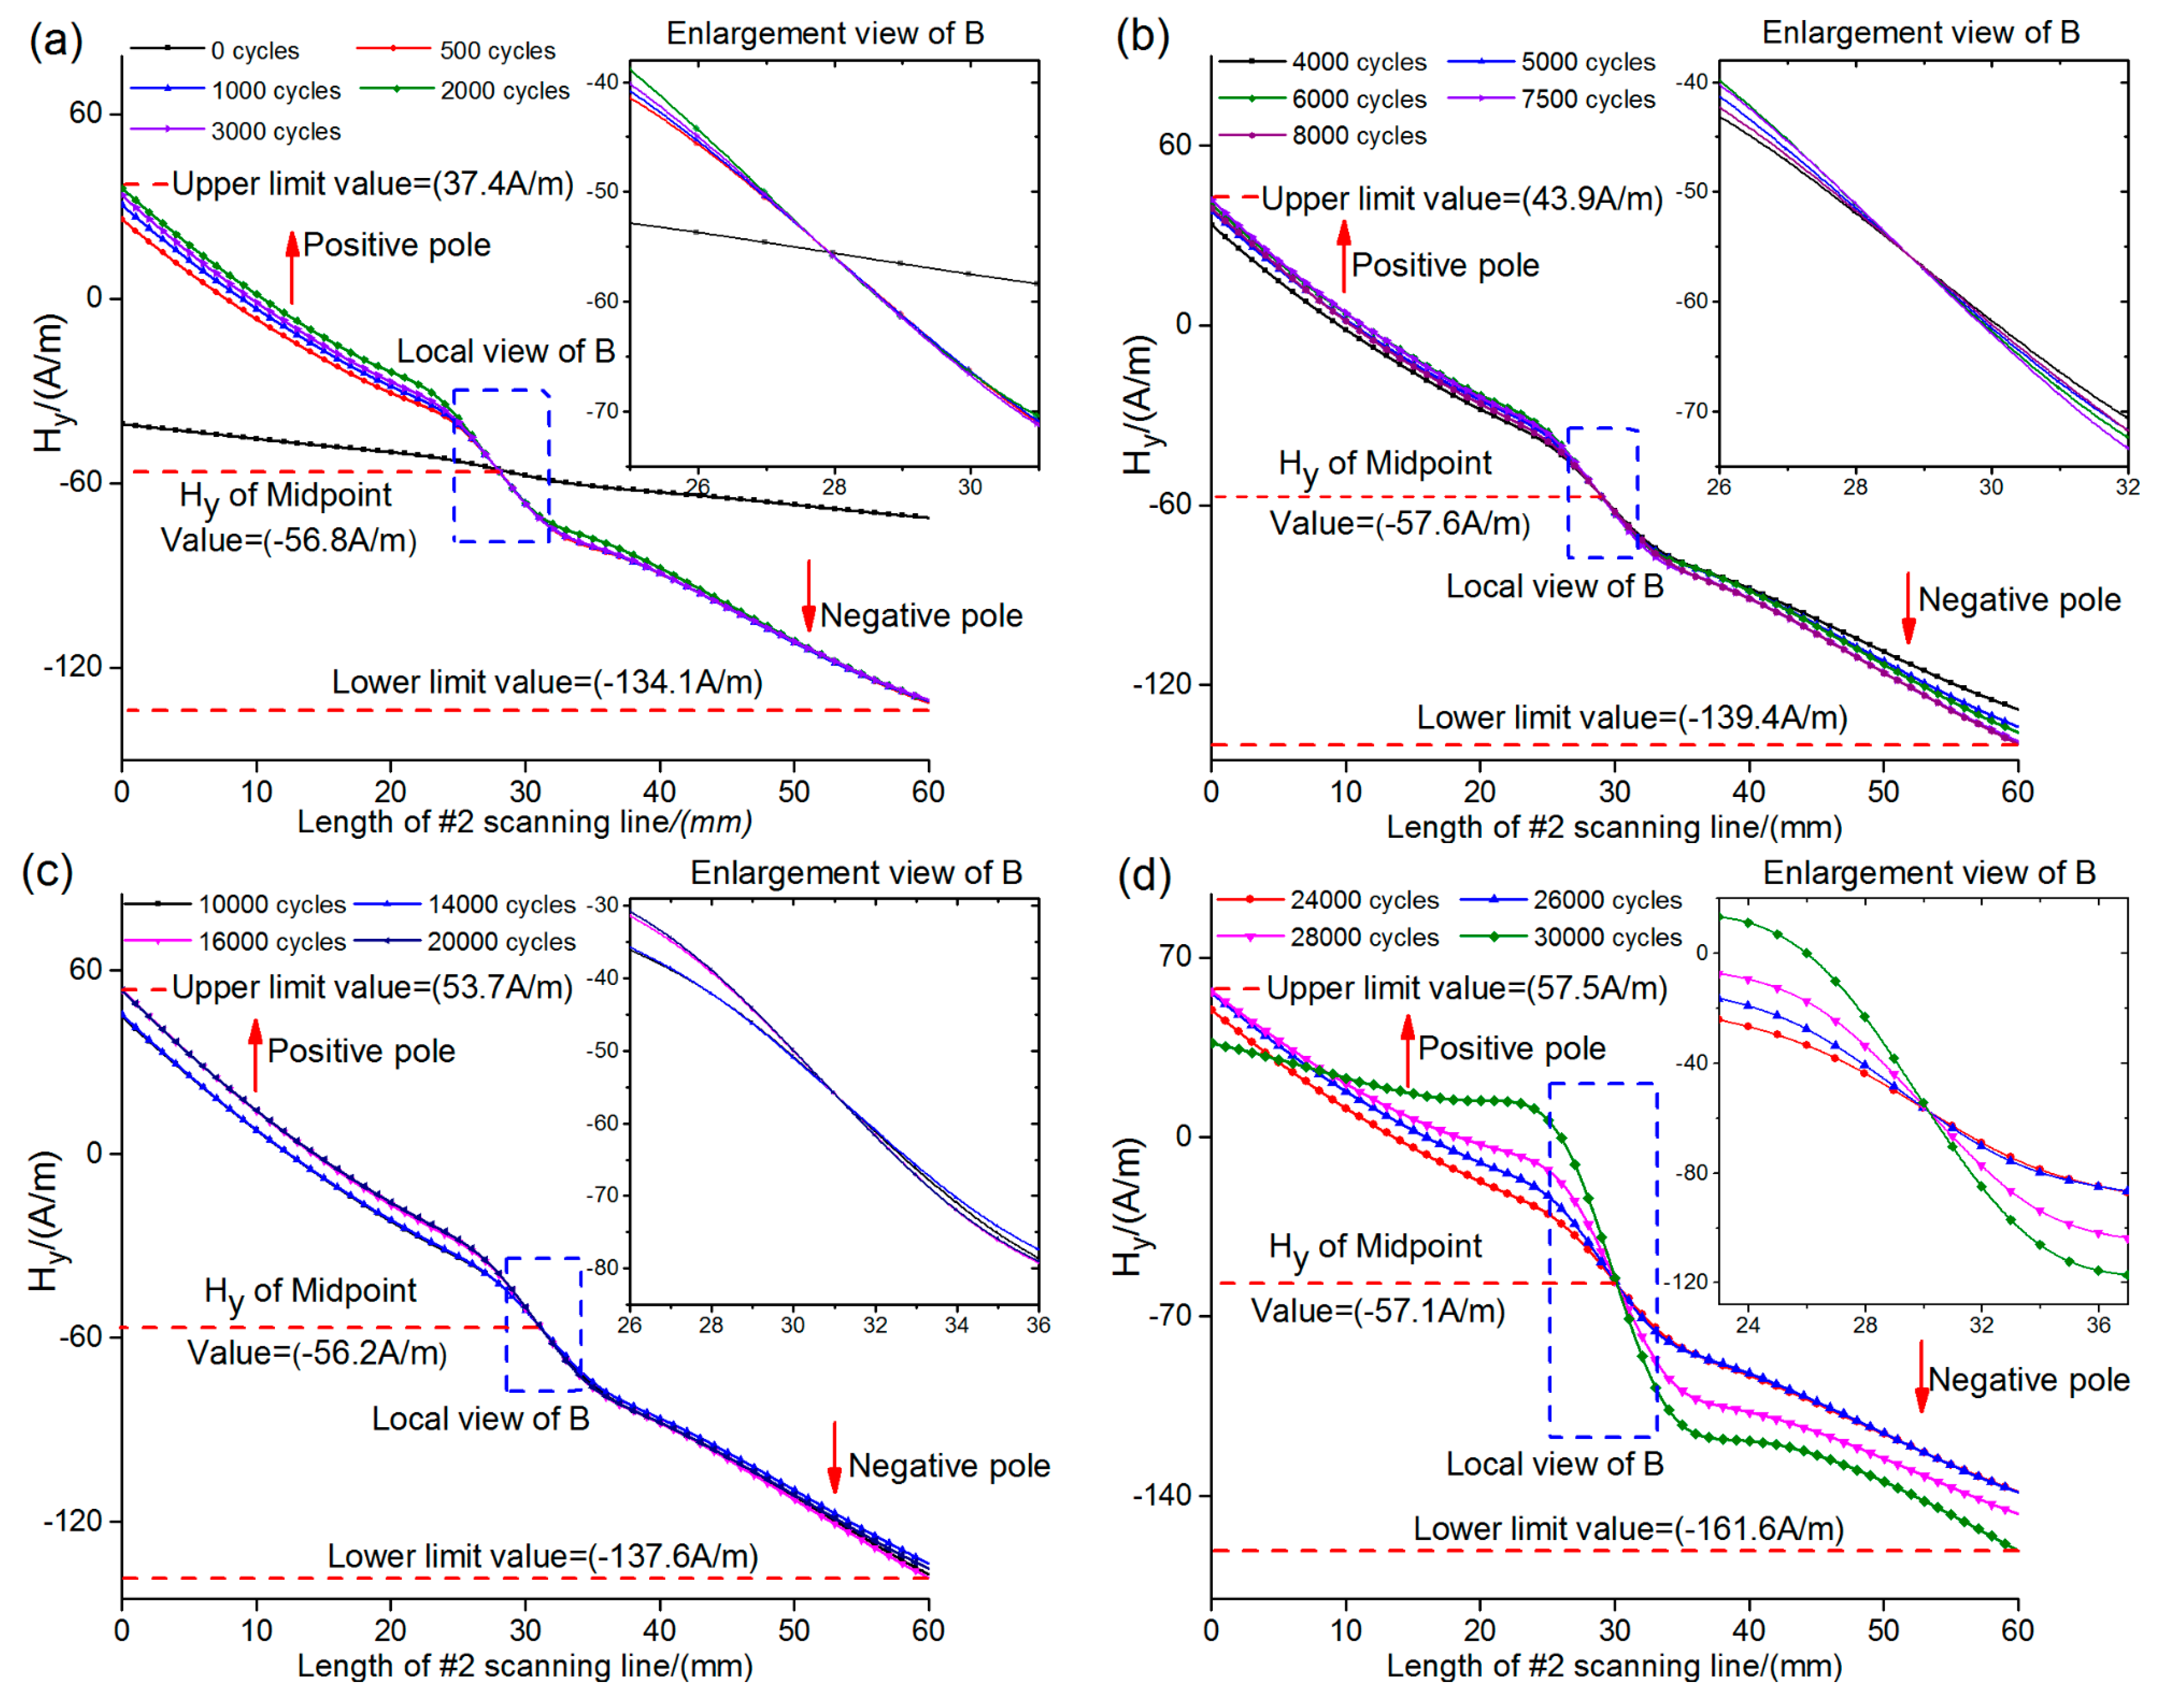
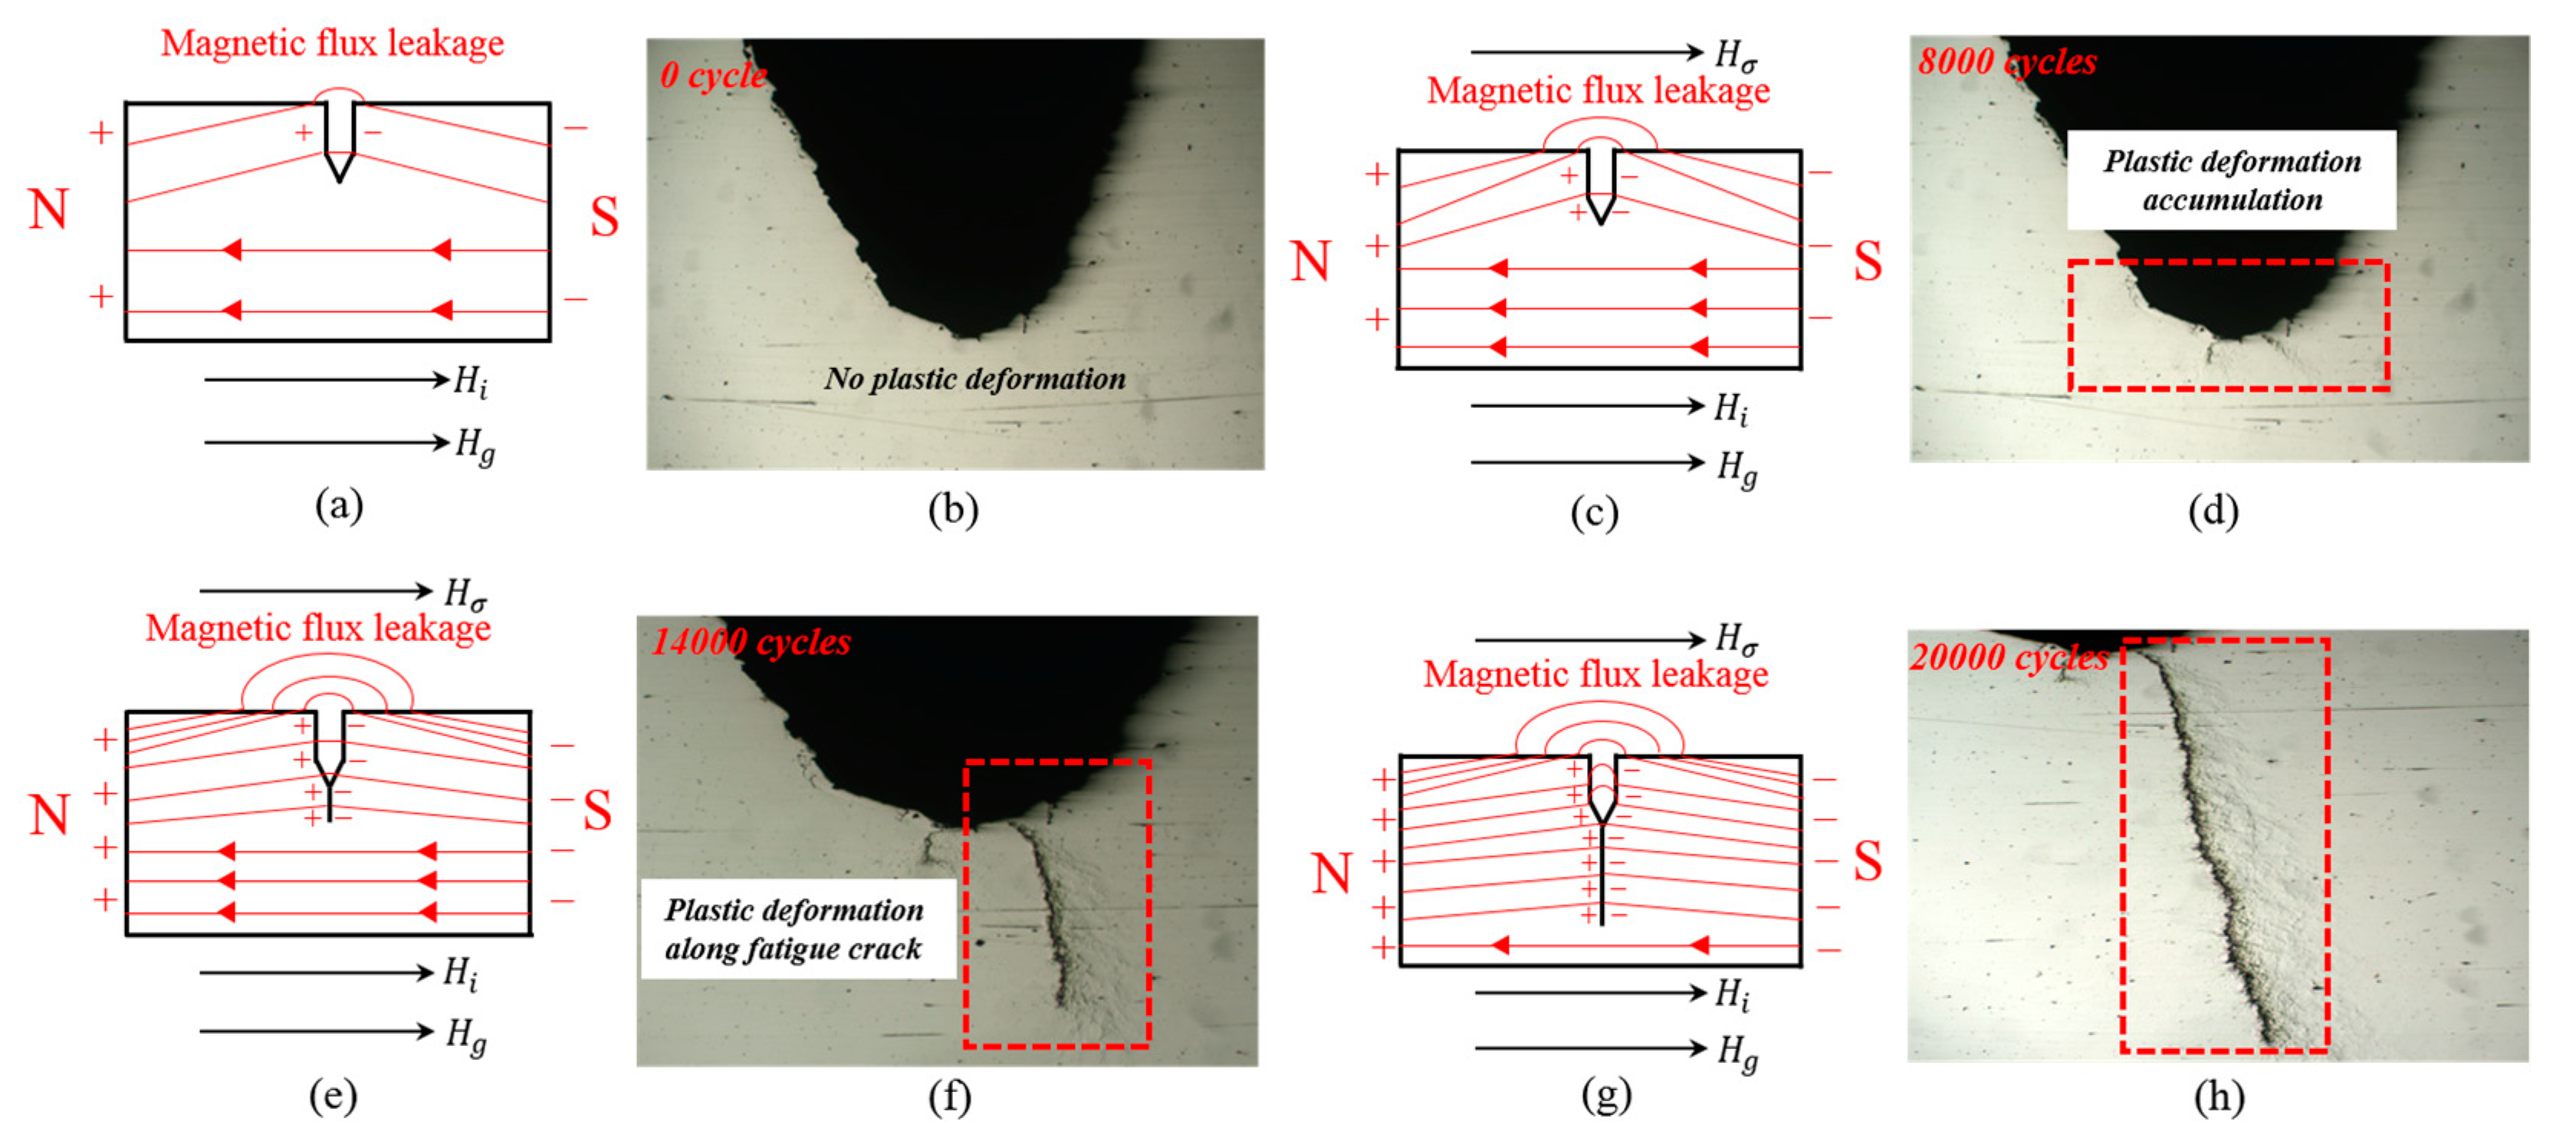
4.2. Relationship between Magnetic Memory Signals and Fatigue Loading Cycles

In order to investigate the variations of MMM signals with fatigue loading cycles, Hx and Hy were analyzed., Note that the symbol of the magnetic field only represents polarity.
Figure 6a,b shows the variations of Hx in stage I; the initial magnetic field was in range of −55 A/m to −30 A/m, and presented approximately as a horizontal line. However, the magnetic field at the notch mutated and had a maximum value. After 500 times of loading, Hx increased significantly and rotated counterclockwise, the magnetic field of the notch presented a “trough” shape, and the value of midpoint increased to −91.2 A/m. After that, the magnetic field increased slowly due to stress magnetization. When fatigue loading cycles reached 8.0 × 10³, microcracks appeared at the root of the notch, and Hx of the midpoint increased to −110.6 A/m. This was caused by the increase of magnetic flux leakage due to microcracks.
Figure 6c,d shows the variations of Hx during fatigue crack propagation and fracture stages. Fatigue loading cycles increased from 8.0 × 10³ to 1.4 × 10⁴, Hx of the midpoint decreased as a result of the stress concentration at the root being released due to the generation of microcracks, and the magnetic field caused by stress concentration reduced. From 1.4 × 10⁴ to 2.4 × 10⁴, Hx of midpoint increased, with the increase of fatigue crack length a1 more and more magnetic flux leakage came to the surface of the specimen. This obscured the effect of the stress release on the magnetic field. At 2.4 × 10⁴ cycles, fatigue crack propagation came into stage II-B, Hx of midpoint increased quickly under the action of crack propagation and CTOD, and it reached the maximum value at 2.8 × 10⁴ cycles. When the specimen fractured, the magnetic field of the specimen reduced, but was still at a high level, and the shape of the curve was similar to the initial magnetic field.
Figure 7 shows the variations of Hy with different fatigue loading cycles. Before loading, the initial magnetic signal was in the range of −74 A/m to −40 A/m and presented approximately as a horizontal line with a small slope. The magnetic field of the midpoint was −56.8 A/m. After 500 times of loading, the magnetic field of the midpoint remained nearly constant. The magnetic field of the whole specimen rotated clockwise around the midpoint. The rotational direction was opposite to Hx, the magnetic field on both sides of the specimen increased significantly, and the slope at the notch was higher than other regions (Figure 7a,b). With the increase of fatigue loading cycles, Hy kept rotating clockwise with a small angle. The slope of Hy and the magnetic field on both sides of the specimen continued to increase. The magnetic field of the midpoint fluctuated around −56.8 A/m when the slope of Hy at the notch increased sharply, indicating that the specimen was close to fracturing (Figure 7c,d).
Through analyzing the variation trends of Hx and Hy, it could be seen that both Hx and Hy increased during the whole fatigue process and mutated at the notch due to stress concentration. Magnetic signals collected from the front of the notch could be used to indicate the location of stress concentration and the change of fatigue damage status. This was close to practical application.

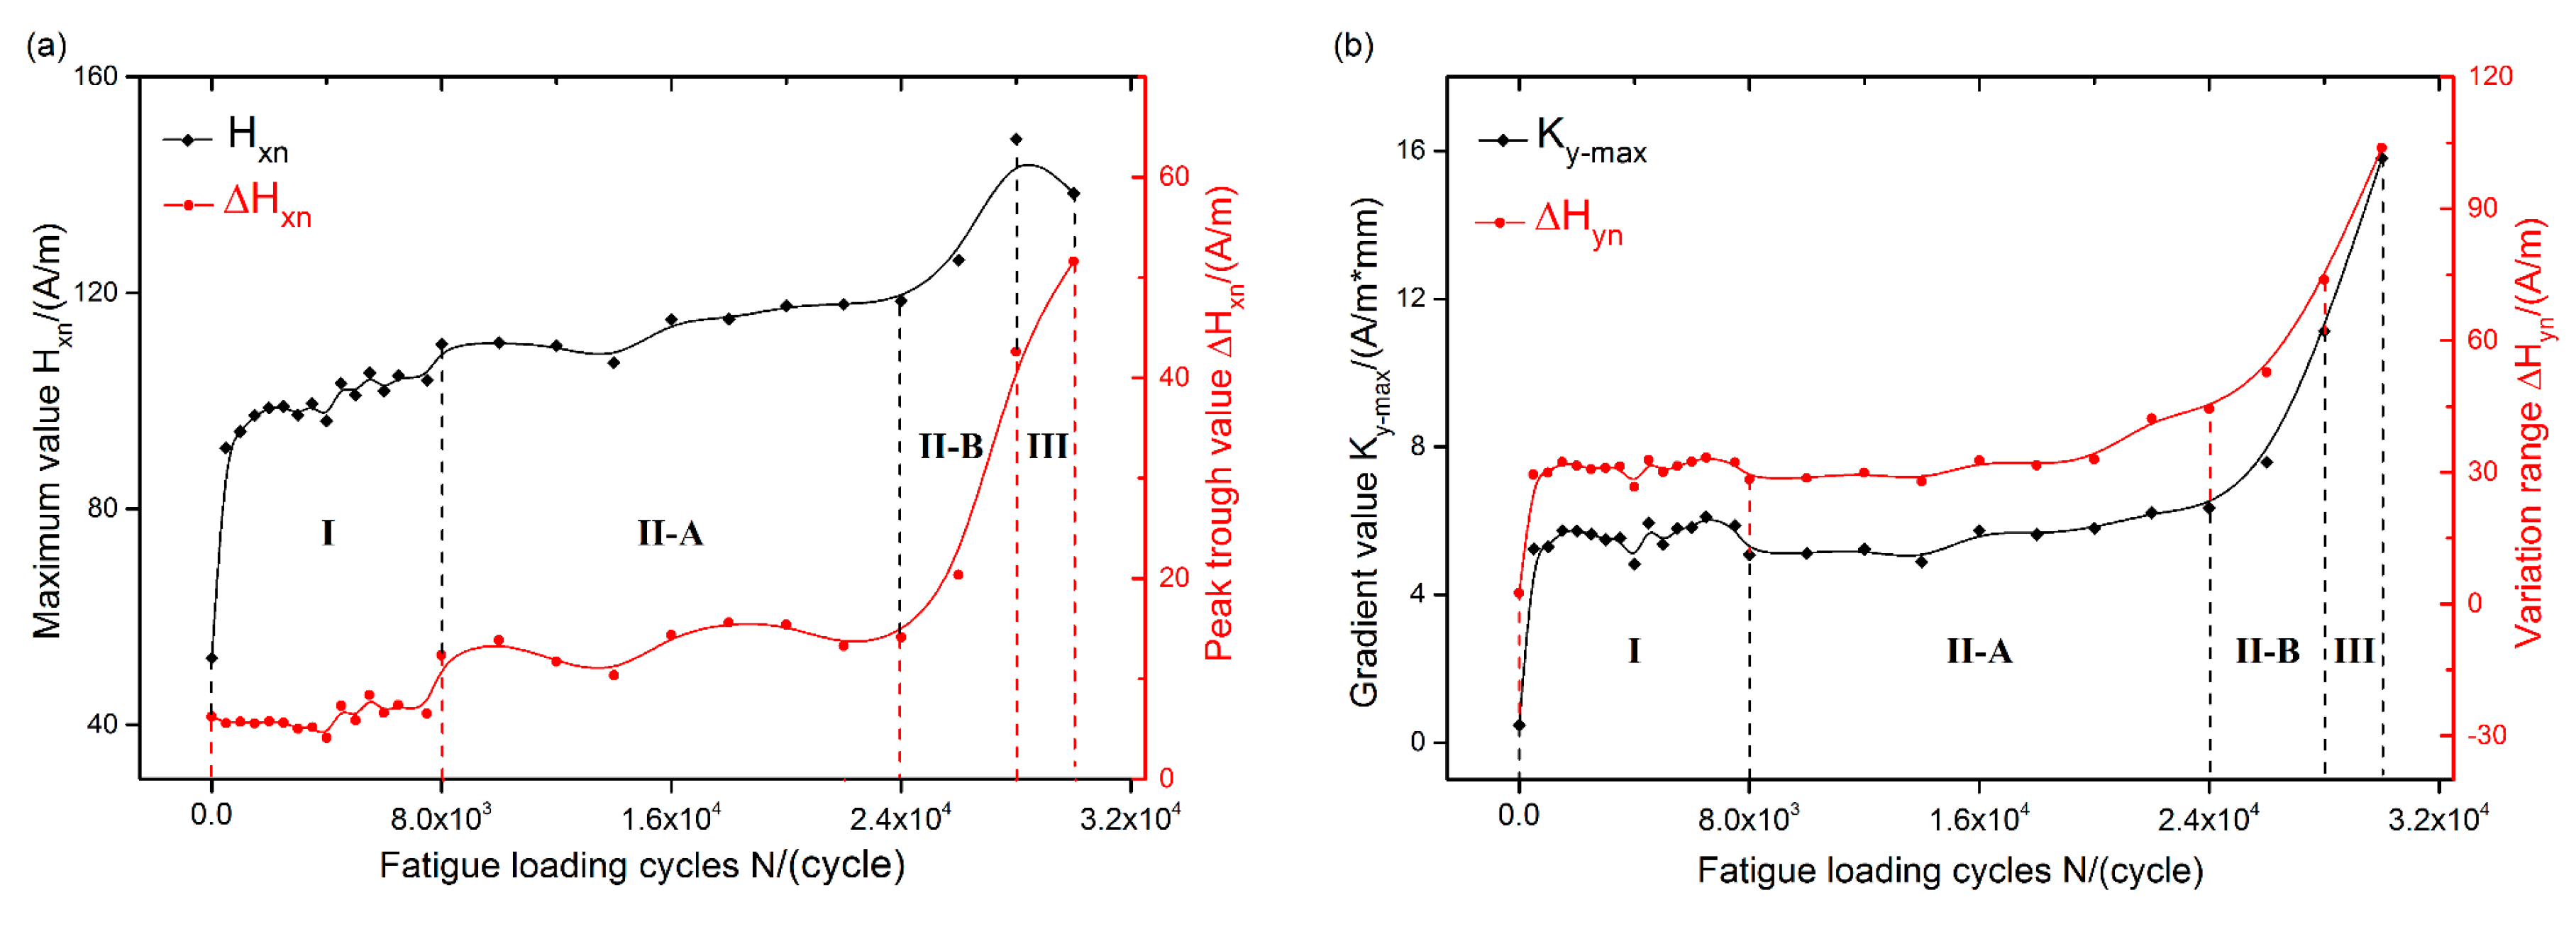
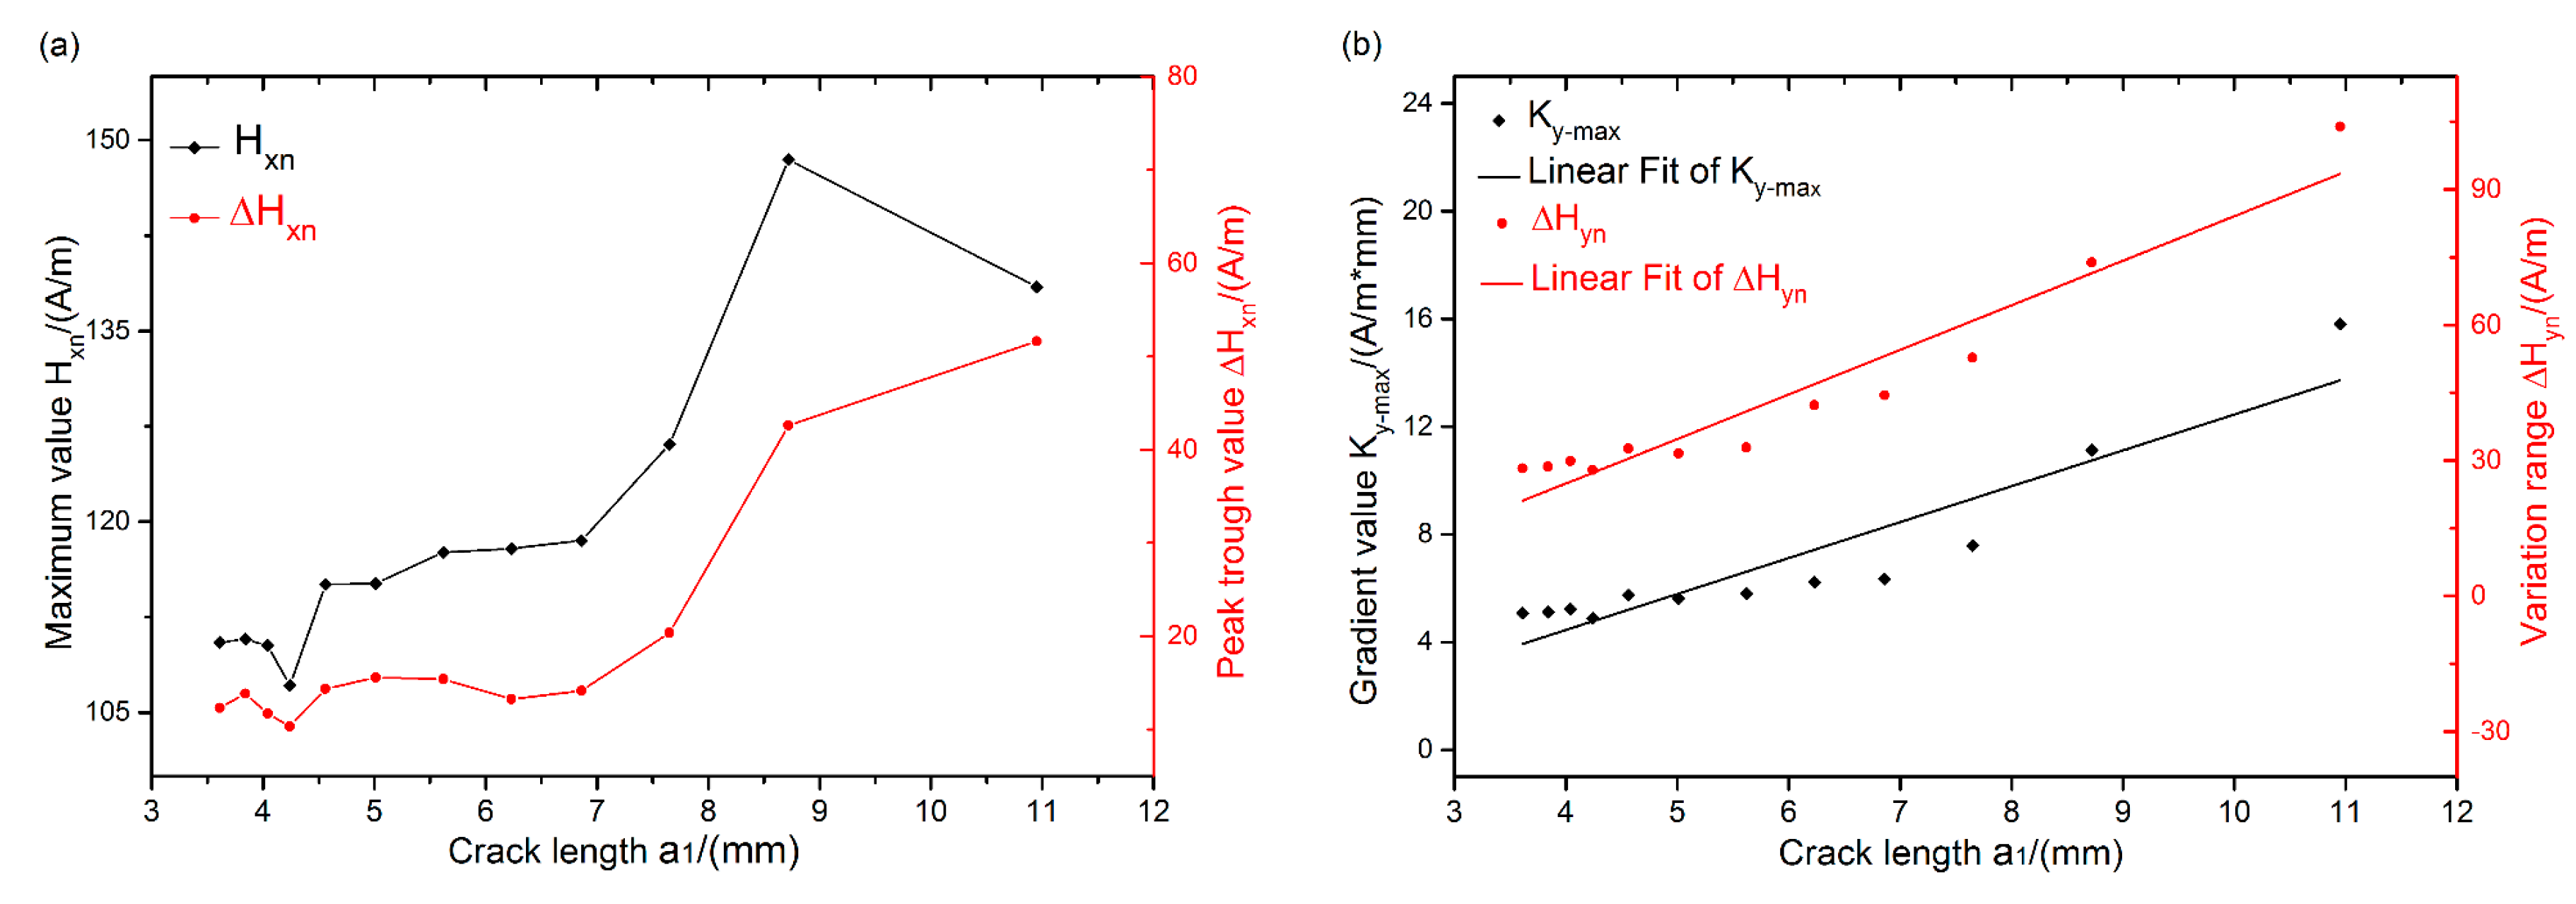
4.3. Relationship between Characteristic Parameters and Fatigue Loading Cycles, Fatigue Crack Length

The relationship between MMM signals and fatigue loading cycles N was analyzed. At the same time, the relationship between MMM signals and fatigue crack length a1 was also investigated. Tangential parameters Hxn and ∆Hxn, normal parameters Ky-max, and ∆Hyn were extracted from original signals.
Hxn was the maximum value of Hx at the notch and ∆Hxn was the peak–trough value extracted from the notch. Ky-max was the maximum gradient value of Hy and ∆Hyn was the variation range at the notch. The characteristic parameters could be defined as follows:
Hxn = max{|Hxi|}, i = 24, 25, …, 35, 36,
∆Hxn = max{|Hxi|} − min{|Hxi|}, i = 24, 25, …, 35, 36,
K y max = max { | H y ( i + 1 ) H yi Δ l | } ,   i   =   24 ,   25 ,   ,   35 ,   36 ,
∆Hyn = max{|Hyi|} − min{|Hyi|}, i = 24, 25, …, 35, 36,
where Hx is the tangential component and Hy is the normal component, i is the serial number of sampling points, Hy(i+1)–Hyi is the differential value of Hy between two adjacent points, and ∆l is the distance between the two points on the scanning line (i.e., 1 mm in this work).
Figure 8a,b shows the variations of magnetic characteristic parameters with different fatigue loading cycles. The variations of the normal characteristic parameters were almost the same. In stage I, after loading Hxn, Ky-max, ∆Hyn increased sharply and then fluctuated in a small range, while ∆Hxn remained nearly constant. In stage II-A, both tangential and normal characteristic parameters increased slowly with the increase of fatigue loading cycles. In stage II-B, the amplitudes of magnetic characteristic parameters increased quickly and reached the maximum in stage III, while Hxn decreased. Through comparing Figure 5 and Figure 8, the variation trends of normal characteristic parameters were more similar to the fatigue crack length a1 than tangential characteristic parameters with the increase of fatigue loading cycles.
Figure 9a,b shows the variations of magnetic characteristic parameters with fatigue crack length. From Figure 9a it can be seen that the variation trends of tangential characteristic parameters were complicated with fatigue crack length a1, while Ky-max and ∆Hyn increased linearly, as shown in Figure 9b. This is a very important result of this experiment. Therefore, normal characteristic parameters, namely Ky-max and ∆Hyn, could be used to characterize the fatigue crack length in comparison to tangential characteristic parameters Hxn and ∆Hxn. This means that the fatigue crack length could be determined by monitoring Ky-max and ∆Hyn, where the cracks were possible to be initiated.

4.4. Discussion

Figure 10 shows the distribution of magnetic field lines and magnetic charges on the specimen surface. Plastic deformation at the notch varied with fatigue loading cycles. Figure 10a,c shows the magnetic distribution before and after fatigue loading. It is known that the equivalent magnetic field Hσ is generated under the action of fatigue loads. The magnetic field of the specimen was superimposed by Hσ, Hg (geomagnetic field) and Hi (initial magnetic field). From Figure 1 it is known that with the increase of fatigue loading cycles, Hσ increased because of the hysteresis effect, resulting in both Hx and Hy of the specimen increasing during the whole fatigue process. There was no plastic deformation before loading, as shown in Figure 10b. When fatigue loads were applied to the specimen, stress concentration was generated at the notch and had the maximum value, and microdefects such as dislocation bundle and shear zone firstly appeared. Figure 10d shows that plastic deformation was accumulated at the root of the notch and a fatigue crack was formed at the cycles of 8.0 × 10³.
At the stage of fatigue crack propagation, as shown in Figure 10f,h, there were numerous dislocations stacking in the plastic deformation regions, which were located on both sides of the crack, so the dislocation density at the notch was larger than other regions. According to the theory of magnetic charge [22,23], magnetic domain walls are mainly fixed in dislocations and the dislocations will lead to the accumulation of magnetic charges in the plastic deformation zone, this can be seen in Figure 10e,g. With the fatigue crack propagation, more and more magnetic charges were accumulated at the root of the notch and on both sides of the fatigue crack.
Due to the discontinuity of magnetic field lines caused by V-notch and fatigue crack, the magnetic field lines were leaked to the surface of the specimen. With the increase of magnetic charges at the notch, the magnetic flux leakage became stronger and stronger, as shown in Figure 10a,c,e,g. Both Hx and Hy at the notch increased more than other regions in the fatigue crack propagation and fracture stages. According to the theory of magnetic dipole [24,25,26], the tangential component has a maximum value and the normal component changes the polarity of the field. The variation trends of the MMM signals in this paper are consistent with the theoretical analysis results of the magnetic dipole. Due to the magnetic field directions of Hσ, Hg, and Hi being the same, the normal component did not change the polarity of the field, and rotated clockwise.

5. Conclusions

MMM signals were measured during the whole fatigue process. The fatigue process was divided into four different stages by analyzing the morphology of the fracture surface. Before loading, the amplitudes of Hx and Hy approached the geomagnetic field. When fatigue loads were applied, the amplitudes increased sharply and had an obvious rotation. At the notch, Hx mutated and presented in a “trough” shape, Hy remained almost constant and rotated around the midpoint, and the slope of Hy was bigger than other regions. Four magnetic characteristic parameters were extracted from original signals. The relationship between magnetic characteristic parameters and fatigue loading cycles were similar to the variation of the fatigue crack length a1. With fatigue loading cycles, Ky-max and ∆Hyn had a better linear relationship with fatigue crack length a1. Therefore, the fatigue crack length could be determined by monitoring Ky-max and ∆Hyn, where the cracks could be initiated. MMM signals collected from the front of the notch were able to indicate the location of stress concentration and the change of fatigue damage status; this is close to practical application. In the stage of fatigue crack initiation, the increase of magnetic field was mainly related to stress magnetization. In the stage of fatigue crack propagation and fracture, the variation of the magnetic field was mainly affected by magnetic charge and magnetic flux leakage.

Author Contributions

Each of the authors contributed to performing the experiments and writing the article. W.Z. is the main author of this manuscript, and this work was conducted under the advisement of J.F. J.N. and S.L. helped to conduct the experiments. All authors revised and approved the publication.

Funding

This work was financially supported by the National Key Research and Development Program of China (Grant No. 2017YFC0804500).

Conflicts of Interest

The authors declare no conflict of interest.

References

  1. Schneider, B.; Beber, V.C. An experimental investigation of the fatigue damage behaviour of adhesively bonded joints under the combined effect of variable amplitude stress and temperature variation. Int. J. Adhes. Adhes. 2018, 83, 41–49. [Google Scholar] [CrossRef]
  2. Xu, L.Y.; Zhao, L. A novel creep-fatigue interaction damage model with the stress effect to simulate the creep-fatigue crack growth behavior. Int. J. Mech. Sci. 2017, 130, 143–153. [Google Scholar] [CrossRef]
  3. Devaney, R.J.; O’Donoghue, P.E. Experimental characterisation and computational modelling for cyclic elastic-plastic constitutive behaviour and fatigue damage of X100Q for steel catenary risers. Int. J. Fatigue 2018, 116, 366–378. [Google Scholar] [CrossRef]
  4. Holt, J.; Goddard, D.J. Methods of measurement and assessment of acoustic emission activity from the deformation of low alloy steels. Ndt E Int. 1981, 14, 49–58. [Google Scholar] [CrossRef]
  5. Wang, Y.J.; Liu, X.C. Dipole modeling of stress-dependent magnetic flux leakage. Ndt E Int. 2018, 95, 1–8. [Google Scholar] [CrossRef]
  6. Dubov, A.A. A study of metal properties using the method of magnetic memory. Metal Sci. Heat Treat. 1997, 39, 401–405. [Google Scholar] [CrossRef]
  7. Dubov, A.; Dubov, A. Application of the metal magnetic memory method for detection of defects at the initial stage of their development for prevention of failures of power engineering welded steel structures and steam turbine parts. Weld. World 2014, 58, 225–236. [Google Scholar] [CrossRef]
  8. Huang, H.H.; Jiang, S.L. Investigation of magnetic memory signals induced by dynamic bending load in fatigue crack propagation process of structural steel. J. Nondestruct. Eval. 2014, 43, 407–412. [Google Scholar] [CrossRef]
  9. Langman, R. The effect of stress on the magnetization of mild steel at moderate field strengths. IEEE Trans. Magn. 1985, 21, 1314–1320. [Google Scholar] [CrossRef]
  10. Hauser, H. Energetic model of ferromagnetic hysteresis Isotropic magnetization. J. Appl. Phys. 2004, 96, 2753–2767. [Google Scholar] [CrossRef]
  11. Misra, A.; Prasad, R.C. A theoretical model for the electromagnetic radiation emission during plastic deformation and crack propagation in metallic materials. Int. J. Fract. 2007, 145, 99–121. [Google Scholar] [CrossRef]
  12. Shi, C.L.; Dong, S.Y. Stress concentration degree affects spontaneous magnetic signals of ferromagnetic steel under dynamic tension load. Ndt E Int. 2010, 43, 8–12. [Google Scholar]
  13. Leng, J.C.; Xu, M.Q. Magnetic field variation induced by cyclic bending stress. Ndt E Int. 2009, 42, 410–414. [Google Scholar] [CrossRef]
  14. Huang, H.H.; Jiang, S.L. Characterization of spontaneous magnetic signals induced by cyclic tensile stress in crack propagation stage. J. Magn. Magn. Mater. 2014, 365, 70–75. [Google Scholar] [CrossRef]
  15. Li, C.C.; Dong, L.H. Metal magnetic memory technique used to predict the fatigue crack propagation behavior of 0.45%C steel. J. Magn. Magn. Mater. 2016, 405, 150–157. [Google Scholar]
  16. Chowdhury, P.; Sehitoglu, H. Mechanisms of fatigue crack growth—A critical digest of theoretical developments. Fatigue Fract. Eng. Mater. Struct. 2016, 39, 652–674. [Google Scholar] [CrossRef]
  17. Hu, Z.; Fan, J. Characteristics of Metal Magnetic Memory Testing of 35CrMo Steel during Fatigue Loading. Metals 2018, 8, 119. [Google Scholar] [CrossRef]
  18. Jiles, D.C. The effect of compressive plastic deformation on the magnetic properties of AISI 4130 steels with various microstructures. J. Phys. D Appl. Phys. 1988, 21, 1196–1204. [Google Scholar] [CrossRef]
  19. Jiles, D.C.; Atherton, D.L. Theory of ferromagnetic hysteresis. J. Magn. Magn. Mater. 1986, 61, 48–60. [Google Scholar] [CrossRef]
  20. Jiles, D.C. Theory of the magneto mechanical effect. J. Phys. D Appl. Phys. 1995, 28, 1537–1546. [Google Scholar] [CrossRef]
  21. Mandache, C.; Clapham, L. A model for magnetic flux leakage signal predictions. J. Phys. D Appl. Phys. 2003, 36, 2427–2431. [Google Scholar] [CrossRef]
  22. Liu, B.; Ma, Z.Y. Quantitative study on the propagation characteristics of MMM signal for stress internal detection of long distance oil and gas pipeline. Ndt E Int. 2018, 100, 40–47. [Google Scholar] [CrossRef]
  23. Le, M.; Lee, J. Hall sensor array based validation of estimation of crack size in metals using magnetic dipole models. Ndt E Int. 2013, 53, 18–25. [Google Scholar] [CrossRef]
  24. Dutta, S.M.; Ghorbel, F.H. Dipole modeling of magnetic flux leakage. IEEE Trans. Magn. 2009, 45, 1959–1965. [Google Scholar] [CrossRef]
  25. Lo, C.C.H.; Tang, F. Effects of fatigue-induced changes in microstructure and stress on domain structure and magnetic properties of Fe–C alloys. J. Appl. Phys. 2000, 87, 6520–6522. [Google Scholar] [CrossRef]
  26. Panda, A.K.; Das, S.K. Evaluation of deformation behavior of HSLA-100 steel using magnetic hysteresis techniques. IEEE Trans. Magn. 2006, 42, 3264–3266. [Google Scholar] [CrossRef]
Figure 1. Magnetic hysteresis loop caused by σ1, σ2, with the increase of fatigue loading cycles.
Metals 09 00089 g001
Figure 2. Specimen shape and scanning lines (unit: mm).
Metals 09 00089 g002
Figure 3. Schematic diagram of fatigue crack length observation and magnetic memory testing.
Metals 09 00089 g003
Figure 4. Typical SEM micrograph of the fatigue fracture surface: (a) overall morphology of the fatigue fracture surface, (b) microcracks are formed at the root of the notch, (c) fatigue striations in stage II-A, (d) secondary cracks appear in stage II-B, and (e) morphology of ductile fracture. CTOD: crack tip opening displacement.
Metals 09 00089 g004
Figure 5. Variation of fatigue crack length with fatigue loading cycles.
Metals 09 00089 g005
Figure 6. Variations of Hx with different fatigue loading cycles: (a) 0 to 3.0 × 10³, (b) 4.0 × 10³ to 8.0 × 10³, (c) 1.0 × 10⁴ to 2.0 × 10⁴, (d) 2.4 × 10⁴ to 3.0 × 10⁴.
Metals 09 00089 g006
Figure 7. Variations of Hy with different fatigue loading cycles: (a) 0 to 3.0 × 10³, (b) 4.0 × 10³ to 8.0 × 10³, (c) 1.0 × 10⁴ to 2.0 × 10⁴, (d) 2.4 × 10⁴ to 3.0 × 10⁴.
Metals 09 00089 g007
Figure 8. Variations with fatigue loading cycles: (a) tangential, (b) normal.
Metals 09 00089 g008
Figure 9. Variations with fatigue crack length: (a) tangential, (b) normal.
Metals 09 00089 g009
Figure 10. Schematic diagram of magnetic field lines and magnetic charges distribution on the specimen surface (“+” means positive magnetic charge; “−” means negative magnetic charge), and plastic deformation at the notch with different fatigue loading cycles: (a) and (b) Original state; (c) and (d) Initial state; (e) and (f) the early crack propagation; (g) and (h) the later crack propagation.
Metals 09 00089 g010
Table 1. Chemical composition of X80 pipeline steel (wt.%).
CMnSiPSMoNiCrCuNbTiAl
0.071.390.210.0110.0020.0030.2550.2230.1290.0820.0150.035
Table 2. Mechanical properties of X80 pipeline steel in air.
Steelσ0.2 (MPa)σb (MPa)ψσ0.2b
API 5L X80650.9694.871%0.94

