Article

Effect of Temperature and Texture on Hall–Petch Strengthening by Grain and Annealing Twin Boundaries in the MnFeNi Medium-Entropy Alloy

by
Mike Schneider
*,
Felicitas Werner
,
Dennis Langenkämper
,
Christian Reinhart
and
Guillaume Laplanche
Institut für Werkstoffe, Ruhr-Universität Bochum, D-44780 Bochum, Germany
*
Author to whom correspondence should be addressed.
Metals 2019, 9(1), 84; https://doi.org/10.3390/met9010084
Submission received: 21 December 2018 / Revised: 8 January 2019 / Accepted: 11 January 2019 / Published: 15 January 2019

Abstract

:
Among equiatomic alloys of the Cr-Mn-Fe-Co-Ni system, MnFeNi was shown to exhibit a strong anti-invar behavior but little is known regarding its mechanical properties. The objective of the present study is to investigate Hall–Petch strengthening by grain and annealing twin boundaries in MnFeNi. For this purpose, seven different grain sizes between 17 and 216 µm were produced. Mean grain sizes (excluding annealing twin boundaries) and crystallite sizes (including them) were determined using the linear intercept method. Overall, 25% of the boundaries were found to be annealing twin boundaries regardless of the grain size. In some cases, two twin boundaries can be present in one grain forming an annealing twin, which thickness represents one quarter of the mean grain size. Based on a comparison of the mean twin thickness of different alloys with different stacking fault energy (SFE), we estimated an SFE of 80 ± 20 mJ/m2 for MnFeNi. Compression tests of MnFeNi with different grain sizes were performed between 77 and 873 K and revealed a parallel shift of the Hall–Petch lines with temperature. The interaction between dislocations and boundaries was investigated by scanning transmission electron microscopy (STEM) in a deformed specimen. It was found that a large number of dislocations are piling up against grain boundaries while the pile-ups at annealing twin boundaries contain much fewer dislocations. This indicates that annealing twin boundaries in this alloy are less effective obstacles to dislocation motion than grain boundaries.

Graphical Abstract

1. Introduction

Yeh et al. [1] first introduced the concept of high-entropy alloys (HEAs) which represent a new class of metallic materials composed of at least five elements in approximately equiatomic concentrations. Later on, Yeh et al. [2] further classified alloys comprising two to four elements in near equiatomic proportions as medium-entropy alloys (MEAs). Several of these alloys may form disordered solid solutions with simple crystallographic structures, e.g., face centered cubic (FCC) [3,4] and body centered cubic (BCC) [5,6,7]. Equiatomic FCC alloys from the Cr-Mn-Fe-Co-Ni system have attracted a lot of interest in the scientific community due to their very interesting mechanical properties, namely, a good combination of ductility and ultimate tensile strength [8,9], a high work-hardening rate [10,11], an impressive fracture toughness [12], and an excellent resistance to fatigue-crack growth [13]. Wu et al. [14] were the first to investigate the phase stability and mechanical properties of several equiatomic MEAs of the Cr-Mn-Fe-Co-Ni system. Most of these MEAs were found to be single phase FCC after casting and homogenization as well as after cold rolling and recrystallization [14]. Moreover, Wu et al. [14] observed that the MEAs have different densities of annealing twins in the recrystallized state with CrCoNi and CrFeCoNi showing the highest densities while MnFeNi, FeNi, and pure Ni have the lowest. The authors suggested that this trend may reflect the evolution of stacking fault energy (SFE) with composition [14], i.e., the higher the SFE the lower the annealing twin density. Later on, Laplanche et al. [15] studied the evolution of physical properties with temperature of a set of MEAs including magnetic and elastic properties as well as thermal dilatation. Interestingly they found that the MnFeNi alloy is paramagnetic above 77 K, shows the largest coefficient of thermal expansion of the investigated MEAs, and exhibits an anti-invar behavior [15], (i.e., an enhanced coefficient of thermal expansion [16,17]). This exceptional physical property makes the MnFeNi alloy very attractive for potential applications as bimetallic strips in which a high thermal dilation and high strength are required.
While the temperature dependence of the tensile properties of MnFeNi with a mean grain size of ~30 μm was already reported [9], to our knowledge an examination of the grain size dependence of the yield stress (Hall–Petch relationship) and the effect of temperature on intrinsic lattice strength for this alloy has never been reported. The only studies regarding annealing twin boundary strengthening in the Cr-Mn-Fe-Co-Ni system focused on equiatomic CrMnFeCoNi [10,18,19], CrFeCoNi [9], and CrCoNi at room temperature [20,21]. Further studies concerning strengthening due to deformation twins in CrMnFeCoNi have been reported in [11,22,23]. In the most recent study, Schneider et al. [21] suggested that the strength of annealing twin boundaries is related to the stress required to constrict Shockley partials into a perfect dislocation. Based on this suggestion, it is expected that the strength of annealing twin boundaries decreases with increasing SFE, i.e., annealing twin boundaries in MnFeNi should be weaker than in other alloys such as CrCoNi and CrMnFeCoNi.
In the present study, compression tests were carried out between 77 and 873 K on the ternary equiatomic MnFeNi alloy with seven different grain sizes ranging from 17 to 216 µm. Grain size and texture analyses were carried out using backscattered electron imaging (BSE) and electron backscatter diffraction (EBSD), respectively. The effect of temperature and texture on grain size hardening (Hall–Petch relationship) and intrinsic lattice strength are investigated.

2. Experimental Methods

A cylindrical Mn33.3Fe33.3Ni33.3 (in at.%) ingot with a weight of 2.1 kg, a diameter of 45 mm, and a height of 140 mm was produced. For this purpose, pure elements (purity >99.9 wt.%, Hauner Metallische Werkstoffe GmbH, Röttenbach, Germany) were vacuum induction melted in a high purity argon atmosphere (99.998 vol.%) in a furnace of type Leybold Heraeus IS 1/III. Prior to melting, pure Mn flakes were etched to remove their oxide layer using the following procedure: (i) 700 g of Mn were immersed in 500 mL of deionized water, (ii) a solution of nitric acid (38 vol.% in distilled water) was then added stepwise under constant manual stirring until a shiny surface was visible (overall ~100 mL were added in five steps), (iii) 500 mL of deionized water were subsequently added to dilute and neutralize the acid, and (iv) Mn was further rinsed with ethanol and dried using a hair dryer. After casting, the diameter of the cylindrical ingots was reduced from 45 to 40 mm by turning it on a lathe. The ingot was then cut perpendicular to the cylindrical axis into halves, which were sealed independently in evacuated quartz tubes, homogenized at 1373 K for 48 h, air-cooled to room temperature (RT), and removed from the quartz tubes. The diameter of the two cylinders was reduced from 40 to 8.1 mm in 11 steps (true strain ~3.2) using a rotary swaging machine of type HMP R6-4-120-21S (HMP Umformtechnik GmbH, Pforzheim, Germany). In a previous study, the chemical composition of the same swaged rod was determined by X-ray fluorescence analysis and found to be Mn33.1Fe34.3Ni32.6, which is very close to the nominal composition [15]. Besides, since the concentration of impurities such as C (0.024 at.%), O (0.033 at.%), and S (0.016 at.%) are relatively low, it is therefore reasonable to neglect the effect of these interstitials on mechanical properties.
From the swaged rods (diameter: 8.1 mm), 45 compression specimens with dimensions: 4 mm diameter and 8 mm height were machined on a lathe. Afterwards, the faces of the compression specimen were ground using a corundum grinding stone (particle size ~250 µm) to achieve a parallelism better than 1°. As MEAs and HEAs among the Cr-Mn-Fe-Co-Ni system which contain Mn were reported in the literature to easily oxidize in air above 600 °C [24,25,26], all recrystallization heat treatments performed in the present study were carried out in evacuated quartz tubes. Even though Mn has a low vapor pressure, energy-dispersive X-ray spectroscopy (EDX) analyses (not shown here) did not reveal any significant Mn losses after annealing at 1473 K for 1 h. To minimize the potential for scatter, five compression samples and a metallographic specimen were annealed at the same time, see Figure 1, at temperatures between 1073 and 1473 K for times ranging from 45 min to 2 h to establish seven different grain sizes. After the heat treatments, the samples were air-cooled and removed from the quartz tubes. All metallographic samples were embedded in epoxy, ground with SiC abrasive paper down to a grain size of ~7 µm, polished with diamond suspensions to 1 µm, and finally vibropolished for 48 h (Vibromet 2, Buehler, Esslingen, Germany) in colloidal silica having a particle size of 0.06 µm.
To investigate the interaction between dislocations and grain and annealing twin boundaries, slices for scanning transmission electron microscopy (STEM) analyses were cut from compression specimens deformed to 1.5% plastic strain using a low-speed cutting machine (IsoMet, Buehler, Esslingen, Germany). These slices were cut at 45° from the compression axis, ground to a thickness of 100 µm using 1000-grit SiC paper, and TEM foils were then prepared at 253 K by double-jet electrochemical thinning in a TenuPol-5 (Struers, Willich, Germany) operating at 18 V. The electrolyte consisted of 70 vol.% methanol, 20 vol.% glycerine, and 10 vol.% perchloric acid. STEM analyses were conducted in a Tecnai F20 Super-Twin (FEI, Hillsbro, OR, USA) operating at 200 kV, equipped with a scanning unit.
Before we show the methods used to characterize the microstructure of the recrystallized specimens, we review three key issues in scientific reports which make an accurate comparison of grain size data reported in literature difficult: (1) There are two definitions of the grain size which are commonly used in the scientific community. The mean grain size is often defined as the mean intercept distance ¯ or as the volumetric grain size D ¯ = 1.571   ¯ [27,28]. However, researchers rarely clearly state the definition they used which brings confusion when comparing grain sizes obtained by different groups. (2) Even if it is often claimed that the ASTM E-112 standard method was followed, the “experimental methods” section rarely reports mandatory information such as the number of fields measured, the magnification of these, and the number of intersections counted (see Section 18 in Ref. [28]). More importantly the confidence interval of the mean grain size is rarely reported. Therefore, it is often unclear whether the reported grain sizes were obtained from a statistically significant number of measurements. (3) There is currently no consensus in the scientific community on whether annealing twin boundaries (Σ3) in FCC materials should be counted as barriers to dislocation motion or not. In the literature, the assessment of grain size strengthening in FCC alloys (Hall–Petch parameters) can be divided into two groups: First, those (including the ASTM E-112) which assume that annealing twin boundaries are weak barriers to dislocation motion and should be excluded from the grain size analysis, e.g., [10,29,30,31]. Second, a group for which the annealing twin boundaries are as strong as or even stronger than high angle grain boundaries, e.g., [19,32,33,34,35,36,37]. Since grain sizes are not systematically assessed in the same way, i.e., annealing twin boundaries are either counted or excluded from the grain size analysis, this makes a comparison of grain sizes and Hall–Petch parameters reported by different groups difficult.
In the present paper, we are interested in boundary strengthening and we think that the mean intercept distance ¯ provides a better representation of the mean free path of dislocations, since dislocation sources are randomly distributed within grains. Therefore, in the present paper we use the mean intercept distance and for the sake of simplicity we refer to it as the mean grain size in the remainder of the paper. To not lose any information regarding the microstructures of the polycrystalline MnFeNi alloys, an effort was made to assess the mean grain size (d) excluding annealing twin boundaries, the mean crystallite size (c) accounting for both grain and twin boundaries, the average thickness of annealing twins (t) and the average number of twin boundaries per grain (n) defined as n = (−1 + d/c). For grain size analysis, four backscatter electron (BSE) micrographs with a resolution of 4096 × 3775 pixels were taken at locations spaced 1 mm apart between the center and the outer surface of the recrystallized metallographic specimens. For this purpose, a scanning electron microscope (SEM) of type Quanta 650 ESEM (FEI, Hillsbro, OR, USA) was used. Depending on the mean grain size, accelerating voltages ranging from 10 (small grain size) to 20 kV (large grain size) were applied at a working distance of 10 mm to optimize the BSE contrast. Mean grain sizes were determined using the Heyn Lineal Intercept procedure highlighted in Section 13 of the standard test method ASTM E-112 [28]. Four horizontal equidistant and parallel lines of identical length as well as four vertical lines resulting in 300 to 500 intercepts per micrograph were used, see Figure 2. In the present paper, the mean grain size is calculated as the average of four independent measurements and a relative accuracy of 6% was obtained with ~1600 intercepts per sample. Thus, the mean grain sizes and corresponding standard deviations given in Table 1 are statistically representative of the recrystallized microstructures.
The texture of the recrystallized samples was determined by EBSD using an acceleration voltage of 30 kV, a working distance between 12 and 17 mm and step sizes between 0.3 and 3 μm. All measurements were conducted using the above-mentioned SEM equipped with a Hikari XP camera (EDAX Inc., Mahwah, NJ, USA). Indexing of the Kikuchi patterns was performed using the software TSL OIM Analysis (version 6.2.0, EDAX Inc., Mahwah, NJ, USA).
All compression tests were performed using a XForce Z100 machine (Zwick Roell GmbH & Co KG, Ulm, Germany) at temperatures ranging from 77 to 873 K and at a nominal strain-rate of 10−3 s−1. Tests performed in the temperature range (173–873 K) were performed in a temperature-controlled chamber in air. The temperature was held for 45 min before testing to ensure thermal equilibrium. Tests performed at 77 K were conducted in liquid nitrogen. The samples and compression plates were completely covered with liquid nitrogen for 15 min prior to and during testing.

3. Results

3.1. Grain and Crystallite Sizes

Seven different grain sizes (d), given in Table 1, were established using the heat treatments presented in Section 2. Additionally, Table 1 lists the corresponding annealing temperatures (T) and times, the mean crystallite size (c), the number of annealing twin boundaries per grain (n), the average twin thickness (t), and the magnification of the BSE micrographs used to determine grain sizes.
Figure 3 shows microstructural features associated with annealing twin boundaries. The number of annealing twin boundaries per grain (n) and the average thickness of annealing twins (t) are plotted as a function of the mean grain size (d) in Figure 3a,b, respectively. Despite some scatter, n is roughly constant and equal to 0.35 ± 0.1 for all grain sizes (Figure 3a) while t increases linearly with d with a slope of 0.25 ± 0.2. In other words, there are two twin boundaries in one out of six grains and the annealing twin thickness is roughly one quarter of the mean grain size.

3.2. Texture

Texture analyses of recrystallized MnFeNi for (a) the smallest, (b) a medium, and (c) the largest crystallite size are presented in Figure 4. The first column shows BSE images with the same magnification, the second orientation maps where crystallites are colored according to their crystallographic orientation relative to the longitudinal axis of the swaged rods (indicated by a white arrow in the lower right of the BSE image in Figure 4a), and the third inverse pole figures (IPFs) for which the scale in multiple times random is given in the upper right corner of Figure 4. It can be seen from the crystallite orientation maps and IPFs that no strong texture is present. For the largest crystallite size, three scans taken at locations spaced 2 mm apart were recorded to average the texture over a greater number of grains than only those shown in the crystallite orientation map in Figure 4c. As these three scans yielded similar results, the IPF for the largest crystallite size is therefore representative of the microstructure (see Figure 4c). Using EBSD, Taylor factors (M) were calculated for all crystallite sizes, which were found to be very close to 3.06 (maximum deviation: 3%), regardless of the mean grain size. This M-value is representative of an isotropic polycrystal (without texture). Therefore, we conclude that texture does not affect the mechanical properties reported in the present study.

3.3. Effects of Grain Size and Temperature on Yield Stress

Four representative compression true stress–true plastic strain curves at RT for crystallite sizes between 13 and 120 µm are shown in Figure 5a. The yield stress as well as the flow stress at a given plastic strain are increasing with decreasing crystallite size. The effect of temperature on stress–strain behavior for a grain size of d = 33 µm (c = 25 µm) is shown in Figure 5b. The yield stresses are found to strongly decrease with increasing temperature between 77 and 673 K. However, yield and flow stresses are similar at 673 and 873 K, indicating the beginning of an athermal plateau (see also later Figure 6). Interestingly, while stress–strain curves are smooth at low temperatures, serrations are observed for T > 673 K regardless of the mean grain size. At 673 K the serrations appear right after yielding and disappear after 0.4% strain. In contrast, while the beginning of the stress–strain curve is smooth at 873 K serrations are first observed at 0.4% and are visible until the end of the compression test. The unstable plastic flow observed at high temperatures (T ≥ 673 K) may be attributed to the segregation of substitutional elements at stacking faults bounded by Shockley partials (Suzuki effect [38]) and/or the formation of Cottrell atmospheres [39]. Further work is still needed to clarify the nature of serrated flow occurring above 673 K.
The effect of grain size on yield stress σy can be described by the Hall–Petch relationship [40,41]:
σ y = σ 0 + k y   d 1 / 2 .
In Equation (1), two components contribute to the yield stress. The first component is the intrinsic lattice strength (σ0), which is representative of a polycrystalline material with an infinite crystallite size. The second term is the grain-size-dependent Hall–Petch contribution. From the mechanical tests performed in the present study, Hall–Petch parameters (σ0 and ky) were determined by plotting the yield stress versus reciprocal square root of grain size d or crystallite size c. A straight line with slope ky and y-intercept σ0 was then adjusted to the data using a weighted least squares method. For a more detailed description of curve fitting as well as the assessment of uncertainties on fitted values (ky and σ0), see [21].
The yield strength at 0.2% plastic strain is plotted as a function of d−1/2 in Figure 6a and c−1/2 in Figure 6b for temperatures ranging from 77 to 873 K. At all investigated temperatures, the yield strength increases linearly with either d−1/2 or c−1/2 in good agreement with the Hall–Petch relationship (Equation (1)). The Hall–Petch parameters determined by fitting Equation (1) to the experimental data are given in Table 2. Figure 6a,b shows that the Hall–Petch lines are nearly parallel and that the intrinsic lattice strength σ0 (y-intercept) is nearly constant between 673 and 873 K and strongly increases with decreasing temperature for T < 673 K. A comparison of the Hall–Petch slopes in Table 2 reveals that those which account for both grain and twin boundaries (Figure 6b) are between 0.85 and 0.9 of those in Figure 6a. This result can be attributed to the fact that, for all grain sizes investigated in the present study, there is about one annealing twin boundary in one out of three grains (Figure 3a), i.e., d ≈ 1.33 c. As a result, the slope is expected to decrease by a factor 1.33−1/2 = 0.87 (see Equation (1)) in perfect agreement with the results shown in Figure 6.

3.4. Temperature Dependence of the Yield Stress

Figure 7 shows the temperature dependence of the 0.2% yield stress for the biggest crystallite size (c = 120 µm). Please note that four additional compression experiments were performed at 173, 223, 373, and 473 K. Two experiments were conducted at each temperature to provide the error bars. The yield stress for d = 216 µm (c = 120 µm), is found to strongly decrease with increasing temperature in the range 77–473 K while it remains nearly constant at higher temperatures suggesting that this corresponds to the athermal regime. In the former temperature region, the yield stress decreases by ~65% while the shear modulus (G) softens by ~15% between 77 and 473 K [15]. Therefore, the large decrease of yield stress with temperature cannot be attributed only to a softening of the shear modulus, rather it suggests that plastic deformation is thermally activated in MnFeNi.

3.5. STEM Analyses of Grain and Annealing Twin Boundaries

To shed light on the interactions between dislocations and annealing twin and grain boundaries, STEM investigations were performed on a specimen which was strained to 1.5% plastic strain at 293 K. In Figure 8a, three grain boundaries can be seen, meeting at a triple point. In the right grain, pile-ups containing large numbers of dislocations are observed, indicating that grain boundaries are effective obstacles to dislocation motion. Figure 8b highlights similar features at a higher magnification where several pile-ups forming against grain boundaries are highlighted with red arrows. Figure 8c shows almost a complete grain in which one annealing twin boundary is present. In contrast, Figure 8d from another grain shows two annealing twin boundaries at a higher magnification. In both cases (Figure 8c,d), dislocations are also found to pile-up against annealing twin boundaries. However, a comparison of Figure 8b,d reveals that there are more dislocations in the pile-up at grain boundaries (see red arrows in Figure 8b) than at annealing twin boundaries (see white arrows in Figure 8d). This may indicate that annealing twin boundaries in MnFeNi are weaker obstacles to dislocation glide than grain boundaries.

4. Discussion

The objective of the present study was to investigate the effect of temperature and texture on grain size hardening (Hall–Petch relationship) in an equiatomic MnFeNi alloy. For this purpose, seven different grain sizes were produced by thermo-mechanical treatments, the corresponding textures were analyzed, and compression tests were performed between 77 and 873 K. It was found that nearly no texture develops in the investigated grain size range 17–216 µm and that the annealing twin density in this alloy is relatively low. Furthermore, it was shown, that the grain size dependence of the yield stress follows the well-known Hall–Petch relationship [40,41], i.e., the yield stress decreases with increasing grain size. Finally, TEM observations revealed the presence of dislocation pile-ups against both grain and annealing twin boundaries. We now compare our data to those reported in the literature and discuss them with a focus on microstructural and mechanical aspects as well as their relationship.
In Figure 9, the average thickness of annealing twins (t) determined using the line intercept method is plotted as a function of the mean grain size (d) for the MnFeNi alloy investigated in the present study (black data points). In addition, the data reported in the literature for CrCoNi [21] (red data points) and pure Ni [42] (blue data points) are shown for comparison in Figure 9. In all cases, the average thickness of the twins is found to increase linearly with increasing grain size in excellent agreement with the model developed by Dash and Brown [43] to describe the growth of annealing twins driven by the net reduction in grain boundary energy associated with twinning. More importantly, the slopes of the lines in Figure 9 should be proportional to the stacking fault energy according to the Dash and Brown model [43]. Therefore, based on the slopes shown in Figure 9 we expect the stacking fault energies of the metals to increase in the order:
CrCoNi (slope: 0.13 ± 0.01) < MnFeNi (slope: 0.25 ± 0.02) < Ni (slope: 0.32 ± 0.10).
This trend is consistent with the SFEs of CrCoNi and pure Ni, which were reported to be 22 ± 4 mJ/m2 [44] and 125 ± 4 mJ/m2 [45], respectively. To our knowledge the SFE of MnFeNi has not been reported in the literature so far but it can be reasonably stated, based on the results shown in Figure 9, that its SFE should be closer to that of Ni than that of CrCoNi. If we assume that the Dash and Brown model applies and that the driving force for the formation of annealing twins is similar in all three alloys, then a linear interpolation of the SFE of MnFeNi yields an SFE-value of 80 ± 20 mJ/m2. However, further work is still required to confirm or disprove this value.
The effect of temperature on Hall–Petch slope (ky, obtained from Figure 6) is shown in Figure 10a. As already mentioned in Section 3.3, the magnitude of ky, which reflects the strength of the boundaries, is larger when twin boundaries were excluded from the analysis (black data points, all boundary strengthening is attributed to grain boundaries) while it is slightly lower (~10% to 15%) when twin boundaries were accounted for (white data points, twin and grain boundaries are assumed to have the same strength in this case). Despite some scatter, a clear decrease of ky (~15%) with increasing temperature is observed for both grain size (red line) and crystallite size data (blue line).
Microstructural observations by TEM of a compression sample pre-strained at 293 K revealed the presence of dislocation pile-ups against both grain and annealing twin boundaries suggesting that the dislocation pile-up model developed by Eshelby, Frank and Nabarro [46] is a reasonable rational for the Hall–Petch behavior. According to this model, the Hall–Petch slope (ky) is related to the boundary strength (τc, grain and/or twin boundary) which is required to continue slip past the boundary. In the case of a double ended pile-up of dislocations, these parameters are given by [27]:
  k y = M ( τ c   4 G b β π ) 1 2 ,
and
τ c = k y 2   β π 4 M 2 G b ,
where β is a factor taking into account the type of dislocation which is β = 1 for screw and β = 1 − ν for edge dislocations, M = 3.06 is the Taylor factor of an isotropic polycrystal, b = 0.256 nm is the Burgers vector of a perfect dislocation, G is the shear modulus [15]. Here the Poisson’s ratio at RT is ν = 0.15 and its temperature dependence was reported in [15]. Figure 10b shows τc as a function of temperature for a pile-up of screw dislocations (β = 1). In spite of some scatter, the boundary strength is found to be nearly independent of temperature (see Figure 10b) for the grain size data (red line) as well as the crystallite size data (blue line).
In the present work, two outer bounds were used to assess boundary strengths. In the first case, it was assumed that annealing twins are very weak barriers to dislocation motion and can therefore be excluded. In this scenario, only grain boundaries act as barriers and their strength was determined using Equation (3) and the ky values shown Figure 10a. Assuming a pile-up of screw dislocations (β = 1) it is found that the grain boundary strength is 1750 MPa when twin boundaries are excluded. In the second case, grain and twin boundaries are assumed to have the same strength resulting in a boundary strength of 1430 MPa. The latter value (1430 MPa) is ~20% lower than that considering only grain boundaries. This value is consistent with the fact that 25% of the boundaries are twin boundaries (fraction of twin boundaries = (1/n + 1)−1). For comparison the boundary strength values for pile-ups of edge dislocations (β = 1 − ν) are found to be 1430 MPa for the former and 1180 MPa for the latter case, respectively, which are ~20% lower than in the case of pile-ups of screw dislocations (β = 1).
We now compare in Figure 11a our data (green points) to those (red points) reported by Wu et al. [9] for MnFeNi with a mean grain size of ~30 µm. A comparison of the red and green data points reveals an excellent agreement at 77 and 293 K but the two sets of data deviates from each other’s at higher temperatures. The data obtained by Wu et al. [9] also show an athermal plateau, similar to our data, but it lies ~50 MPa above our data. As already mentioned in Section 3.3, the strength of the MnFeNi medium-entropy alloy investigated in the present study consists of two contributions, namely, boundary strengthening and intrinsic lattice strength. To reveal the latter, boundary strengthening was removed by extrapolating the Hall–Petch lines in Figure 6 to an infinite grain size (low d−1/2). Using the temperature dependence of the yield stress obtained for the biggest crystallite size and assuming a constant boundary strength, the intrinsic lattice strength was calculated for 173, 223, 373, and 473 K using Equations (1) and (2). The temperature dependence of σ0 is shown in Figure 11b based on either the analysis excluding twin boundaries (black symbols) or accounting for twin boundaries (empty symbols). The intrinsic lattice strength strongly decreases with increasing temperature between 77 and 473 K, while it remains nearly constant between 473 and 873 K suggesting that this corresponds to the athermal regime. Recently, Varvenne et al. [47] have introduced a parameter-free theory for the temperature, composition, and strain-rate-dependence of the yield strength in FCC HEAs and MEAs. In this theory, each element is considered as a solute embedded in an effective matrix. Solid solution strengthening results from elastic interactions between dislocations and the random local concentration fluctuations around the mean composition. The inputs of this theory are the shear modulus, the Poisson ratio of the alloy, the dislocation Burgers vector (b), the dislocation line tension, the individual atomic volumes, and atomic fractions of each element in the FCC alloy. The theory allows to calculate the temperature dependence of the yield stress (for examples see [21,47,48,49]) of the MnFeNi which is represented by a black line in Figure 11b. The theory underpredicts the yield stress at 77 K and is not accounting for the athermal plateau starting at 473 K but otherwise it is in generally good agreement with our experimental results for temperatures between 173 and 473 K. Possible reasons for the differences observed at 77 K have been discussed by Varvenne et al. [47]. For example, the predictions are particularly sensitive to the line tension parameter. Moreover, short range ordering which was neglected in their model may be a reason for the discrepancy.
To illustrate the degree of solid solution strengthening of the MnFeNi alloy, the temperature dependence of its intrinsic lattice strength (black points) is compared with that of pure Ni (blue points) [50] and CrCoNi (red points) [21] in Figure 12. It can be clearly seen, that both MEAs alloys display a strong decrease of intrinsic lattice strength with increasing temperature. This is in contrast with pure Ni (blue points) which exhibits a very weak decrease with increasing temperature from 20 MPa at 77 K to 15 MPa at 623 K. This may be attributed to the fact that solid solution strengthening does not contribute to its intrinsic lattice strength, which only consists of the Peierls–Nabarro stress. At a temperature of 77 K, the strength of the CrCoNi alloy is much higher than that of the MnFeNi alloy (~40%) but this difference gradually decreases with increasing temperature until both curves merge at the athermal plateau in excellent agreement with results obtained by Wu et al. [9]. At T > 673 K, both alloys exhibit roughly the same intrinsic lattice strength (~50 MPa). From Figure 12 it can be seen that CrCoNi exhibits a higher yield strength in the range 77–673 K than MnFeNi, suggesting that different combinations of elements results in different magnitudes of solid solution strengthening, i.e., a combination of Cr and Co has a stronger effect on solid solution strengthening of Ni than a combination of Mn and Fe.

5. Conclusions

In the present work the equiatomic MnFeNi medium-entropy alloy was investigated. Seven different grain sizes between 17 and 216 µm were produced and the effects of texture and temperature in the range between 77 and 873 K on the mechanical properties were documented. From the results of this work the following conclusions can be drawn:
  • For all investigated grain/crystallite sizes, it has been found that the average number of annealing twin boundaries per grain in MnFeNi is approximately 0.35 ± 0.1. This value is relatively low compared to other high- and medium-entropy alloys from the Cr-Mn-Fe-Co-Ni system.
  • When two twin boundaries forming an annealing twin are present in one grain, its average thickness is found to increase linearly with increasing grain size with a slope of 0.25 ± 0.2. Based on the model developed by Dash and Brown [43], we estimated a stacking fault energy of 80 ± 20 mJ/m2 for MnFeNi.
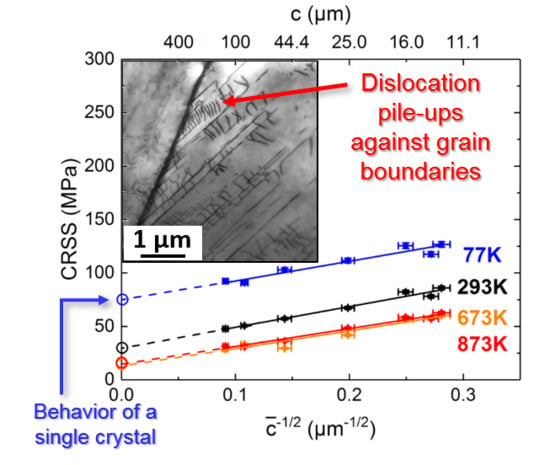
  • The strength of the MnFeNi alloy follows the well-known Hall–Petch relationship for both grain and crystallite sizes, i.e., it increases with decreasing grain/crystallite sizes. Regarding the effect of temperature on the slope of the Hall–Petch lines, it was found that it slightly decreases (~15%) with increasing temperature in the range between 77 and 873 K.
  • The yield strength of a polycrystal with an infinite grain size (~ single crystal behavior) strongly decreases with increasing temperature. This temperature dependence can be rationalized in the frame of a solid solution strengthening model reported in the literature [47] for 173 K < T < 473 K. Above 473 K, an athermal plateau is reached.
  • STEM analyses reveal that pile-ups form at both grain and annealing twin boundaries. However, pile-ups against annealing twins seems to be shorter than against grain boundaries which may indicate that annealing twins are less resistant than grain boundaries against dislocation motion.

Author Contributions

M.S. and G.L. conceived and designed the experiments; C.R. prepared the alloy and performed the preliminary heat treatments. F.W. and M.S. performed the microstructural and mechanical investigations and analyzed the data; D.L. prepared the TEM specimens and performed the corresponding experiments; F.W., M.S., D.L. and G.L. wrote the paper together. G.L. supervised the research activity planning and execution. All authors contributed substantially to the work reported.

Funding

M.S., C.R., and G.L. acknowledge funding from the German Research Foundation (Deutsche Forschungsgemeinschaft DFG) through project LA 3607/1-1 and projects B5 and B7 of the SFB/TR 103. The center for interface-dominated high performance materials (Zentrum für Grenzflächendominierte Höchstleistungswerkstoffe, ZGH) is acknowledged.

Acknowledgments

The authors would like to thank Gernot Hausch and Easo P. George for fruitful discussions.

Conflicts of Interest

The authors declare no conflict of interest. The funders had no role in the design of the study; in the collection, analyses, or interpretation of data; in the writing of the manuscript, or in the decision to publish the results.

References

  1. Yeh, J.-W.; Chen, S.-K.; Lin, S.-J.; Gan, J.-Y.; Chin, T.-S.; Shun, T.-T.; Tsau, C.-H.; Chang, S.-Y. Nanostructured high-entropy alloys with multiple principal elements: Novel alloy design concepts and outcomes. Adv. Eng. Mater. 2004, 6, 299–303. [Google Scholar] [CrossRef]
  2. Yeh, J.-W.; Chen, Y.-L.; Lin, S.-J.; Chen, S.-K. High-entropy Alloys—A New Era of Exploitation. Mater. Sci. Forum 2007, 560, 1–9. [Google Scholar] [CrossRef]
  3. Cantor, B.; Chang, I.T.H.; Knight, P.; Vincent, A.J.B. Microstructural development in equiatomic multicomponent alloys. Mater. Sci. Eng. A 2004, 375–377, 213–218. [Google Scholar] [CrossRef]
  4. Laurent-Brocq, M.; Akhatova, A.; Perrière, L.; Chebini, S.; Sauvage, X.; Leroy, E.; Champion, Y. Insights into the phase diagram of the CrMnFeCoNi high entropy alloy. Acta Mater. 2015, 88, 355–365. [Google Scholar] [CrossRef]
  5. Senkov, O.N.; Wilks, G.B.; Scott, J.M.; Miracle, D.B. Mechanical properties of Nb25Mo25Ta25W25 and V20Nb20Mo20Ta20W20 refractory high entropy alloys. Intermetallics 2011, 19, 698–706. [Google Scholar] [CrossRef]
  6. Couzinié, J.P.; Dirras, G.; Perrière, L.; Chauveau, T.; Leroy, E.; Champion, Y.; Guillot, I. Microstructure of a near-equimolar refractory high-entropy alloy. Mater. Lett. 2014, 126, 285–287. [Google Scholar] [CrossRef]
  7. Dobbelstein, H.; Gurevich, E.L.; George, E.P.; Ostendorf, A.; Laplanche, G. Laser metal deposition of a refractory TiZrNbHfTa high-entropy alloy. Addit. Manuf. 2018, 24, 386–390. [Google Scholar] [CrossRef]
  8. Gali, A.; George, E.P. Tensile properties of high- and medium-entropy alloys. Intermetallics 2013, 39, 74–78. [Google Scholar] [CrossRef] [Green Version]
  9. Wu, Z.; Bei, H.; Pharr, G.M.; George, E.P. Temperature dependence of the mechanical properties of equiatomic solid solution alloys with face-centered cubic crystal structures. Acta Mater. 2014, 81, 428–441. [Google Scholar] [CrossRef]
  10. Otto, F.; Dlouhý, A.; Somsen, C.; Bei, H.; Eggeler, G.; George, E.P. The influences of temperature and microstructure on the tensile properties of a CoCrFeMnNi high-entropy alloy. Acta Mater. 2013, 61, 5743–5755. [Google Scholar] [CrossRef] [Green Version]
  11. Laplanche, G.; Kostka, A.; Horst, O.M.; Eggeler, G.; George, E.P. Microstructure evolution and critical stress for twinning in the CrMnFeCoNi high-entropy alloy. Acta Mater. 2016, 118, 152–163. [Google Scholar] [CrossRef] [Green Version]
  12. Gludovatz, B.; Hohenwarter, A.; Catoor, D.; Chang, E.H.; George, E.P.; Ritchie, R.O. A fracture-resistant high-entropy alloy for cryogenic applications. Science 2014, 345, 1153–1158. [Google Scholar] [CrossRef] [PubMed] [Green Version]
  13. Thurston, K.V.S.; Gludovatz, B.; Hohenwarter, A.; Laplanche, G.; George, E.P.; Ritchie, R.O. Effect of temperature on the fatigue-crack growth behavior of the high-entropy alloy CrMnFeCoNi. Intermetallics 2017, 88, 65–72. [Google Scholar] [CrossRef]
  14. Wu, Z.; Bei, H.; Otto, F.; Pharr, G.M.; George, E.P. Recovery, recrystallization, grain growth and phase stability of a family of FCC-structured multi-component equiatomic solid solution alloys. Intermetallics 2014, 46, 131–140. [Google Scholar] [CrossRef]
  15. Laplanche, G.; Gadaud, P.; Bärsch, C.; Demtröder, K.; Reinhart, C.; Schreuer, J.; George, E.P. Elastic moduli and thermal expansion coefficients of medium-entropy subsystems of the CrMnFeCoNi high-entropy alloy. J. Alloys Compd. 2018, 746, 244–255. [Google Scholar] [CrossRef]
  16. Shiga, M. Invar alloys. Curr. Opin. Solid State Mater. Sci. 1996, 1, 340–348. [Google Scholar] [CrossRef]
  17. Hausch, G. Thermal expansion of anti-invar alloys up to high temperatures. J. Magn. Magn. Mater. 2007, 310, 1859–1860. [Google Scholar] [CrossRef]
  18. Liu, W.H.; Wu, Y.; He, J.Y.; Nieh, T.G.; Lu, Z.P. Grain growth and the Hall-Petch relationship in a high-entropy FeCrNiCoMn alloy. Scr. Mater. 2013, 68, 526–529. [Google Scholar] [CrossRef]
  19. Sun, S.J.; Tian, Y.Z.; Lin, H.R.; Dong, X.G.; Wang, Y.H.; Zhang, Z.J.; Zhang, Z.F. Enhanced strength and ductility of bulk CoCrFeMnNi high entropy alloy having fully recrystallized ultrafine-grained structure. Mater. Des. 2017, 133, 122–127. [Google Scholar] [CrossRef]
  20. Yoshida, S.; Bhattacharjee, T.; Bai, Y.; Tsuji, N. Friction stress and Hall-Petch relationship in CoCrNi equiatomic medium entropy alloy processed by severe plastic deformation and subsequent annealing. Scr. Mater. 2017, 134, 33–36. [Google Scholar] [CrossRef]
  21. Schneider, M.; George, E.P.; Manescau, T.J.; Záležák, T.; Hunfeld, J.; Dlouhý, A.; Eggeler, G.; Laplanche, G. Hall-Petch strengthening of the CrCoNi medium-entropy alloy by grain boundaries and annealing twin boundaries. manuscript in preparation.
  22. Klimova, M.; Stepanov, N.; Shaysultanov, D.; Chernichenko, R.; Yurchenko, N.; Sanin, V.; Salishchev, G. Microstructure and Mechanical Properties Evolution of the Al, C-Containing CoCrFeNiMn-Type High-Entropy Alloy during Cold Rolling. Materials 2018, 11, 53. [Google Scholar] [CrossRef] [PubMed]
  23. Stepanov, N.; Tikhonovsky, M.; Yurchenko, N.; Zyabkin, D.; Klimova, M.; Zherebtsov, S.; Efimov, A.; Salishchev, G. Effect of cryo-deformation on structure and properties of CoCrFeNiMn high-entropy alloy. Intermetallics 2015, 59, 8–17. [Google Scholar] [CrossRef]
  24. Holcomb, G.; Tylczak, J.; Carney, C. Oxidation of CoCrFeMnNi High Entropy Alloys. JOM 2015, 67, 2326–2339. [Google Scholar] [CrossRef]
  25. Laplanche, G.; Volkert, U.F.; Eggeler, G.; George, E.P. Oxidation Behavior of the CrMnFeCoNi High-Entropy Alloy. Oxid. Met. 2016, 85, 629–645. [Google Scholar] [CrossRef]
  26. Adomako, N.K.; Kim, J.H.; Hyun, Y.T. High-temperature oxidation behaviour of low-entropy alloy to medium- and high-entropy alloys. J. Therm. Anal. Calorim. 2018, 133, 13–16. [Google Scholar] [CrossRef]
  27. Dieter, G.E.; Bacon, D.J. Strengthening Mechanisms. Mechanical Metallurgy, 3rd ed.; McGraw-Hill: London, UK, 1989; ISBN 0-07-100406-8. [Google Scholar]
  28. American Society for Testing and Materials (ASTM). ASTM E112-10: Standard Test Methods for Determining Average Grain Size; ASTM International: West Conshohocken, PA, USA, 2004. [Google Scholar]
  29. Nakanishi, K.; Suzuki, H. Analysis of the Grain Size Dependence of the Yield Stress in Copper-Aluminum and Copper-Nickel Alloys. J. Jpn. Inst. Met. 1974, 15, 435–440. [Google Scholar] [CrossRef] [Green Version]
  30. Ueji, R.; Tsuchida, N.; Fujii, H.; Kondo, D.; Kunishige, K. Effect of Grain Size on Tensile Properties of TWIP Steel. J. Jpn. Inst. Met. 2007, 71, 815–821. [Google Scholar] [CrossRef] [Green Version]
  31. Okamoto, N.L.; Fujimoto, S.; Kambra, Y.; Kawamura, M.; Chen, Z.M.T.; Matsunoshita, H.; Tanaka, K.; Inui, H.; George, E.P. Size effect, critical resolved shear, stress, stacking fault energy, and solid solution strengthening in the CrMnFeCoNi high-entropy alloy. Sci. Rep. 2016, 6, 1–10. [Google Scholar] [CrossRef]
  32. Köster, W.; Speidel, M.O. Der Einfluß der Temperatur und der Korngröße auf die ausgeprägte Streckgrenze von Kupferlegierungen. Zeitschrift für Metallkunde 1965, 56, 585–595. (In German) [Google Scholar]
  33. Tabata, T.; Takagi, K.; Fujita, H. The Effect of Grain Size and Deformation Sub-structure on Mechanical Properties of Polycrystalline Copper and Cu-Al Alloys. J. Jpn. Inst. Met. 1975, 16, 569–579. [Google Scholar] [CrossRef]
  34. Priester, L. “Dislocation-interface” interaction—Stress accommodation processes at interfaces. Mater. Sci. Eng. A 2001, 309–310, 430–439. [Google Scholar] [CrossRef]
  35. Pande, C.S.; Rath, B.B.; Imam, M.A. Effect of annealing twins on Hall-Petch relation in polycrystalline materials. Mater. Sci. Eng. A 2004, 367, 171–175. [Google Scholar] [CrossRef]
  36. De las Cuevas, F.; Reis, M.; Ferraiuolo, A.; Pratolongo, G.; Karjalainen, L.P.; Alkorta, J.; Sevillani, J.G. Hall-Petch relationship of a TWIP steel. Key Eng. Mater. 2010, 423, 147–152. [Google Scholar] [CrossRef]
  37. Kacher, J.; Eftink, B.P.; Cui, B.; Robertson, I.M. Dislocation interactions with grain boundaries. Curr. Opin. Solid State Mater. Sci. 2017, 18, 227–243. [Google Scholar] [CrossRef]
  38. Suzuki, H. Chemical Interaction of Solute Atoms with Dislocations. Sci. Rep. Res. Inst. Tohoku Univ. 1952, 4, 455–463. [Google Scholar]
  39. Cottrell, A.H.; Bilby, B.A. Dislocation theory of yielding and strain ageing of iron. Proc. Phys. Soc. Lond. Sect. A 1949, 62, 49–62. [Google Scholar] [CrossRef]
  40. Hall, E.O. The Deformation and Ageing of Mild Steel: III Discussion of Results. Proc. Phys. Soc. Sect. B 1951, 64, 747–753. [Google Scholar] [CrossRef]
  41. Petch, N.J. The cleavage strength of polycrystals. J. Iron Steel Inst. 1953, 174, 25–28. [Google Scholar]
  42. Pande, C.S.; Imam, M.A.; Rath, B.B. Study of Annealing Twins in FCC Metals and Alloys. Metall. Trans. A 1990, 21, 2891–2896. [Google Scholar] [CrossRef]
  43. Dash, S.; Brown, N. An investigation of the origin and growth of annealing twins. Acta Mater. 1963, 11, 1067–1075. [Google Scholar] [CrossRef]
  44. Laplanche, G.; Kostka, A.; Reinhart, C.; Hunfeld, J.; Eggeler, G.; George, E.P. Reasons for the superior mechanical properties of medium-entropy CrCoNi compared to high-entropy CrMnFeCoNi. Acta Mater. 2017, 128, 292–303. [Google Scholar] [CrossRef]
  45. Carter, C.B.; Holmes, S.M. The stacking-fault energy of nickel. Philos. Mag. J. Theor. Exp. Appl. Phys. 1977, 35, 1161–1172. [Google Scholar] [CrossRef]
  46. Eshelby, J.D.; Frank, F.C.; Nabarro, F.R.N. XLI. The equilibrium of linear arrays of dislocations. Lond. Edinburgh Dublin Philos. Mag. J. Sci. 1951, 42, 351–364. [Google Scholar] [CrossRef]
  47. Varvenne, C.; Luque, A.; Curtin, W.A. Theory of strengthening in fcc high entropy alloys. Acta Mater. 2016, 118, 164–176. [Google Scholar] [CrossRef] [Green Version]
  48. Laplanche, G.; Bonneville, J.; Varvenne, C.; Curtin, W.A.; George, E.P. Thermal activation parameters of plastic flow reveal deformation mechanisms in the CrMnFeCoNi high-entropy alloy. Acta Mater. 2018, 143, 257–264. [Google Scholar] [CrossRef]
  49. Varvenne, C.; Curtin, W.A. Predicting yield strengths of noble metal high entropy alloys. Scr. Mater. 2018, 142, 92–95. [Google Scholar] [CrossRef]
  50. Akhtar, A.; Teghtsoonian, E. Plastic deformation of Ni-Cr single crystals. Metall. Trans. 1971, 2, 2757–2763. [Google Scholar] [CrossRef]
Figure 1. Photograph of five compression specimens and one metallographic sample encapsulated in an evacuated quartz tube for subsequent heat treatment.
Metals 09 00084 g001
Figure 2. Representative backscatter electron (BSE) micrograph of a recrystallized microstructure (d = 19 µm, c = 16 µm) with four horizontal and four vertical lines used for grain size analysis using the Heyn lineal intercept procedure.
Metals 09 00084 g002
Figure 3. (a) Number (n) of annealing twin boundaries per grain and (b) average twin thickness (t) as a function of the average grain size (d).
Metals 09 00084 g003
Figure 4. Representative microstructures of recrystallized MnFeNi with different grain and crystallite sizes: (a) d = 17 µm, c = 13 μm, (b) d = 33 µm, c = 25 μm, (c) d = 216 µm, c = 120 μm. Figures in the first column are BSE micrographs, those in the second are color-coded crystallite orientation maps, see colored stereographic triangle in the second column of (a) for color decoding. Figures in the third column are inverse pole figures (IPFs) showing the texture along the longitudinal axis of the compression specimens.
Metals 09 00084 g004
Figure 5. Representative true stress–true plastic strain curves obtained in compression of MnFeNi at (a) room temperature with different grain and crystallite sizes and (b) for a grain and crystallite size of 33 and 14 µm, respectively at different temperatures. The inset in (b) shows a serrated flow after yielding for the curve obtained at 673 K.
Metals 09 00084 g005
Figure 6. Hall–Petch plots at different temperatures. Yield stress (σ0.2%) versus (a) reciprocal of the square root of the grain size (d) and (b) crystallite size (c).
Metals 09 00084 g006
Figure 7. Temperature dependence of the yield strength (σy) obtained for the largest grain size (d = 216 µm, c = 120 µm).
Metals 09 00084 g007
Figure 8. Scanning transmission electron microscopy (STEM) micrographs of a MnFeNi alloy (d = 17 µm) deformed to 1.5% true plastic strain at 293 K showing dislocations piling-up against (a,b) grain boundaries and (c,d) annealing twin boundaries (Σ3). Pile-ups of dislocations against grain boundaries and annealing twin boundaries are highlighted with red and white arrows, respectively.
Metals 09 00084 g008
Figure 9. Average annealing twin thickness (t) as a function of the mean grain size (d). The black data points were obtained for MnFeNi in the present study, whereas the blue points were obtained from Pande et al. [42] for pure Ni and the red ones by Schneider et al. [21] for an equiatomic CrCoNi alloy.
Metals 09 00084 g009
Figure 10. Temperature dependence of (a) Hall–Petch slope (ky) obtained from grain size data (red) and crystallite size data (blue) and (b) critical boundary strength (τc) obtained from grain sizes (filled points) and crystallite sizes (white points) assuming a pile-up of screw dislocations.
Metals 09 00084 g010
Figure 11. Temperature dependence of (a) yield strength obtained by Wu et al. [9] (red points) for a grain size of 30 µm compared to values obtained in the present study for a grain size of 33 µm (green points) and (b) intrinsic lattice strength of a polycrystal with an infinite grain/crystallite size. Black data points were obtained from Figure 6a by extrapolating the Hall–Petch plots to an infinite grain size while the empty symbols were determined by extrapolating the plots to an infinite crystallite size (Figure 6b). Also shown in (b) is the temperature dependence of the intrinsic lattice strength (black line) computed using the solid solution strengthening model of Varvenne et al. [47].
Metals 09 00084 g011
Figure 12. Yield strength (σ0) of single crystalline Ni [50] and polycrystalline CrCoNi [21] and MnFeNi (present study) extrapolated to an infinite grain size represented in blue, red and black, respectively, as a function of temperature determined by extrapolation of the grain sizes.
Metals 09 00084 g012
Table 1. Mean grain size (d), crystallite size (c) and number of annealing twin boundaries per grain (n) after heat treatment at different temperatures and times. d only takes into account the intercepts with grain boundaries, whereas c is determined by counting intercepts with both grain and annealing twin boundaries.
T (K)Time (min)d (µm)c (µm)n (-)t (µm)Magnification
10734517 ± 113 ± 10.34.5250
10736019 ± 116 ± 10.17.0150
107312022 ± 214 ± 10.67.0200
11736033 ± 225 ± 10.315100
12736066 ± 249 ± 40.32175
137330112 ± 586 ± 60.33075
147360216 ± 10120 ± 80.85170
Table 2. Hall–Petch parameters (σ0 and ky) determined by fitting Equation (1) to the grain size (d, upper part) and crystallite size (c, lower part) data sets obtained at different temperatures.
Grain/Crystallite SizesT (K)σ0 (MPa)ky (MPa µm1/2)
d77230 ± 7640 ± 40
29397 ± 4660 ± 30
67344 ± 3550 ± 20
87349 ± 3570 ± 20
c77226 ± 7570 ± 40
29391 ± 4590 ± 25
67338 ± 3510 ± 20
87344 ± 3515 ± 20

