Article

A Comparative Study on the Dynamic Tensile Behavior of Nanostructured Bainitic and Quenched-Tempered Martensitic Steels

1
The State Key Laboratory of Refractories and Metallurgy, Hubei Province Key Laboratory of Systems Science on Metallurgical Processing, International Research Institute for Steel Technology, Wuhan University of Science and Technology, Wuhan 430081, China
2
Department of Metallurgical and Materials Engineering, University of Texas at El Paso, El Paso, TX 79968, USA
*
Authors to whom correspondence should be addressed.
Metals 2018, 8(9), 728; https://doi.org/10.3390/met8090728
Submission received: 15 August 2018 / Revised: 11 September 2018 / Accepted: 14 September 2018 / Published: 17 September 2018

Abstract

:
In order to assess the dynamic tensile behavior of a newly developed three-step low-temperature-transformed bainitic microstructure, and a conventional one-step isothermal bainitic microstructure, and a quenched and tempered martensitic microstructure, a comparative research was conducted by using the dynamic tensile test. The results showed that more film-like retained austenite was obtained in the three-step low-temperature-transformed sample. The carbon content in the film-like retained austenite was found to be higher as compared to the blocky retained austenite. The dynamic tensile properties were all improved with an increase in strain rates (from 0.1 to 500 s−1). However, the three-step bainitic low-temperature-transformed sample showed the most remarkable dynamic tensile properties, including ultimate tensile strength and total elongation. This is attributed to a better transformation-induced plasticity effect that is exhibited by the higher stability of the film-like retained austenite. Therefore, the present study suggests that performing a three-step low-temperature bainitic transformation promotes grain refinement and the formation of film-like retained austenite and improves the dynamic tensile properties.

1. Introduction

Energy saving, safety, long life, and low cost are the main targets of automobile developments. The application of advanced high strength steel (AHSS) in a car body is an important way to reduce car weight for energy saving. According to the developing history of AHSS, it can be observed that the mechanical properties are related to different microstructures that are obtained by different heat treatments. It is well known that some types of retained austenite in steels can effectively improve plasticity. The effect of improving plasticity by using the process of phase transformation is called transformation-induced plasticity (TRIP). Zackay et al. [1] reported the TRIP effect in a study on high-alloy austenitic stainless steel. Primarily, a soft ferrite matrix and the dispersion of multiphase grains of bainite, retained austenite, and martensite [2,3,4] were used to compose the typical microstructures of the TRIP steel.
Early studies on TRIP steel [5,6,7] were primarily concentrated on a series of C–Mn–Si steels because of their low cost, which can achieve high strength (600–800 MPa tensile strength) and high ductility (15–30% elongation). At a tensile strain rate of 103 s−1, Wei et al. [5] studied the tensile mechanical properties of Si–Mn TRIP steels (Fe–0.195C–1.60Si–1.58Mn wt %). The results showed that the tensile strength significantly increased and the elongation decreased under dynamic tensile tests as compared with those under static tensile tests. Wang et al. [6] studied the dynamic mechanical properties of high strength-ductility quenching-partitioning-tempering (Q-P-T) treated TRIP steel and compared their dynamic mechanical properties with traditional quenching-tempering (Q&T) treated steels. The results showed that the ultimate tensile strength and the elongation of Q-P-T steels increased with an increase in the strain rate, which was attributed to more dislocated source operation stimulated by a high strain rate. The dynamic mechanical properties of the traditional quenching and tempering process were studied by Hao et al. [7]. The results showed that in the dynamic tensile test, the ultimate tensile strength and the elongation of Q&T martensitic steel increase with little retained austenite.
Nanostructured bainite (also known as superbainite and low-temperature bainite) steel, which was first developed by Bhadeshia et al. [8,9,10,11,12], exhibits a good combination of ultrastrength, ductility, and toughness. It shows potential for being used as a candidate material in car bodies because of its excellent composite mechanical properties. The ultrahigh strength of the nanostructured bainitic steel is attributed to its ultrafine bainitic-ferrite microstructure, whereas its good ductility and toughness are attributed to the presence of about 20 vol % retained austenite [8,10]. For the design and manufacture of automobiles, dynamic tensile mechanical properties are very important. However, the dynamic characteristics of the nanostructured bainitic steel in the dynamic tensile test are not well understood. Therefore, this study investigates the dynamic tensile properties of the samples processed by different heat treatments in an identical chemical composition. In order to assess dynamic tensile behavior, the newly developed nanostructured bainitic microstructure and the conventional quenched and tempered martensitic microstructure were comparatively investigated.

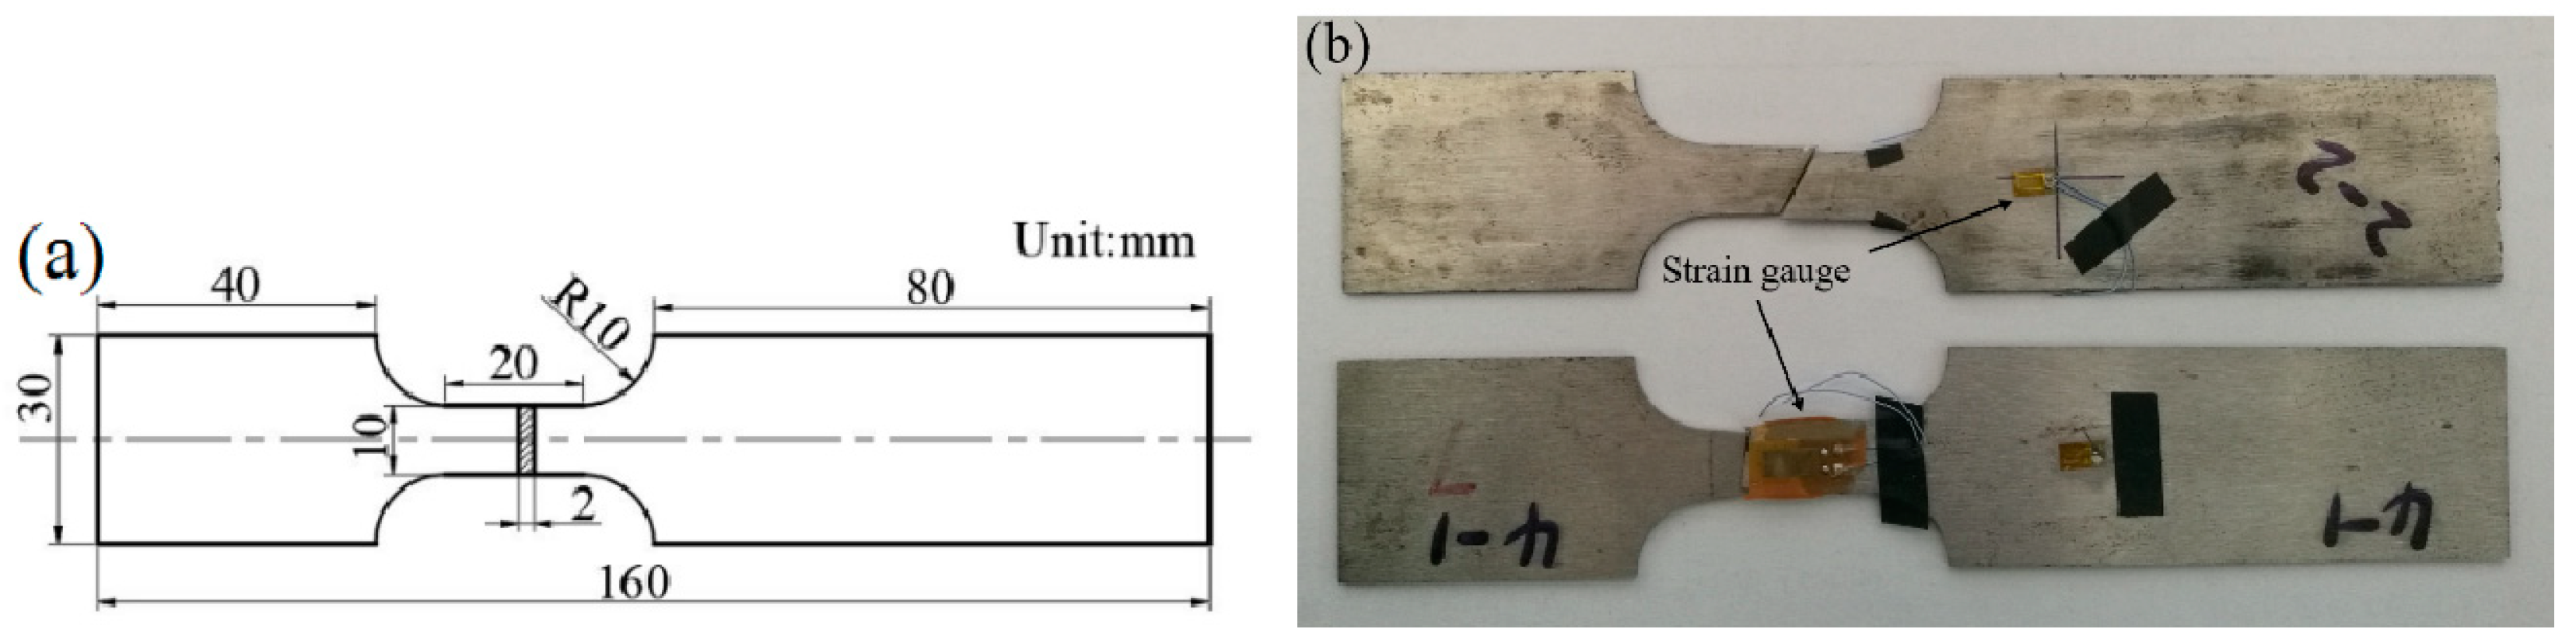
2. Experimental Section

An 18 mm thick hot-rolled plate was selected as the experimental steel. Table 1 shows the chemical composition. The starting temperature of bainite (Bs) and martensite (Ms) transformation were 450 °C and 250 °C by using the Gleeble 3500 simulator (DSI Europe GmbH, Weissenhorn, Germany), respectively. As shown in Figure 1, three different heat treatments were designed. Figure 2a shows the illustration of the samples for the heat treatment and dynamic tensile test. In the first heat treatment process, the steel sample was austenitized at 880 °C for 30 min, immediately quenched in water, and then tempered at 450 °C for 3 h (hereafter referred to as Q&T, i.e., quenching and tempering). In the second heat treatment process, the steel sample was austenitized at the same temperature for the same time, and then isothermally kept at 300 °C for 40 min, followed by air cooling to room temperature (hereafter referred to as B1, i.e., a one-step low-temperature bainite transformation). In the third heat treatment process, the steel sample was austenitized at the same temperature for the same time and then isothermally kept at 300 °C for 40 min, and continuously kept at 250 °C for 24 h in another furnace, and successively kept at 200 °C for 48 h in a separate furnace, followed by air cooling to room temperature (hereafter referred to as B3, i.e., three-step low-temperature bainite transformation). Chamber furnaces were used to carry out all isothermal cycles.
A servo-hydraulic high speed tensile testing machine (Zwick HTM 5020, ZWICK/ROELL, Ulm, Germany) was used to conduct the dynamic tensile test after heat treatment. According to ISO 26203-2011, tensile properties were investigated at a high strain rate. The strain rate was defined by the following relation:
ε ˙ = d ε d t = d d t ( L ( t ) L 0 L 0 ) = 1 L 0 d L d t ( t ) = v ( t ) L 0  
where v ( t ) , L0, and ε ˙ represent the tensile speed, the specimen tensile length, and the strain rate, respectively. For the dynamic tensile test of experimental steels, five tensile rates 0.002, 1, 2, 4, and 10 m/s and thus the strain rates 0.1, 50, 100, 200, 500 s−1, respectively, were selected. Two samples were prepared for each strain rate in order to minimize the error. The deformation of samples is primarily measured by strain gauges attached to the specimen’s deformation parts in the process of testing. Figure 2b shows the specimens attached with strain gages. The strain gauge positioning was identical for all dynamic tensile test specimens. During the test, a linear displacement transducer (LDT) was used to measure the displacement of the crosshead, and the strain of the specimen was calculated from this acquired displacement. The data synchronous acquisition of dynamic load, displacement, strain and loading rate was performed at a natural frequency of 1 MHz during the dynamic tensile tests.
By using the standard techniques, a number of metallographic samples were ground, polished, and etched in a nital solution (4 vol %). In order to analyze the microstructure and fracture surface morphology, scanning electron microscope (SEM, Nova 400 Nano field emission, FEI, Hillsboro, OR, USA) and transmission electron microscope (TEM, JEM-2100, JEOL, Tokyo, Japan) were used. In order to measure the thickness of microstructures by the mean linear intercept, using the formula L = πt/2 in a direction normal to the plate length, SEM and TEM images were used [13]. By using the average of at least 15 tests in every SEM and TEM image, the true thickness of lath or plate-like microstructures was determined. By using the average of at least 15 photos measured by Image-Pro Premier Image Analysis Software 9.1 (Meyer, Houston, TX, USA) the volume fraction of bainite and martensite was reported.
In order to analyze the carbon content in different microstructures, electron probe microanalysis (EPMA, JXA-8530F, JEOL, Tokyo, Japan) was used. The acceleration voltage was 15 kV, the beam current was 20 mA, and the scanning step was 0.08 μm. The size of mapping and the line scanning were found to be 24 × 18 μm2, 24 μm, respectively, and the size of the beam spot was found to be 1 μm. The average of at least 10 tests was considered to measure the carbon content.
Using an X-ray powder diffraction (XRD) using a Rigaku D/Max-1200X diffractometer (Tokyo, Japan) with Cu Kα radiation, austenite phase analysis was carried out under the following conditions: acceleration voltage, 45 kV; current, 250 mA; step, 0.01. XRD was used to calibrate integrated intensities of (200)α, (211)α, (200)γ, (220)γ, and (311)γ diffraction peaks. The volume fraction of retained austenite was calculated by the following equation [14]:
V i = 1 1 + G ( I α / I γ )  
where Vi is the volume fraction of austenite for each peak, Iα and Iγ are the integrated intensities of ferrite and austenite peaks, respectively, and G is a certain value for each peak. The measurement error of the retained austenite volume fraction was calculated to be 0.015. A hardness indenter (Buehler Micromet 5101, Buehler, Lake Bluff, IL, USA) was used to perform Vickers hardness tests. The value of the applied force was 1.0 kg (9.8 N). The average of at least 10 tests was taken to report each value.

3. Results

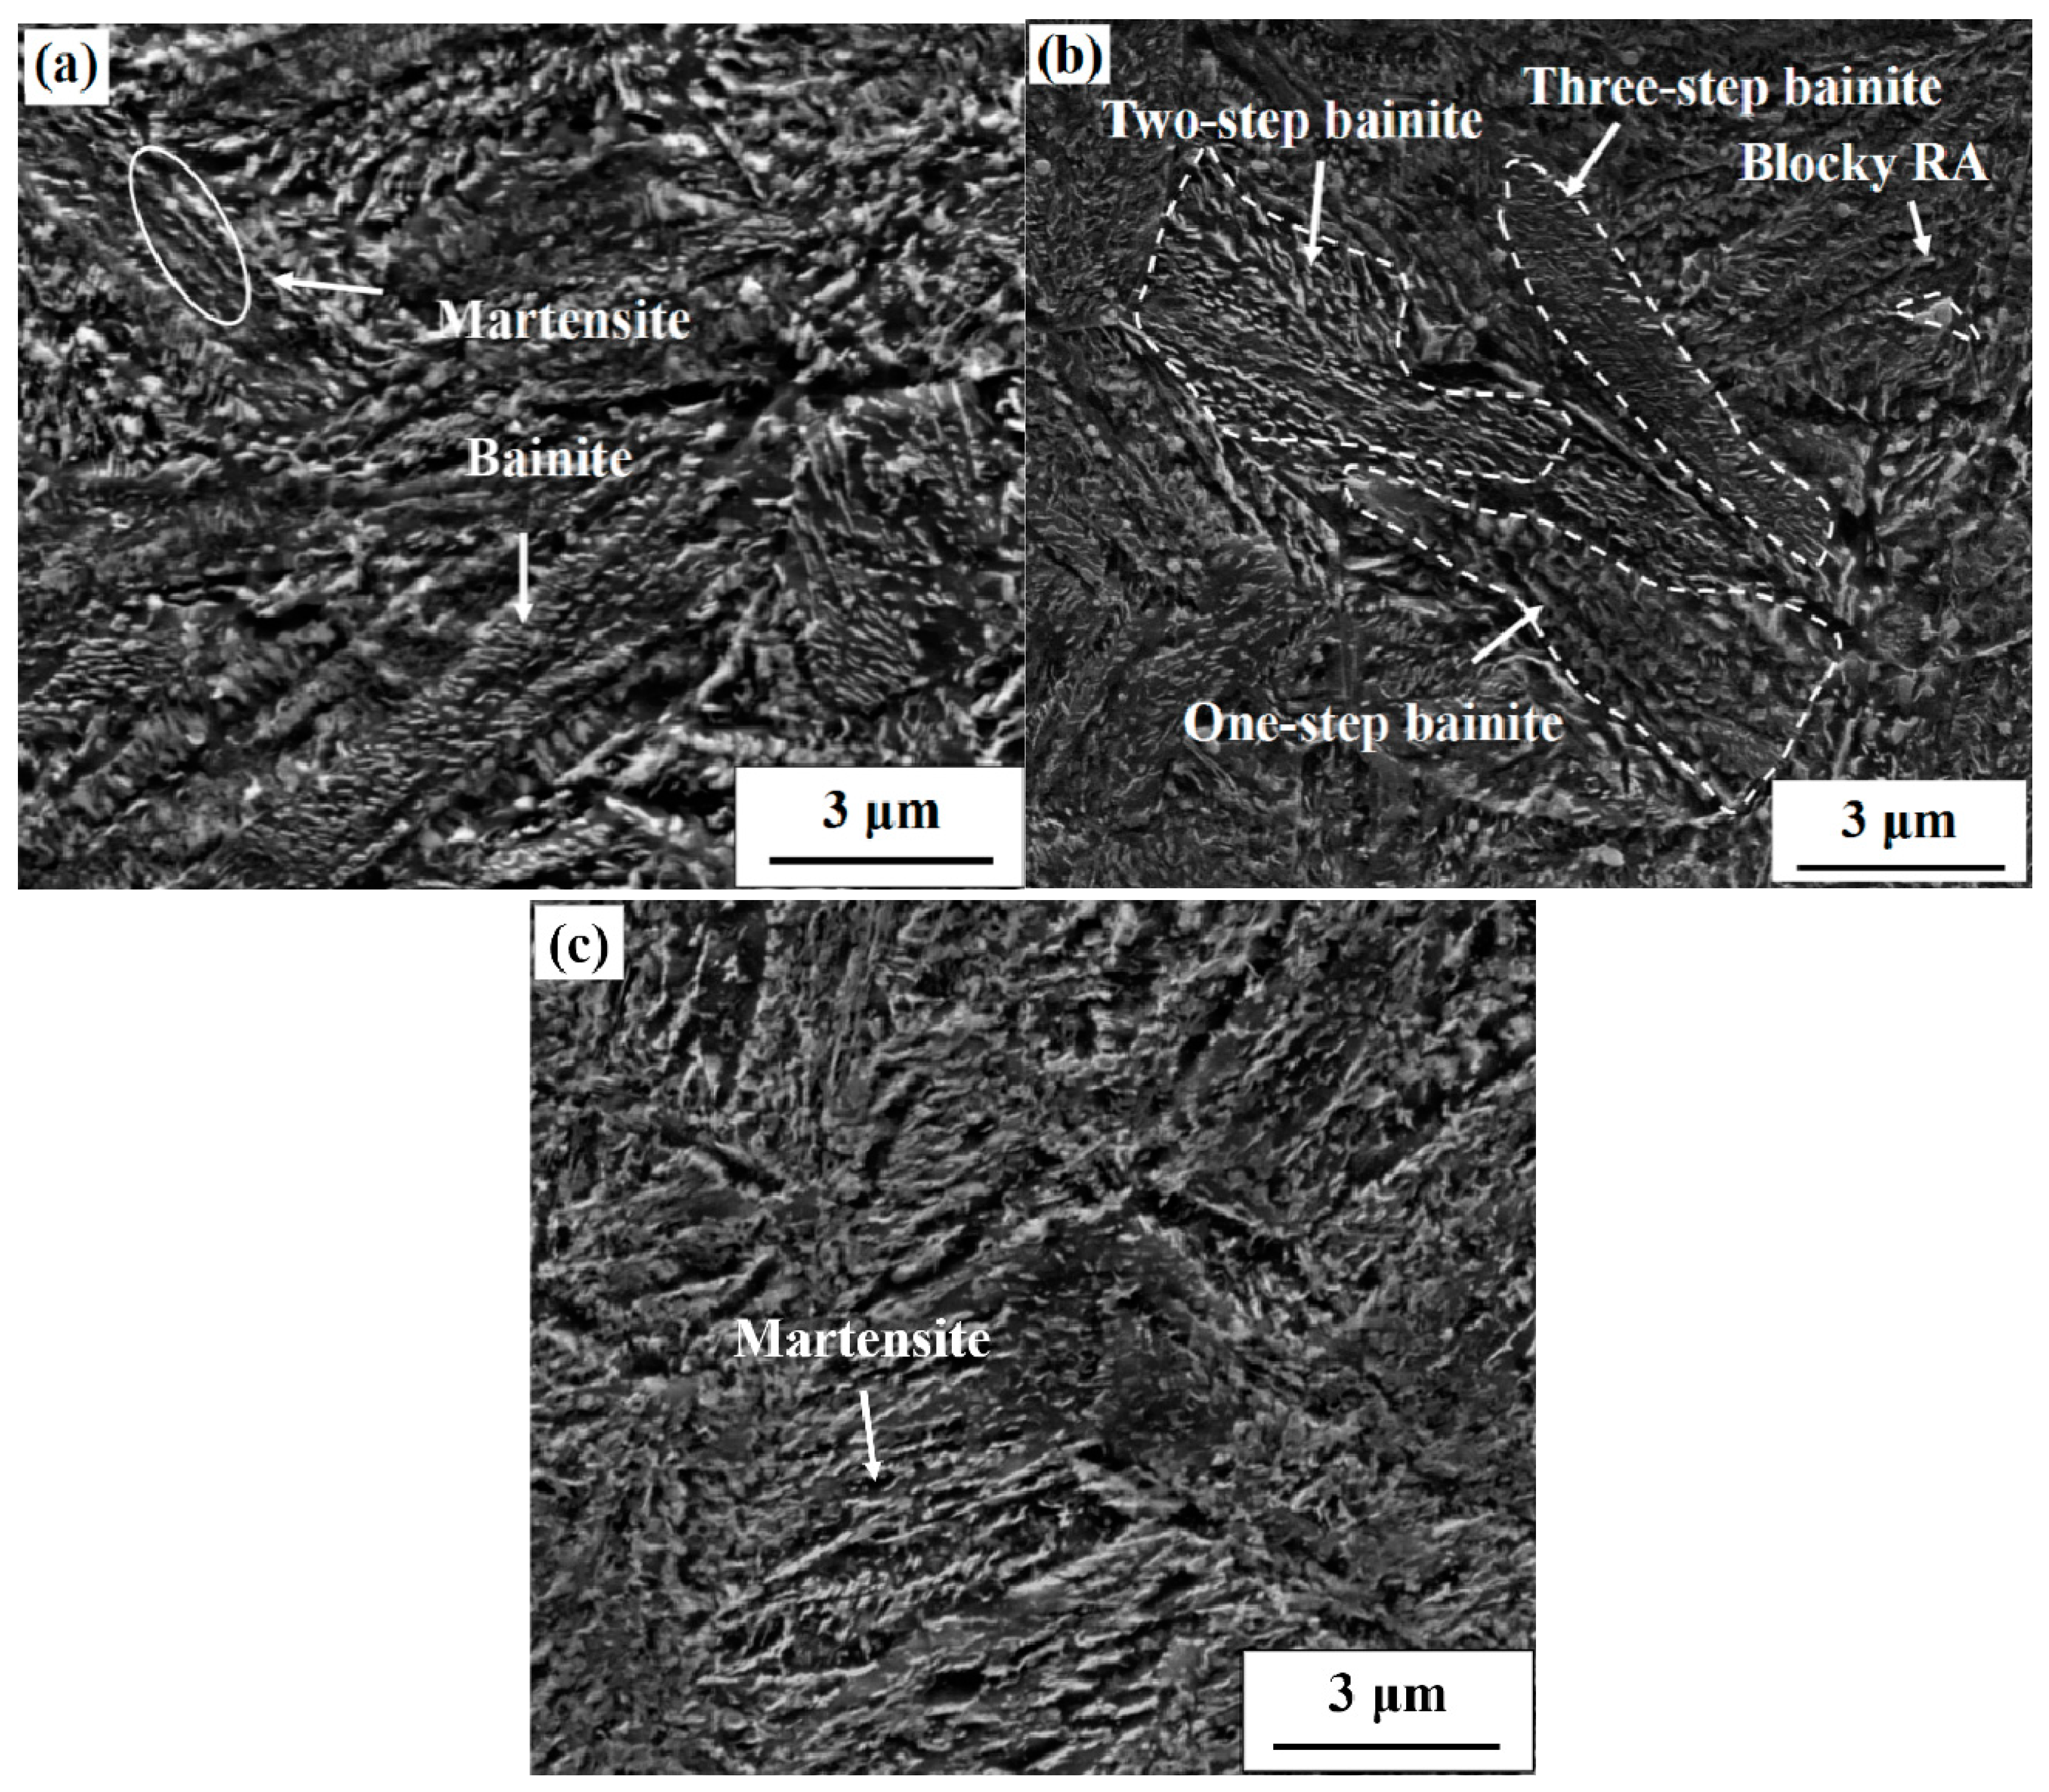
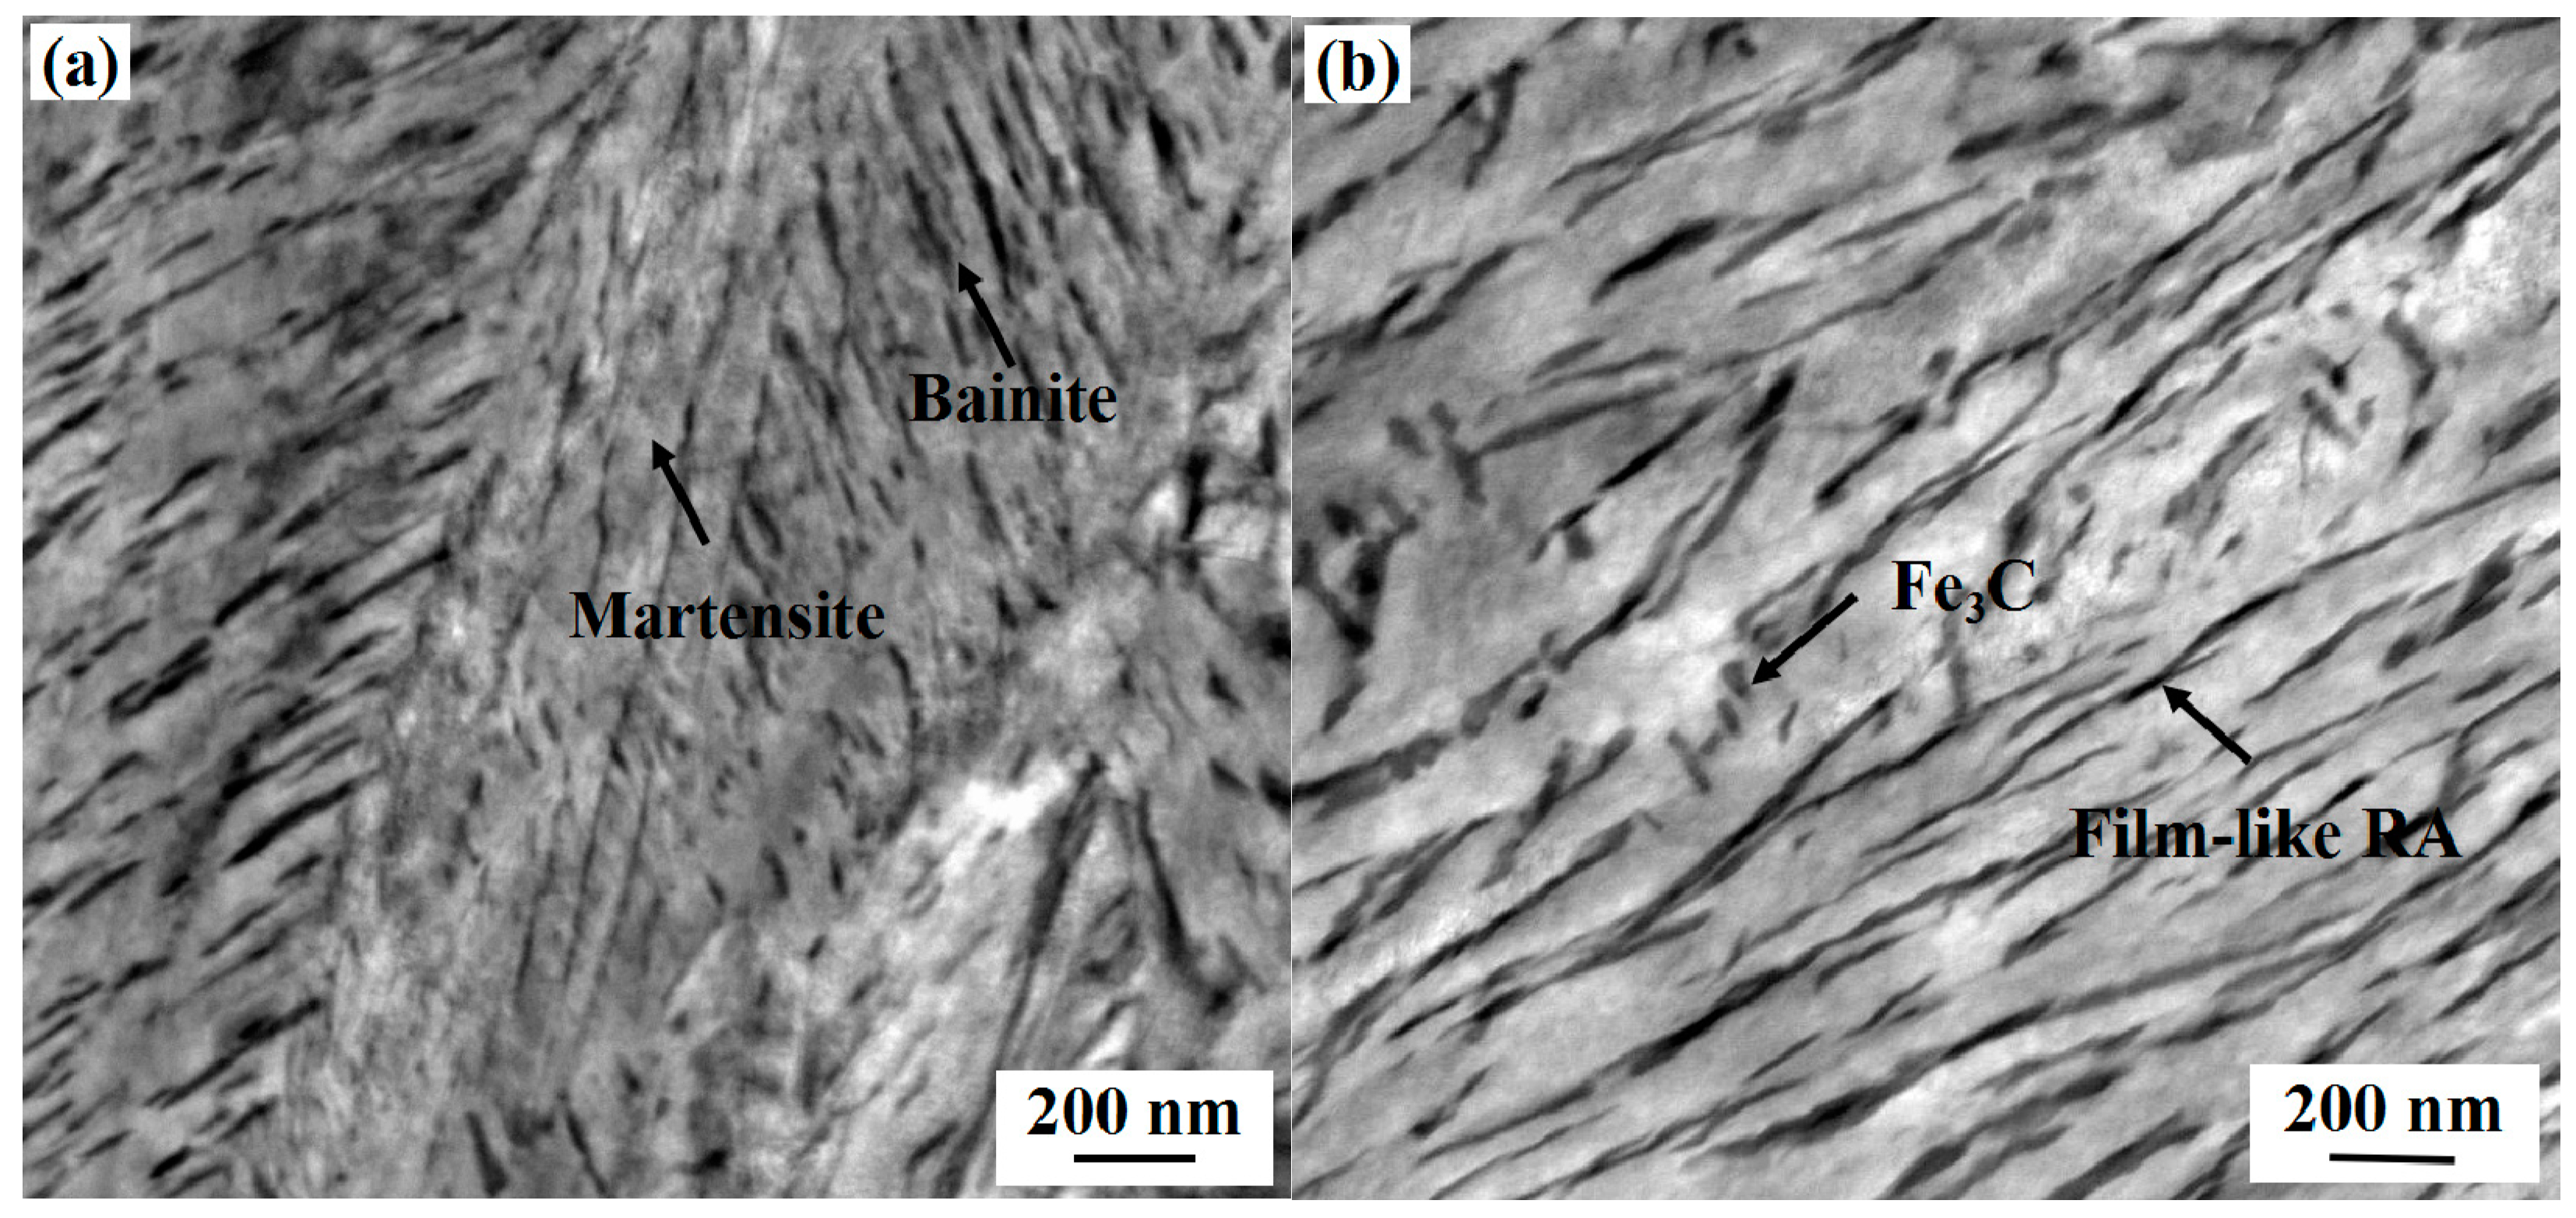
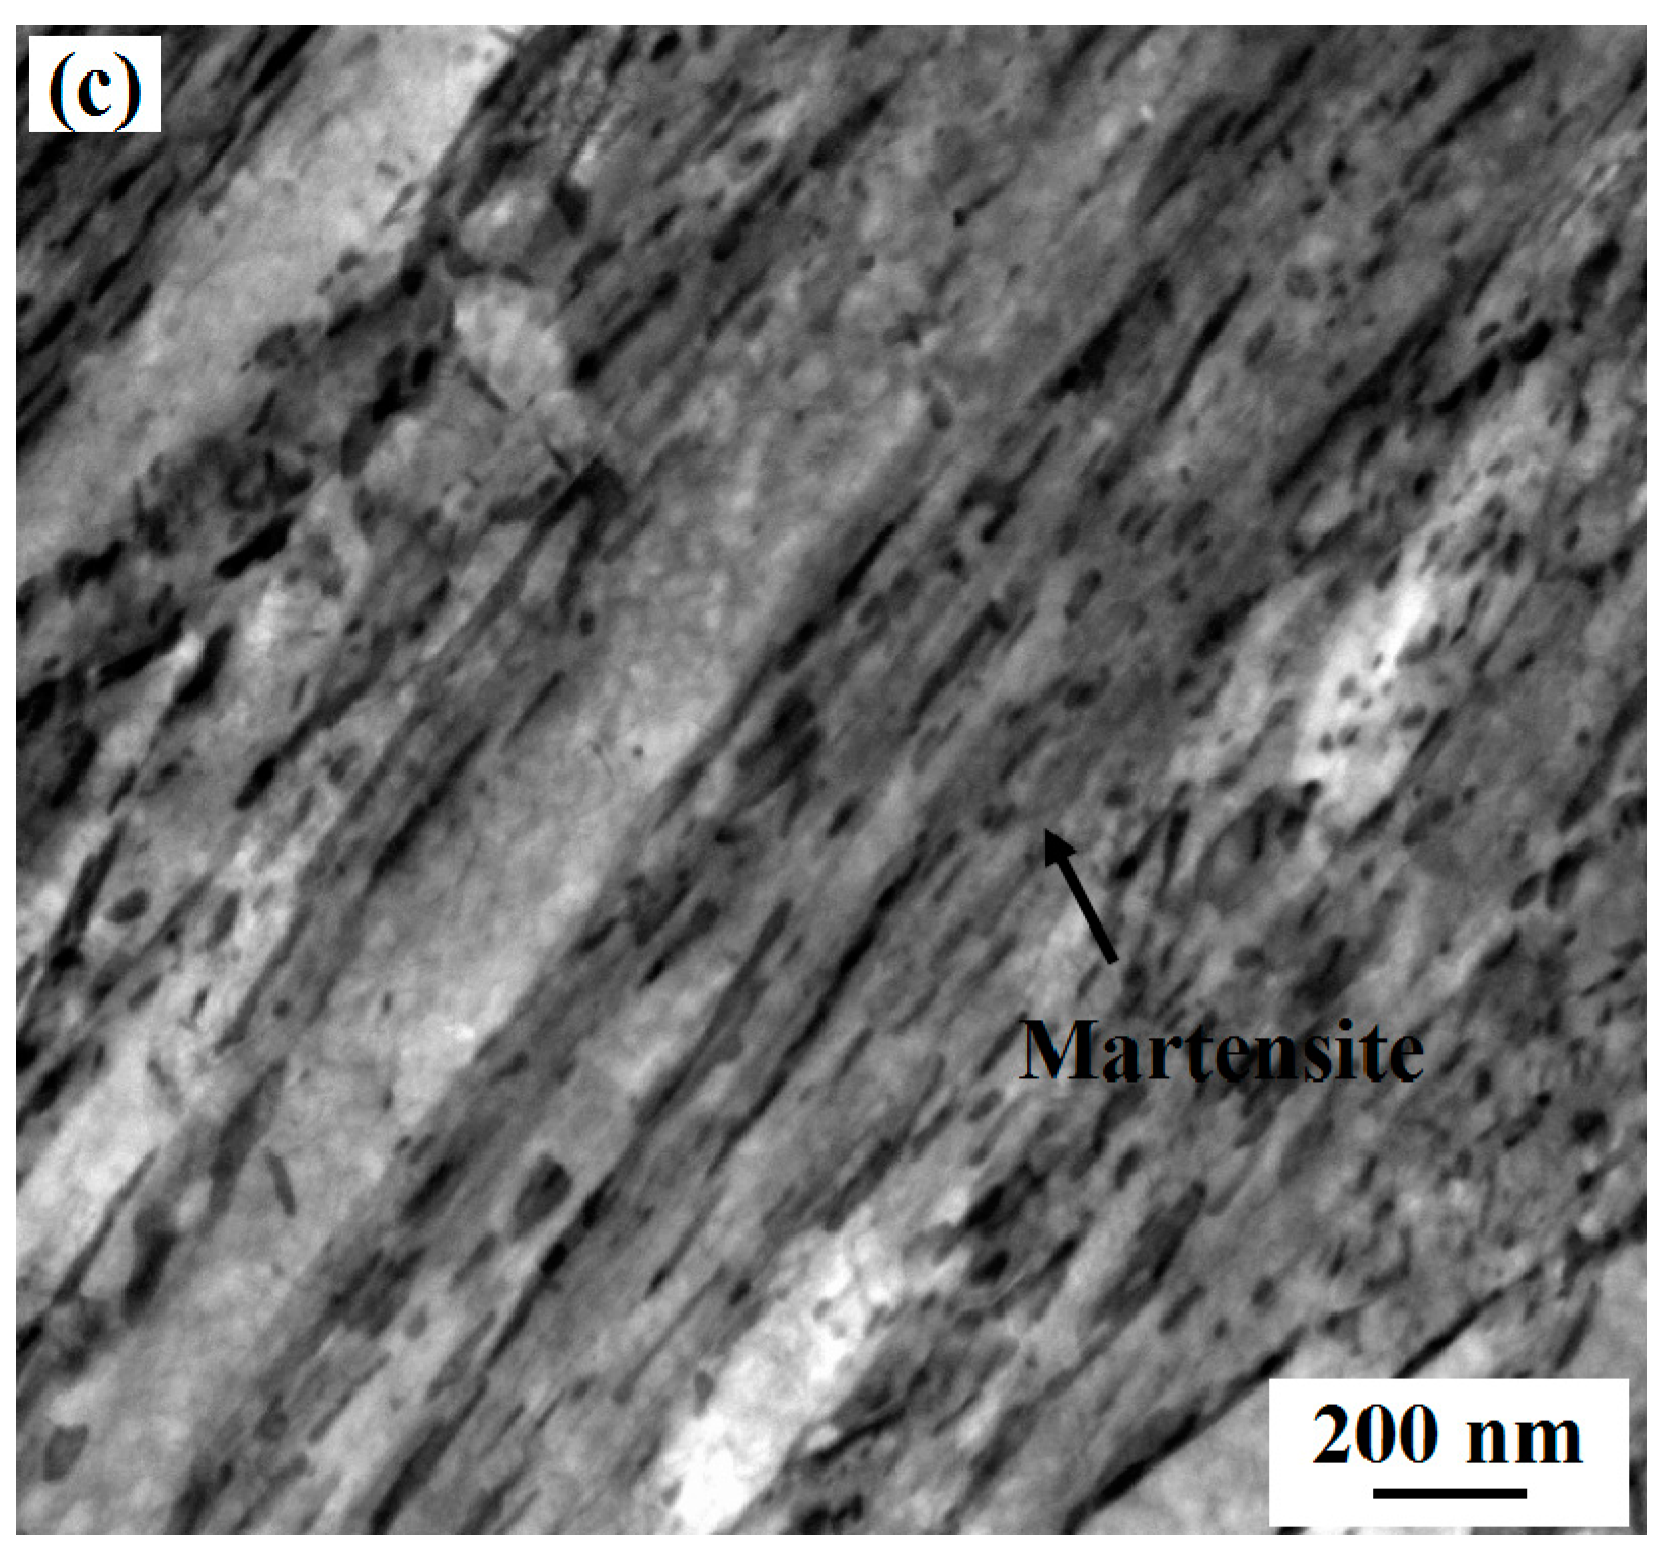
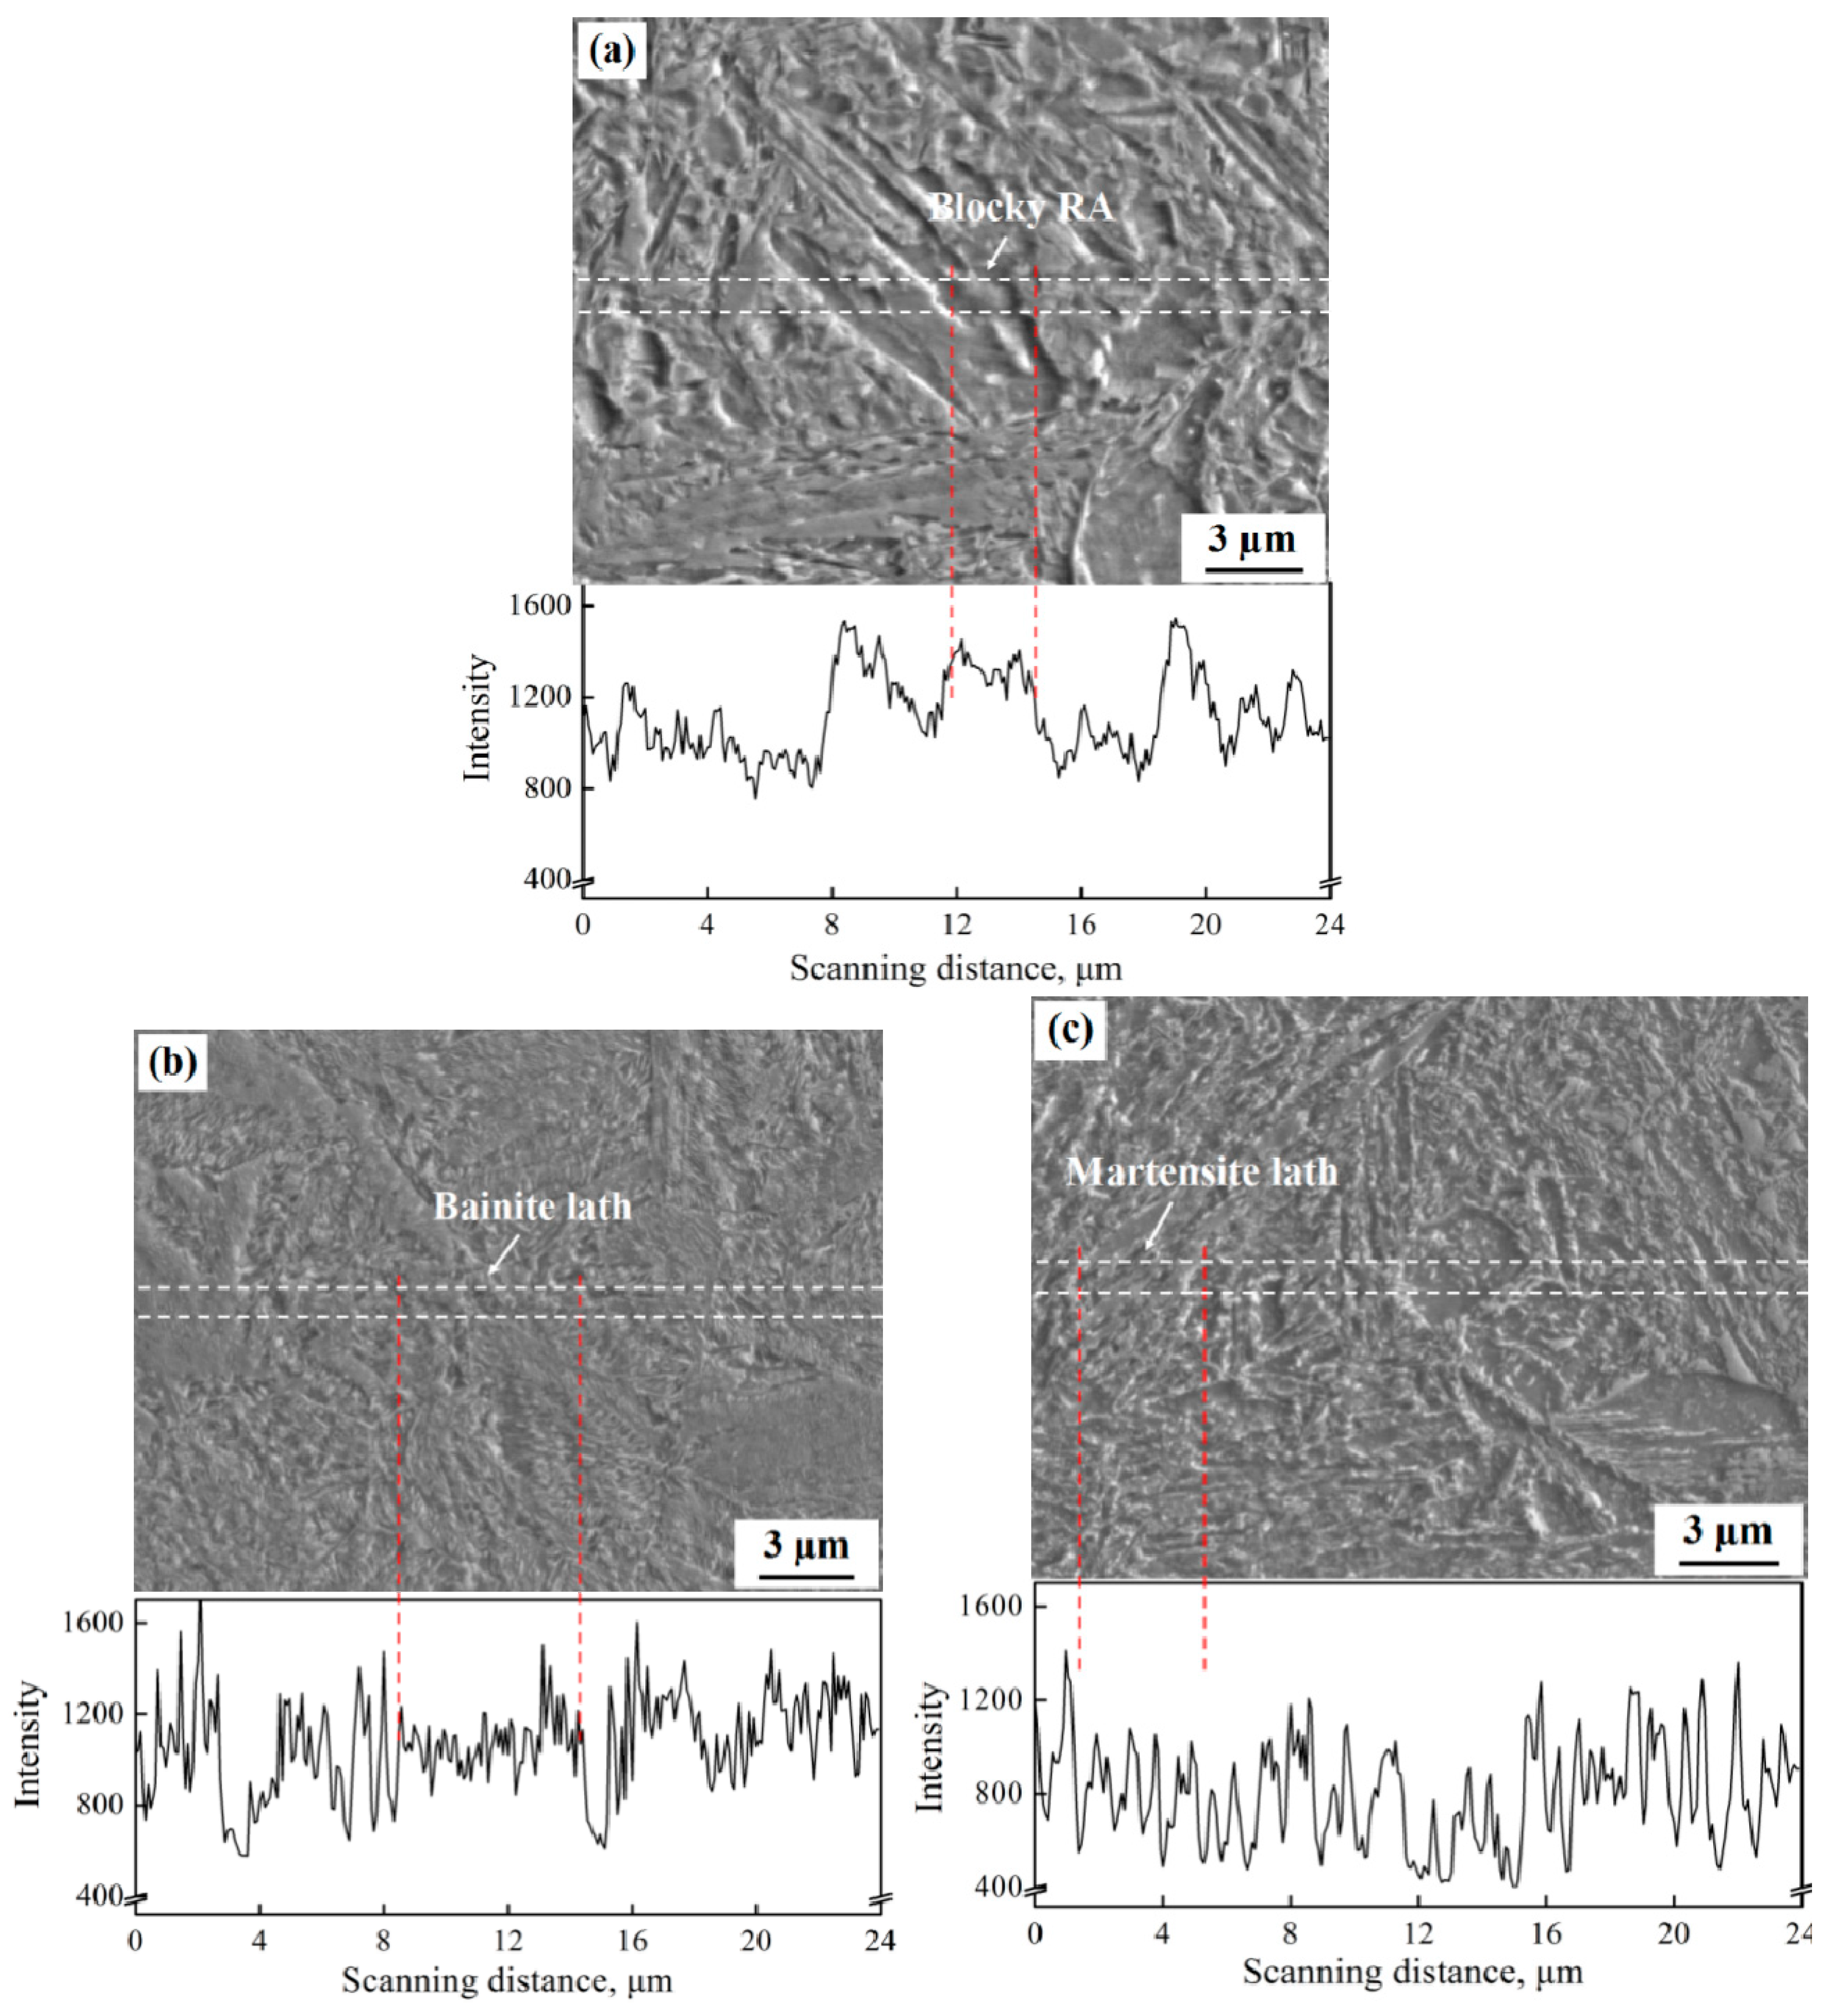
3.1. Microstructures

The SEM microscopic images of the samples with different heat treatments are shown in Figure 3. Three different sizes of bainite and retained austenite were used to compose the microstructure of the B3 sample. Tempered martensite and retained austenite were used to compose the microstructure of the Q&T sample. TEM microscopic images of different heat-treated samples are shown in Figure 4. It can be seen that the bainite lath width of the B3 sample was significantly smaller as compared to that of the B1 sample. The measured volume fraction of retained austenite/bainite/martensite, the thickness of bainite/martensite, and the hardness for different heat treatments are presented in Table 2. It was observed that the volume fraction of retained austenite decreased from 0.279 to 0.237, with an increase in the isothermal bainite transformation step. The B1 sample consisted of 15.3% bainite and 56.8% martensite. In addition, among the three heat-treated samples, the B3 sample achieved the thinnest laths or plates (50–100 nm), which coincided with the hardness value. The volume fraction of the retained austenite of the Q&T sample was the lowest, but the hardness was slightly higher as compared to that of the B1 sample.

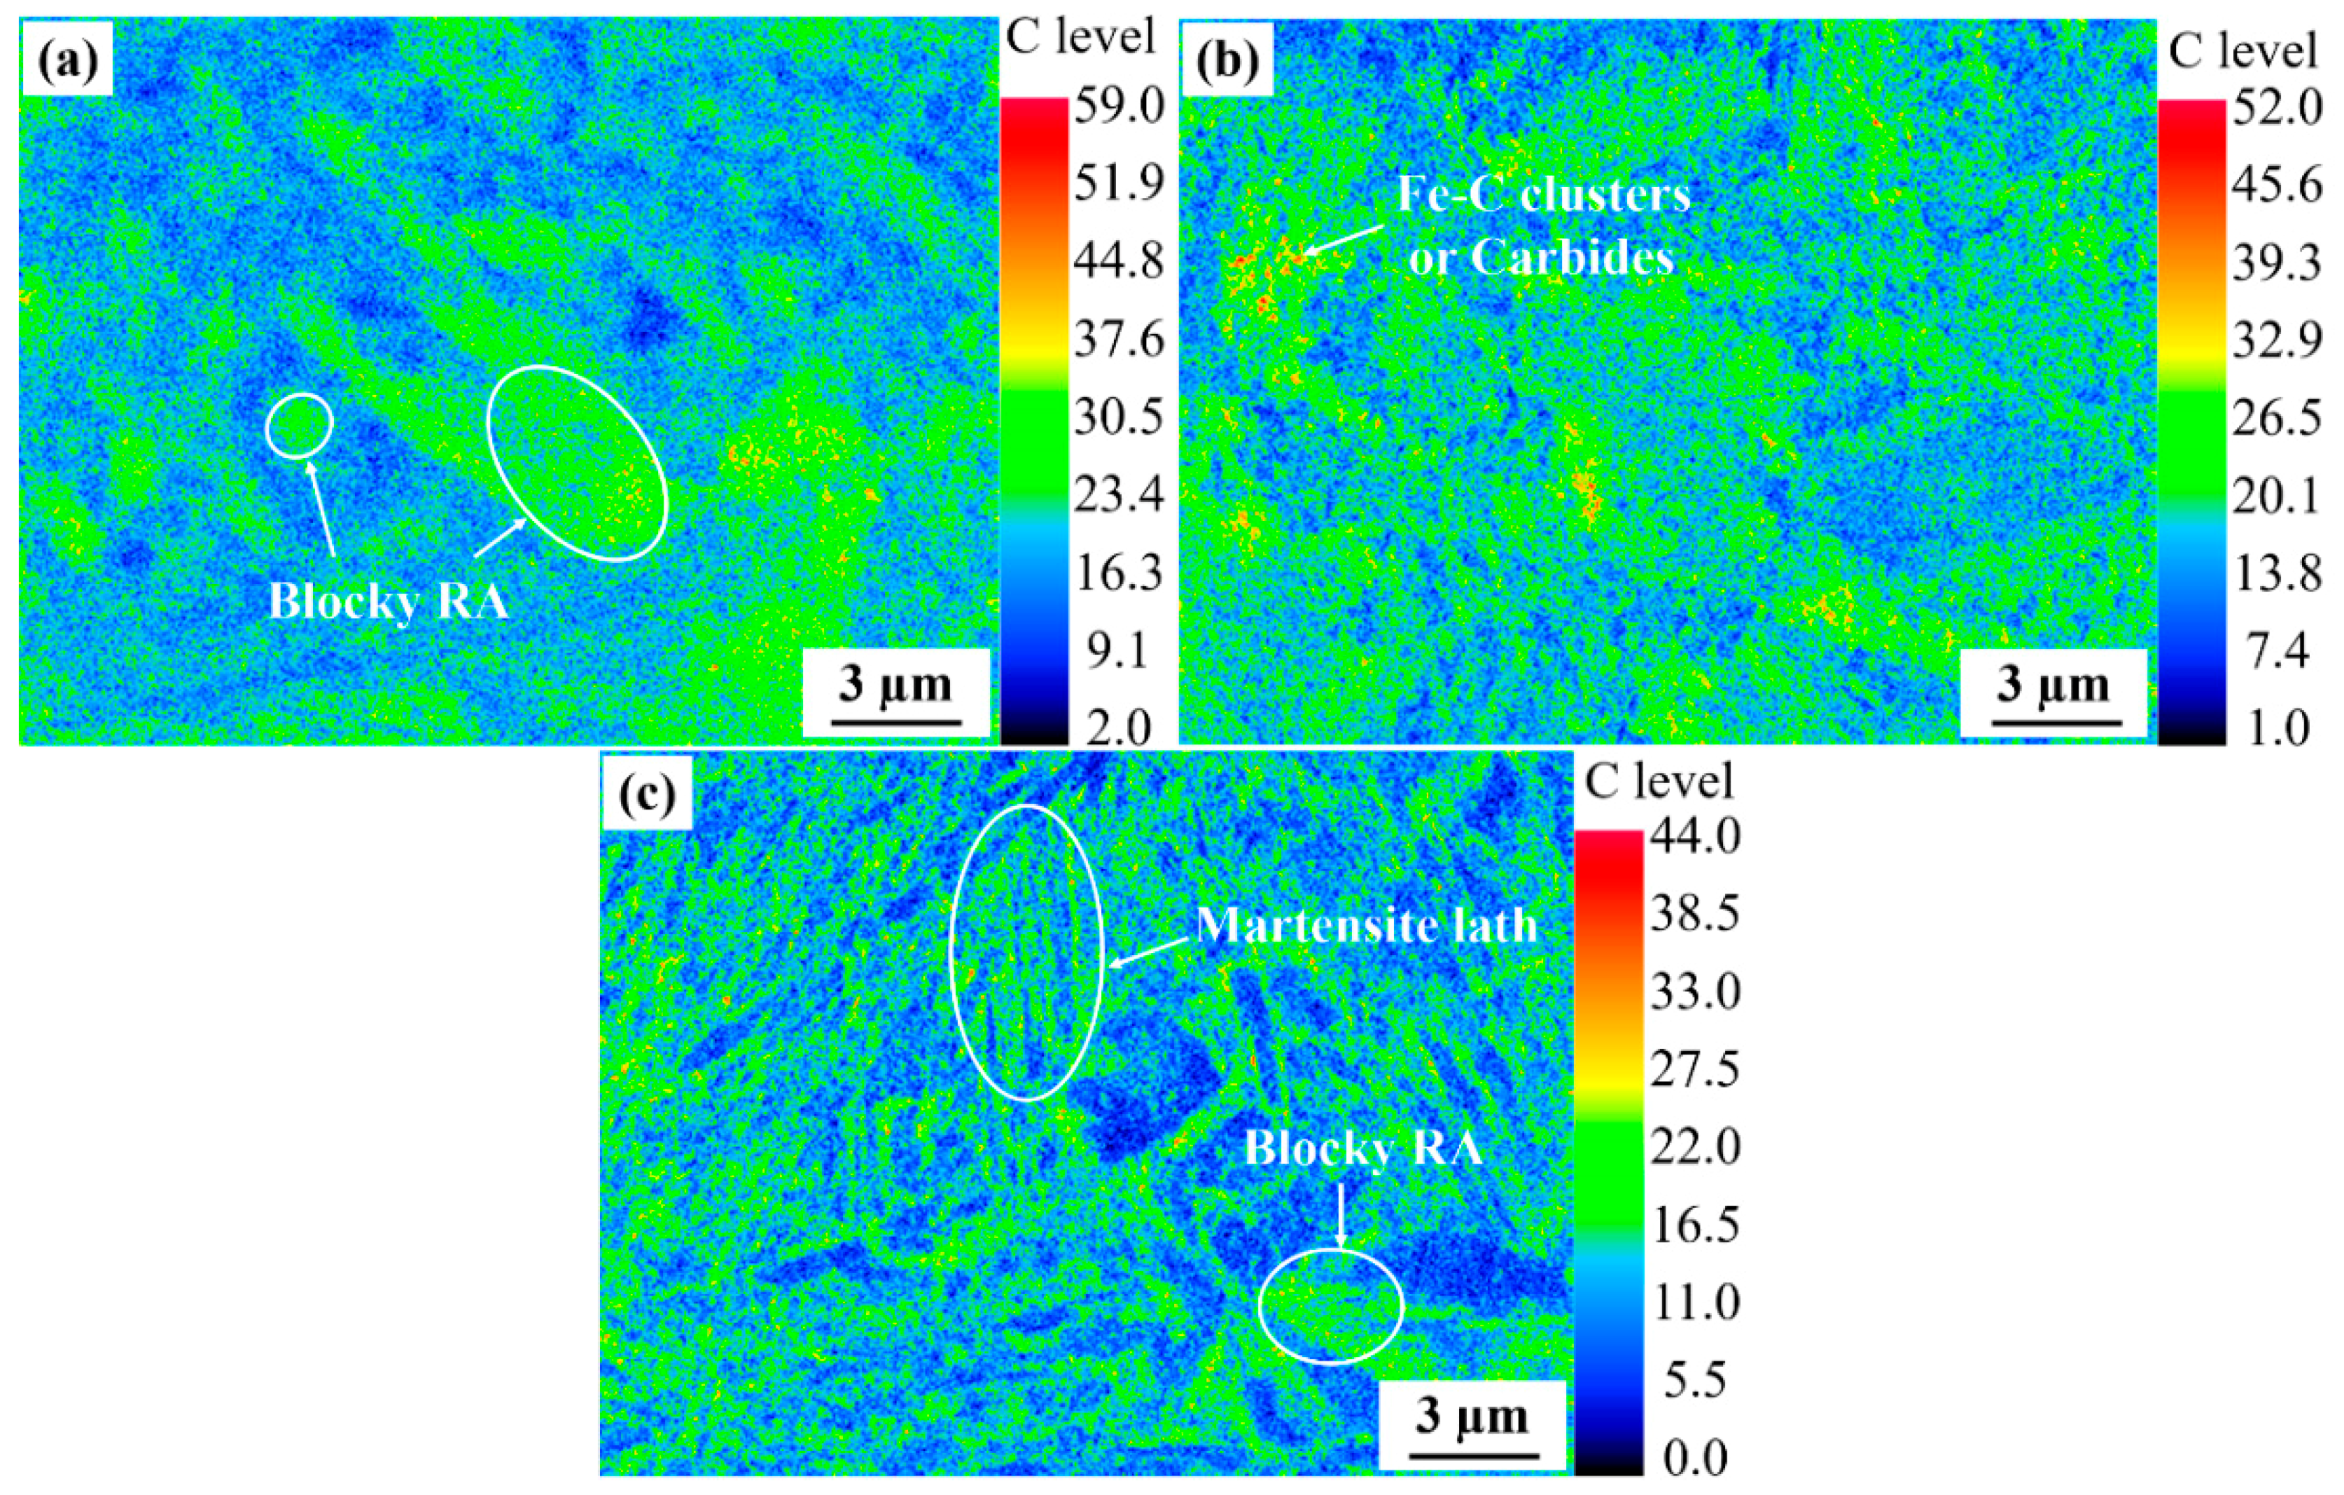
3.2. The Carbon Content of Retained Austenite

The mapping of the carbon content of retained austenite in different heat-treated samples is shown in Figure 5. The number on the right of each figure indicates the diffraction intensity of the carbon content. The green area in Figure 5a shows blocky retained austenite with a relatively high carbon content. The carbon content distribution of the B3 sample was more uniform as compared to the B1 sample, and the red spot may represent the Fe–C clusters or carbides in the bainitic microstructure during the long-time isothermal process [4]. The mapping results of the carbon content of the Q&T sample showed that the blue and green areas had a more obvious boundary line, because the formation of martensite is a nondiffusion-type phase transformation and the carbon content of martensite is lower as compared to the retained austenite.
Figure 6 shows the line distribution of the carbon content in different heat treated samples. The actual area of the line scanning is indicated by the width between the two white lines in the diagram, which is 1 µm. In Figure 6a, the carbon content of the blocky retained austenite is in an intermediate level. The bainite had the lowest carbon content, and the film-like retained austenite had the highest carbon content. B3 sample consisted of a large number of film-like retained austenite. The line scanning results of the B3 sample demonstrate that the bainite sheaves showed a low carbon content, and also a big fluctuation in the carbon content peaks. The peak of the carbon content and the number of wave valleys significantly increased as the size of bainite ferrite became smaller. The carbon content in the lath martensite region was low, and the residual austenite region showed high carbon content as shown in Figure 6c. The width of the two peaks in the Q&T sample was obviously larger as compared to that of bainite. The peak values in B3 and Q&T samples were more acute compared to the B1 sample, which may be due to the segregation of carbon between the bainitic/martensitic laths and the film-like retained austenite interfaces. Previous studies have shown that the segregation of carbon is affected by the coupled solute drag effect of Mn on the boundary between α and γ phases [15,16].
The carbon content of blocky and film-like retained austenite in different heat-treated samples is shown in Figure 7. In order to measure the carbon content in the blocky and film-like retained austenite, some typical point scanning is shown in Figure 8. The mean value of the measurement area of the beam spot with a diameter of 1 µm is reflected by the results of spot scanning. Obviously, the carbon content in the blocky and film-like retained austenite (0.903 ± 0.073 wt % and 1.172 ± 0.093 wt %) in the B3 sample was higher as compared to that in the B1 sample (0.805 ± 0.061 wt % and 0.983 ± 0.053 wt %). More carbon atoms were diffused into neighboring retained austenite to form the film-like retained austenite with the increasing isothermal bainite transformation step, which resulted in a higher carbon content (by 19.2%) in the B3 sample as compared to the B1 sample. The carbon content of the blocky retained austenite in the B3 sample was higher (by 12.2%) as compared to that in the B1 sample. The carbon content of the blocky and film-like retained austenite (0.685 ± 0.084 wt % and 0.851 ± 0.076 wt %) in the Q&T sample was higher as compared to that of bulk alloys.

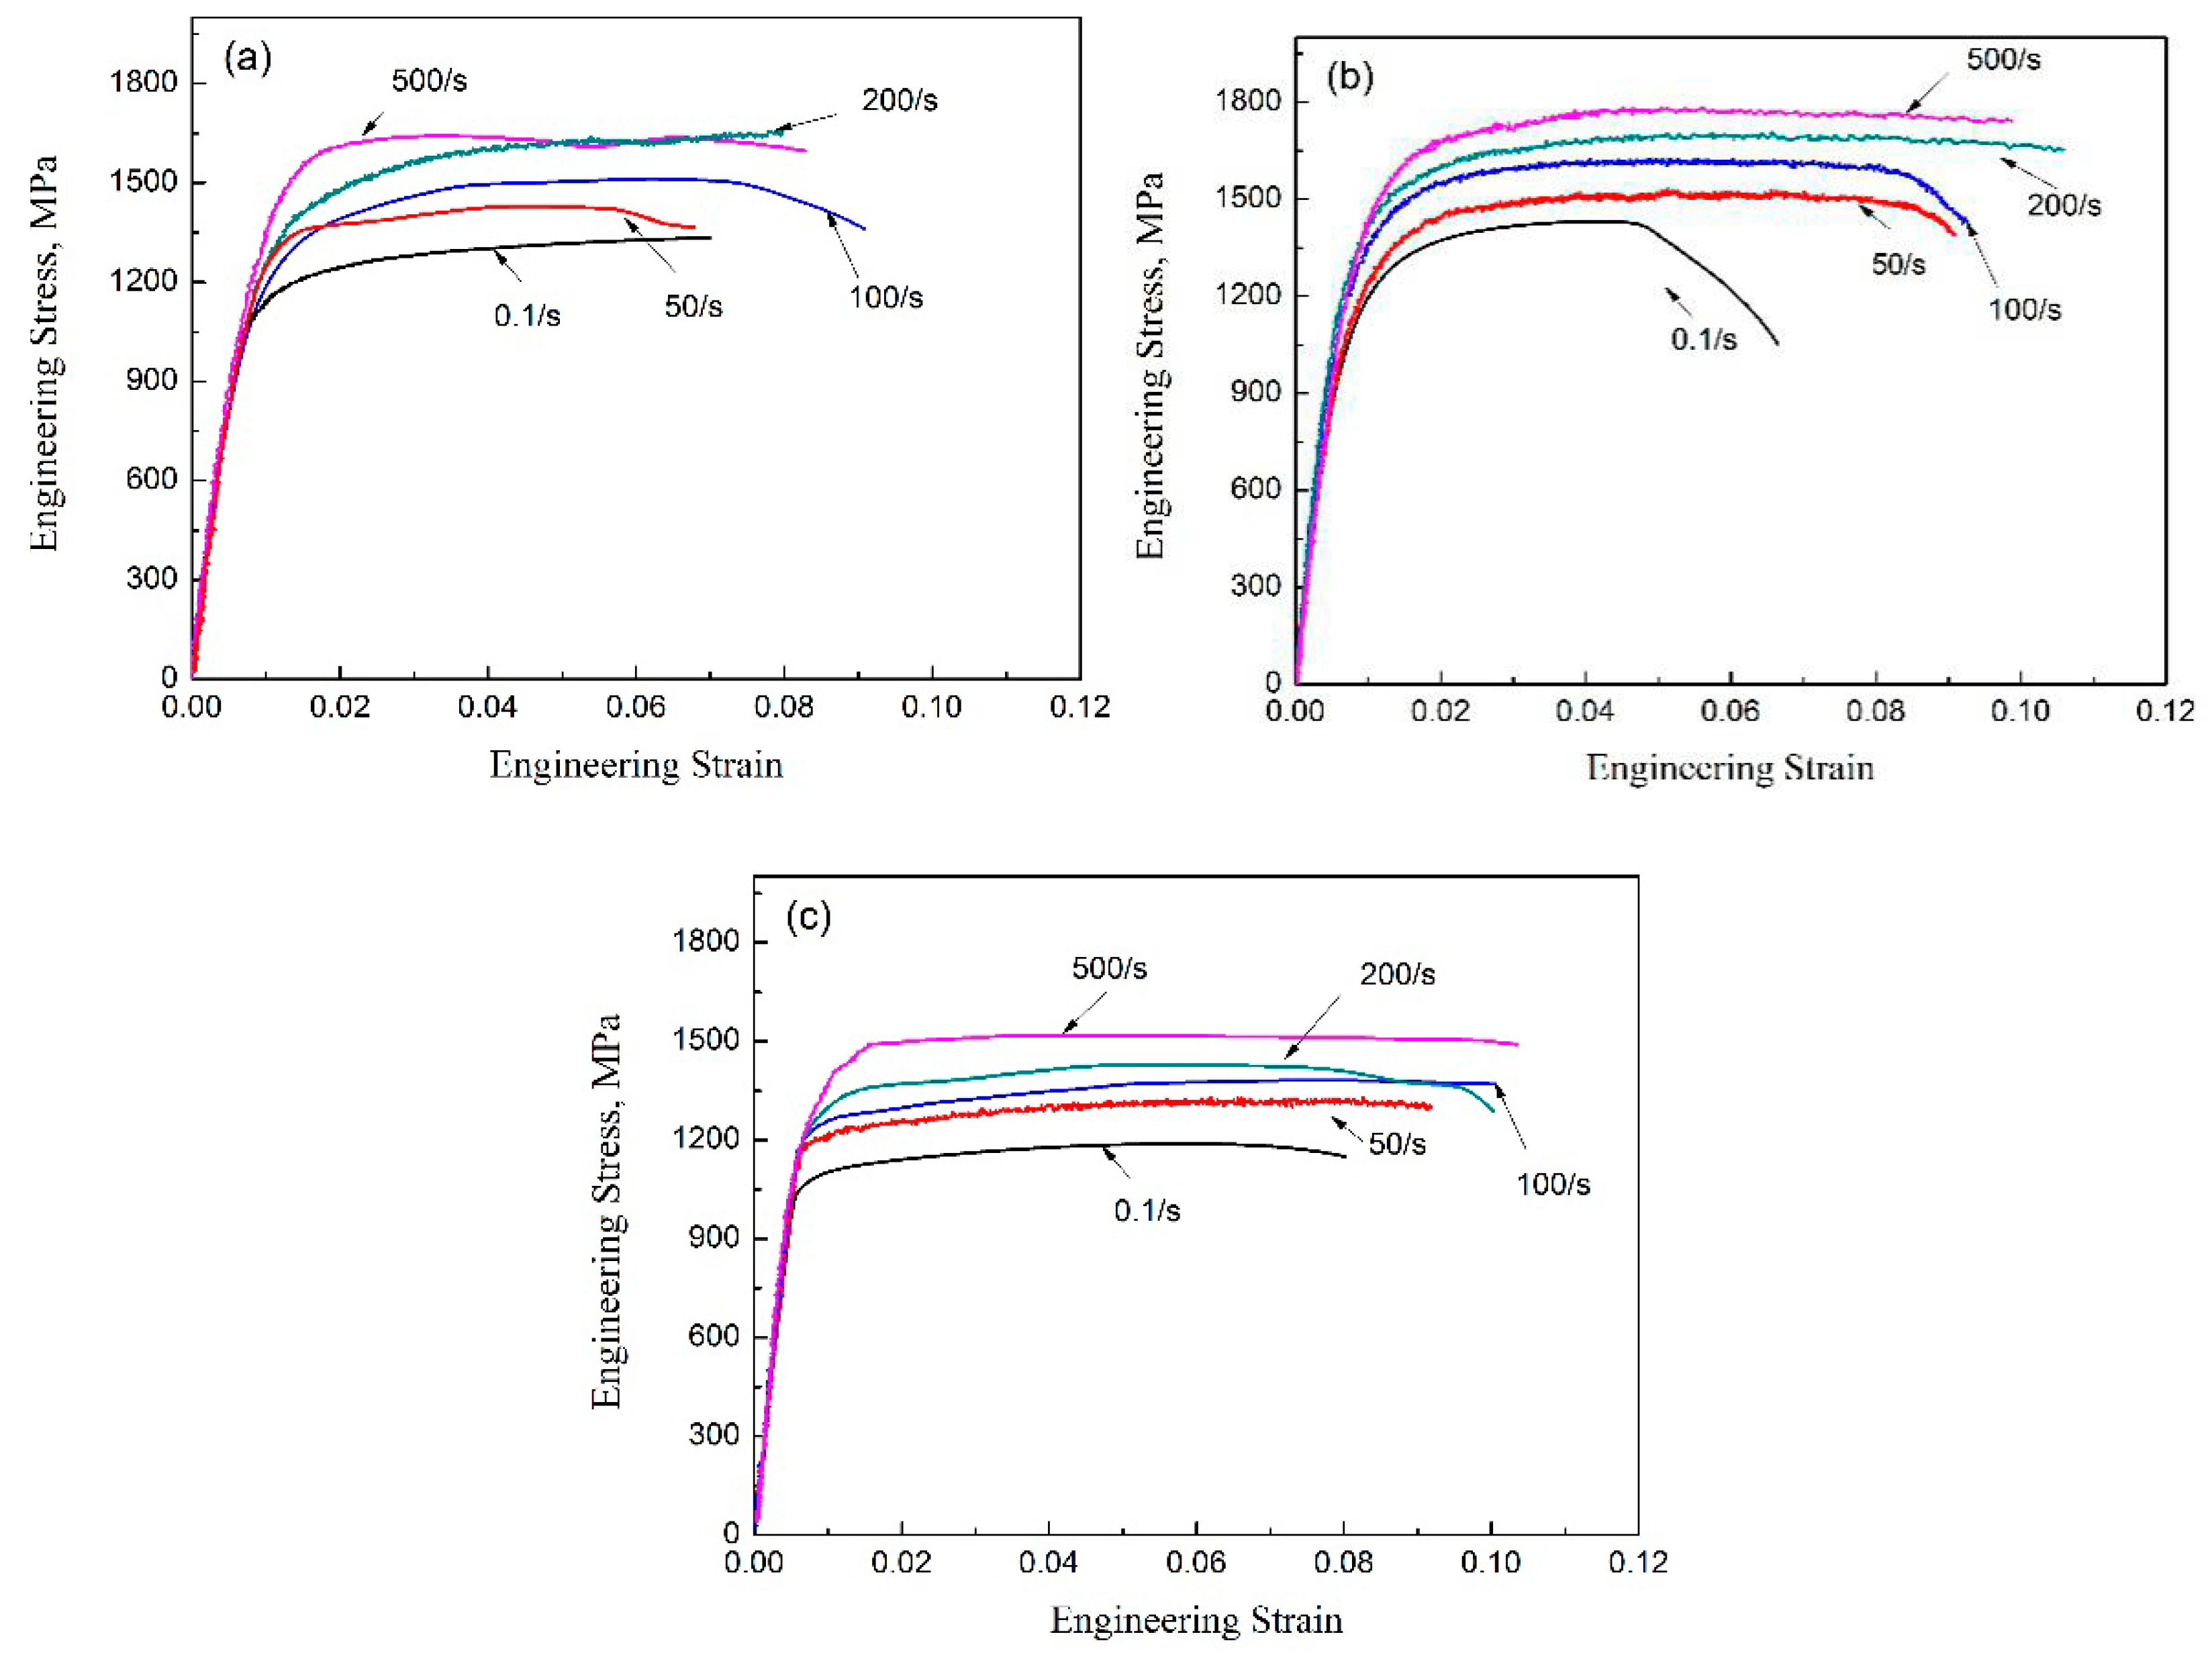
3.3. Dynamic Tensile Properties

The engineering stress-strain curves at quasistatic tension with a strain rate of 0.1 s−1 and at dynamic tension with strain rates of 50, 100, 200, and 500 s−1, respectively, are shown in Figure 9. The results indicate that the tensile strengths of both treatments were improved with an increase in the strain rate. The dynamic tensile properties of samples with different heat treatments are shown in Table 3. The ultimate tensile strength (UTS) of the B1 sample was 1312 MPa which was higher than that of the Q&T sample (1127 MPa) under the strain rate of 0.1 s−1, but the total elongation (EI) change is vice versa for these samples. The ultimate tensile strength and the total elongation of B3 sample were obviously higher than the B1 and Q&T samples. Table 3 shows that the ultimate tensile strength and elongation of three samples were all increased with an increase in strain rates, and for each strain rate, the ultimate tensile strength and elongation of the B3 sample was the highest among the three samples. The percentage increment in the ultimate tensile strength and elongation with different heat treatments as compared with the value at the strain rate of 0.1 s−1 is shown in Figure 10. The ultimate tensile strength of the B1 sample increased from 1312 MPa to 1698 MPa (by 9.5–29.4%), and the ultimate tensile strength of the B3 sample increased from 1445 MPa to 1771 MPa (by 6.6–22.7%) when the strain rate increased from 0.1 to 500 s−1. Evidently, the ultimate tensile strength of the Q&T sample was most sensitive to the tensile strain rate, and it increased from 1127 MPa to 1516 MPa (by 21.5–34.5%). At the same time, the elongation of the three samples increased with an increase in the strain rate, and increased by 4.4–35.3% and 1.0–18.8% for the B1 and B3 samples, respectively. The elongation of the Q&T sample was the most obvious, and it increased by 35.4% under a strain rate of 500 s−1.

3.4. Fractured Surface Observations

SEM images of the tensile fractured surface for different heat-treated samples under the strain rate of 500 s−1 are shown in Figure 11. Obviously, there were tear ridges and dimples in the B1 sample (Figure 11a), which showed that the crack was propagated in the form of ductile fracture. Small dimples and long tear ridges were observed in both the B3 and Q&T samples, as shown in Figure 11b,c. It can be concluded that all the samples were fractured in the ductile mode, but the B3 and Q&T sample exhibited better ductility. After a dynamic tensile test under the strain rate of 500 s−1, the volume fraction of retained austenite in the B1, B3, and Q&T samples was 0.156, 0.123, and 0.106, respectively, as shown in Table 4. The volume fraction decreased by 48.1% for the B3 sample, by 44.1% for the B1 sample, and by 34.2% for the Q&T sample, as compared with the initial volume fraction of retained austenite before the tensile test. This indicated that the transformation of retained austenite into martensite (TRIP effect) was quite different for the B3, B1, and Q&T samples during the dynamic tensile test.

4. Discussion

4.1. Relationship between Heat Treatment and Retained Austenite Characteristics

The time–temperature–transformation (TTT) curve of the investigated steel calculated by JMat-Pro 5.0 (Sente Software Ltd., Guildford, UK) is shown in Figure 12. It can be observed that for a certain period of time, the tested steel can undergo bainite transformation at a constant temperature of 300 °C. The B1 sample was isothermally transformed at 300 °C for 2400 s, the bainite transformation was incomplete, and the microstructure consisted of a large amount of the martensite and retained austenite (Figure 3a and Figure 4a). The bainite lath size of the B3 sample was smaller as compared to that of the B1 sample because the transformation of the B3 sample occurred at a lower temperature, and the bainite formed at a lower temperature becomes finer [17]. The retained austenite content of the B3 sample was reduced by 4.85% due to the refinement of the blocky retained austenite into the nanoscale bainite (Figure 3b and Figure 4b). The results of Wang et al. are consistent with this result [18]. Multistep bainite isothermal transformation was used to obtain bainite plates or laths with different sizes, and the blocky retained austenite was significantly refined. Experimental investigations have shown that such a microstructure is good for the transformation-induced plasticity (TRIP) effect during deformation [1,19,20]. Because the effect can enhance steel strength via work hardening and improve its ductility by delaying the onset of necking [1,19]. Moreover, the effect’s occurrence relies on the mechanical stability of austenite [21].
One of the most important factors governing austenite mechanical stability is the local carbon enrichment obtained after transformation [22,23,24]. Jacques [25] has demonstrated that carbon enrichment of the austenite during bainite transformation was very effective in retaining austenite. The metastable-retained austenite then progressively transforms to the more stable martensite during straining when the chemical-free energy required for this transformation reaches the critical threshold [26,27,28,29]. This transformation can bring about a large increase in the work hardening rate due to the strain and stress partitioning continuously evolving with the appearance of the hard martensite [25]. In this paper, EPMA was carried out to follow the carbon content changes accompanying the morphology change for different processes. Comparing EPMA investigations in Figure 7, the film-like austenite was the high carbon austenite, while blocky austenite was the low carbon austenite. It indicated that the carbon atoms were diffused into film-like retained austenite during the second and third steps of isothermal bainite transformation. Assuming that all alloying elements except carbon were homogeneously distributed during the slow cooling isothermal process, it is possible to estimate Ms, the temperature for both high and low carbon austenite, by the following empirical equation [30]:
M s ( ° C ) = 539 423 C 30.4 Mn 7.5 Si + 30 Al ( wt   % )  
From Equation (3), the Ms temperatures for high carbon film-like and low carbon blocky austenite of B1, B3, and Q&T processes are estimated as 123.2 °C and 198.5 °C, 42.8 °C and 129.2 °C, and 179.0 °C and 249.2 °C, respectively, which indicates that the high carbon film-like austenite should be much more stable than the low carbon blocky austenite during deformation. Therefore, considering the morphology and chemical composition, both can be concluded that the stability of retained austenite in the B3 sample was best, as compared to the B1 and Q&T samples in this study. It indicated that there is a better TRIP effect for B3 sample.

4.2. Relationship between Microstructure and Dynamical Mechanical Properties

The strength of steel primarily depends on its hard phases, such as ferrite, bainite, and martensite, and the plasticity primarily depends on the retained austenite. Retained austenite can have a TRIP effect and increase the strength and plasticity of the steel during the tensile process [31]. The stability of retained austenite is affected by the amount, morphology, and carbon content of retained austenite, and it depends on the strength of the TRIP effect [32,33]. The volume fraction of the retained austenite of B1 and B3 samples are higher compared to Q&T sample, but the volume fraction of blocky retained austenite of B1 sample is higher compared to the B3 sample. The blocky retained austenite is considered to be unstable, and it is easily transformed to brittle martensite. Considering the amount, morphology and chemical composition, the stability of retained austenite in the B3 sample was the best, as compared to the B1 and Q&T samples. Therefore, in the static tensile test, the ultimate tensile strength and elongation of the B3 sample was better as compared to the B1 and Q&T samples.
The dynamic tensile test of steel is different from that of the static tensile test and considers the strain rate hardening effect and the adiabatic softening effect [32,34,35]. During the dynamic tensile test, martensite shows an adiabatic softening effect, which can significantly increase the strength and plasticity of steel [7,36]. Martensite and bainite are also known as body-centered cubic structures. Under the dynamic tensile test, bainite exhibits a similar adiabatic softening effect. Retained austenite can produce TRIP, block crack propagation (BCP) [37], and dislocation absorption by retained austenite (DARA) [38] effects under stress, and this can improve the strength and plasticity of steel. The elongation of the B1, B3, and Q&T samples is increased by 20.6%, 12.5%, and 15.2%, respectively, when the strain rate increases from 0.1 to 100 s−1. This is attributed to the TRIP, BCP, and DARA effects of a large number of retained austenite in three samples. The adiabatic softening effect of martensite and bainite further enhances the plasticity of steel at the same time. With an increase in the strain rate, the adiabatic softening effect of martensite and bainite is stronger, and the strength and plasticity of the three samples are further improved.
The ultimate tensile strength of the B1, B3, and Q&T sample increases by 9.5–29.4%, 6.6–22.6%, and 21.5–34.5%, respectively, and thus indicates that the sensitivity of the B1 and Q&T samples is better. On the one hand, the hard phase of B1 and Q&T sample both contain martensite. On the other hand, the volume fraction of retained austenite of the Q&T sample is much lower as compared to that of the B1 and B3 samples. Therefore, it can be concluded that martensite is more sensitive to the strain rate. The B3 sample shows the best dynamic tensile properties at each strain rate. It is attributed that the small size of bainite laths or plates and a large amount of the film-like retained austenite in B3 sample can exhibit the best transformation-induced plasticity effect. The percentage increment in the elongation of the B1 sample has shown significant change when the strain rate is increased from 0.1 to 500 s−1, which may be due to a large amount of the retained austenite and martensite in the microstructure.

5. Conclusions

The carbon content distribution and the dynamic tensile properties of the conventional one-step isothermal bainite, the quenching-tempering martensite, and the newly developed three-step low-temperature nanostructured bainite were investigated by using the EPMA technique and the dynamic tensile test. Finally, the following conclusions can be drawn:
  • The three-step bainite isothermal transformation process can be used to obtain nanostructured bainite ferrite. The carbon content in the film-like retained austenite was found to be higher as compared to the blocky retained austenite.
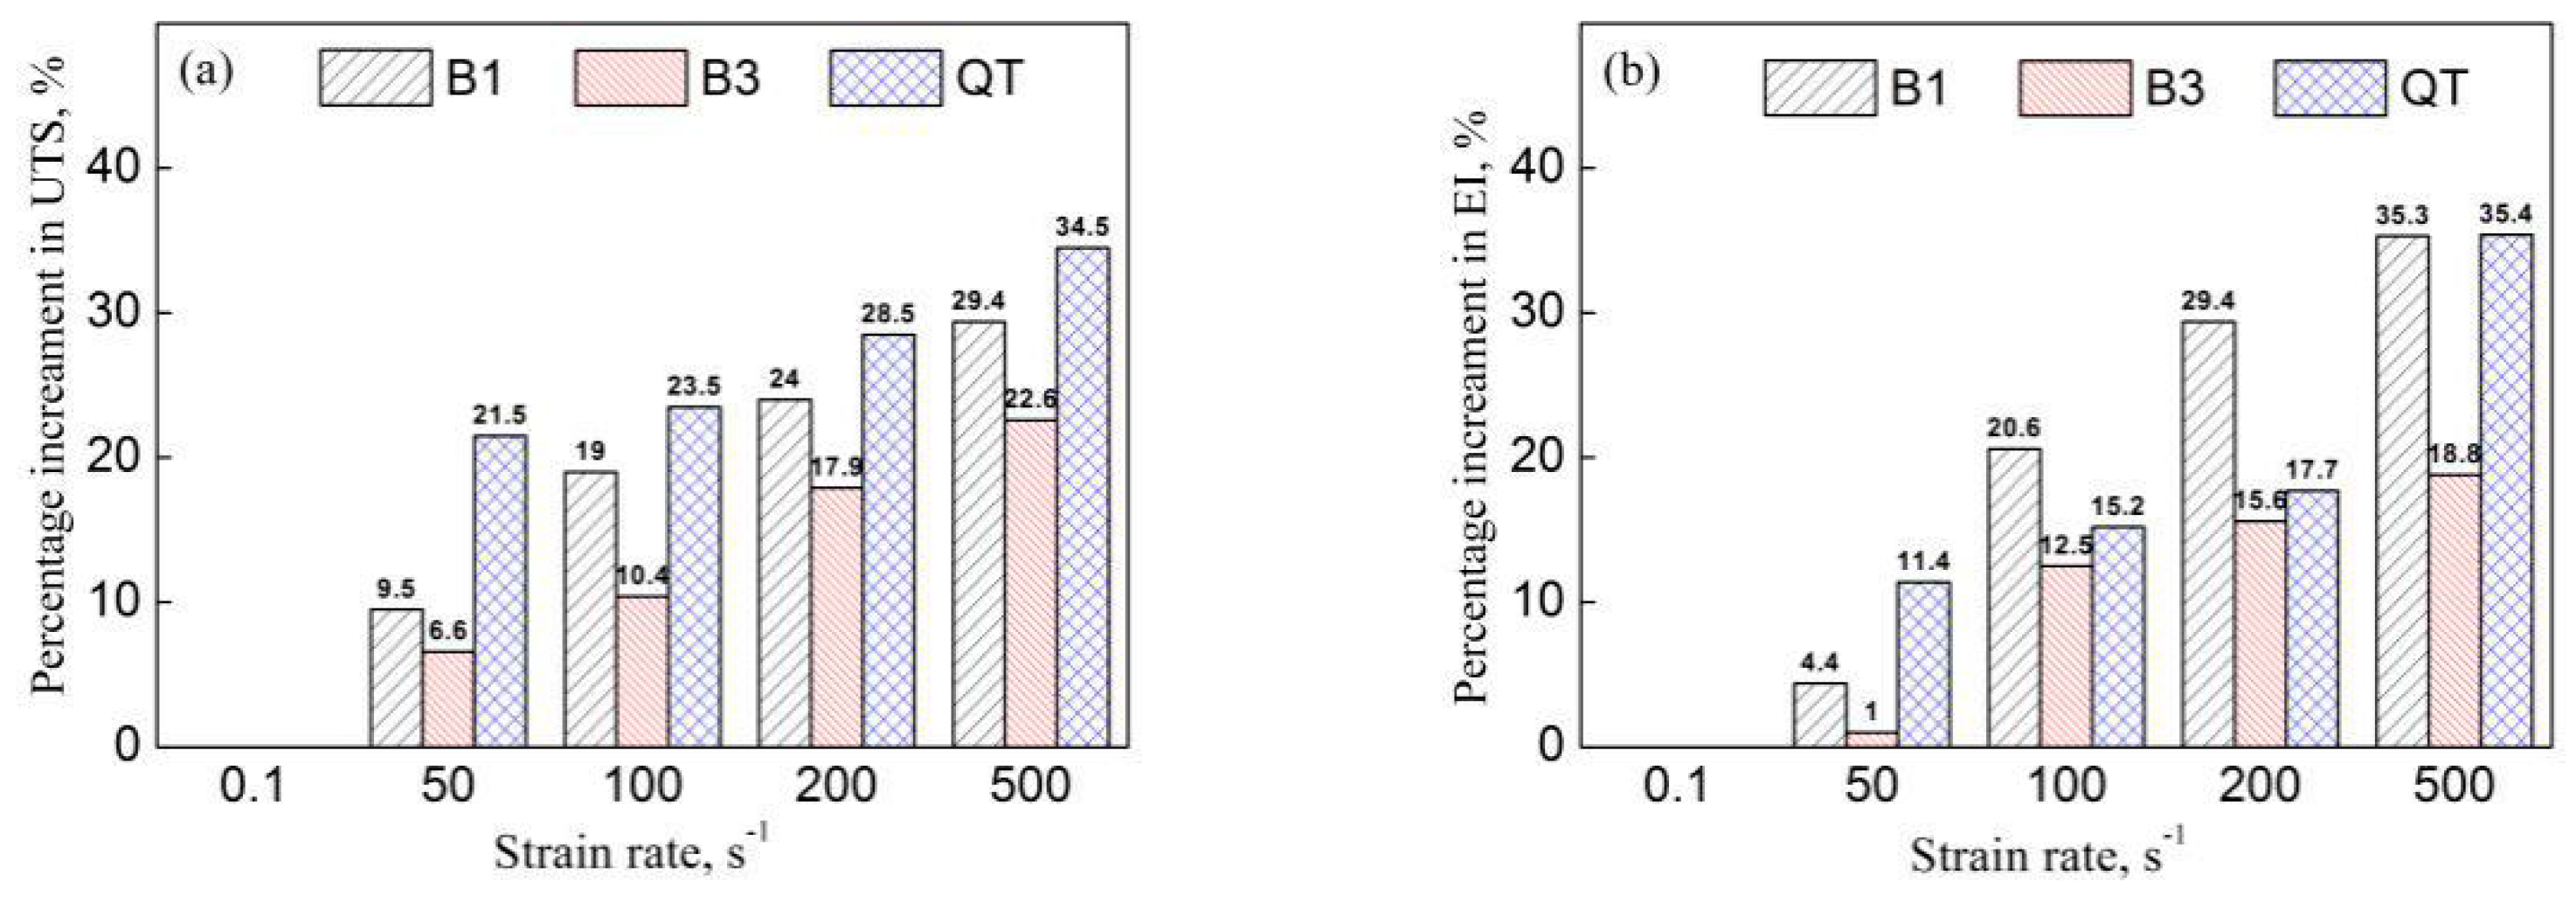
  • The ultimate tensile strength and elongation of the three samples increase with an increase in strain rates. The percentage increment in the ultimate tensile strength and elongation are highest for the Q&T sample, which indicate that the sensitivity of martensite to the strain rate is higher than the bainite.
  • The three-step (B3) sample contains a large amount of carbon-enriched film-like retained austenite, which exhibits the best dynamic tensile properties for the best transformation-induced plasticity effect.

Author Contributions

Conceptualization, W.Z. and K.W.; Methodology, C.Z.; Software, L.Z.; Validation, K.W., T.H. and W.Z.; Formal Analysis, W.Z.; Investigation, C.Z.; Resources, K.W.; Data Curation, L.Z.; Writing—Original Draft Preparation, W.Z.; Writing—Review & Editing, R.D.K.M.; Visualization, W.Z.; Supervision, K.W.; Project Administration, K.W.; Funding Acquisition, K.W.

Funding

This research was funded by [the National Natural Science Foundation of China] grant number [U1532268], [the Nature Science Foundation of Hubei Province] grant number [016CFA004] and the 111 Project.

Conflicts of Interest

The authors declare no conflict of interest.

References

  1. Zackay, V.F.; Parker, E.R.; Fahr, D.; Busch, R.A. The enhancement of ductility in high-strength steels. ASM Trans. Quart. 1967, 60, 252–259. [Google Scholar]
  2. Jacques, P.; Delannay, F.; Cornet, X.; Harlet, P.; Ladriere, J. Enhancement of the mechanical properties of a low-carbon, low-silicon steel by formation of a multiphased microstructure containing retained austenite. Metall. Mater. Trans. A 1998, 29, 2383–2393. [Google Scholar] [CrossRef]
  3. Sugimoto, K. Effects of retained austenite parameters on warm stretch-flangeability in TRIP-aided dual-phase sheet steels. ISIJ Int. 2007, 39, 56–63. [Google Scholar] [CrossRef]
  4. Zaefferer, S.; Ohlert, J.; Bleck, W. A study of microstructure, transformation mechanisms and correlation between microstructure and mechanical properties of a low alloyed TRIP steel. Acta Mater. 2004, 52, 2765–2778. [Google Scholar] [CrossRef]
  5. Wei, X.C.; Li, L.; Fu, R.Y.; Shi, W. On the tensile mechanical property of Si-Mn TRIP steels at high strain rate. Acta Metall. Sin. 2002, 15, 285–294. [Google Scholar]
  6. Wang, Y. Mechanical of Ductility Enhancement of an Advanced High Strength-Ductility Q-P-T Steel and Its Dynamic Mechanical Properties. Ph.D. Thesis, Shanghai Jiao Tong University, Shanghai, China, 2012. [Google Scholar]
  7. Hao, Q.G.; Qin, S.W.; Liu, Y.; Zuo, X.W.; Chen, N.L.; Huang, W.; Rong, Y.H. Effect of retained austenite on the dynamic tensile behavior of a novel quenching-partitioning-tempering martensitic steel. Mater. Sci. Eng. A 2016, 662, 16–25. [Google Scholar] [CrossRef]
  8. Garcia-Mateo, C.; Caballero, F.G.; Bhadeshia, H.K.D.H. Development of hard bainite. ISIJ Int. 2003, 43, 1238–1243. [Google Scholar] [CrossRef]
  9. Caballero, F.G.; Bhadeshia, H.K.D.H. Very strong bainite. Curr. Opin. Solid State Mater. Sci. 2004, 8, 251–257. [Google Scholar] [CrossRef] [Green Version]
  10. Bhadeshia, H.K.D.H. High performance bainitic steels. Mater. Sci. Forum 2005, 500–501, 63–74. [Google Scholar] [CrossRef]
  11. Garcia-Mateo, C.; Caballero, F.G. The role of retained austenite on tensile properties of steels with bainitic microstructures. Mater. Trans. 2005, 46, 1839–1846. [Google Scholar] [CrossRef]
  12. Bhadeshia, H.K.D.H. Nanostructured bainite. Proc. R. Soc. A 2010, 466, 3–18. [Google Scholar] [CrossRef] [Green Version]
  13. Wang, C.Y.; Shi, J.; Cao, W.Q.; Dong, H. Characterization of microstructure obtained by quenching and partitioning process in low alloy martensitic steel. Mater. Sci. Eng. A 2010, 527, 3442–3449. [Google Scholar] [CrossRef]
  14. Pereloma, E.V.; Timokhina, I.B.; Miller, M.K.; Hodgson, P.D. Three-dimensional atom probe analysis of solute distribution in thermo-mechanically processed TRIP steels. Acta Mater. 2007, 55, 2587–2598. [Google Scholar] [CrossRef]
  15. Enomoto, M. Influence of solute drag on the growth of proeutectoid ferrite in Fe-C-Mn alloy. Acta Mater. 1999, 47, 3533–3540. [Google Scholar] [CrossRef]
  16. Qiu, C.; Zurob, H.S.; Hutchinson, C.R. The coupled solute drag effect during ferrite growth in Fe-C-Mn-Si alloys using controlled decarburization. Acta Mater. 2015, 100, 333–343. [Google Scholar] [CrossRef]
  17. Hase, K.; Garcia-Mateo, C.; Bhadeshia, H.K.D.H. Bimodal size-distribution of bainite plates. Mater. Sci. Eng. A 2006, 438, 145–148. [Google Scholar] [CrossRef] [Green Version]
  18. Wang, X.L.; Wu, K.M.; Hu, F.; Yu, L.; Wan, X.L. Multi-step isothermal bainitic transformation in medium-carbon steel. Scr. Mater. 2014, 74, 56–59. [Google Scholar] [CrossRef]
  19. Jacques, P.J.; Furnémont, Q.; Lani, F.; Pardoen, T.; Delannay, F. Multiscale mechanics of TRIP-assisted multiphase steels: I. characterization and mechanical testing. Acta Mater. 2007, 55, 3681–3693. [Google Scholar] [CrossRef]
  20. Seol, J.B.; Jung, J.E.; Jang, Y.W.; Park, C.G. Influence of carbon content on the microstructure, martensitic transformation and mechanical properties in austenite/ε-martensite dual-phase Fe-Mn-C steels. Acta Mater. 2013, 61, 558–578. [Google Scholar] [CrossRef]
  21. Wen, C.; Marius, G.; Pedro, E.J.; Rivera-Diaz-del-Castillo, P.E.J. Stability of retained austenite in martensitic high carbon steels. Part II: Mechanical stability. Mater. Sci. Eng. A 2018, 711, 696–703. [Google Scholar]
  22. Muránsky, O.; Horňak, P.; Lukáš, P.; Zrník, J.; Šittner, P. Investigation of Retained Austenite Stability in Mn-Si TRIP Steel in Tensile Deformation Condition. J. Achiev. Mater. Manuf. Eng. 2006, 14, 26–30. [Google Scholar]
  23. Tang, Z.Y.; Huang, J.N.; Ding, H.; Cai, Z.H.; Misra, R.D.K. Austenite stability and mechanical properties of a low-alloyed ECAPed TRIP-aided steel. Mater. Sci. Eng. A 2018, 724, 95–102. [Google Scholar] [CrossRef]
  24. Jimenez-Melero, E.; van Dijk, N.H.; Zhao, L.; Sietsma, J.; Offerman, S.E.; Wright, J.P.; van der Zwaag, S. Characterization of individual retained austenite grains and their stability in low-alloyed TRIP steels. Acta Mater. 2007, 55, 6713–6723. [Google Scholar] [CrossRef]
  25. Jacques, P.J. Transformation-induced plasticity for high strength formable steels. Curr. Opin. Solid State Mater. Sci. 2004, 8, 259–265. [Google Scholar] [CrossRef]
  26. Bhadeshia, H.K.D.H. Driving force for martensitic transformation in steels. Met. Sci. 1981, 15, 175–177. [Google Scholar] [CrossRef]
  27. Bhadeshia, H.K.D.H. Steels for bearings. Prog. Mater. Sci. 2012, 57, 268–435. [Google Scholar] [CrossRef]
  28. Sherby, O.D.; Wadsworth, J.; Lesuer, D.R.; Syn, C.K. Revisiting the structure of martensite in iron-carbon steels. Mater. Trans. 2008, 49, 2016–2027. [Google Scholar] [CrossRef]
  29. Ryu, J.H.; Kim, D.I.; Kim, H.S.; Bhadeshia, H.K.D.H.; Suh, D.W. Strain partitioning and mechanical stability of retained austenite. Scr. Mater. 2010, 63, 297–299. [Google Scholar] [CrossRef]
  30. Mahieu, J.; Maki, J.; De Cooman, B.C.; Claessens, S. Phase transformation and mechanical properties of Si-free CMnAl transformation-induced plasticity-aided steel. Metall. Mater. Trans. A 2002, 33, 2573–2580. [Google Scholar] [CrossRef]
  31. Tomota, Y.; Tokuda, H.; Adachi, Y.; Wakita, M.; Minakawa, N.; Moriai, A.; Morii, Y. Tensile behavior of TRIP-aided multi-phase steels studied by in situ neutron diffraction. Acta Mater. 2004, 52, 5737–5745. [Google Scholar] [CrossRef]
  32. Avishan, B.; Garcia-Mateo, C.; Morales-Rivas, L.; Yazdania, S.; Caballero, F.G. Strengthening and mechanical stability mechanisms in nanostructured bainite. J. Mater. Sci. 2013, 48, 6121–6132. [Google Scholar] [CrossRef] [Green Version]
  33. Shen, Y.F.; Qiu, L.N.; Sun, X.; Zuo, L.; Liaw, P.K.; Raabe, D. Effects of retained austenite volume fraction, morphology, and carbon content on strength and ductility of nanostructured TRIP-assisted steels. Mater. Sci. Eng. A 2015, 636, 551–564. [Google Scholar] [CrossRef] [Green Version]
  34. Slycken, J.V.; Verleysen, P.; Degrieck, J.; Samek, L.; Cooman, B.C.D. High-strain-rate behavior of low-alloy multiphase aluminum-and silicon-based transformation-induced plasticity steels. Metall. Mater. Trans. A 2006, 37, 1527–1539. [Google Scholar] [CrossRef]
  35. Oliver, S.; Jones, T.B.; Fourlaris, G. Dual phase versus TRIP strip steels: Microstructural changes as a consequence of quasi-static and dynamic tensile testing. Mater. Charact. 2007, 58, 390–400. [Google Scholar] [CrossRef]
  36. He, Y.L.; Lin, Y.T.; He, Z.P.; Zhu, N.Q.; Li, L. Tensile Mechanical Behavior of Cold Rolled Si-Mn Steel under Different Strain Rates. J. Iron Steel Res. Int. 2011, s1, 262–265. [Google Scholar]
  37. Webster, D. Increasing the toughness of the martensitic stainless steel AFC 77 by control of retained austenite content, ausforming and strain aging (Retained austenite content control, strain aging and ausforming to improve toughness of high strength martensitic stainless steel without strength loss). ASM Trans. Quart. 1968, 61, 816–828. [Google Scholar]
  38. Zhang, K.; Zhang, M.; Guo, Z.; Chen, N.; Rong, Y. A new effect of retained austenite on ductility enhancement in high-strength quenching-partitioning-tempering martensitic steel. Mater. Sci. Eng. A 2011, 528, 8486–8491. [Google Scholar] [CrossRef]
Figure 1. The schematic illustration of different heat treatments.
Metals 08 00728 g001
Figure 2. (a) Schematic illustration of heat treatment and the dynamic tensile test sample and (b) specimens attached with strain gages.
Metals 08 00728 g002
Figure 3. Scanning electron microscopy (SEM) micrographs of different heat treatment samples: (a) B1; (b) B3; (c) Q&T.
Metals 08 00728 g003
Figure 4. Transmission EM (TEM) micrographs of different heat treatment samples: (a) B1; (b) B3; (c) Q&T.
Metals 08 00728 g004aMetals 08 00728 g004b
Figure 5. Mapping of carbon content of different heat treatment samples: (a) B1; (b) B3; (c) Q&T.
Metals 08 00728 g005
Figure 6. Line scanning of carbon element with different heat treatment samples: (a) B1; (b) B3; (c) Q&T.
Metals 08 00728 g006
Figure 7. Carbon content of blocky and film-like retained austenite in the different heat treatment samples.
Metals 08 00728 g007
Figure 8. Examples showing how the carbon content of film-like and blocky retained austenite is determined: (a) and (d) for B1; (b) and (e) for B3; (c) and (f) for Q&T.
Metals 08 00728 g008
Figure 9. Engineering stress-strain curves of the quasi-static and the dynamic tensile tests of (a) B3, (b) B3, and (c) Q&T treatment samples.
Metals 08 00728 g009
Figure 10. The percentage increment in (a) the ultimate tensile strength (UTS) and (b) total elongation (EI) with different heat treatments compared to the value under 0.1 s−1 strain rate.
Metals 08 00728 g010
Figure 11. SEM images of tensile fractured surfaces of different heat treatment samples under the strain rate of 500 s−1: (a) B1; (b) B3; (c) Q&T.
Metals 08 00728 g011
Figure 12. Time–temperature–transformation (TTT) curve of the investigated steel.
Metals 08 00728 g012
Table 1. Chemical composition of the investigated steel.
CSiMnCrNiMoFe
wt %0.580.310.840.861.770.21balance
at %2.680.610.830.921.670.12
Table 2. The measured volume fraction of the retained austenite/bainite/martensite before the tensile test, thickness of bainite/martensite, and hardness measurements for different heat treatments.
SamplesVolume Fraction of Retained AusteniteVolume Fraction of BainiteVolume Fraction of MartensiteThickness of Bainite/Martensite, nmHardness, HV1
B10.2790.1530.568160–600554 ± 10
B30.2370.763-50–100615 ± 5
Q&T0.161-0.839150–900496 ± 6
Table 3. Dynamic tensile properties of samples with different heat treatments.
Strain Rate, s−1B1B3Q&T
UTS, MPaEI, %UTS × EI, MPa·%UTS, MPaEI, %UTS × EI, MPa·%UTS, MPaEI, %UTS × EI, MPa·%
0.11312 ± 56.8 ± 0.189221445 ± 59.6 ± 0.113,8721127 ± 67.9 ± 0.38903
501436 ± 37.1 ± 0.110,1961540 ± 39.7 ± 0.214,9381369 ± 48.8 ± 0.212,047
1001561 ± 28.2 ± 0.312,8001594 ± 610.7 ± 0.217,1411392 ± 39.1 ± 0.312,667
2001627 ± 68.8 ± 0.314,3181704 ± 711.1 ± 0.118,9141448 ± 69.3 ± 0.313,466
5001698 ± 89.2 ± 0.215,6221771 ± 611.4 ± 0.320,1891516 ± 410.7 ± 0.116,221
Table 4. The measured volume fraction of the retained austenite before and after high-speed tensile test under the strain rate of 500 s−1.
B1B3Q&T
Before Tensile TestAfter Tensile Test Before Tensile TestAfter Tensile TestBefore Tensile TestAfter Tensile Test
0.2790.1560.2370.1230.1610.106

