Article

Local Fatigue Strength Evaluation of Shot Peened 40Cr Notched Steel

1
Key Laboratory of Automobile Materials, School of Materials Science and Engineering, Jilin University, Changchun 130025, China
2
School of Mechanical and Aerospace Engineering, Jilin University, Changchun 130025, China
*
Author to whom correspondence should be addressed.
Metals 2018, 8(9), 681; https://doi.org/10.3390/met8090681
Submission received: 30 July 2018 / Revised: 8 August 2018 / Accepted: 16 August 2018 / Published: 29 August 2018
(This article belongs to the Special Issue Fatigue Design and Defects in Metals and Alloys)

Abstract

:
Fatigue life prediction for the notched components is an essential step within the design process of machines. Fatigue strength and life prediction of 40Cr notched steel before and after shot peening were studied. Fatigue fracture of specimens treated by three shot peening intensity parameters was discussed. The life prediction considering residual stress, work hardening and surface roughness caused by shot peening was analyzed. The results indicated that fatigue strength was obviously improved after shot peening and the improvement effect was gradually enhanced with the increase of shot peening intensity. The predicted values based on Rz coefficient showed a good correspondence with the experimental data.

1. Introduction

The assessment of fatigue strength is an important step in the design of engineering structures. Experimental design to determine the S-N curves for different loads or different notched components will take a great deal of time and resources. Meanwhile, most of the existing fatigue assessments are limited to specific loading conditions and material properties change [1,2]. Therefore, it is difficult to apply original evaluation methods on materials after surface strengthening (such as shot peening). Shot peening technology can improve surface integrity of metal materials (surface roughness, residual stress, hardness, microstructure, etc.). The increase of surface roughness or even surface cracking caused by shot peening will seriously reduce the fatigue strength and life of materials [3,4]. However, surface residual compressive stress and surface hardening can suppress the initiation and extension of fatigue cracks, and these effects are very useful to prevent or delay component failure [5,6,7]. Although shot peening is considered as an effective means of significantly improving fatigue strength of materials, the law of the effect of shot peening on fatigue performance is still worth studying.
Eichlseder [8] introduced a method based on linear elastic finite element calculations of stress gradients for fatigue life assessment of the notched components. Some influencing factors of local fatigue limit of the notched fatigue specimen were analyzed. For example, as to some notched components, a certain degree of surface plastic deformation will occur during fatigue failure process. The plastic deformation zone is affected by stress gradient of the notch (see Figure 1). The Eichlseder’s approach has been applied on the shot peening notched specimens by Bagherifard and Olmi et al. [9,10,11,12]. Combined with the effect of shot peening on the surface integrity of materials, the local fatigue limit prediction method considering the effects of stress gradient, residual stress, work hardening and surface roughness is established.
Yield strength, tensile strength, plasticity and toughness of the quenched and tempered 40Cr steel will be greatly improved after quenching and tempering. Therefore, it is often used to produce mechanical parts withstanding medium-load [13,14,15]. However, fatigue life of these parts is generally low under certain complex working conditions. In order to prolong the service life, surfaces of these parts usually need to be strengthened [16,17].
In this study, shot peening as a surface strengthening method was adopted to treat 40Cr steel. Fatigue fracture mechanism and life prediction method of the specimens treated by three shot peening intensity parameters were discussed.

2. Experimental Procedures

40Cr steel (according to Chinese nomenclature), after oil quenching at 840 °C (25 min) and tempering at 600 °C (2 h), was used in the present study. Its chemical composition (in wt.%) and mechanical properties are listed in Table 1 and Table 2, respectively. Microstructure of 40Cr was observed by a Zeiss Scope Al type of optical microscope. As shown in Figure 2, the microstructure of quenched and tempered 40Cr is mainly tempering sorbite.
The geometrical shape and dimension of smooth and notched tensile fatigue specimen (the notch radius is 3 mm) are shown in Figure 3 and Figure 4, respectively. Figure 5 presents the geometrical characteristics of smooth rotating bending fatigue specimen and its diameter is 8 mm.
The notched fatigue specimen was treated by a pneumatic shot blasting machine using the parameters listed in Table 3. The shot peening process was performed with spray angle of 90° and coverage of 100%.
Fatigue experiments of the non-peening and shot peening specimens were carried out on a high-frequency fatigue testing machine at room temperature. Figure 6 shows the fixture with fatigue specimen. Tension-tension cyclic loading with constant amplitude was applied on notched fatigue specimens (Figure 4) under stress ratio (R) of 0.1 and smooth fatigue specimens (Figure 3) under stress ratio (R) of −1. Four-point bending fatigue test was carried out for smooth specimens (Figure 5) under stress ratio (R) of −1. The test frequency is 140 Hz. All the tests proceeded until failure or at least 2 × 10⁶ cycles (whichever arrived first).
A Carl Zeiss EVO-18 type of scanning electron microscope (SEM, Carl Zeiss, Jena, Germany) was used to examine the changes in the cross sections of shot peening specimens and the fatigue fracture morphology. X-ray diffraction (XRD) patterns of specimens were obtained by using a D/max 2500 pc X-ray diffractometer (Science Corporation, Tokyo, Japan). Then, the XRD linear analysis was adopted to get the full width at half maximum of diffraction peak (FWHM), which is assumed as an index of work hardening of materials. The surface roughness of shot peening specimens was measured by an OLS3000 laser confocal microscope (Olympus Corporation, Tokyo, Japan). Five different locations on the specimen surface were detected to obtain the average value. Residual stress after shot peening was tested by a STRESS X3000 X-ray tester (Stresstech, Vaajakoski, Finland). The residual compressive stress was measured along the depth of shot peening specimens using the sin2Ψ method with Cr-Kα radiation on the (211) plane, scanning step of 0.1°, Ψ angles of 0.0° and 45°, and stress constant K of −318 MPa/(°). The electrolytic polishing liquid was a mixed solution of HCl and HNO3 with the ratio of 3:1.
In addition, the finite element software ABAQUS (6.13.1, Dassault SIMULIA, Providence, RI, USA) was used to simulate the stress field near the notch under nominal stress of 100 MPa. The model contained 61,100 nodes and 12,870 elements. The element type adopted was C3D20R. The Young modulus is 210 GPa, and the Possion ratio is 0.3. Using the simulation results, the relative stress gradient of notched fatigue specimen can be calculated. Stress concentration factor was obtained as Equation (1):
K t = σ m a x σ m
where σmax is the local stress at the notch and σm is the nominal stress applied to the specimen. For the notched specimens, the stress concentration factor (Kt) is 2.88.

3. Results and Discussion

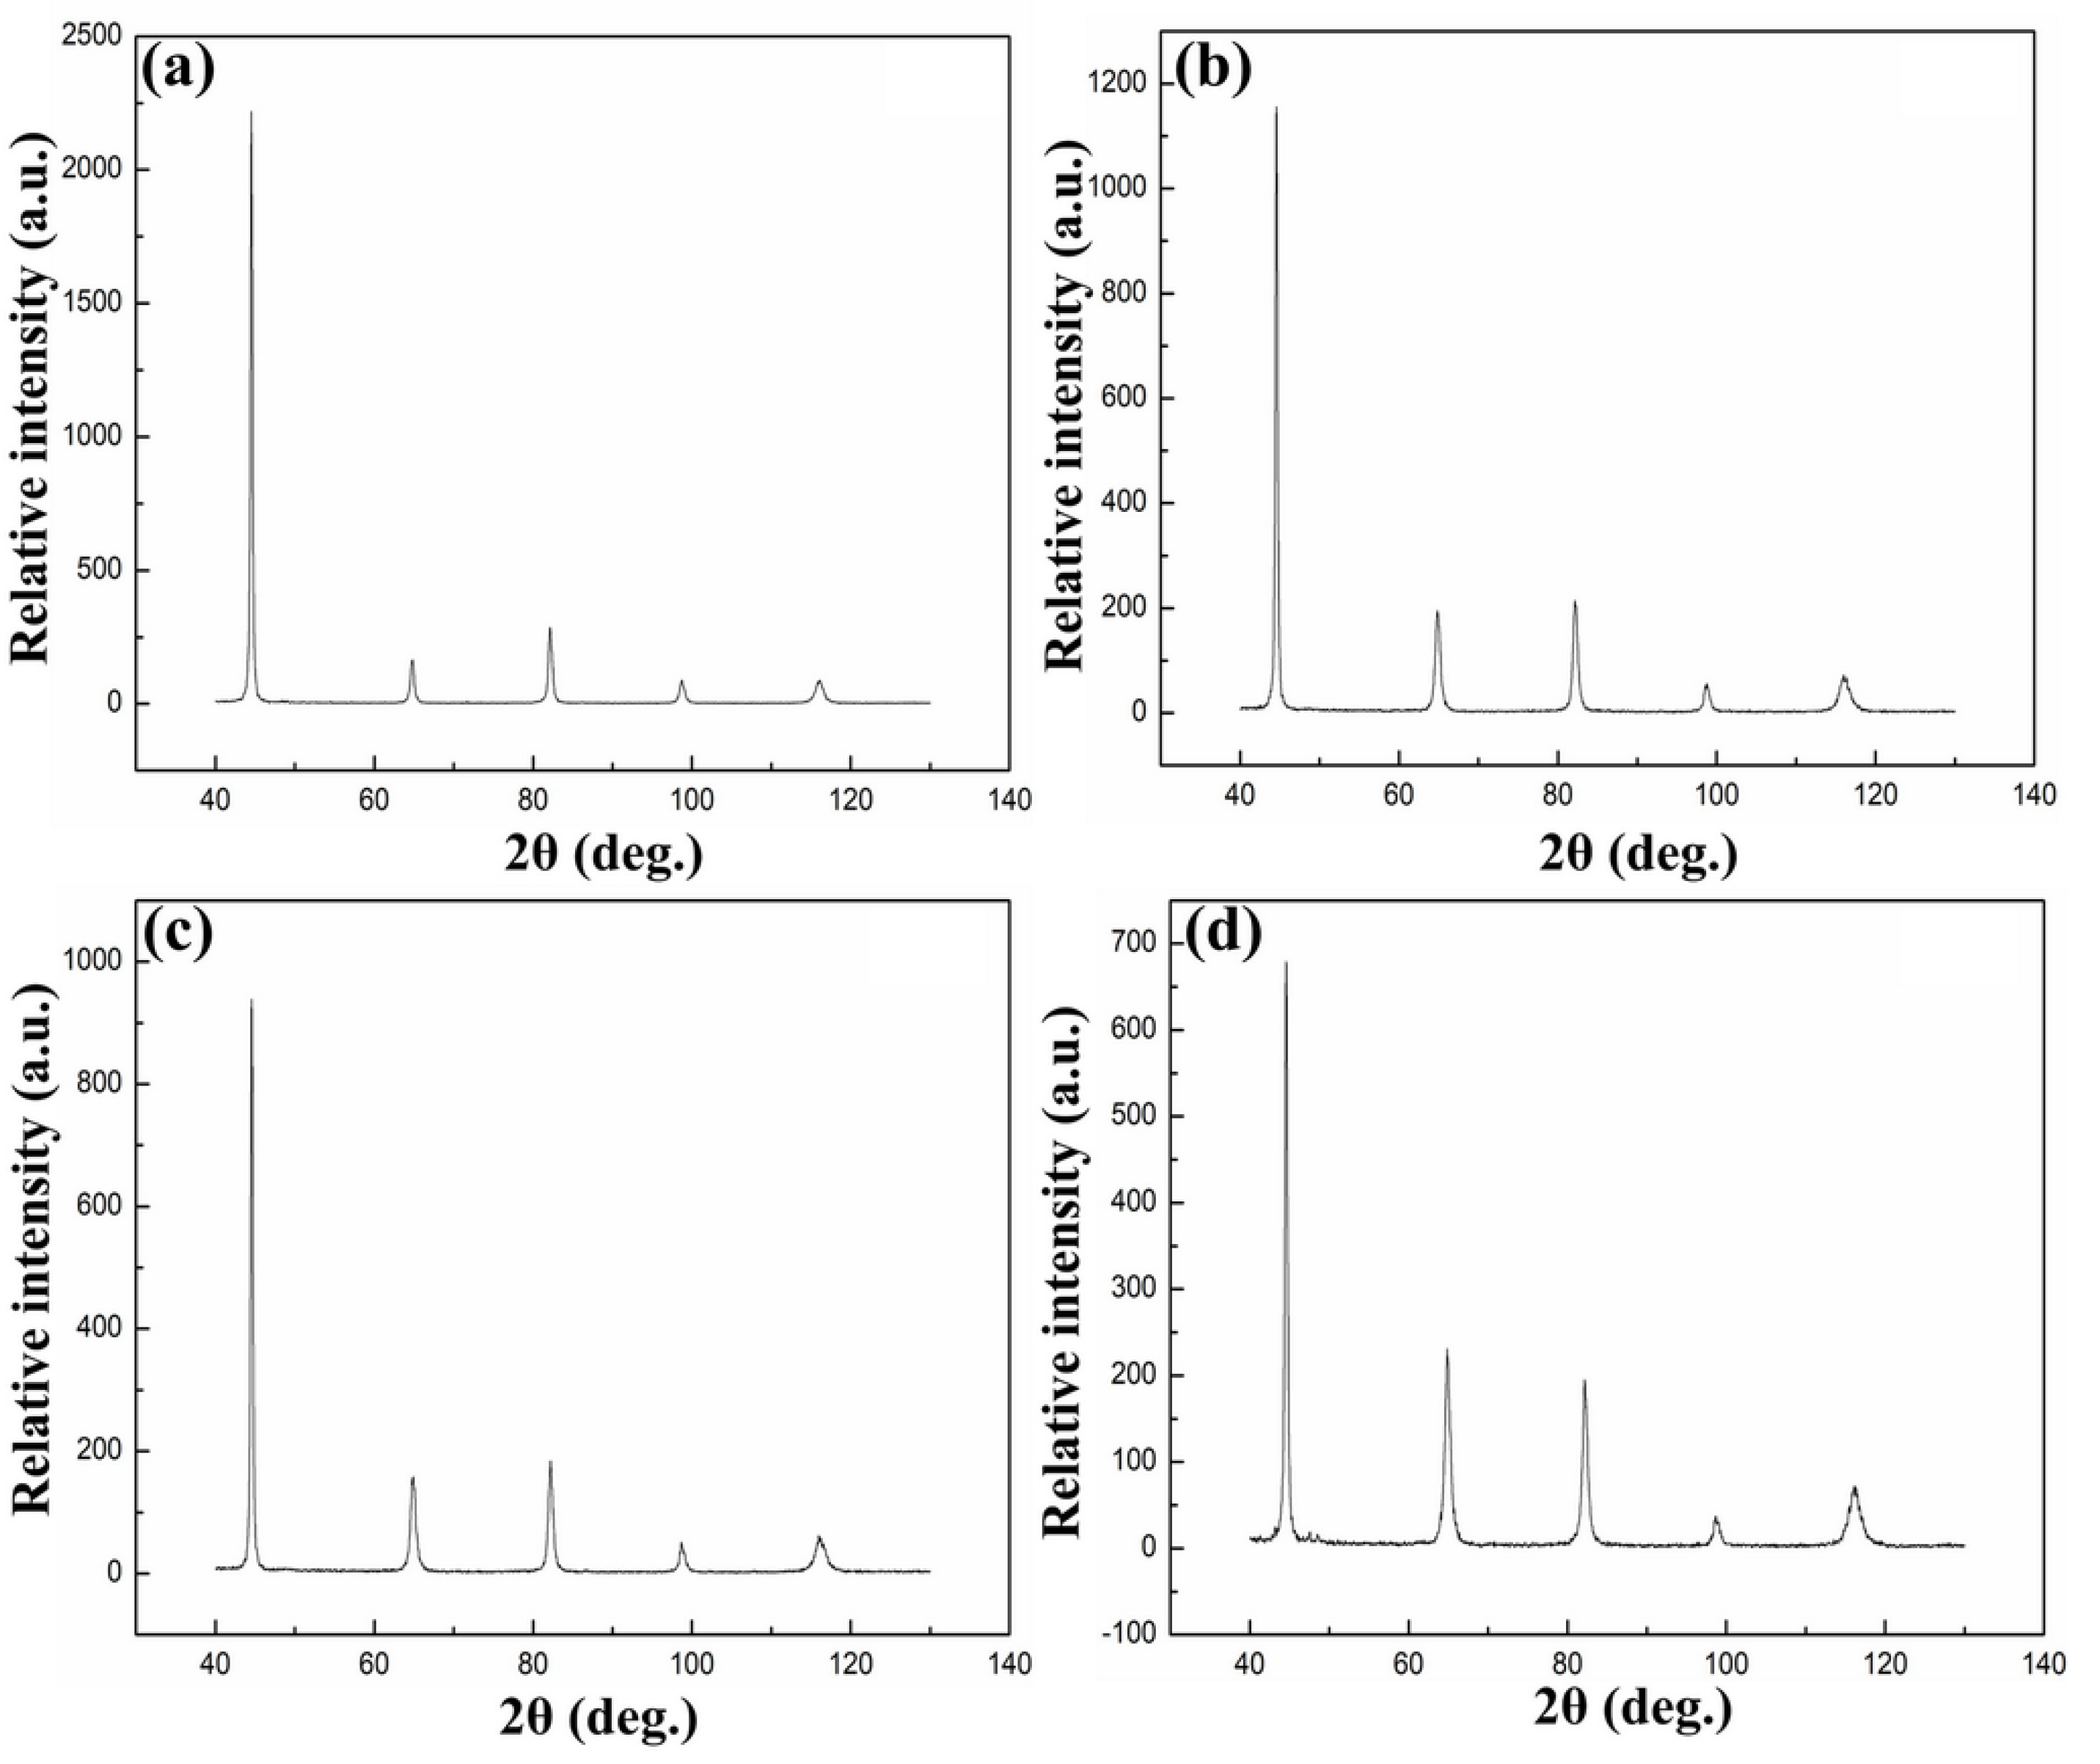
3.1. Fatigue Properties

3.1.1. Effect of Shot Peening on Fatigue Strength

High-cycle tension-tension fatigue tests were performed following the staircase procedure. Fifteen specimens and four stress levels were used for each parameter in fatigue tests, and the staircase stress was 10 MPa. Fatigue limits were calculated by nominal stress. Then, these loads were converted into local stresses at the root of the notch. The local fatigue strength of non-peening (NP), SP1, SP2 and SP3 specimens is 625 MPa, 714 MPa, 740 MPa and 763 MPa, respectively, corresponding to 2 million cycles. Figure 7 presents S-N curves of notched specimen characterized by nominal stress under high stress. Clearly, fatigue strength was obviously improved after shot peening. Meanwhile, the improvement effect was enhanced with the increase of shot peening intensity (see Figure 8). The improve of fatigue strength of shot peening specimens is mainly caused by the work-hardening and residual compressive stress generated by shot peening.
Figure 9 shows the cross-sectional SEM observation of shot peening specimens. From the overall view, a distinct darker region is easily recognized near the top surface. This is because shot peening produces work hardening effect on the surface of specimen. Plastic deformation occurs on the surface, and the density of tissue is improved. The refinement of microstructure in surface hinders crack propagation and increases fatigue life. The thickness of work hardening layer corresponding to SP1, SP2 and SP3 specimen is 80 μm, 140 μm and 200 μm, respectively. The depth of work hardening layer increases with the increase of shot peening intensity.
It is known that residual compressive stress can reduce the crack growth rate [18,19,20]. Figure 10 shows the distribution of residual stress along the depth of specimens under shot peening intensity of 0.2 mmA, 0.3 mmA and 0.4 mmA. As can be observed, the residual compressive stress value in the topmost surface under different shot peening parameters is −622 MPa, −674 MPa and −658 MPa, respectively. The maximum residual compressive stress is found to be approximately 50 μm below the treated surface. With the increase of shot-peening intensity, the maximum residual stress value gradually increases.
In addition, surface roughness is also a factor influencing fatigue strength. Figure 11 shows the surface morphologies obtained under different shot peening parameters. With the increase of shot peening intensity, the surface morphology is gradually worsened. Therefore, the increasing effect of fatigue strength gets slower.

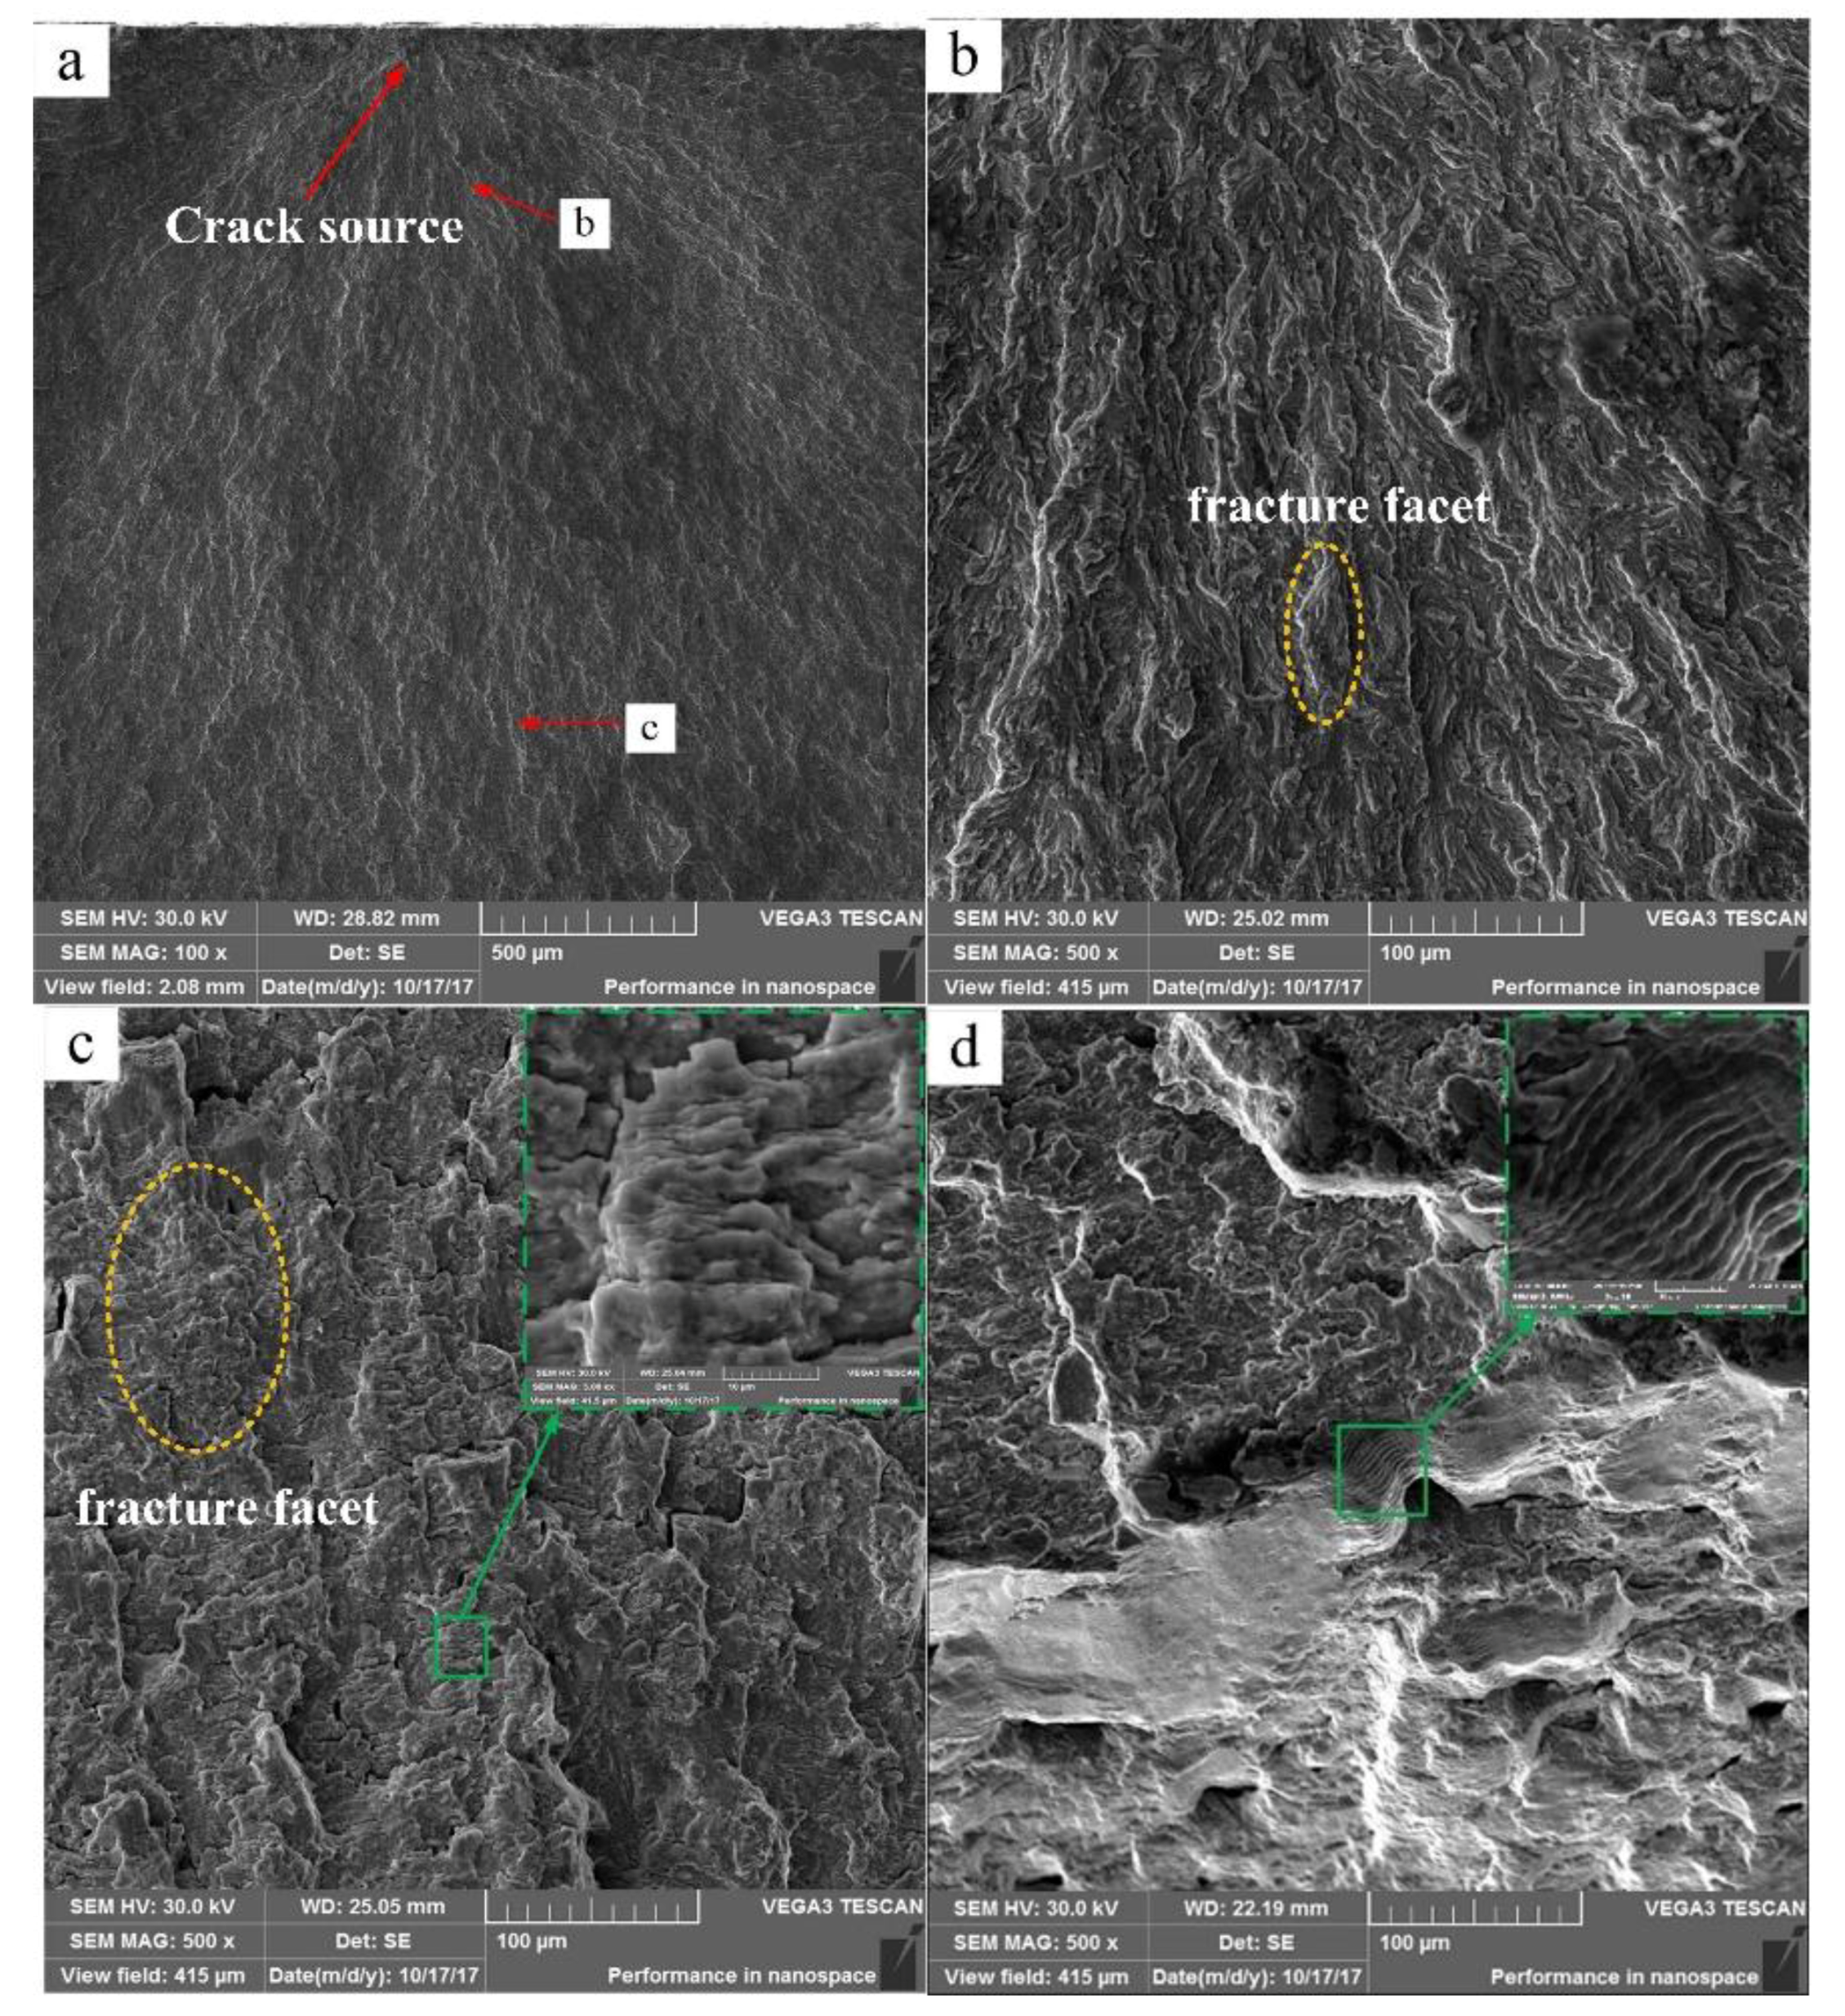
3.1.2. Fatigue Fracture Analysis

Figure 12 shows the fatigue fracture of the NP specimen. It can be seen from Figure 12a that the crack source apparently initiates from the outer surface. Figure 12b,c show the details of crack propagation zone, while the location of Figure 12b is closer to the crack source than that of Figure 12c. Clearly, the fracture facet in Figure 12b is small and the crack growth rate is relatively slow. Yet, in Figure 12c, the fracture facet is larger and fatigue striations can be observed on some fractured facets. Fatigue striation is formed by the alternation of each stress cycle during the fatigue test, and the crack propagation is rapid in this zone, which is close to the fracture zone. Figure 12d shows the fracture zone, where the boundary between the crack growth zone and fracture zone can be clearly observed.
Figure 13 shows the fatigue fracture morphologies of NP, SP1, SP2 and SP3 specimens. It can be found that fracture surface of NP specimen is relatively flat and crack source is single by comparison. After shot peening, the notched specimens have more crack sources. The number of crack source increases with the increase of shot peening intensity. Through the previous analysis, surface roughness was improved after shot peening, which will cause more serious stress concentration. Crack source will be easily formed at the location of stress concentration. Therefore, the number of crack sources will be increased. With the increase of crack sources, the area of each crack source region is decreased compared with that of single crack source region.

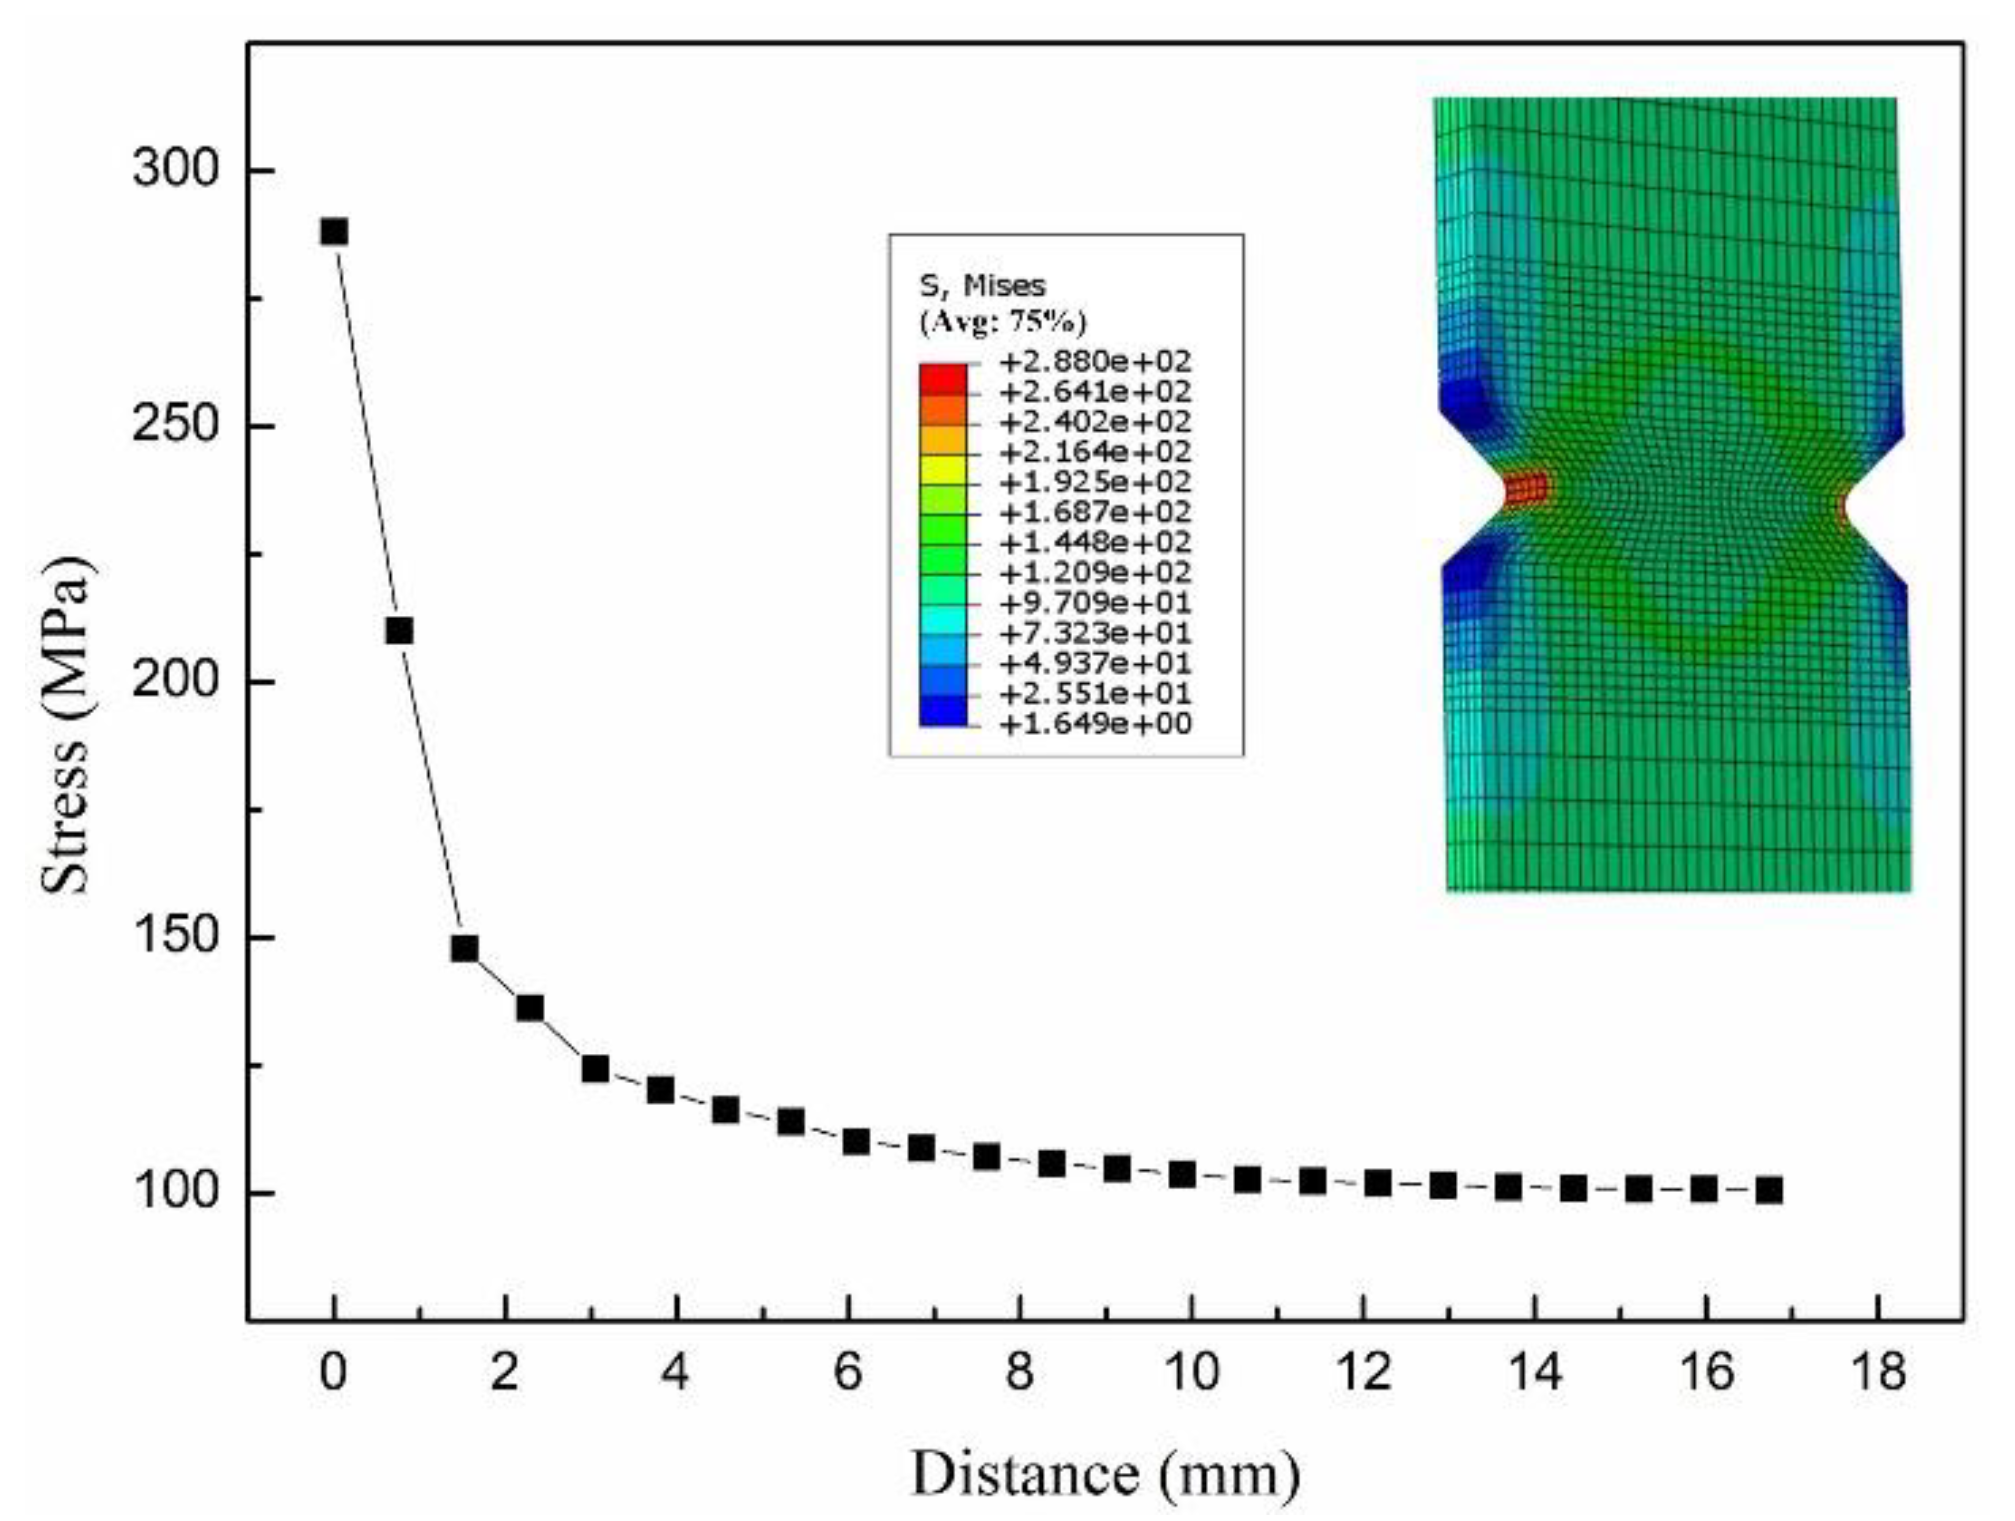
3.2. Local Fatigue Strength Evaluation

Eichlseder [8] introduced a stress gradient method for fatigue life assessment of notched specimen based on the linear elastic finite element method. Using this method, the local fatigue limit of any notched (stress gradient) specimen can be effectively evaluated. The exponential relationship between fatigue limit and stress gradient as a function of relative stress gradient (RSG) is shown in Figure 1, Equations (2) and (3). The exponent KD, which reflects the characteristic of material, describes how σf behaves between σbf and σtf. KD can be assumed to be 0.3 for alloyed steel materials [10]. σbf is the bending fatigue limit and σtf is the fatigue limit in uniform stress loading conditions of smooth specimens (Figure 3 and Figure 5). The value of σbf and σtf is 520 MPa and 377 MPa. b is the thickness (or diameter) of fatigue specimen. RSG can be obtained through Equation (3). The calculated limit must be adjusted according to different R values. Considering the effect of the actual average stress of the cycle, the Haigh diagram (Goodman linear model) can be constructed [11].
σ f = σ t f   [ 1 + ( σ b f σ t f 1 ) ( χ 2 / b ) K D ]
χ = ( 1 σ m a x ) ( d σ d x )
RSG was calculated through finite element simulation. Figure 14 shows the stress distribution at the root of notched specimens before shot peening. The relative stress gradient under external load (σtf) can be obtained by Equation (3). The σmax is 1085 MPa and the value of RSG is 0.36.
However, for the prediction of fatigue strength after shot peening, the Eichlseder’s method was modified by Bagherifard [9,10]. After shot peening, the effective stress distribution at the notch is the sum of the external load at its maximum value and residual compressive stress (Figure 10) generated by shot peening [11]. RSG of SP1, SP2 and SP3 specimens considering residual compressive stress is 2.96, 2.46 and 3.77, respectively.
It can be seen from Figure 9 that the work hardening layer (deformed layer) was obtained. According to the modified equation put forward by Bagherifard and Fernandez Pariente [10,21], FWHM can be used to evaluate hardening effect of materials after shot peening treatment. Figure 15 shows the XRD spectrums of NP and SP specimens, from which FWHM values can be obtained. FWHM of NP specimen is 0.305, while the FWHM value (see Figure 14) of fatigue specimen under SP1, SP2 and SP3 is 0.325, 0.356 and 0.375. On the basis of Eichlseder’s method [8], the local fatigue strengths were calculated through applying a work hardening coefficient introduced by Fernandez-Pariente and Guagliano [21]. This work hardening coefficient is calculated as the ratio of FWHM for peened specimen to that for the NP one. This modification takes into account the surface strain hardening index of FWHM obtained from XRD analysis [10]. Thus, the local fatigue strength of SP1, SP2 and SP3 specimens considering FWHM coefficient is 801 MPa, 827 MPa and 871 MPa, respectively. Compared with the actual testing values in Figure 8, the error is 12.2%, 11.8% and 14.2%, respectively. The reason for the large error is that roughness changes were not considered in the calculation process. Bagherifard [10] introduced the surface roughness coefficient (Cs) for evaluating the local fatigue limit according to the surface coefficient diagrams provided by Buch [22], which improved the prediction accuracy.
By analyzing the three-dimensional morphology of specimen surface (Figure 16), the surface roughness of NP and SP notched specimens can be obtained. The averages of obtained results are presented in Table 4. It can be clearly seen that all shot peened series have relatively high surface roughness values.
From Table 4, the R ZNP R ZSP value and local fatigue strength considering R ZNP R ZSP coefficient were calculated for three types of shot peening specimens (see Table 5). It is found that R ZNP R ZSP can be used to modify the local fatigue limit for the 40Cr steel after oil quenching at 840 °C and tempering at 600 °C, and the modified result is generally accurate when Rz is in the range of 50–150 μm.

4. Conclusions

Fatigue strength and life prediction of 40Cr notched steel before and after shot peening were studied. The conclusions are as follows:
(1) Shot peening produces work hardening effect on the surface of specimen. Plastic deformation occurs in the surface, and leads to a more compact microstructure. The variation of maximum residual stress under different shot peening intensity is small. Surface roughness is increased with the increase of shot peening intensity.
(2) Fatigue limit of notched specimens treated by three types of shot peening paraments was increased from 14.2% to 22.1% under the combined effect of working hardening, residual stress and surface roughness produced by shot peening.
(3) The local fatigue limit was decided by residual stress, work hardening and surface roughness. In this study, Rz coefficient was directly used to characterize the effect of surface roughness on fatigue properties and satisfactory results were obtained for local fatigue limit prediction of shot peening specimens.

Author Contributions

Conceptualization, Y.L. and D.X.; Methodology, X.Z.; Software, Z.S.; Validation, X.Z., D.X. and Y.L.; Formal Analysis, X.Z.; Investigation, X.Z.; Resources, D.X.; Data Curation, Z.S.; Writing-Original Draft Preparation, X.Z.; Writing-Review & Editing, Y.L.; Visualization, Z.S.; Supervision, D.X.; Project Administration, X.Z.; Funding Acquisition, X.Z.

Funding

This research was funded by the Natural Science Foundation of Jilin province, the grant number is 20180101323JC.

Conflicts of Interest

The authors declare no conflict of interest. The funders had no role in the design of the study; in the collection, analyses, or interpretation of data; in the writing of the manuscript, and in the decision to publish the results.

References

  1. Schulze, V. Modern Mechanical Surface Treatment, States, Stability, Effects; John Wiley & Sons: New York, NY, USA, 2006; pp. 247–319. [Google Scholar]
  2. Liu, G.; Wang, S.C.; Lou, X.F.; Lu, J.; Lu, K. Low carbon steel with nanostructured surface layer induced by high-energy shot peening. Scr. Mater. 2001, 44, 1791–1795. [Google Scholar] [CrossRef] [Green Version]
  3. Abrão, A.M.; Aspinwall, D.K. The surface integrity of turned and ground hardened bearing steel. Wear 1996, 196, 279–284. [Google Scholar] [CrossRef]
  4. Guilhem, Y.; Basseville, S.; Curtit, F.; Stéphan, J.; Cailletaud, G. Numerical analysis of the effect of surface roughness on mechanical fields in polycrystalline aggregates. Model. Simul. Mater. Sc. 2018, 26, 045004. [Google Scholar] [CrossRef] [Green Version]
  5. Nascimento, M.P.; Souza, R.C.; Pigatin, W.L.; Voorwald, H.J.C. Effects of surface treatments on the fatigue strength of AISI 4340 aeronautical steel. Int. J. Fatigue 2001, 23, 607–618. [Google Scholar] [CrossRef]
  6. Zhang, X.; Liu, D. Effect of shot peening on fretting fatigue of Ti811 alloy at elevated temperature. Int. J. Fatigue 2009, 31, 889–893. [Google Scholar] [CrossRef]
  7. Zhang, Z.; Song, Y.; Wu, H.; Du, S.S.; Shen, G.; Wu, W.Y.; Lu, K.; Wei, J.; Readman, P.; Peñate, J.; et al. Fatigue tests on ITER PF6 Coil Helium Inlet at 77K. IEEE T. Appl. Supercon. 2018, 28, 1–7. [Google Scholar] [CrossRef]
  8. Eichlseder, W. Fatigue analysis by local stress concept based on finite element results. Comput. Struct. 2002, 80, 2109–2113. [Google Scholar] [CrossRef]
  9. Bagherifard, S.; Colombo, C.; Guagliano, M. Application of different fatigue strength criteria to shot peened notched components. Part 1: Fracture Mechanics based approaches. Appl. Surf. Sci. 2014, 289, 180–187. [Google Scholar] [CrossRef]
  10. Bagherifard, S.; Guagliano, M. Application of different fatigue strength criteria on shot peened notched parts. Part 2: Nominal and local stress approaches. Appl. Surf. Sci. 2014, 289, 173–179. [Google Scholar] [CrossRef]
  11. Olmi, G.; Comandini, M.; Freddi, A. Fatigue on Shot-Peened Gears: Experimentation, Simulation and Sensitivity Analyses. Strain 2010, 46, 382–395. [Google Scholar] [CrossRef]
  12. Olmi, G.; Freddi, A. A new method for modelling the support effect under rotating bending fatigue: Application to Ti-6Al-4V alloy, with and without shot peening. Fatigue Fract. Eng. Mater. 2013, 36, 981–993. [Google Scholar] [CrossRef]
  13. Zhao, L.H.; Feng, J.Z.; Zheng, S.L. Effect of Cyclic Stresses Below the Endurance Limit on the Fatigue Life of 40Cr Steel. Strength Mater. 2018, 50, 2–10. [Google Scholar] [CrossRef]
  14. Zhao, X.H.; Zhao, B.; Liu, Y.; Cai, Y.; Hu, C.H. Research on friction and wear behavior of gradient nano-structured 40Cr steel induced by high frequency impacting and rolling. Eng. Fail. Anal. 2017, 83, 167–177. [Google Scholar] [CrossRef]
  15. Wu, G.C.; Li, Y.F.; Pan, X.D; Wang, G.L. Numerical simulation of fatigue damage and shape instability behavior of steel 40Cr by the damage-coupled crystal plastic model. Strength Mater. 2017, 49, 118–124. [Google Scholar] [CrossRef]
  16. Gao, Y.K. Fatigue limit of chemical heat treated specimens and effect of shot peening. Surf. Eng. 2013, 24, 322–326. [Google Scholar] [CrossRef]
  17. Liu, Y.; Zhao, X.; Wang, D. Effective FE model to predict surface layer characteristics of ultrasonic surface rolling with experimental validation. Mater. Sci. Technol. 2014, 30, 627–636. [Google Scholar] [CrossRef]
  18. Fathallah, R.; Laamouri, A.; Sidhom, H.; Braham, C. High cycle fatigue behavior prediction of shot-peened parts. Int. J. Fatigue 2004, 26, 1053–1067. [Google Scholar] [CrossRef]
  19. Song, P.S.; Wen, C.C. Crack closure and crack growth behaviour in shot peened fatigued specimen. Eng. Fract. Mech. 1999, 63, 295–304. [Google Scholar] [CrossRef]
  20. Kashaev, N.; Ventzke, V.; Horstmann, M.; Chupakhin, S.; Riekehr, S.; Falck, R.; Maawad, E.; Staron, P.; Schell, N.; Huber, N. Effects of laser shock peening on the microstructure and fatigue crack propagation behaviour of thin AA2024 specimens. Int. J. Fatigue 2017, 98, 223–233. [Google Scholar] [CrossRef] [Green Version]
  21. Pariente, I.F.; Guagliano, M. About the role of residual stresses and surface work hardening on fatigue ΔKth of a nitrided and shot peened low-alloy steel. Surf. Coat. Technol. 2008, 202, 3072–3080. [Google Scholar] [CrossRef]
  22. Buch, A. Fatigue Strength Calculation; Transtech Publications: Zürich, Switzerland, 1988; pp. 51–54. [Google Scholar]
Figure 1. Stress gradient in notches caused by tension loading. Reproduced from [8], with copyright permission from Elsevier, 2002.
Metals 08 00681 g001
Figure 2. Microstructure of quenched and tempered 40Cr steel.
Metals 08 00681 g002
Figure 3. Geometry and dimension of smooth fatigue specimen.
Metals 08 00681 g003
Figure 4. Geometry and dimension of notched fatigue specimen.
Metals 08 00681 g004
Figure 5. Geometry and dimension of smooth rotating bending fatigue specimen.
Metals 08 00681 g005
Figure 6. High-frequency fatigue testing fixture with specimen.
Metals 08 00681 g006
Figure 7. Fatigue data and S-N curves of NP, SP1, SP2 and SP3 specimens.
Metals 08 00681 g007
Figure 8. Local fatigue limit of the notched specimens (2 million).
Metals 08 00681 g008
Figure 9. The cross-sectional scanning electron microscope (SEM) observation of shot peening specimens: (a) SP1 specimen; (b) SP2 specimen; (c) SP3 specimen.
Metals 08 00681 g009
Figure 10. Residual stress distribution of the shot-peening specimens.
Metals 08 00681 g010
Figure 11. Surface morphology of specimens before and after shot peening: (a) NP specimen; (b) SP1 specimen; (c) SP2 specimen; (d) SP3 specimen.
Metals 08 00681 g011
Figure 12. SEM images of the fracture surface of the NP specimen: (a) crack source zone (b,c) crack propagation zone (d) fracture zone.
Metals 08 00681 g012
Figure 13. SEM images of fracture surfaces of the notched specimens: (a) crack source zone of NP specimen; (b) crack source zone of SP1 specimen; (c) crack source zone of SP2 specimen; (d) crack source zone of SP3 specimen.
Metals 08 00681 g013
Figure 14. Stress distribution of notched specimen before shot peening.
Metals 08 00681 g014
Figure 15. The X-ray diffraction (XRD) spectrums of non-shot peening and shot peening specimens: (a) NP specimen; (b) SP1 specimen; (c) SP2 specimen; (d) SP3 specimen.
Metals 08 00681 g015
Figure 16. Three-dimensional morphology of specimens before and after shot peening: (a) NP specimen; (b) SP1 specimen; (c) SP2 specimen; (d) SP3 specimen.
Metals 08 00681 g016
Table 1. The chemical composition of 40Cr steel.
CSiMnCrNiPS
0.37~0.440.17~0.370.5~0.80.8~1.1≤0.030≤0.035≤0.035
Table 2. The mechanical properties of 40Cr steel.
Yield Strength (MPa)Ultimate Tensile Strength (MPa)Elongation Rate (%)HV
7508809.7260
Table 3. Shot peening (SP) parameters adopted for treating fatigue specimens.
TreatmentShot TypeAlmen Intensity (mmA)Coverage (%)
SP1S1100.2100
SP2S1100.3100
SP3S1100.4100
Table 4. Surface roughness of notched specimens.
SpecimenRaRzRq
NP1.88760.0212.451
SP12.74798.0823.746
SP22.911100.2164.013
SP33.133117.3814.335
Table 5. Predictive value vs. experimental value.
SpecimenCalculated Fatigue Limit (MPa)Experimental Data (MPa)Error%
SP1703714−1.5
SP2726740−1.9
SP3738763−3.4

