Abstract
The phase transformation kinetics under continuous cooling conditions for intercritical austenite in a cold rolled low carbon steel were investigated over a wide range of cooling rates (0.1–200 C/s). The start and finish temperatures of the intercritical austenite transformation were determined by quenching dilatometry and a continuous cooling transformation (CCT) diagram was constructed. The resulting experimental CCT diagram was compared with that calculated via JMatPro software, and verified using electron microscopy and hardness tests. In general, the results reveal that the experimental CCT diagram can be helpful in the design of thermal cycles for the production of different grades of dual-phase–advanced high-strengh steels (DP-AHSS) in continuous processing lines. The results suggest that C enrichment of intercritical austenite as a result of heating in the two phases (ferrite–austenite) region and C partitioning during the formation of pro-eutectoid ferrite on cooling significantly alters the character of subsequent austenite phase transformations.
1. Introduction
Reducing the weight of vehicles to increase fuel efficiency, improving passenger safety and reducing CO emissions are priorities for the automotive industry. In contribution to obtaining these goals, the steel industry offers now different grades of advanced high-strength steels (AHSS) with multiphase microstructures (ferrite, bainite, retained austenite, stress/strain-induced martensite, athermal martensite, etc.) with an excellent balance of low cost, light weight and mechanical properties [1,2]. Intercritical heat treatments, i.e., heating to the two-phase ferrite–austenite (–) temperature range are the main manufacturing tools for most of cold-rolled AHSS [3]. Dual-phase (DP) steels have microstructures consisting mainly of a ductile ferrite matrix with martensite contents which may vary between 10 and 50% depending on the strength required in the product [4]. In some cases, the microstructure may contain small amounts of other phases such as retained austenite, pro-eutectoid ferrite, pearlite and bainite, depending on cooling rate during the heat treatment [5]. These complex microstructures provide steel products manufactured with high strength, good ductility, low yield to tensile strength ratio, high bake-hardenability, high strain hardening and toughness [6]. The main advantage of DP steels is that may be developed with low to high yield strength (YS) to ultimate tensile strength (UTS) ratios, which allows for a broad range of applications from crumple zone to body structure [7,8]. However, the main advantages and resulting benefits of using DP steels depend strongly on the development of appropriate processing routes to optimize the mechanical properties.
In general, the conventional process for manufacturing a cold-rolled high strength DP steel involves two stages of heat treatment [9]. In stage I, the steel with an initial cold worked ferrite/pearlite microstructure is heated between Ac and Ac (temperatures at which the austenite transformation starts and finishes) to form an austenite/ferrite mixture. During stage II, a controlled cooling is performed where most of the intercritical austenite transforms to martensite to generate the specific ferrite–martensite dual phase microstructures. The main parameters that most directly influence the microstructure and mechanical properties of cold-rolled DP steels are the temperature and time in the intercritical region and the cooling rate. The effect of varying the soaking temperature and time of the intercritical treatment and the cooling rate on the decomposition products of the austenite have been studied by various authors [10,11,12,13,14,15,16].
The non-equilibrium decomposition of austenite from intercritical temperatures follows different kinetics that those cooled from T > Ac [3,5,6]. The phase transformations of austenite from the intercritical region are determined by certain interacting metallurgical phenomena, of which carbon diffusion in austenite and new ferrite nucleation are the most important. During heating into the intercritical temperature range, a substantial C enrichment of austenite can occur. This increases the austenite stability and consequently changes the nature and characteristics of the products of austenite decomposition in comparison with the possible microstructures obtained from a fully austenitic microstructure [17]. In this context, it has been reported that the increase in carbon content in austenite produces a shift of pearlite transformation toward lower temperatures and slower cooling rates tends to eliminate the bainite reaction and consequently to decrease the martensite-start temperature (M) [17,18]. The other important aspect in the austenite transformation following intercritical heat treatments is related to the nucleation mechanism of pro-eutectoid (new) ferrite at the pre-existing phase boundaries. Pre-existing interfacial surfaces such as ferrite–austenite (–) facilitate the formation of new ferrite (). Therefore, the ferrite transformation starts at a significantly higher temperature. This acceleration of formation results in a further enrichment of austenite by carbon, which is of vital importance for manufacturing DP steels since it decreases M temperature and cooling rates for producing martensitic microstructures.
Thin gauge (say, thickness <2 mm) DP-AHSS steel strips, with microstructures consisting of isolated islands of martensite, bainite and retained austenite in a ferritic matrix [19] are produced by cold rolling followed by processing in continuous annealing (CAL) or continuous galvanizing (GAL) lines. The initial microstructure for producing this type of strip product consists of severely deformed ferrite and pearlite (cold rolling reductions greater than 70%). The total amount and type of the phases formed depend on the hardenability of the intercritical austenite and the subsequent cooling conditions [20,21].
In practical situations, continuous cooling transformation (CCT) diagrams play an important role in the development of advanced high-strength steels. They are broadly used to design specific heat treatments and predict the resulting microstructures and mechanical properties [22,23,24]. These phase transformation curves provide precise information on the microconstituents formed from the non-isothermal decomposition of austenite. Unfortunately, the availability of CCT diagrams constructed for the transformation of intercritical austenite is practically non-existent in the open literature and therefore the mechanisms of transformation are not completely understood [17,18,22,25]. Most CCT diagrams have been developed for full austenitization that do not allow a precise estimation of the microstructures that can be produce under real processing routes to which these high strength DP steels are subjected. Therefore, the aim of this paper is to report the results of the experimental determination of CCT diagrams for DP steels subjected to intercritical austenitization heat treatments using quenching dilatometry. The results are compared with CCT diagrams calculated using JMatPro 9.0 software (Sente Software Ltd., Guildford, UK) developed for the estimation of the transformation of austenite at temperatures greater than Ac.
2. Experimental Procedure
Material and Experimental Route
The chemical composition of the steel used in this research work is given in Table 1. This composition is within the ranges commercially used for manufacturing cold-rolled DP steels [26]. The steel under study was received in the form of cold rolled sheets of 1.5 mm thickness.

Table 1.
Chemical compositions (wt %) of studied steel.
Dilatometry was used for the study of the phase transformations using an LINSEIS L78–RITA quenching dilatometer (Selb, Germany). This instrument is equipped with a linear variable differential transformer (LVDT) sensor that measures the dimensional changes of the samples in a gas-tight enclosure, enabling testing under vacuum or in an inert atmosphere to minimize oxidation and/or decarburization of the specimen during heating to high temperatures. The temperature of the specimen was measured and controlled with two K type thermocouples spot welded at the center of the specimen surface. The steel samples used for the different thermal cycles executed in dilatometry were machined parallel to the rolling direction with the following dimensions: 3 mm in width, 10 mm in length and 1.5 mm in thickness. Although the banding phenomena represents an important source of anisotropy in measurements of dilatometry [27], in this research work, the samples used for the experiments always were aligned with the rolling direction. Therefore, the anisotropy should not have important effects in the obtained results.
For the thermal cycles employed in the continuous cooling tests for the construction of the CCT diagram, the specimens were first heated at 35 C/s from room temperature to the intercritical austenitizing temperature of 800 C. Soaking at this temperature lasted 60 s and controlled continuous cooling was performed at eleven different rates (0.1, 0.25, 0.5, 1, 2.5, 5, 10, 20, 50, 100 and 200 C/s). The start and finish temperatures of the austenite transformation were identified from the dilatometry curves and then the corresponding CCT diagram was constructed. The resulting experimental diagram was compared with that calculated using JMatPro 9.0 software. The resulting microstructures and hardness of the dilatometry specimens were characterized by scanning electron microscopy (SEM) and Vickers hardness (HV) tests.
The initial austenite grain size and the amount of intercritical austenite at 800 C were experimentally determined from additional intercritical austenitization heat treatments at 800 C during 60 s and subsequent cooling at 200 C/s under helium flow. To determine the austenite grain size at the intercritical temperature, the austenite grain boundaries were revealed using a general chemical etching reagent based on saturated aqueous picric acid plus a wetting agent [28]. The volume fraction of intercritical austenite was estimated using the lever rule and verified by quantitative metallography.
Critical temperatures of the austenite transformation on heating (Ac and Ac) and quenching (M and M) were determined from dilatometric curves using the tangential extrapolation method in the linear portion of the dilatation vs. temperature curves (L/Lo vs. T) and its corresponding first derivative d(L/Lo)/dT. For this purpose, steel samples were austenitized at 1000 C for 300 s followed by quenched with helium gas to room temperature. The same curve analysis was used for determining the points that marked the start and finish temperatures of the phase transformations in continuous cooling from the intercritical temperature. Once all transformation points were determined, the CTT diagram was plotted in semi-logarithmic T–t coordinates. The cooling curves were traced from 800 C and the corresponding transformations were indicated on each curve. The CCT diagram for the steel was constructed connecting the points corresponding to the start and finish of a given transformation. The different kinds of resulting microstructures by transformation, namely ferrite, pearlite, bainite or martensite, were then indicated on the diagram. The final result was a family of curves representing the various stages of transformation of intercritical austenite as a function of temperature and time.
3. Results and Discussion
3.1. Initial Microstructure and Mechanical Properties
Figure 1 shows the microstructural characteristics of the steel investigated in as-received condition. The SEM micrograph taken in the cross section reveals a microstructure mainly composed of elongated bands of pearlite (P) in an elongated ferrite () matrix. Phase quantification by image analysis resulted in an initial microstructure consisting of 72% ferrite and 28% pearlite. The banding is inherited from the solidification microstructure and has been reported as a consequence of Mn segregation during solidification of the slabs in dual–phase steels [29,30]. The uniaxial tensile mechanical properties of the steel in the as-received condition are: ultimate tensile strength (UTS) 1038 ± 5 MPa, yield strength (YS, 0.2% offset) 974 ± 10.6 MPa and total elongation to fracture (EL) of 2 ± 0.4%. The average hardness is 25 ± 2.47 HRC (≈266 HV).
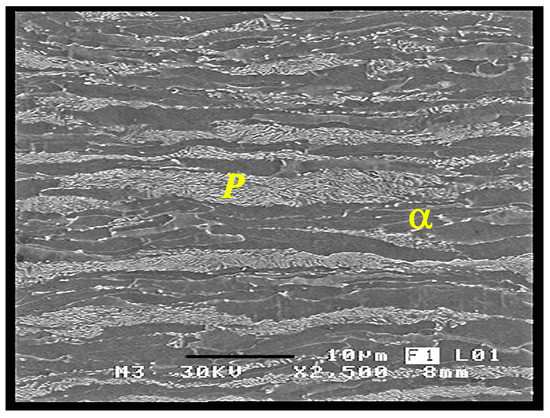
Figure 1.
SEM micrograph by secondary electrons (SE) showing details of the distortion caused on the cementite lamellar of pearlite by the severe plastic deformation. Micrograph taken in the cross section (RD-ND plane) of the strip. Sample etched by 2% Nital. RD and ND refer to the rolling and to the normal directions, respectively.
3.2. Determination of Intercritical Temperature Range
The dilatometric curves determined from full austenitizing and quenching heat treatments are presented separately in Figure 2a,b, respectively. The determination of the critical temperatures from the dilation curves is conducted considering that Ac corresponds to the temperature at which the expansion deviates from linear behavior during heating and the sample starts to contract due to the austenite formation [31]. Ac is defined as the temperature at which expansion begins again to depend linearly on temperature once the sample is fully austenitic, as illustrated in Figure 2a. Since the specific volume of austenite is smaller than that for ferrite, the ferrite to austenite () transformation results in a volume or length decrease. When the austenitization is complete at Ac, the thermal expansion of the austenite produces an increase in dilatation, visible as a nail on the dilatation curve. Similarly, M temperature corresponds to the temperature at which the lineal contraction of the sample during cooling is interrupted as a result of the expansion caused by the martensitic transformation. M is defined as the temperature at which contraction starts again at a rate linearly dependent on temperature. At this temperature, the transformation of the austenite ends. The increase in volume that follows the austenite to martensite transformation is clearly visible in the contraction curve of Figure 2b. It is known that the martensitic transformation produces the largest increase in specific volume macroscopically detected on the dilation curves [32]. The results of the tests conducted to determine the critical transformation temperatures showed average values of 737 ± 3, 842 ± 9, 384 ± 7 and 277 ± 7 C for Ac, Ac, M and M, respectively. According to some authors [33,34], the inflection points or small contractions observed on the dilation curve before Ac and above Ac can be associated with additional microstructural changes such as recrystallization of the deformed ferrite and carbide dissolution in the austenitic temperature range, respectively.

Figure 2.
Dilatometric curves showing the experimental determination of the critical transformation temperatures: (a) description of the determination of Ac and Ac in continuous heating at 35 C/s; (b) description of the determination of M and M in cooling at 200 C/s.
3.3. Determination of the Austenite Grain Size and the Amount of Intercritical Austenite at 800 C
The initial austenite grain size has a significant effect on the phase transformation kinetics under continuous cooling conditions. The nucleation of primary microconstituents, such as new ferrite and pearlite occurs mainly at the grain boundaries. Therefore, the decrease of austenite grain size increases the number of nucleation sites for the corresponding phase transformations and, consequently, decreases the amount of residual metastable austenite that may transform to martensite on further cooling [33]. For the present study, the austenite grain size determined experimentally by metallographic analysis at the selected intercritical austenitizing temperature of 800 C showed an average size of 4.5 m (see Figure 3).
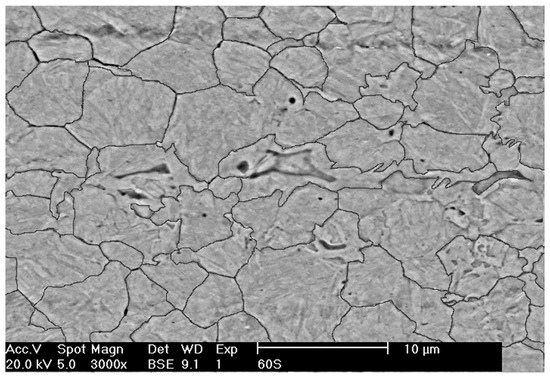
Figure 3.
SEM micrograph showing the austenite grain size determined at the intercritical temperature of 800 C revealing an average size of 4.5 m. Sample etched by picric acid solution.
One of the main process variables in the production of DP steels in continuous processing lines is the intercritical austenitizing temperature. This parameter plays a very important role in the control of the amount of austenite to be transformed and its carbon content. The amount of intercritical austenite determines the maximum amount of martensite that can be obtained at the end of the heat treatment, which, in turn, determines the final strength of steel. Figure 4a illustrates an experimental dilatation–temperature curve during heating and the application of the lever rule to quantify the volume fraction of intercritical austenite (F) at the intercritical austenitizing temperature of 800 C. It is important to indicate that this temperature was selected based on industrial cycles for the production of galvanized DP steels in hot dip continuous galvanizing lines [26]. From the lever rule, the microstructure at 800 C consists of:
where and are the fractions of intercritical austenite and ferrite at 800 C, respectively. A and B are the lengths of the vertical segments above and below of the dilatation curve, respectively. According to this analysis, the intercritical austenite percentage at 800 C is 70% and the remaining 30% would correspond to the intercritical ferrite (ferrite present at the intercritical temperature), as illustrated in Figure 4a.
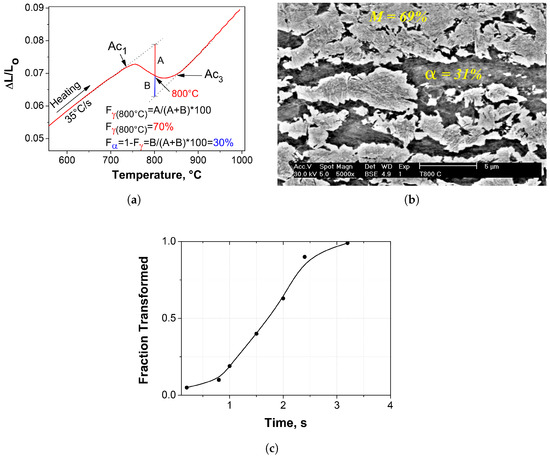
Figure 4.
Determination of ferrite and austenite existing at the intercritical temperature of 800 C: (a) graphical method of the lever rule (30% ferrite and 70% austenite); (b) quantitative metallography (31% ferrite and 69% austenite) etched by 2% Nital; (c) austenite fraction vs. time curve showing the total transformation kinetics in continuous heating.
The nucleation of austenite in low-C hypoeutectoid steels with initial ferritic–pearlitic microstructures occurs predominantly at the interphase boundaries between pearlite colonies and ferrite grains. According to Oliveira et al. [35], this process occurs in two stages: (a) pearlite dissolution and (b) ferrite to austenite transformation, where both stages take place by nucleation and growth processes and result in contraction on the dilatometric curve. The percentages of intercritical austenite and ferrite calculated from the dilatometry curves are consistent with the results obtained from metallographic characterization of the samples subjected to interrupted austenitization at 800 C by quenching, as illustrated in Figure 4b. Due to the high quenching rate (200 C/s), formation of epitaxial ferrite, pearlite and bainite is suppressed. Therefore, it is assumed that the volume fraction of martensite observed in the microstructure (69%) is equivalent to the austenite fraction at the intercritical temperature just before quenching. As specified above, the amount of the intercritical austenite can be controlled by the selection of the austenitizing temperature in the dual phase () region. Since the formation of austenite is a diffusion-controlled phase transformation, its volume fraction increases with the increase of the annealing temperature. Therefore, in the present study, the phase transformation kinetics under continuous cooling conditions were investigated considering only the decomposition of 70% of the total microstructure, i.e., the amount of intercritical austenite. The volume fraction of intercritical ferrite (30%) will be constant regardless of the cooling rate. Figure 4c illustrates the complete evolution of the transformation from the initial ferrite + pearlite microstructure to austenite. It is clearly observed that full austenitization during heating at 35 C/s takes about 3 s. Therefore, the selected holding time (60 s) at the intercritical temperature of 800 C may be sufficient time to reach equilibrium conditions in both intercritical austenite and ferrite.
3.4. Dilatometric Curves and CCT Diagrams
Figure 5 illustrates some experimental dilatation vs. temperature curves as a function of the cooling rate. The transformation temperatures for the non-isothermal decomposition of intercritical austenite into ferrite–pearlite, bainite or martensite are defined as the temperatures where the dilatation curve significantly departs from linear thermal contraction. As can be seen, the decomposition of intercritical austenite depends on the cooling rate. In general, it is observed that the transformation start temperature of intercritical austenite decreases as cooling rate increases. The sequence of austenite decomposition during continuous cooling is known, thus each slope discontinuity detected in the dilatometric curves corresponds to a specific phase transformation. Although the temperature ranges, at which the different phase transformations can occur in steels, are quite broad and may even overlap with each other, the order in which they appear during the total transformation in continuous cooling is well established [32]. Therefore, the products in which the intercritical austenite can be decomposed in this case will necessarily have formed in the following order: new ferrite (also called epitaxial ferrite), pearlite, bainite and martensite. All of these phase transformations cause expansions and, therefore, their occurrence introduce inflection points in the contraction–temperature cooling curves recorded in each test.
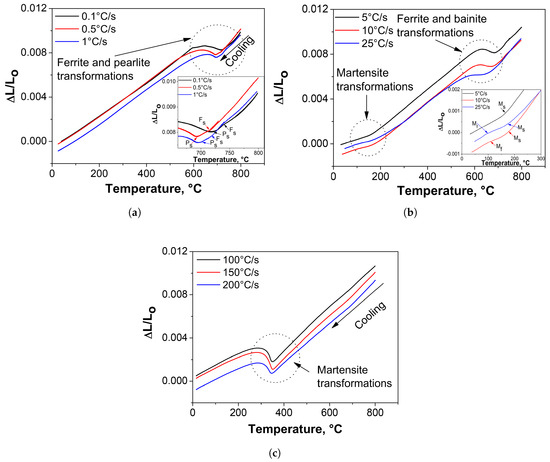
Figure 5.
Examples of dilatometric curves obtained at different cooling rates highlighting the phase transformations manifested by changes in the slopes or inflection points on the curves. Cooling rates of: (a) 0.1, 0.5, 1 C/s; (b) 5, 10, 25 C/s; and (c) 100, 150 and 200 C/s.
At slow cooling rates (0.1–1 C/s), the deviations observed in the contraction curves at high temperatures (Figure 5a) are associated with transformation of intercritical austenite to pro-eutectoid epitaxial ferrite (new ferrite). Some authors [33,36] report that the specific volume changes associated with the austenite to pearlite transformation may not cause a clear indication of the transformation start in the dilatometry curves. This has been attributed to masking of the individual reactions by the continued growth of the other phase. Therefore, they suggest that the pearlite transformation start temperature may be detected by interrupted cooling experiments and subsequent metallographic examination. There are always some uncertainties connected to experimental evaluations; however, in the present work, the start of pearlite transformation (P) was clearly identified at the point where the second deviation of the lineal contraction begins (see Figure 5a). The additional changes in the thermal contraction curves observed at lower temperatures in the cooling curves determined at intermediate cooling rates of 5–25 C/s (Figure 5b) are associated with the non-isothermal decomposition of intercritical austenite to bainite and martensite. Finally, it is evident from the dilatometry curves presented in Figure 5c that, during continuous cooling at rates between 100 and 200 C/s, there is only one change in the slope of the contraction curves which is related only to the transformation of intercritical austenite to martensite. In this connection, it is well known that the magnitude of thermal expansion will always depend on the types and amounts of phases transformed during the thermal cycle to which the steel is subjected. According to this, it appears evident that the macroscopic expansions produced during the transformation of austenite at the highest cooling rates (100, 150 and 200 C/s) are higher, which may be related to totally martensitic transformations.
It is important to note that the quenching dilatometer is able to follow the programmed cycle with high precision. However, for cooling rates higher than 100 C/s, the cooling rate remains constant only up to approximately 300 C and then decreases (see Figure 6). This effect does not affect significantly the determination of the temperature at which the martensite transformation starts because of the M temperature is around 356 C.
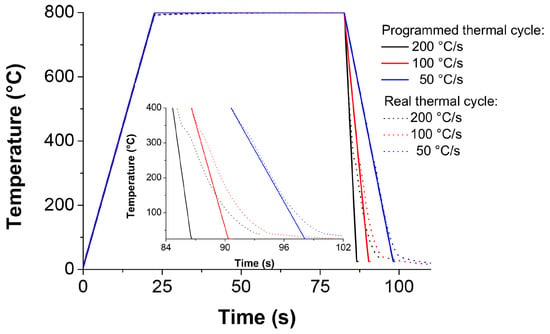
Figure 6.
Experimental temperature–time profiles obtained from the dilatometric output data vs. programmed thermal cycles.
The experimental continuous cooling transformation (CCT) diagram constructed from the analyses of the dilatometry curves is illustrated in Figure 7a. The transformation products of the intercritical austenite in continuous cooling are reported together with the Vickers hardness results measured at room temperature for cooling rates between 0.1 and 100 C/s. The series of cooling curves are plotted from the intercritical temperature of 800 C. The analysis of the resulting CCT diagram clearly reveals four regions, which, according to the temperature range in which they occur, must correspond to the new ferrite (F), pearlite (P), bainite (B) and martensite (M) phase transformations. These assumed microstructures are verified by metallographic characterization and presented later.
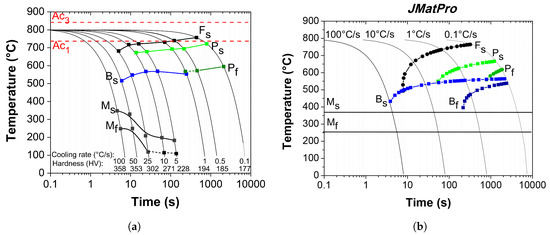
Figure 7.
(a) Experimental continuous cooling transformation (CCT) diagram determined from the analysis of the dilatometry curves in continuous cooling from the intercritical region of 800 C; (b) theoretical CCT diagram calculated by using JMatPro software.
It is clear in the CCT diagram that for a determinate range of cooling rates is possible to observe the start and finish transformation temperatures of the pearlite and martensite. On the other hand, the transformation of intercritical austenite to proeutectoid ferrite and bainite is represented only by the corresponding curve to the start of the phase transformation. The formation of each transformation product is dependent of the cooling rate. The start of the phase transformation tends to gradually decrease with increasing cooling rate (decreasing cooling time). In contrast and as expected, the micro-hardness of the steel increases as the cooling rate increases.
According to the experimental CCT diagram of Figure 7a, the first transformation product of the intercritical austenite is and takes place in the range of cooling rates from 0.1 to 25 C/s. For cooling rates between 25 and 50 C/s, the first transformation product resulting from transformation of intercritical austenite is bainite. Finally, for cooling rates higher than 50 C/s, the intercritical austenite transforms directly to martensite. After the initial formation of at cooling rates less than 25 C/s, the amount of intercritical austenite available for transformation on further cooling decreases and, as a result of the initial transformation, the C concentration in this ‘residual’ austenite must increase. It is clear then that the hardenability of the residual austenite must change as a result of C (and possibly other solutes such as Mn, Cr and Mo) enrichment. This dynamic hardenability changes must have important effects on the subsequent pearlite, bainite and possibly martensite transformations. As can be appreciated in the diagram, pearlite is formed approximately between 700 and 600 C for a cooling rates range from 1 to 10 C/s. Bainite formation from residual austenite after the formation of and pearlite occurs at cooling rates between 1 and 50 C/s. As shown in the experimental diagram, both and pearlite are formed at relatively high temperatures. As has been reported by Fonstein et al. [22], the high rate of ferrite, pearlite and bainite formation is typical upon cooling from an intercritical temperature range. The formation of these phases can be facilitated and anticipated by the presence of pre-existing phase boundaries such as – or –. As a result, the nucleation period is shortened and then the ferrite, pearlite and bainite transformation start temperatures are increased.
A section of ‘non-phase transformation’ within the entire range of cooling rates between the bainite and martensite regions at temperatures between 375 and 500 C can be observed in the constructed CCT diagram of Figure 7a. As can be seen, the start of bainite and martensite transformation (B and M) are totally separated. According to Zhang et al. [37], for hot-rolling procedures, this metastable austenite gap within which no further transformation occurs might allow the DP steels to be coiled at low temperature with little or no sensitivity to the normal variations in coiling. It is emphasized that microalloying elements in the steel such as Mo can retard the phase transformations and induce these kind of metastable austenite regions. Such non-transformation region could be used for the galvanizing of DP steels in industrial continuous galvanizing lines. The interrupted cooling at 450–460 C is a critical factor for the production of martensitic microstructures from residual austenite when the galvanized strip is finally cooled to room temperature. This subject will be discussed in a future publication.
The CCT diagram of Figure 7a also shows that there is a cooling rate range (50–100 C/s) where the intercritical austenite completely transforms to martensite. Under these conditions, the martensite start transformation temperature is practically independent of cooling rate, as illustrated in nearly all the CCT diagrams reported for most steels [32]. The transformation temperatures (M and M,) appear as horizontal lines on the CCT diagram. However, it is clear that in the overlapping region of cooling rates between 50 and 5 C/s, the M exhibits an important dependence on the cooling rate: M transformation temperature gradually decreases with decreasing cooling rate. These results demonstrate that when the martensite follows the formation of other products, such as ferrite pearlite or bainite, the hardenability of the residual austenite changes dynamically during the cooling process. These changes are due to the variations in the chemical composition that occur in the residual austenite as a result of prior diffusion controlled phase transformations. As mentioned earlier, this behavior could be mainly related to the increase in carbon content in the residual austenite. When slow cooling is employed, the final portion of residual austenite can be further enriched with carbon due to its partitioning from ferrite to the -phase. This induces a decrease in the M temperature and can also cause a transition from lath to twinned martensite. Some amount of retained austenite can also stem from the increased stability of the final portion of the residual -phase at slower cooling rates [38,39].
Finally, the experimental CCT diagram clearly indicates that the production of dual phase microstructures in the present steel is quite feasible using intercritical austenitizing within the phase field and subsequent accelerated cooling. However, the CCT diagram also shows that it would be impossible to generate ‘pure’ () DP microstructures in this steel using cooling rates below 50 C/s. In other words, the critical cooling rate, i.e., the minimum cooling rate from the intercritical austenitizing temperature to achieve total martensitic transformation would be about 100 C/s. At an industrial level, for example in hot-rolling, this would be almost impossible since such rates are hardly reached in the run-out cooling tables.
The CCT diagram for the present steel was also calculated using a computer program, Java-based Materials Property (JMatPro) simulation software. This commercial software is a cross-platform that allows for calculating a wide range of material properties and is particularly aimed at multicomponent alloys used in industrial practice. The properties that can be calculated include the time–temperature–transformation (TTT) and CCT diagrams [40]. In general, the calculation of the phase transformations involving ferrite, pearlite and bainite for general steels is based on the model of Kirkaldy [41,42,43]. For the calculation of the transformation diagrams, the only input data needed is the chemical composition of the steel, the austenitization temperature and the austenite grain size. The CCT diagram is derived from the TTT diagram using the well-established Kirkaldy additivity rules [41,42,43]. Strictly speaking, this program cannot be applied in its present form to calculate the transformation of intercritical austenite. However, a comparison of the calculated CCT diagram with the experimental diagram determined in the present work may be useful in further development of the program.
As can be seen in Figure 7b, proeutectoid ferrite () can be formed at temperatures as low as 500 C for cooling rates as high as 50 C/s. The start temperature increases as the cooling rate decreases and, at the slowest cooling rate of 0.1 C/s, the intercritical austenite starts to transform to at ≈770 C, which is similar to that observed in the experimental CCT diagram (Figure 7a). Pearlite can be formed from residual austenite at temperatures between 670 and 570 C for cooling rates between 0.1 C/s and ≈7 C/s. The pearlite start transformation temperature decreases as the cooling rate increases. Bainite, on the other hand, can be formed from residual austenite at T < 570 C at cooling rates from 0.1 to 100 C/s. As in the case of the pearlite transformation, the bainite start transformation temperature decreases as the cooling rate is increased. Finally, the M temperature calculated in the program is 370 C. It is noteworthy that, as in the case of the experimental CCT diagram, the calculated diagram suggests that, for the present steel composition, dual phase () microstructures are rather difficult to obtain, requiring cooling rates in excess of 100 C/s.
Table 2 shows the ranges of temperatures and cooling rates at which the different transformations are observed in both the experimental and calculated CCT diagrams. As can be seen, there is a certain degree of qualitative agreement for the transformation sequence. However, the temperature and cooling rate ranges over which a given transformation takes place are, in general, significantly shorter in the experimental diagram. These differences are due to the different initial microstructures at the beginning of cooling. At the intercritical temperature of 800 C, the measured austenitic grain size is 4.5 m and the microstructure consists of approximately 30% ferrite and 70% austenite. In contrast, the calculation under the same conditions of intercritical austenitizing result in a grain size of 8.5 m with 2% ferrite and 98% austenite. The pre-existing intercritical interfaces provide additional nucleation sites for epitaxial ferrite formation and the transformation of intercritical austenite to pro-eutectoid ferrite initiates at significantly higher temperatures at cooling rates faster than 1 C/s and increases as the cooling rate increases. The continuous cooling from the intercritical region can cause significant C enrichment of the residual austenite and alter the character of subsequent -phase transformations [3]. On the other hand, the C enrichment of intercritical and residual austenite considerably decreases M temperatures, particularly at intermediate cooling rates (5–25 C/s). The higher carbon content in austenite after intercritical austenitization could also explain the dynamic shift of the experimental curves to the right, increasing thus the hardenability of steel. According to Saunders et al. [44], the physical models used for the calculation of TTT/CCT do not take into account some important microalloying elements in the chemical composition of the steel. The results of the present investigation suggest that, in addition to the effect of alloying additions, the dynamic changes in solute distribution during continuous cooling within the intercritical region cause significant changes in the hardenability of both intercritical and residual austenite.

Table 2.
Ranges of temperatures, times and cooling rates at which the different transformations are observed in the experimental and calculated continuous cooling transformation (CCT) diagram.
3.5. Microstructures and Hardness
As mentioned above, the transformation during cooling from the intercritical temperature range controls all major characteristics of dual-phase steels such as volume fractions of martensite and new ferrite, carbon content in martensite, and therefore the presence of retained austenite and the amount of bainite [3]. Some selected SEM micrographs showing the microstructural evolution and micro-hardness derived from the different dilatometric tests as a function of cooling rate are illustrated in Figure 8a–f. It is important to take into account for the analysis of these microstructures that the initial microstructure consisted of 30% intercritical ferrite () and, therefore, this phase must be present in the microstructures for all cooling rates. At very slow cooling rates (0.1 C/s, Figure 8a), the intercritical austenite only transforms to new ferrite () and pearlite (P) and the lowest hardness value is observed (177 HV). In general, the new ferrite phase is formed by transformation of the intercritical austenite by diffusional mechanisms and epitaxial growth on the prior ferrite [45]. In the microstructures shown in Figure 8a–d, the is distinguished by SEM-SE as a white rim around the intercritical ferrite. As noted in the CCT diagram, the formation of decreases as the cooling rate increases, mainly over the cooling rate range of 0.1 to 10 C/s (Figure 8a–c), with variations in hardness from 177 to 271 HV. These results also reveal that the hardness of the steel increases as new ferrite decreases. In this regard, the influence of new ferrite on tensile properties of dual–phase steel was investigated by Sarwar et al. [45], reporting that specimens with epitaxial ferrite have low yield and tensile strengths but superior ductility compared with specimens without epitaxial ferrite contents. At the cooling rate of 1 C/s (Figure 8b), small traces of lamellar pearlite are still observed together with prior and new ferrite and bainite (B). For this case, the hardness is increased slightly (194 HV), which is related to the additional bainitic transformation. The C enrichment raises the austenite stability compared with austenite in the same steel heated to temperatures above Ac. This is an extremely important aspect of the intercritical heat treatment, which allows for austenite in low-carbon steel to undergo transformations that are mostly typical for medium and high-carbon structural steels [3]. As can be seen in Figure 8d, for a cooling rate of 50 C/s, the intercritical austenite transforms mostly to grain-boundary bainite (B) and intergranular martensite (M). The average hardness for this thermal cycle was 353 HV. Finally, as expected, for cooling rates between 100 and 200 C/s (Figure 8e,f), the intercritical austenite transforms completely to martensite, resulting in a dual microstructure composed of intercritical ferrite and martensite with the largest micro-hardness values (375–388 HV). For these cooling rates, the volume fraction of martensite in the microstructure of the steel should be equivalent to the intercritical austenite determined at 800 C (70%). These results reveal that, for the particular case of this steel and austenitization conditions, the viability of conventionally producing dual-phase steels, by the continuous annealing process in the intercritical region, is very limited. In general, cooling rates greater than 100 C/s should be applied in order to achieve the specific ferrite–martensite dual phase microstructures.
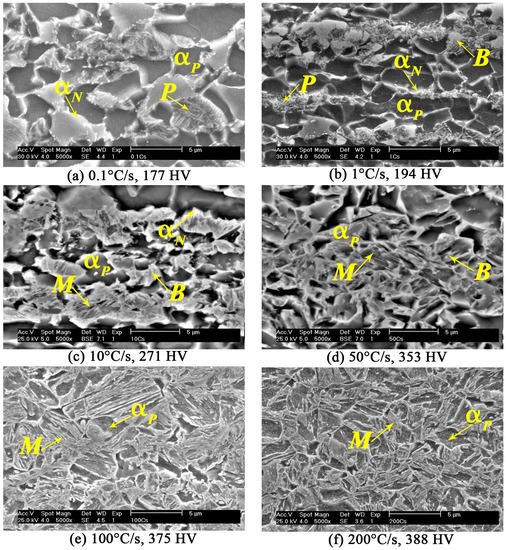
Figure 8.
SEM micrographs showing the microstructural evolution as a function of the cooling rates from the intercritical temperature of 800 C: (a) 0.1 C/s; (b) 1 C/s; (c) 10 C/s; (d) 50 C/s; (e) 100 C/s; and (f) 200 C/s. 2% Nital.
The effect of cooling rate on the micro-hardness of the present steel is illustrated in Figure 9. As can be seen, the type of plot clearly defines the processing–microstructure–property relationship for the steel investigated.
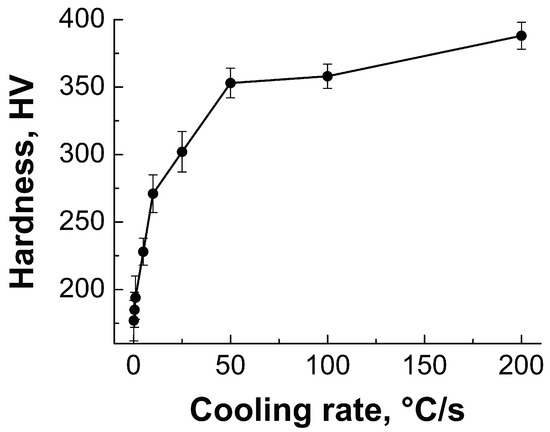
Figure 9.
Evolution of the micro-hardness as a function of the cooling rate from the intercritical temperature at 800 C.
4. Conclusions
The phase transformation kinetics under continuous cooling conditions for intercritical austenite in a cold rolled low carbon steel were fully investigated via quenching dilatometry, electron microscopy and hardness test. The results are presented in the form of a CCT diagram which can be helpful in the design of thermal cycles for the production of different grades of DP–AHSS in continuous processing lines. C enrichment of intercritical austenite as a result of heating in the two phase region (ferrite+austenite) can significantly alter the character of subsequent austenite phase transformations. The ferrite and bainite transformation can be anticipated and the M temperature decreased. For the particular case of the steel and austenitization conditions investigated, the experimental CCT diagram and microstructural analysis reveal that the viability of conventionally producing dual–phase steels by the continuous annealing process in the intercritical region is limited. Cooling rates greater than 100 C/s should be applied in order to achieve the specific ferrite–martensite dual phase microstructures. In relation to the CCT diagram calculated by JMatPro, the main differences found are precisely associated with the different initial microstructures at the beginning of cooling. The presence of pre-existing phase boundaries and C enrichment of intercritical austenite are not considered in the models used in the software and the phase transformation kinetics in continuous cooling can then be altered.
Author Contributions
K.B.-M. performed the experiments, characterization and analyzed the data as part of her Ph.D. activities; G.A. replicated the experiments and characterization; A.S. and F.G. conceived and designed the experiments; G.A. and K.B.-M. coordinated and planned the activities proposed in the methodology; A.S. and A.F. provided the materials, computer programs and other analysis tools; A.S. supervised the development of the methodology; K.B.-M. and G.A. discussed the results and wrote the first draft of the manuscript. All authors revised and approved the final version of the manuscript.
Funding
This research was funded by Consejo Nacional de Ciencia y Tecnología (CONACYT) grant number 379955.
Acknowledgments
The authors would like to thank CONACYT (Mexico) and the International Zinc Association (IZA) for the support granted to this project.
Conflicts of Interest
The authors declare no conflict of interest.
References
- Keeler, S.; Kimchi, M.; Mooney, P.J. Advanced High-Strength Steels Application Guidelines V6; WorldAutoSteel: Brussels, Belgium, 2017; pp. 1–13. [Google Scholar]
- Jambor, A.; Beyer, M. New cars—New materials. Mater. Des. 1997, 18, 203–209. [Google Scholar] [CrossRef]
- Fonstein, N. Main Features of Heat Treatment from Intercritical Region. In Advanced High Strength Sheet Steels: Physical Metallurgy, Design, Processing, and Properties; Springer International Publishing: Cham, Switzerland, 2015; pp. 17–65. [Google Scholar]
- Fonstein, N. Evolution of strength of automotive steels to meet customer challenges. In Advanced High Strength Sheet Steels: Physical Metallurgy, Design, Processing, and Properties; Springer International Publishing: Cham, Switzerland, 2015; pp. 1–16. [Google Scholar]
- Erdogan, M. Effect of austenite dispersion on phase transformation in dual phase steel. Scr. Mater. 2003, 48, 501–506. [Google Scholar] [CrossRef]
- Bhattacharya, D. Developments in Advanced High Strength Steels. In Proceedings of the The Joint International Conference of HSLA Steels 2005 and ISUGS 2005, Sanya, China, 8–10 November 2005; Volume 40. [Google Scholar]
- Flaxa, V.; Shaw, J. Material Applications in ULSAB-AVC (Advanced Vehicle Concepts); SAE Technical Paper; SAE International: Warrendale, PA, USA, 2002. [Google Scholar]
- Pleschiutschnigg, F.P.; Jamnis, V.V.; Talwar, S.R.; Misra, A.K.; Atluri, R.P.V.; Shankar, P.; Verma, R.K.; Goyal, R.K.; Meierling, P.; Pleschiutschnig, J. Start of dual-phase hot strip production in the MPS. Dolvi plant of Ispat Industries Ltd. in India. Steel Grips 2004, 2, 171–176. [Google Scholar]
- Kot, R.A.; Morris, J.W. (Eds.) Structure and Properties of Dual-phase Steels: Proceedings of a Symposium; Metallurgical Society of AIME: New York, NY, USA, 1979; p. 145. [Google Scholar]
- Ghaheri, A.; Shafyei, A.; Honarmand, M. Effects of inter-critical temperatures on martensite morphology, volume fraction and mechanical properties of dual-phase steels obtained from direct and continuous annealing cycles. Mater. Des. (1980–2015) 2014, 62, 305–319. [Google Scholar] [CrossRef]
- Calcagnotto, M.; Ponge, D.; Raabe, D. Microstructure Control during Fabrication of Ultrafine Grained Dual-phase Steel: Characterization and Effect of Intercritical Annealing Parameters. ISIJ Int. 2012, 52, 874–883. [Google Scholar] [CrossRef]
- Hüseyin, A.; Havva, K.Z.; Ceylan, K. Effect of Intercritical Annealing Parameters on Dual Phase Behavior of Commercial Low-Alloyed Steels. J. Iron Steel Res. Int. 2010, 17, 73–78. [Google Scholar] [CrossRef]
- Rocha, R.; Melo, T.; Pereloma, E.; Santos, D. Microstructural evolution at the initial stages of continuous annealing of cold rolled dual-phase steel. Mater. Sci. Eng. A 2005, 391, 296–304. [Google Scholar] [CrossRef]
- Zeytin, H.K.; Kubilay, C.; Aydin, H. Investigation of dual phase transformation of commercial low alloy steels: Effect of holding time at low inter-critical annealing temperatures. Mater. Lett. 2008, 62, 2651–2653. [Google Scholar] [CrossRef]
- Peng-Heng, C.; Preban, A. The effect of ferrite grain size and martensite volume fraction on the tensile properties of dual phase steel. Acta Metall. 1985, 33, 897–903. [Google Scholar] [CrossRef]
- Tavares, S.; Pedroza, P.; Teodosio, J.; Gurova, T. Mechanical properties of a quenched and tempered dual phase steel. Scr. Mater. 1999, 40, 887–892. [Google Scholar] [CrossRef]
- Fonstein, N.M. A heat treatment for obtaining a controlled ferritic-martensitic structure in steel. Metal Sci. Heat Treat. 1985, 27, 610–616. [Google Scholar] [CrossRef]
- Girina, O.; Fonstein, N.; Bhattacharya, D. Effect of annealing parameters on austenite decomposition in a continuously annealed dual-phase steel. In Proceedings of the 45th MWSP Conference, Chicago, IL, USA, 9–12 November 2003; pp. 403–414. [Google Scholar]
- Zhang, F.; Ruimi, A.; Wo, P.C.; Field, D.P. Morphology and distribution of martensite in dual phase (DP980) steel and its relation to the multiscale mechanical behavior. Mater. Sci. Eng. A 2016, 659, 93–103. [Google Scholar] [CrossRef]
- Shibli, S.; Meena, B.; Remya, R. A review on recent approaches in the field of hot dip zinc galvanizing process. Surf. Coat. Technol. 2015, 262, 210–215. [Google Scholar] [CrossRef]
- Liu, H.; Li, F.; Shi, W.; Swaminathan, S.; He, Y.; Rohwerder, M.; Li, L. Challenges in hot-dip galvanizing of high strength dual phase steel: Surface selective oxidation and mechanical property degradation. Surf. Coat. Technol. 2012, 206, 3428–3436. [Google Scholar] [CrossRef]
- Fonstein, N.; Pottore, N.; Lalam, S.; Bhattacharya, D. Phase transformation behavior during continuous cooling and isothermal holding of aluminum and silicon bearing trip steels. In Proceedings of the Materials Science and Technology 2003 Meeting, Chicago, IL, USA, 9–12 November 2003; pp. 549–561. [Google Scholar]
- Cota, A.; Modenesi, P.; Barbosa, R.; Santos, D. Determination of CCT diagrams by thermal analysis of a HSLA bainitic steel. Scr. Mater. 1999, 40, 165–169. [Google Scholar] [CrossRef]
- You, W.; Xu, W.H.; Liu, Y.X.; Bai, B.Z.; Fang, H.S. Effect of Chromium on CCT Diagrams of Novel Air-Cooled Bainite Steels Analyzed by Neural Network. J. Iron Steel Res. Int. 2007, 14, 39–42. [Google Scholar] [CrossRef]
- Colla, V.; DeSanctis, M.; Dimatteo, A.; Lovicu, G.; Valentini, R. Prediction of continuous cooling transformation diagrams for dual-phase steels from the intercritical region. Metall. Mater. Trans. A 2011, 42, 2781–2793. [Google Scholar] [CrossRef]
- Jamwal, R.S.; Frimpong, J.; Ehrhardt, B.W.; Bracht, H.V.; Boggs, R.D.; Bevans, S.W. Process for making cold-rolled dual phase steel sheet. U.S. Patent 20140166163 A1, 19 June 2014. [Google Scholar]
- Kop, T.; Sietsma, J.; Zwaag, S. Anisotropic dilatation behaviour during transformation of hot rolled steels showing banded structure. Mater. Sci. Technol. 2001, 17, 1569–1574. [Google Scholar] [CrossRef]
- De Andrés, C.G.; Bartolomé, M.J.; Capdevila, C.; San Martín, D.; Caballero, F.G.; López, V. Metallographic techniques for the determination of the austenite grain size in medium–carbon microalloyed steels. Mater. Charact. 2001, 46, 389–398. [Google Scholar] [CrossRef]
- Caballero, F.G.; García-Junceda, A.; Capdevila, C.; García de Andrés, C. Evolution of microstructural banding during the manufacturing process of dual phase steels. Mater. Trans. 2006, 47, 2269–2276. [Google Scholar] [CrossRef]
- Granbom, Y. Effects of process parameters prior to annealing on the formability of two cold rolled dual phase steels. Steel Res. Int. 2008, 79, 297–305. [Google Scholar] [CrossRef]
- Martín, D.; de Cock, T.; García-Junceda, A.; Caballero, F.; Capdevila, C.; García de Andrés, C. Effect of heating rate on reaustenitisation of low carbon niobium microalloyed steel. Mater. Sci. Technol. 2008, 24, 266–272. [Google Scholar] [CrossRef]
- Zhao, J.C.; Notis, M.R. Continuous cooling transformation kinetics versus isothermal transformation kinetics of steels: A phenomenological rationalization of experimental observations. Mater. Sci. Eng. R Rep. 1995, 15, 135–207. [Google Scholar] [CrossRef]
- De Andrés, C.G.; Caballero, F.G.; Capdevila, C.; Álvarez, L.F. Application of dilatometric analysis to the study of solid–solid phase transformations in steels. Mater. Charact. 2002, 48, 101–111. [Google Scholar] [CrossRef]
- Zaky Farahat, A.I. Dilatometry determination of phase transformation temperatures during heating of Nb bearing low carbon steels. J. Mater. Process. Technol. 2008, 204, 365–369. [Google Scholar] [CrossRef]
- Oliveira, F.; Andrade, M.; Cota, A. Kinetics of austenite formation during continuous heating in a low carbon steel. Mater. Charact. 2007, 58, 256–261. [Google Scholar] [CrossRef]
- Caballero, F.G.; Capdevila, C.; de Andrés, C.G. Evaluation and review of simultaneous transformation model in high strength low alloy steels. Mater. Sci. Technol. 2002, 18, 534–540. [Google Scholar] [CrossRef]
- Zhang, C.; Cai, D.; Wang, Y.; Liu, M.; Liao, B.; Fan, Y. Effects of deformation and Mo, Nb, V, Ti on continuous cooling transformation in Cu–P–Cr–Ni–Mo weathering steels. Mater. Charact. 2008, 59, 1638–1642. [Google Scholar] [CrossRef]
- Rigsbee, J.; Abraham, J.; Davenport, A.; Franklin, J.; Pickens, J. Structure-processing and structure-property relationships in commercially processed dual-phase steels. In Structure and Properties of Dual-Phase Steels; Metallurgical Society of AIME: New York, NY, USA, 1979; pp. 304–329. [Google Scholar]
- Bangaru, N.R.V.; Sachdev, A.K. Influence of cooling rate on the microstructure and retained austenite in an intercritically annealed vanadium containing HSLA steel. Metall. Trans. A 1982, 13, 1899–1906. [Google Scholar] [CrossRef]
- Saunders, N.; Guo, U.; Li, X.; Miodownik, A.; Schillé, J.P. Using JMatPro to model materials properties and behavior. JOM 2003, 55, 60–65. [Google Scholar] [CrossRef]
- Kirkaldy, J.S.; Thomson, B.A.; Baganis, E.A. Prediction of multicomponent equilibrium and transformation diagrams for low alloy steels. In Hardenability Concepts with Applications to Steel; Metallurgical Society of AIME: New York, NY, USA, 1978; pp. 82–125. [Google Scholar]
- Kirkaldy, J.S.; Venugopalan, D. Prediction of microstructure and hardenability in low alloy steels. In Proceedings of the International Conference on Phase Transformations in Ferrous Alloys, Philadelphia, PA, USA, 4–6 October 1983; Marder, A.R., Goldstein, J.I., Eds.; AIME: Warrendale, PA, USA, 1984; pp. 125–148. [Google Scholar]
- Kirkaldy, J.S. Diffusion-controlled phase transformations in steels. Theory and applications. Scand. J. Metall. 1991, 20, 50–61. [Google Scholar]
- Saunders, N.; Guo, Z.; Li, X.; Miodownik, A.; Schillé, J.P. The Calculation of TTT and CCT Diagrams for General Steels; JMatPro Software Literature, Internal Report; Sente Software Ltd.: Guildford, UK, 2004. [Google Scholar]
- Sarwar, M.; Ahmad, E.; Qureshi, K.; Manzoor, T. Influence of epitaxial ferrite on tensile properties of dual phase steel. Mater. Des. 2007, 28, 335–340. [Google Scholar] [CrossRef]
© 2018 by the authors. Licensee MDPI, Basel, Switzerland. This article is an open access article distributed under the terms and conditions of the Creative Commons Attribution (CC BY) license (http://creativecommons.org/licenses/by/4.0/).