Article

Investigations on Microstructure and Properties of 16 wt% Cr-3 wt% B-0.6 wt% C-1 wt% Mn-Fe Alloy

1
Key Laboratory of Automobile Materials Ministry of Education, School of Materials Science and Engineering, Jilin University, Changchun 130022, China
2
Jiangsu Huicheng Machinery Manufacturing Co., Ltd., Zhenjiang 212322, Jiangsu, China
*
Authors to whom correspondence should be addressed.
Metals 2018, 8(7), 530; https://doi.org/10.3390/met8070530
Submission received: 7 June 2018 / Revised: 5 July 2018 / Accepted: 6 July 2018 / Published: 9 July 2018

Abstract

:
In this paper, a wear-resistant alloy with the chemical composition of 16 wt% Cr-3 wt% B-0.6 wt% C-1 wt% Mn-Fe, in which M2B was the antifriction skeleton, was prepared in a medium-frequency induction furnace. The microstructure and mechanical properties were experimentally investigated. The results show that the microstructure of the Fe-Cr-B alloy was composed of lath martensite and clavate, reticular, and clustering borides (M2B). After the thermal treatment, the morphology, chemical composition, and volume fraction of the M2B did not change significantly. Because of the reduction in element saturation, secondary borides M23(B,C)6 precipitated from the matrix, which resulted in a decrease in matrix microhardness. As a result, the bulk hardness and abrasive resistance of the alloy accordingly decreased, and the impact toughness inversely increased. According to the results of XRD, electronic probe microanalyzer (EPMA), and TEM, the chemical formula of M2B was FeCr0.89Mn0.14(B,C), which resulted in a body-centered tetragonal (BCT) structure. The chemical formula of the M23(B,C)6 was Fe17.97Cr4.13Mn1.14 (B,C)6, which resulted in a face-centered cubic (FCC) structure.

1. Introduction

The Fe-Cr-B alloy, with boride and carboboride as an antifriction skeleton, is a new type of iron-based wear-resistant material that has followed the creation of high-chromium cast iron. The wear-resistant phase of the traditional wear-resistant steel mainly includes M3C and M7C3, while the hard phase of the Fe-Cr-B alloy is mainly the M2B-type boride [1,2]. When compared with carbides, borides have higher hardness and greater thermal stability [3,4,5,6,7], which is attributed to the significantly low solubility of boron in the Fe matrix. As stated in [8], the solubility of B in α-Fe is only 0.0004% when the temperature is lower than 700 °C. An excessive level of B will cause segregation of the crystal boundary, forming borides (mainly M2B) in a network distribution. In addition, B can significantly increase the hardenability of the iron substrate. Correspondingly, it could save the cost of expensive elements (Mo, V, or W). Currently, Fe-Cr-B alloys have been successfully used in wear parts, such as glass bottle molds, rolls, and mud pump impellers.
Generally, the volume fraction of the hard-phase M2B is determined by the content of the B element in the Fe-Cr-B alloy. However, in order to obtain a high hardness in the M2B phase, the formation of M3(B,C), M23(B,C)6, and carbides must be suppressed. Commonly, Cr or Mn is added to stabilize the M2B phase, which should guarantee that the value of B/(B + C) > 0.75 (in weight) [9,10]. In this paper, the B and C content are designed to be of 3 wt% and 0.6 wt%, respectively. As the carrier of the hard phase, the matrix must match in strength and toughness. One method is to promote the formation of martensite [11,12] by thermal treatment, which can increase the hard-phase carrying capacity of the matrix. However, it not only increases the production process and energy consumption but also inevitably creates a large amount of residual stress in the matrix. This paper enhances the overall hardenability of the alloy by increasing the Cr content, which can more easily occur in the martensite phase [13]. Moreover, Cr can increase the brittle fracture resistance and hardness of borides [14]. In the present study, the Fe-Cr-B alloy was designed with 3% B, 16% Cr, 2% Mn, 0.6% C, and a balance of Fe. The casting process was executed by a water-cooling metal-type crystallizer, which could accelerate the cooling rate. Thus, the alloy could be created without needing complex heat treatment. Subsequently, the microstructure, mechanical properties, and abrasiveness of the as-casting alloy and thermal-treated alloy were respectively studied.

2. Experimental Procedure

The Fe-Cr-B alloy was smelted in a 100 kg medium-frequency induction furnace. Steel scrap, ferroboron, ferrochrome, ferromanganese, ferrosilicon, and low-carbon ferrochromium were used as the raw materials. When the temperature reached 1550 °C, the quick lime was used for slagging and an aluminum bar was inserted deeply for deoxygenation. The smelted solution was poured in the water-cooling metal-type crystallizer at 1500 °C. The casting sample obtained by this process was then recorded as A1. In terms of the thermal treatment, the detailed process was performed as follows. The prepared A1 was placed in an environment of 1000 °C for 1 h and cooled to room temperature in air. Subsequently, the treated sample was tempered at 250 °C for 1 h, after which the thermal-treated sample was marked as A2. The chemical compositions of the samples are listed in Table 1.
The used substrates were cut by an electric spark machine (DK7732). After a standard metallographic procedure, followed by etching in a 5% solution of nitric acid (HNO3) in alcohol, the microstructure was subsequently investigated. The microstructure of the samples was observed by a ScopeAxio ZEISS optical microscope (Carl Zeiss, Göttingen, Germany) and a scanning electronic microscope (SEM, ZEISSEVO18, Carl Zeiss, Göttingen, Germany). The chemical composition was analyzed by the ARL4460 (ARL, Shanghai Swiss). The phase compositions were analyzed by an X-ray diffractometer (XRD, D/Max 2500PC, CuKα = 0.15418 nm and 4°/min) and an electronic probe micro analyzer (EPMA, JXA-8800R, JEOL, Tokyo, Japan). The hardness of the samples was measured by the HR-150A Rockwell apparatus (Shanghai Optical Instrument Factory, Shanghai, China) and HXD-1000 Vickers (Matsuzawa, Tokyo, Japan) at a load of 0.2 kg and a dwell time of 10 s. The impact toughness was conducted by Charpy impact test. The unnotched samples were 10 × 10 × 55 mm. The abrasion was tested by a ML-100 pin-disc abrasive wear tester. Before the wear tests, the samples’ surfaces were polished using progressively finer grades of silicon carbide-coated emery paper in order to reduce the impact of the machine marks. For the wear test, a cylinder with a diameter of 6 mm was used. Each sample was pre-grinded with 600-mesh SiC abrasive paper. In the formal wear test, the samples made relative movement with 240-mesh abrasive paper under a load of 17 N. The motion trail of samples was followed by a spiral of Archimedes with a length of 10.409 m for each grinding process. The full test included 10 grinding processes. After this, the samples were weighed, and the mean value of three samples was used. The surface wear appearance was observed by a LEXT-OLS3000 laser scanning confocal microscope (OLYMPUS, Tokyo, Japan). For the volume fraction of the phases, Pro Imaging software (Pro Imaging 1.1, MSA, Cranberry Township, PA, USA) on the optical microscope was applied for separation dying of the metallographic structure. The calculation of the volume of phases was based on five randomly chosen fields at 100× magnification.

3. Results and Discussions
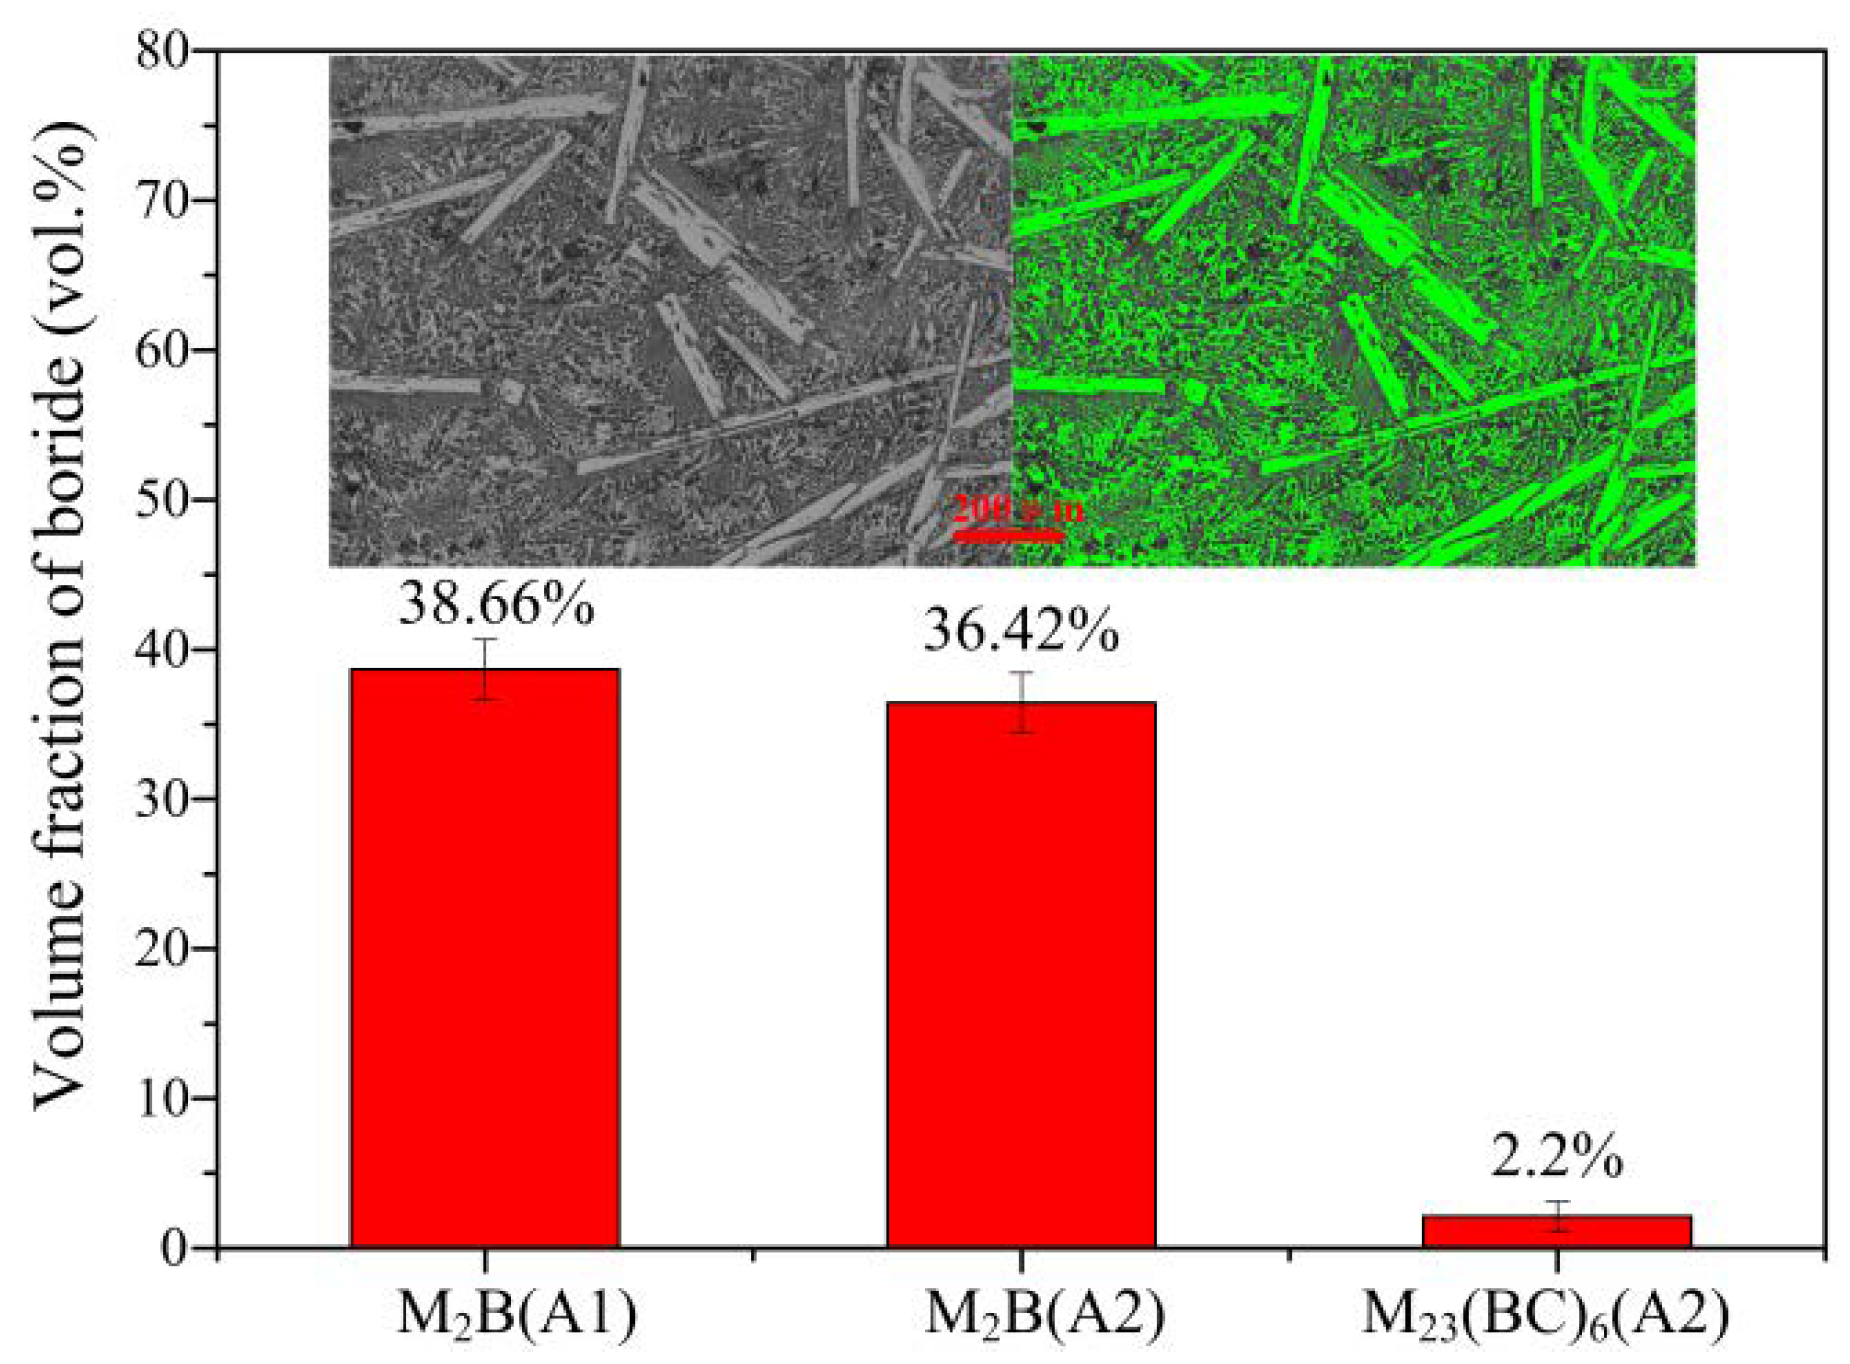
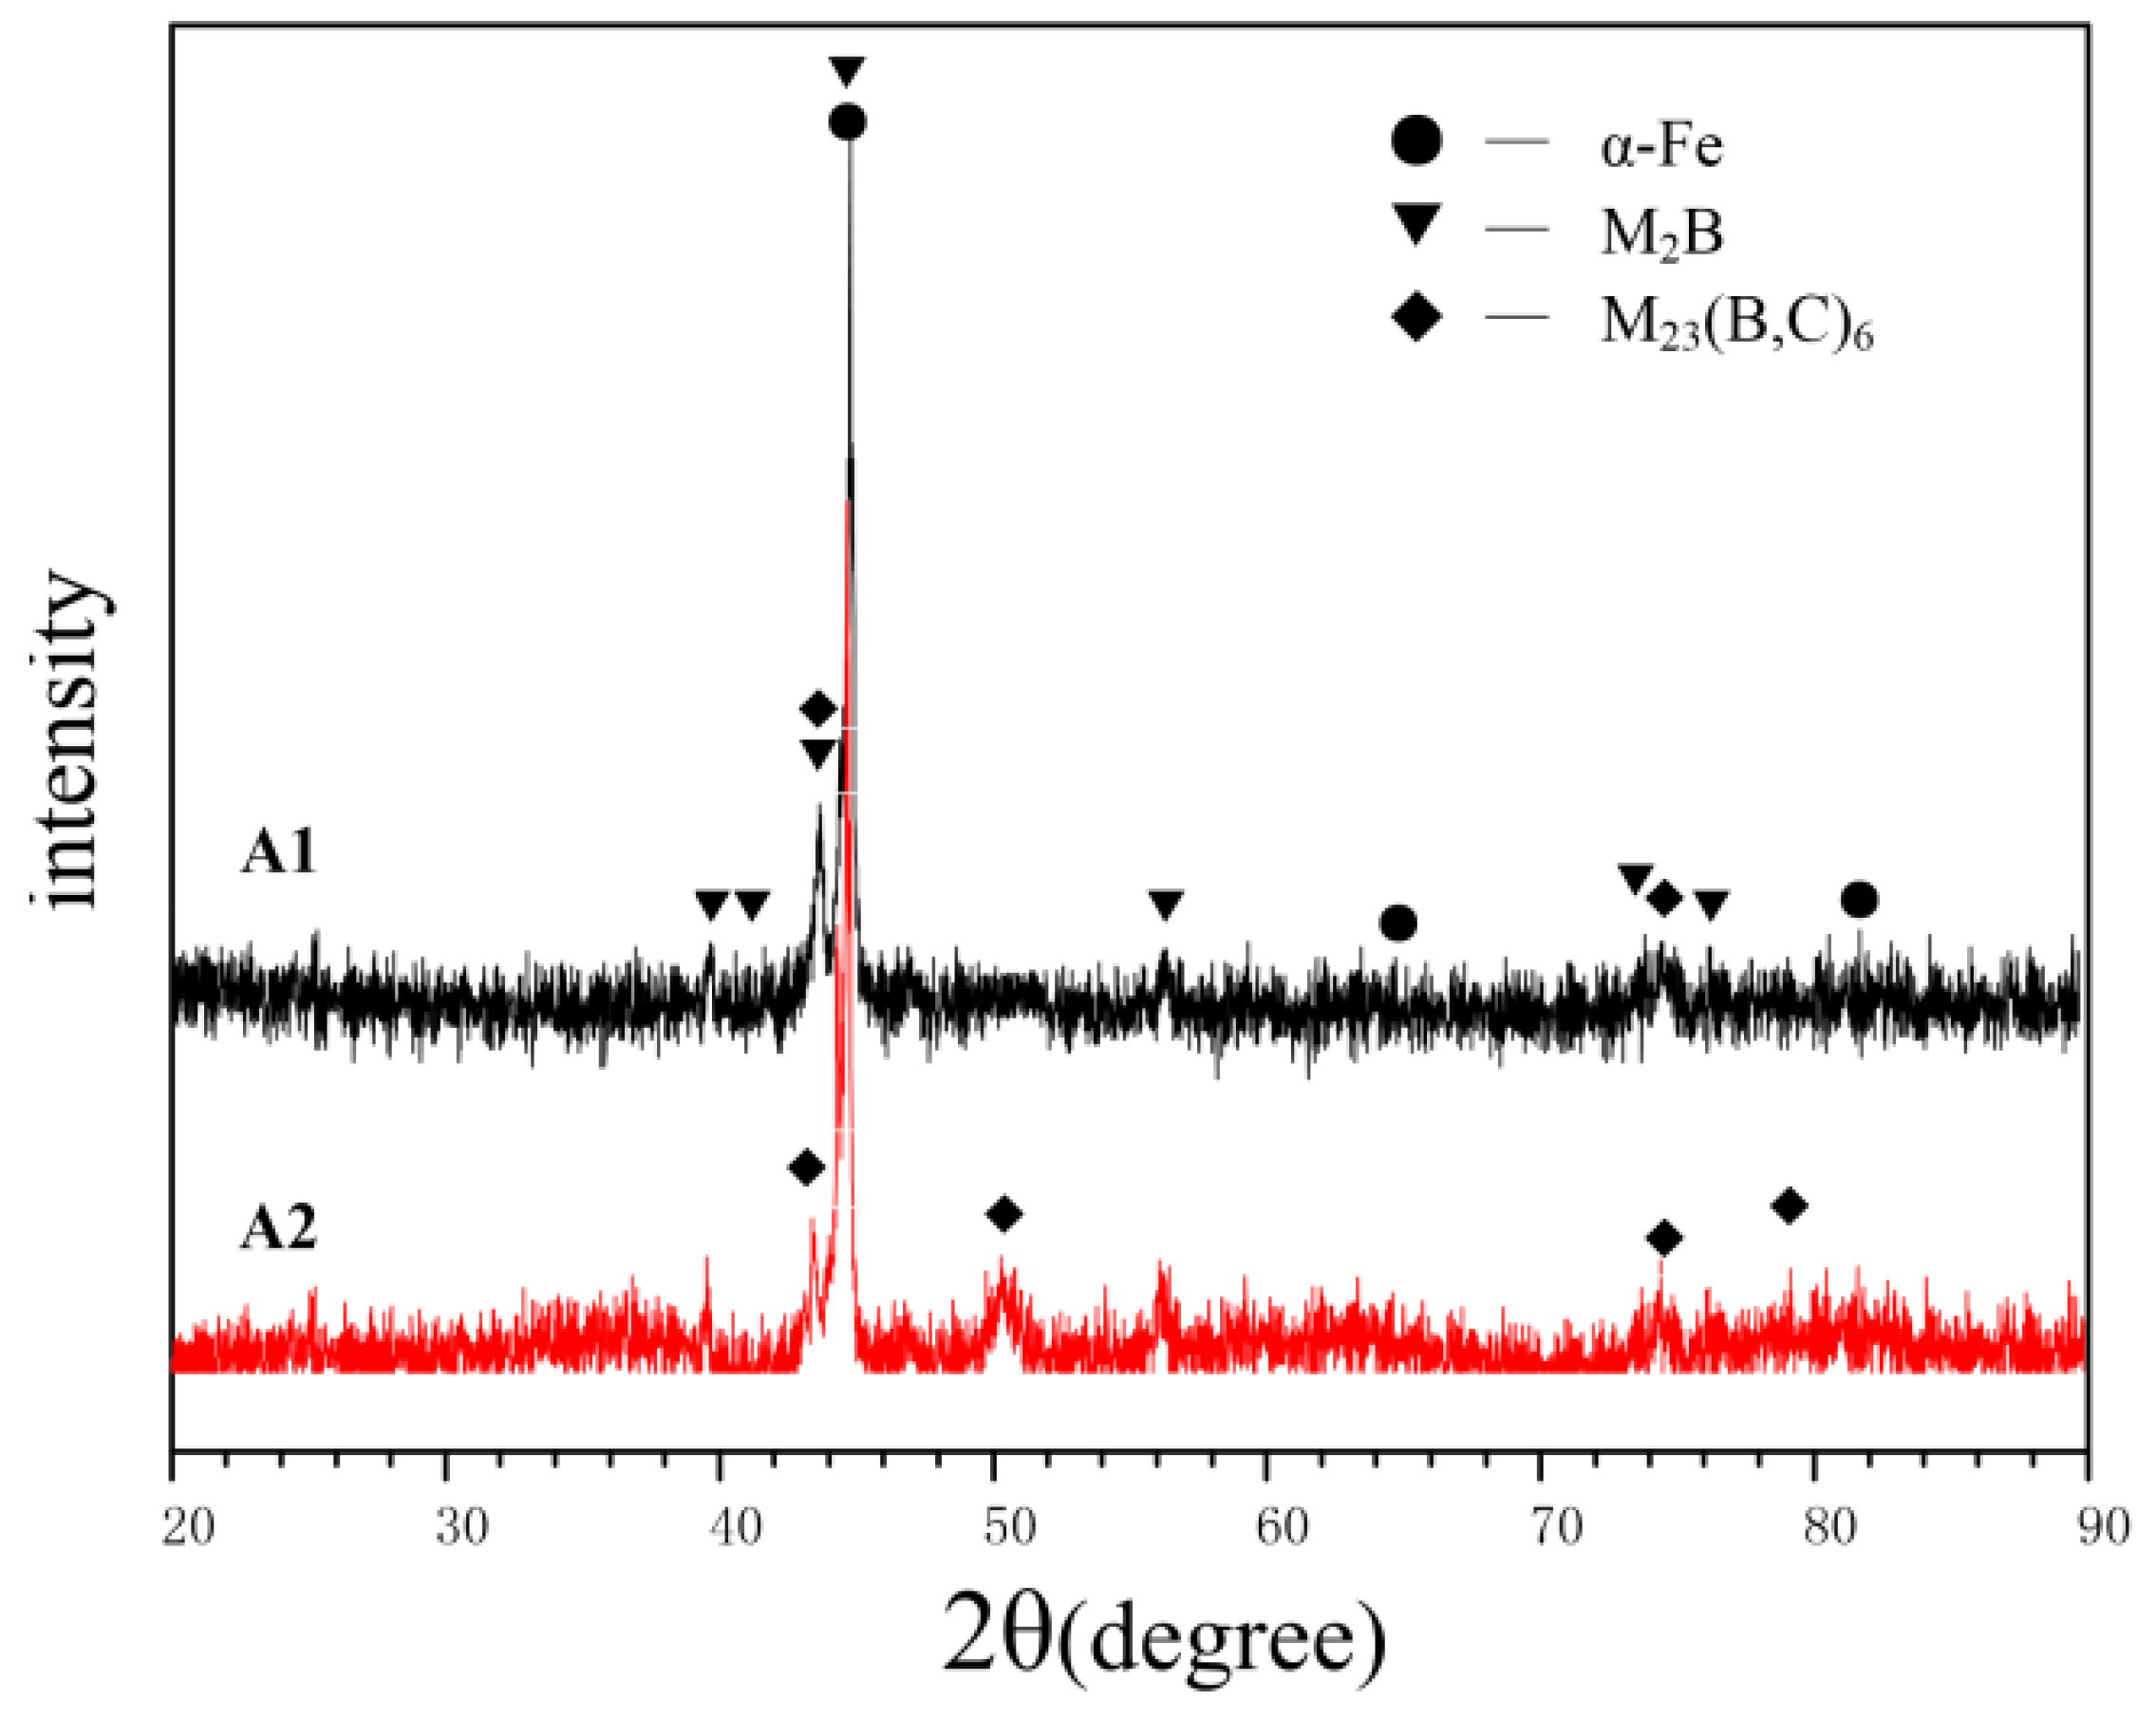
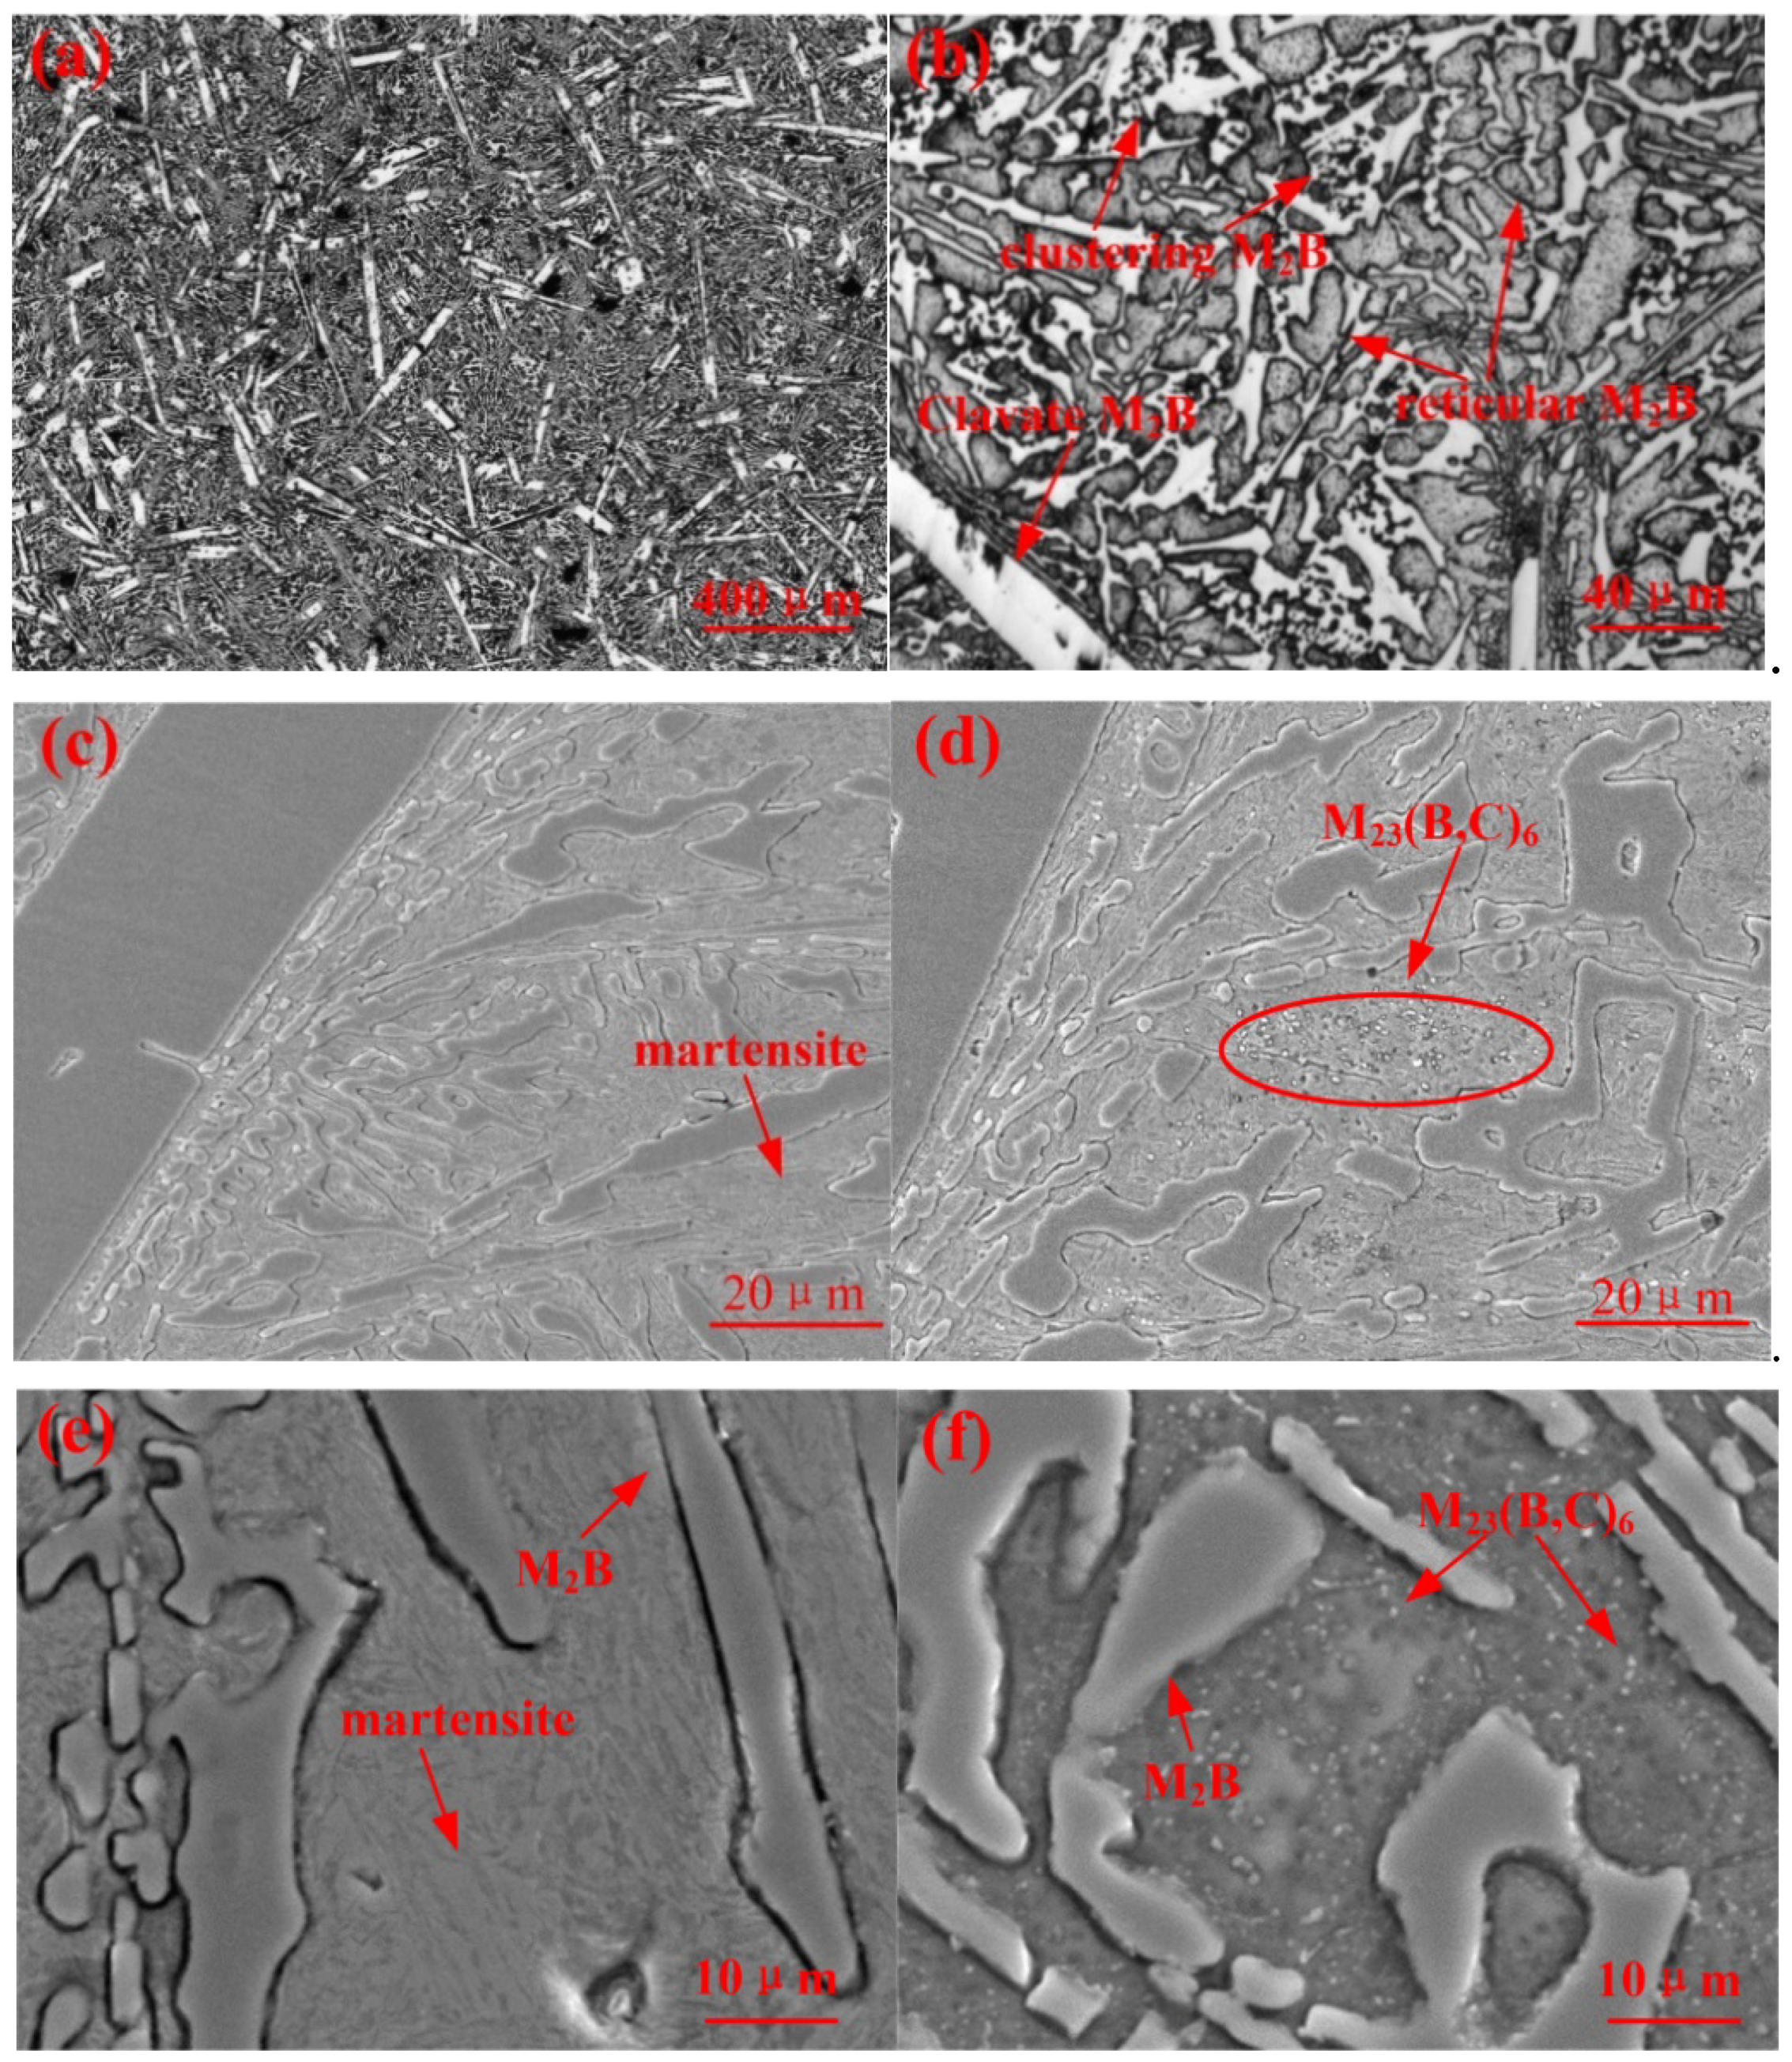
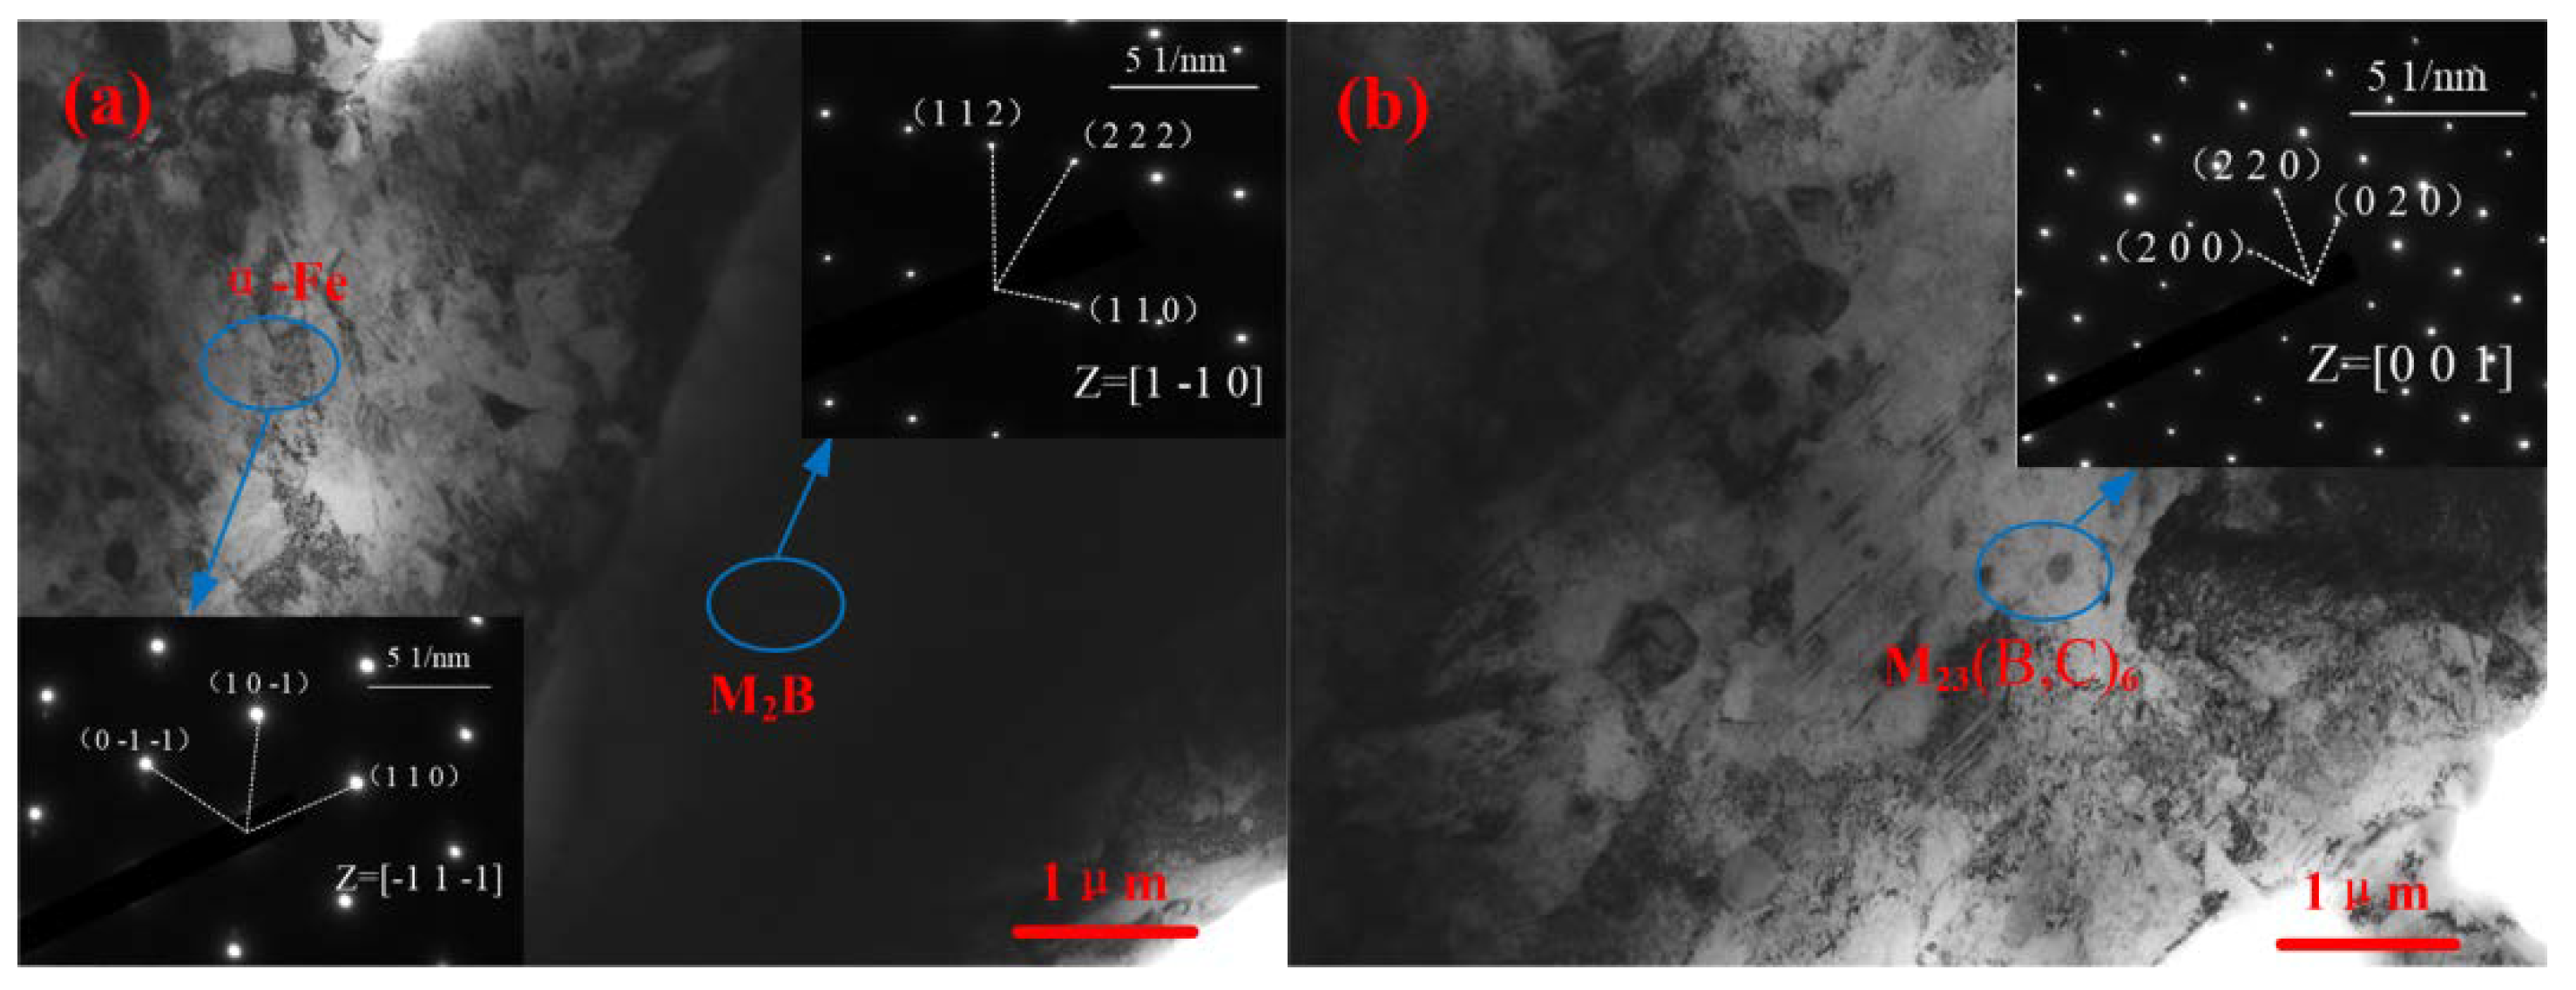
3.1. Microstructure

The XRD spectra of A1 and A2 are shown in Figure 1. The results indicate that the major phase compositions of A1 were M2B and α-Fe (JCPDS34-0396). The M2B was Fe2B(JCPDS36-1332), CrFeB (JCPDS51-1410), or Cr1.65Fe0.35B0.96 (JCPDS35-1180) [15,16,17,18]. After the thermal treatment (A2), the new M23(B,C)6 phase (JCPDS12-0570 or 47-1332) precipitated. Due to the solid solution of alloy elements (Cr and Mn), the diffraction peaks of the samples presented significant deflection responses. It was observed that the peak of (110) planes at 44.6° was very sharp, while the peaks of the (200) and (211) planes (at 65° and 82°) were difficult to discern. This may be due to the use of the water-cooling metal-type crystallizer. The alloy had a large temperature gradient during the cooling process, which resulted in a preferred orientation in (110). According to the Fe–B binary phase diagram and the Fe-B-C ternary phase diagram, the solidification process of the alloy can be summarized as follows. After the decrease in temperature, the primary γ phase was correspondingly separated. Meanwhile, the B elements gathered and were transformed into M2B at the crystal boundaries. Moreover, by the rapid reduction in temperature, the precipitated austenite (FCC) was transformed into martensite (BCC).
Figure 2 demonstrates the microstructures of A1 and A2. The optical appearance of A1 is shown at different magnifications. Figure 2c,d compare the microstructures of samples A1 and A2. For the details of phase composition, it was apparently shown that an amount of lath martensite existed in the interior of dendritic crystal arm. The hard phase was as a result of M2B borides, which presented in clavate, reticular, and clustering distributions [9,19]. As shown in the Fe-B binary phase diagram, the eutectic formed point of Fe-B was 3.8%. However, with the addition of Cr, the eutectic formed point was correspondingly reduced. As indicated in Figure 2c,d, there were no obviously differences in the appearance of M2B between A2 and A1. However, the reticular M2B edges of A1 were distinctly smoother than those of A2, which showed the tendency to fracture. This can be explained by the fact that the borides of iron (FeB, Fe2B, and Fe3B) presented good high-temperature stability (melting point higher than 1100 °C), which resulted in a few B and C atoms at the edge of the M2B phase being dissolved into the matrix. Moreover, with the thermal treatment, the circular secondary-phase M23(B,C)6 was precipitated from the matrix. It could be speculated that the reason for its formation mechanism was that the solid solubility was subsequently decreased for the duration of the thermal treatment, which resulted in the precipitation of M23(B,C)6.

3.2. Thermal Treatment

The volume fractions of M2B and M23(B,C)6 in A1 and A2 are shown in Figure 3. The microstructure in Figure 3 was used as a schematic diagram for the calculation. The M2B phase was separated and stained green before the green area was calculated by the Pro Imaging software. It can be seen that the volume fraction of M2B decreased from 38.7 ± 1% to 36.4 ± 1%, and the volume fraction of M23(B,C)6 in A2 was 2.2 ± 0.2% after the thermal treatment.
The M2B and M23(B,C)6 compositions, which were measured by EPMA, are shown in Table 2. Thereafter, the alloy element proportion of MX(B,C)Y was then calculated, where X was the content of Fe + Cr + Mn and Y was the content of B + C. According to the results, it was demonstrated that M2B had the chemical formula of FeCr0.89Mn0.14(B,C), which was close to FeCrB, and M23(B,C)6 had the chemical formula of Fe17.97Cr4.13Mn1.14(B,C)6, which was close to Fe23B6. It can be concluded that the thermal treatment can slightly influence the M2B phase (morphology, composition, and volume) of the alloy. Therefore, the matrix microstructure dominated the performance of the alloy.
The element contents of the matrix are shown in Table 3. The martensite of A1 had saturated alloy elements (e.g., Cr, B, C, and Mn). The C/B concentration of A1 was higher than that of A2, indicating the higher hardenability of A1. Moreover, the content of the elements in A2 decreased gradually, which implied a certain reduction of element saturation in martensite after the thermal treatment. We noticed that the difference in concentrations measured by the EPMA in the A1 and A2 alloys, were smaller than the experimental error. This small drop in concentration of the minority elements may be due to the small amount of precipitation of M23(B,C)6 after the thermal treatment.
The TEM images and diffraction spots of A1 and A2 are shown in Figure 4. The chosen region was calibrated, finding that M2B has a body-centered tetragonal (BCT) structure, a = b = 0.51093 nm and c = 0.42486 nm. This reflected that adding Cr and Mn can make the single-phase Fe2B change from the body-centered cubic structure (BCC) into M2B with a BCT structure. Similar results have been reported by others [20,21,22]. Cr and Mn elements, which have similar atomic radii and electronegativity with Fe, can be dissolved in Fe atoms, changing the lattice constant of Fe2B and thereby forming M2B. According to the matrix calibration results, α-Fe was martensite with a BCC structure. The secondary phase with circular morphology in A2 was M23(B,C)6, which has a face-centered cubic (FCC) structure.

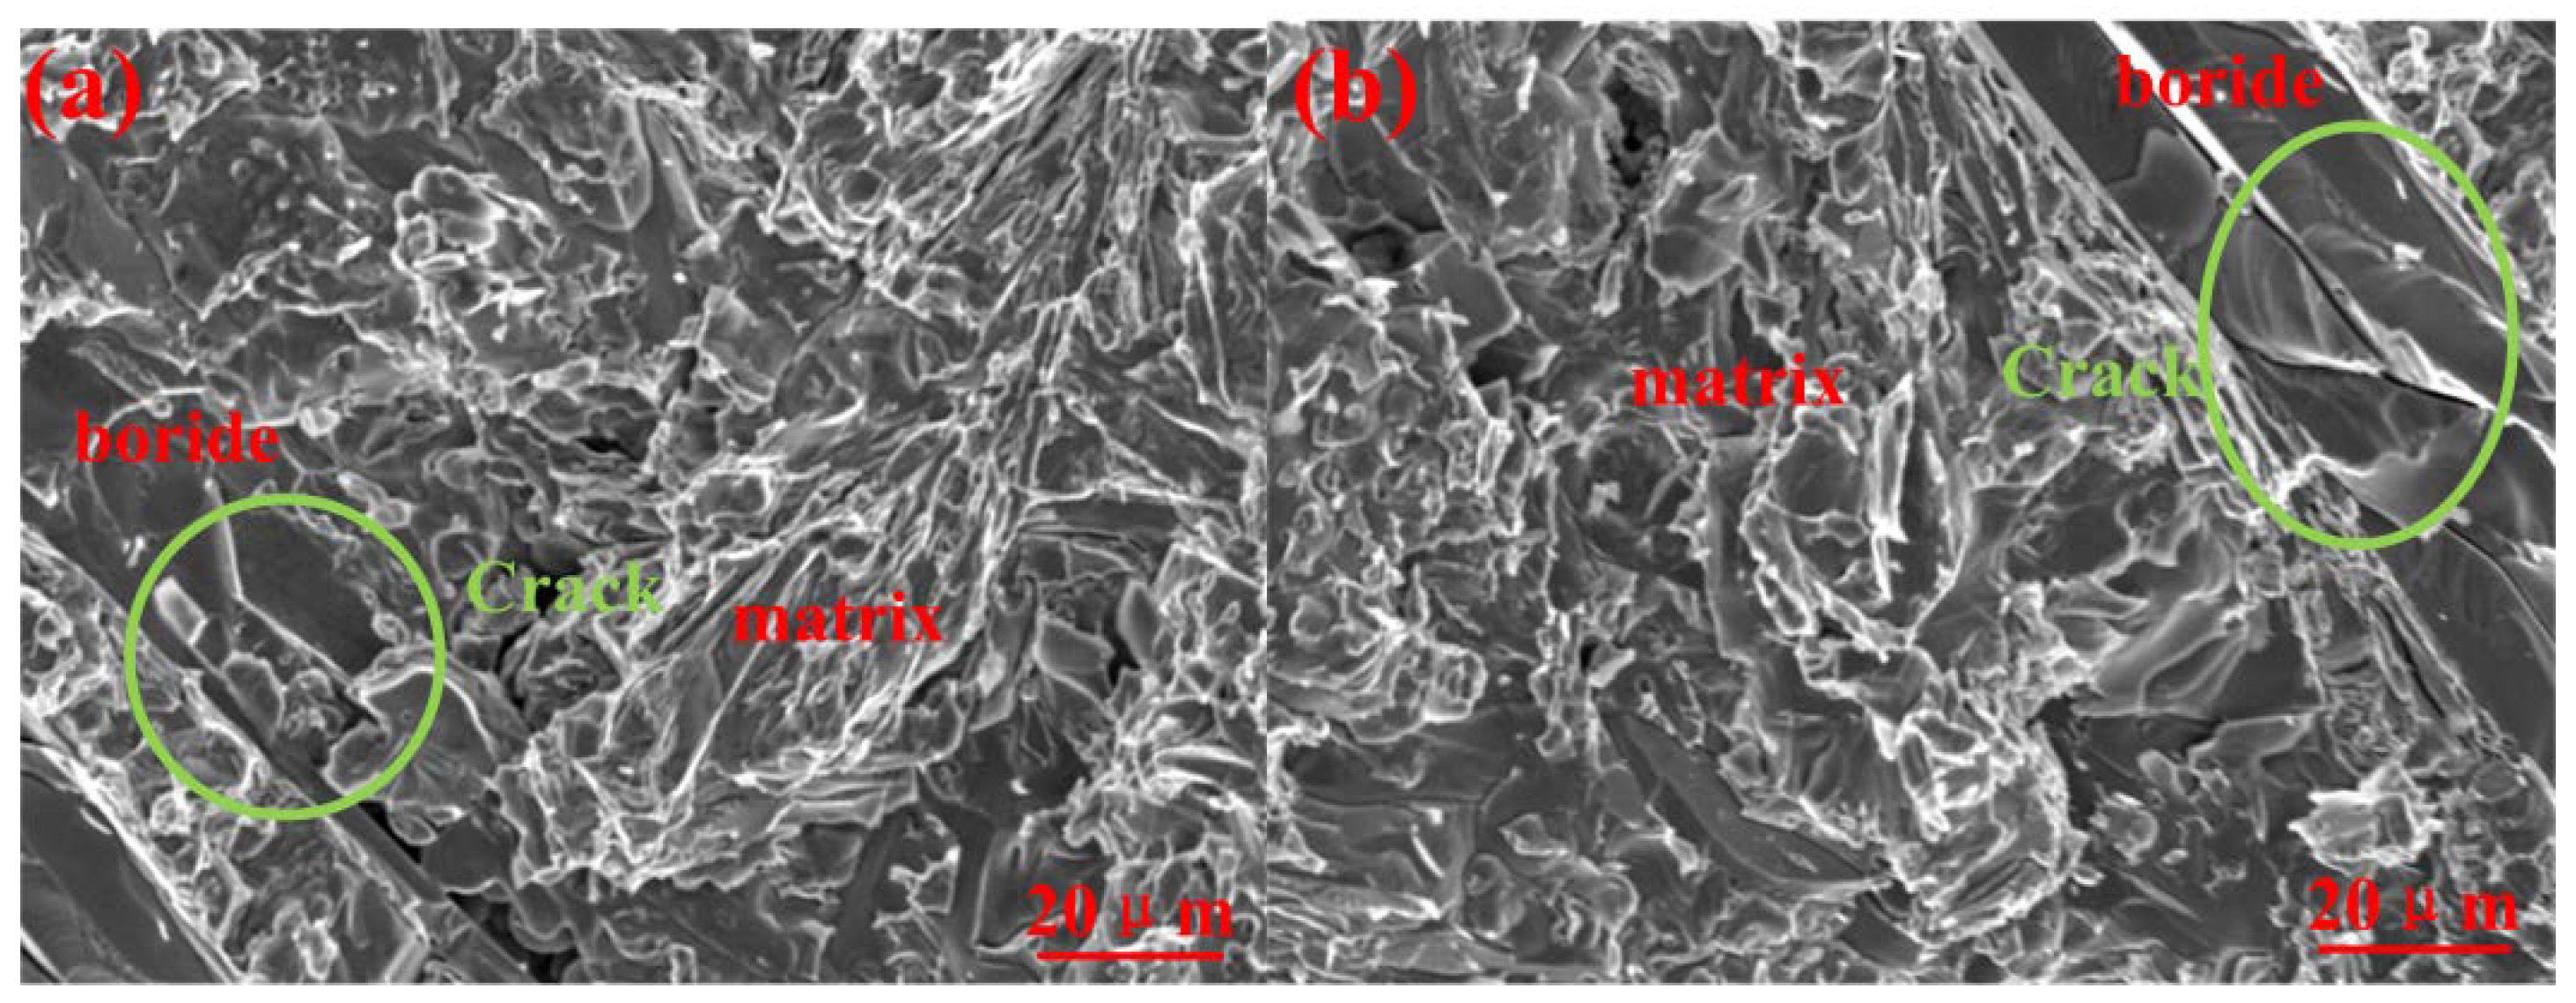
3.3. Mechanical Properties

The mechanical properties of A1 and A2 are shown in Table 4. The hardness was the mean measured value at five different positions, and the impact toughness was the mean value of three measurements. After the thermal treatment, the hardness decreased, and the impact toughness increased. The bulk hardness depended on the micro hardness of M2B and the matrix. This is because of the element saturation of the matrix (Table 3) declined upon the precipitation of M23(B,C)6, which decreased the micro hardness of matrix. Meanwhile, the micro hardness of M2B remained basically the same, resulting in the reduction of bulk hardness. However, the amount of precipitated M23(BC)6 was small (2.2%), resulting in small changes in hardness. Figure 5 shows the impact fracture morphology of A1 and A2. It can be seen that the fracture includes the brittle fracture of borides and the quasi-cleavage of the matrix. By comparing the degree of cracking of boride, we found that A1 was smaller than A2. Because the hardness of M2B remains basically same before and after the thermal treatment, the matrix changes were the main cause of the crack differences. The A1 sample has higher matrix hardness and thereby possesses stronger resistance to plastic deformation, which offers better fixation and support to borides and inhibits the expansion of the boride cracks. The A2 sample has higher plastic deformation ability, which consumes more energy in the crack expansion. Therefore, it has higher impact toughness.

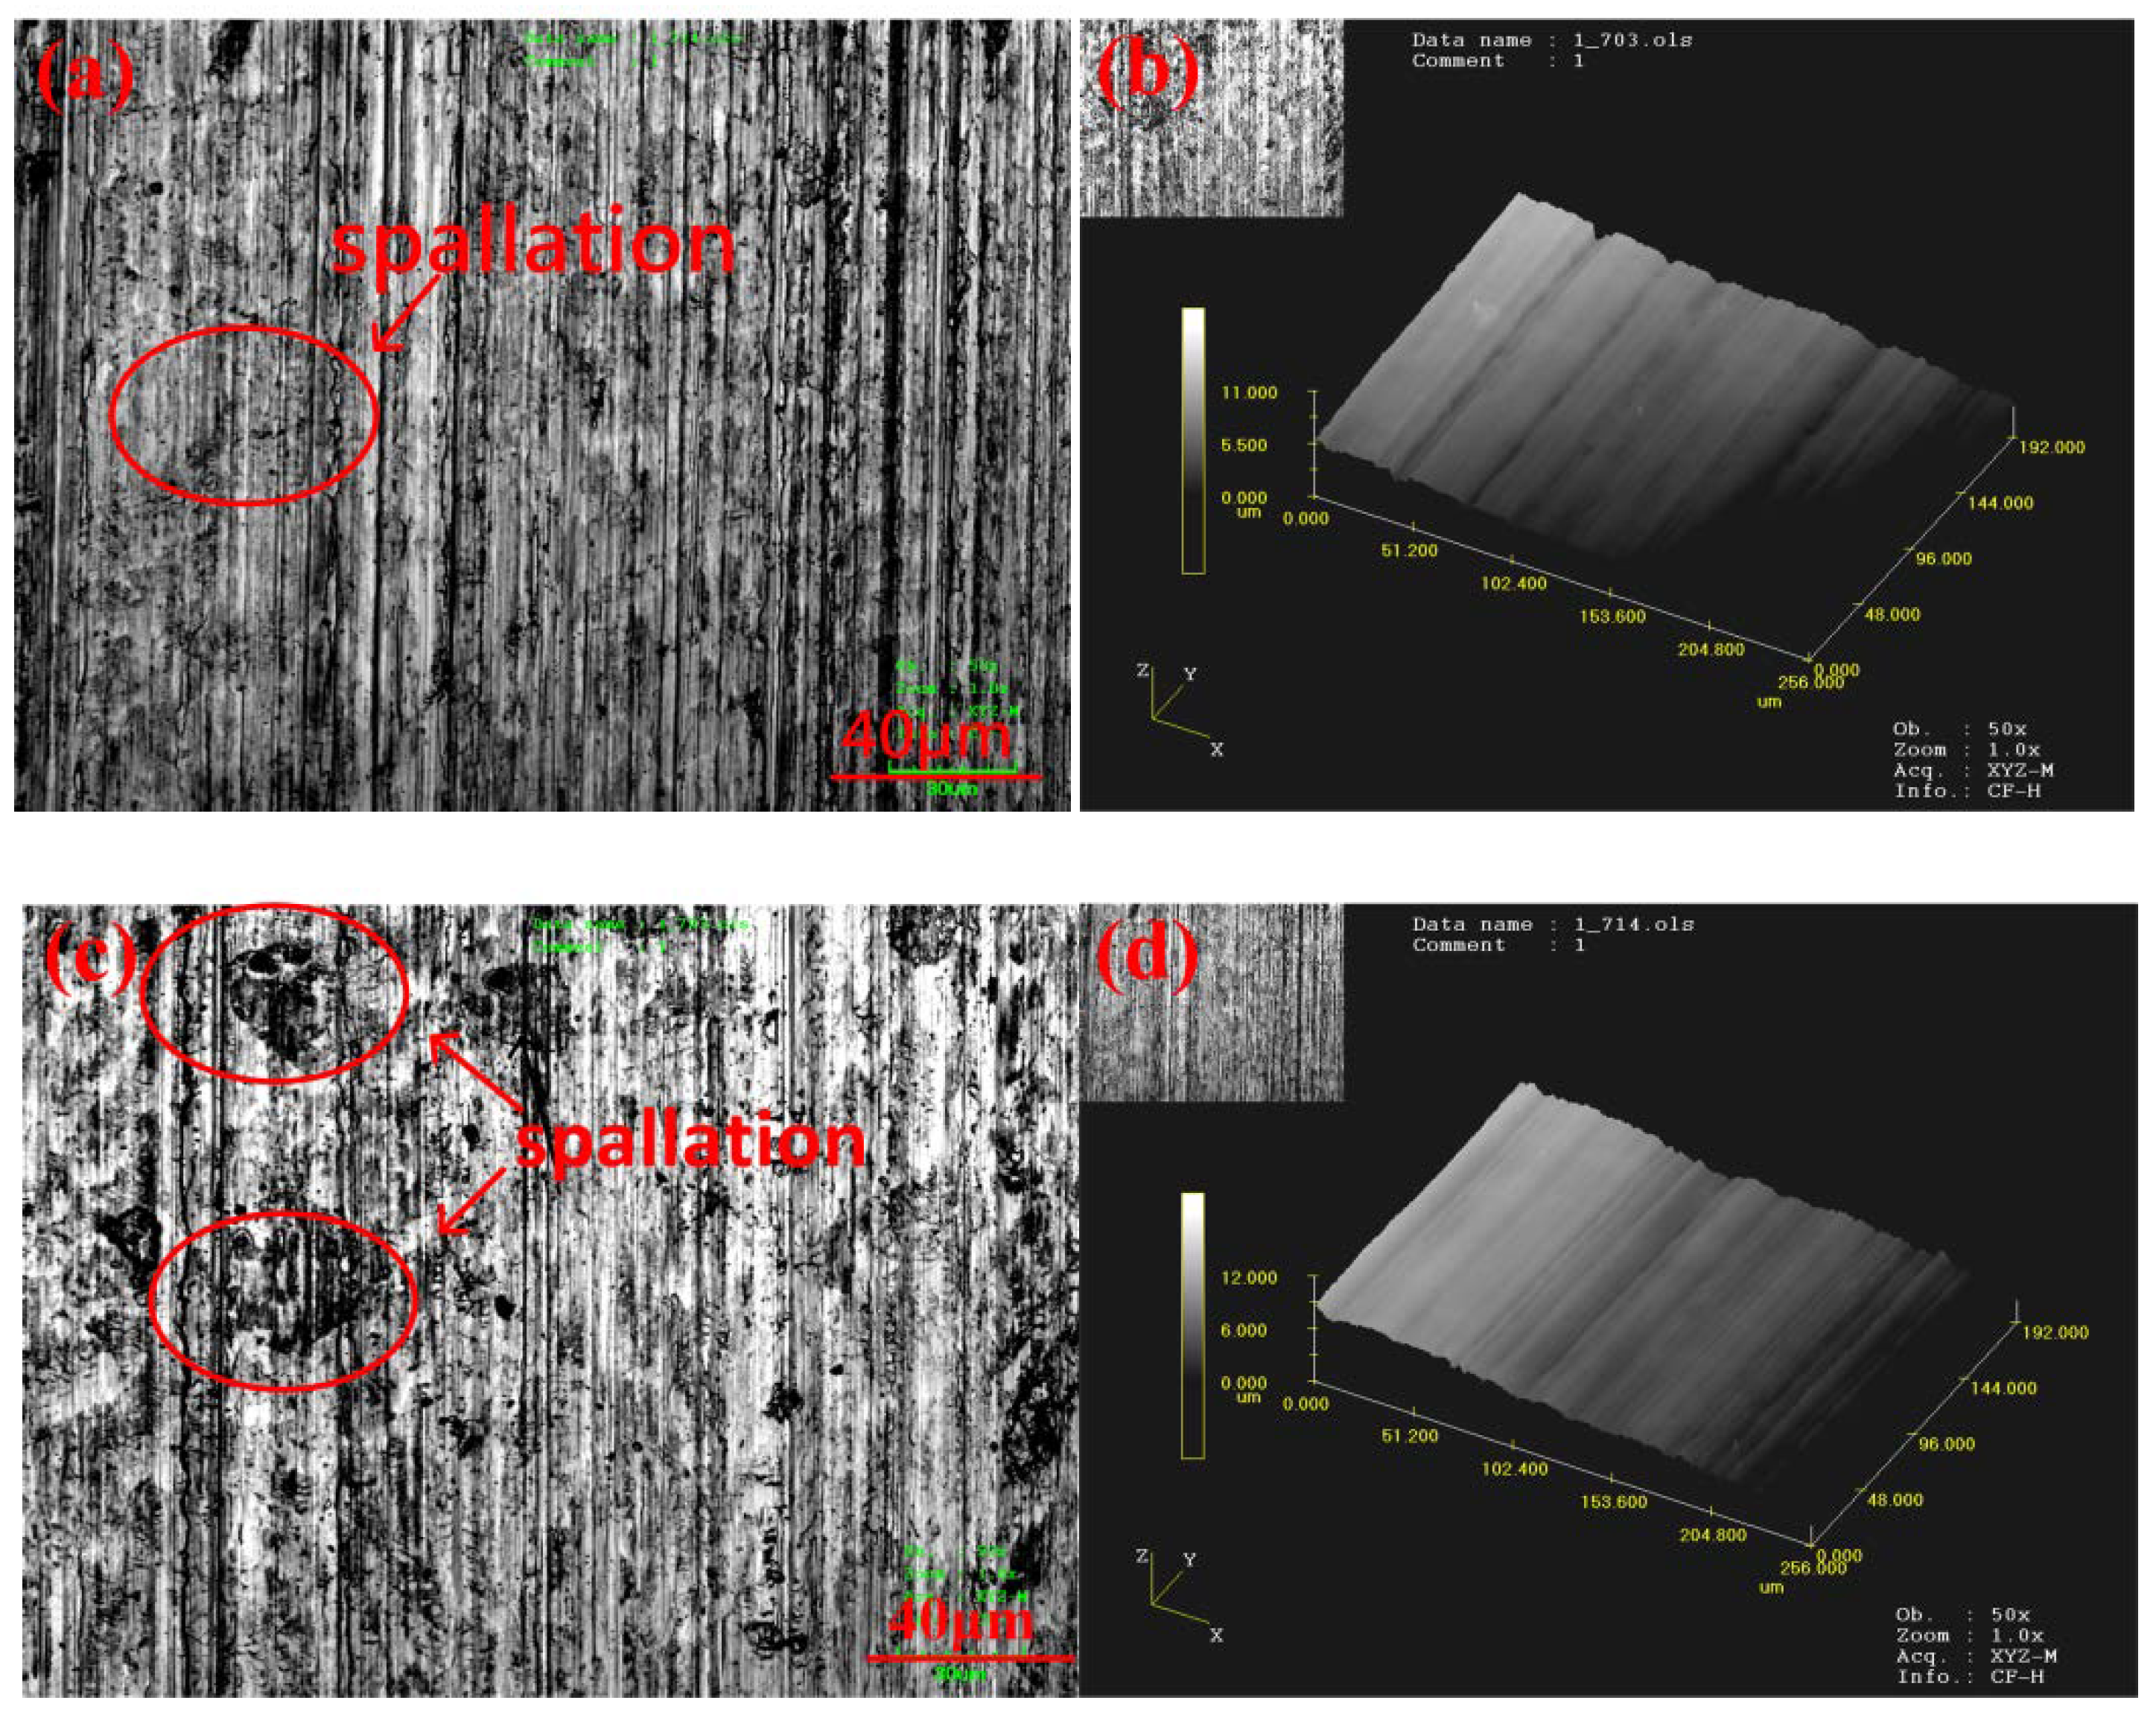
3.4. Wear Resistance

The plane wearing morphology and laser three-dimensional (3D) morphology of A1 and A2 are shown in Figure 6. The wearing morphology has evident furrows, and ploughing was the wearing mechanism. In the process of two-body wearing, the wearing of the material with high plastic deformation ability was controlled by the deformation mechanism, while the wearing of the material with low plastic deformation ability was dominated by the ploughing mechanism. Because the alloy material has high hardness and develops no plastic deformation after wearing, ploughing was the dominant wearing mechanism.
The profiles of the abraded surfaces of all the samples were measured by a 3D laser scanning microscope. The surface roughness of the sample’s worn surface and weight loss are listed in Table 5.
Ra is the arithmetic mean surface roughness. It was the arithmetic mean of the absolute value of the profile deflection distance in the sampling length. Rt is the maximum roughness height. It was the maximum peak and valley heights compared with the sampling length. Rz is the mean peak and valley depth. It was the sum of the mean of five maximum profile peaks and the mean of five maximum valley depths.
Compared with A2, A1 has a smoother surface (Ra) and shallower furrows (Rz). This was because the M23(B,C)6 phase precipitated after the thermal processing, thus decreasing the matrix hardness and wear resistance. The wearing loss of A2 was higher than that of A1. Wearing loss mainly occurs in the matrix and hard phase. The higher weight loss of the matrix of A2 than that of A1 was attributed to its poorer matrix hardness. The higher weight loss in the hard phase of A2 was caused by the increased spallation (Figure 6). This was because the precipitation of the M23(B,C)6 phase and the solid solution of the edge atom of the M2B phase after the thermal process form the concentration gradient of elements, which weakens the support of the matrix to M23(B,C)6 and M2B. On the other hand, the edges of these phases incur residual stresses after the thermal process and thereby were easily destroyed, causing fall-offs from the hard phase.

4. Conclusions

The microstructure, mechanical performances, and wearing resistance of the prepared Fe-Cr-B alloy with a composition of 3 wt% B-0.6 wt% C-16 wt% Cr were studied. The following major conclusions could be drawn:
(1) Microstructure of the as-cast Fe-Cr-B alloy was mainly composed of lath martensite and the hard-phase M2B. The M2B phase was mainly presented in clavate, reticular, or clustering morphologies. After the thermal treatment, a few circular M23(B,C)6 phases were precipitated from the matrix.
(2) The M2B chemical formula was FeCr0.89Mn0.14(B,C), which had a BCT structure, while the secondary boride M23(B,C)6 chemical formula was Fe17.97Cr4.13Mn1.14(B,C)6 with a FCC structure.
(3) There was no significant difference in the composition, morphology, and volume fraction of M2B after the thermal treatment. The element saturation in the matrix decreased, leading to the precipitation of M23(B,C)6, which resulted in the decrease in bulk hardness and increase in the impact toughness.
(4) The wearing results demonstrated that the ploughing effect was the main wearing mechanism. After the thermal treatment, the hardness of the alloy was decreased, which led to decreased wear resistance.

Author Contributions

Methodology, G.D. and Y.R.; Resources, G.D.; Supervision, Y.R.; Original draft of manuscript, J.D.; Review and editing of manuscript, J.D. and X.Q.

Funding

This research received no external funding.

Acknowledgments

We thanks to Teacher Yi Wang of Changchun Institute of Technology analysis Center for supporting the help in experiment.

Conflicts of Interest

The authors declare no conflict of interest.

References

  1. Jonathan, L.; Arne, R.; Werner, T. Gefügeausbildung und mikromechanische Eigenschaften einzelner Phasen von untereutektischen Fe-C-B Legierungen. Int. Metallogr. Leoben 2014, 14, 283–288. [Google Scholar]
  2. Berns, H. Hartlegierungen und Hartverbundwerkstoffe; Springer: Berlin/Heidelberg, Germany, 1998. [Google Scholar]
  3. Yi, D.; Xing, J.; Ma, S.; Fu, H.; Li, Y.; Chen, W.; Yan, J.; Zhang, J.; Zhang, R. Investigations on microstructures and two-body abrasive wear behavior of Fe-B cast alloy. Tribol. Lett. 2012, 45, 427–435. [Google Scholar] [CrossRef]
  4. Zhang, J.; Gao, Y.; Xing, J.; Ma, S.; Yi, D.; Yan, J. Effects of chromium addition on microstructure and abrasion resistance of Fe-B cast alloy. Tribol. Lett. 2011, 44, 31–39. [Google Scholar] [CrossRef]
  5. Sen, U.; Sen, S.; Koksal, S.; Yilmaz, F. Fracture toughness of borides formed on boronized ductile iron. Mater. Des. 2005, 26, 175–179. [Google Scholar] [CrossRef]
  6. Meric, C.; Sahin, S.; Backir, B.; Koksal, N.S. Investigation of the boronizing effect on the abrasive wear behavior in cast irons. Mater. Des. 2006, 27, 751–757. [Google Scholar] [CrossRef]
  7. Yu, L.G.; Chen, X.J.; Khor, K.A.; Sundararajan, G. FeB/Fe2B phase transformation during SPS pack-boriding: Boride layer growth kinetics. Acta Mater. 2005, 53, 2361–2368. [Google Scholar] [CrossRef]
  8. Taylor, K.A.; Hansen, S.S. The boron hardenability effect in thermomechanically processed, direct-quenched 0.2 Pct C steels. Metall. Trans. 1990, 21, 1697–1708. [Google Scholar] [CrossRef]
  9. Röttger, A.; Lentz, J.; Theisen, W. Boron-alloyed Fe-Cr-C-B Tool Steels—Thermodynamic Calculations and Experimental Validation. Mater. Des. 2015, 88, 420–429. [Google Scholar] [CrossRef]
  10. Lentz, J.; Röttger, A.; Theisen, W. Solidification and phase formation of alloys in the hypoeutectic region of the Fe-C-B system. Acta Mater. 2015, 99, 119–129. [Google Scholar] [CrossRef]
  11. Feng, X.; Jiang, Z.; Fu, H. Effects of Heat Treatment on Microstructure and Mechanical Properties of Cast Fe-B-C Alloy. J. Aeronaut. Mater. 2007, 27, 26–29. [Google Scholar]
  12. Ma, S.; Xing, J.; Liu, G.; Yi, D.; Fu, H.; Zhang, J.; Li, Y. Effect of chromium concentration on microstructure and properties of Fe-3.5B alloy. Mater. Sci. Eng. A 2010, 527, 6800–6808. [Google Scholar] [CrossRef]
  13. Jian, Y.; Huang, Z.; Xing, J.; Guo, X.; Wang, Y.; Lv, Z. Effects of Mn addition on the two-body abrasive wear behavior of Fe-3.0 wt% B alloy. Tribol. Mater. 2016, 103, 243–251. [Google Scholar] [CrossRef]
  14. Huang, Z.; Xing, J.; Guo, C. Improving fracture toughness and hardness of Fe2B in high boron white cast iron by chromium addition. Mater. Des. 2010, 31, 3084–3089. [Google Scholar] [CrossRef]
  15. Jin, H.W.; Park, C.G.; Kim, M.C. In situ TEM heating studies on the phase transformation of metastable phases in Fe-Cr-B alloy spray coatings. Mater. Sci. Eng. A 2001, 304, 321–326. [Google Scholar] [CrossRef]
  16. Guo, C.; Kelly, P.M. Boron solubility in Fe-Cr-B cast irons. Mater. Sci. Eng. A 2003, 352, 40–45. [Google Scholar] [CrossRef]
  17. Liu, Z.; Chen, X.; Li, Y.; Hu, K. Effect of Chromium on Microstructure and Properties of High Boron White Cast Iron. Metall. Mater. Trans. A 2008, 39, 636–641. [Google Scholar] [CrossRef]
  18. Chen, X.; Li, Y.; Zhang, H. Microstructure and mechanical properties of high boron white cast iron with about 4 wt% chromium. J. Mater. Sci. 2011, 46, 957–963. [Google Scholar] [CrossRef]
  19. Fu, H.; Xiao, Q.; Kuang, J.; Jiang, Z.; Xing, J. Effect of rare earth and titanium additions on the microstructures and properties of low carbon Fe-B cast steel. Mater. Sci. Eng. A 2007, 466, 160–165. [Google Scholar] [CrossRef]
  20. Goldfarb, I.; Kaplan, W.D.; Ariely, S.; Bamberger, M. Fault-induced polytypism in (Cr,Fe)2B. Philos. Mag. A 1995, 72, 963–979. [Google Scholar] [CrossRef]
  21. Lin, Y.; Jian, H. Borides in microcrystalline Fe-Cr-Mo-B-Si alloys. J. Mater. Sci. 1991, 26, 2833–2840. [Google Scholar]
  22. Christodoulou, P.; Calos, N. A step towards designing Fe-Cr-B-C cast alloys. Mater. Sci. Eng. A 2001, 301, 103–117. [Google Scholar] [CrossRef]
Figure 1. XRD patterns of the as-cast and heat-treated Fe-Cr-B-C alloy.
Metals 08 00530 g001
Figure 2. Microstructure of Fe-Cr-B-C alloy: (ac) and (e) show the as-cast A1, while (d,f) show the heat-treated A2.
Metals 08 00530 g002
Figure 3. The volume fraction of borides.
Metals 08 00530 g003
Figure 4. Bright-field TEM micrographs and corresponding selected area diffraction patterns of the matrix, M2B, and M23(B,C)6. (a) A1 sample; and (b) A2 sample.
Metals 08 00530 g004
Figure 5. Fracture morphology after the test of impact toughness. (a) the A1 sample; and (b) the A2 sample.
Metals 08 00530 g005
Figure 6. Flat and three-dimensional (3D) laser morphologies of the worn surfaces of the A1 and A2 samples: (a,b) show the A1 sample; while (c,d) show the A2 sample.
Metals 08 00530 g006
Table 1. Chemical composition of the Fe-Cr-B-C alloy (wt%).
AlloyCCrMnMoBSiSPNiCu
Fe-Cr-B-C0.6415.891.210.402.840.770.010.011.160.03
Table 2. Compositions of the M2B and M23(B,C)6 measured by using an electronic probe microanalyzer (EPMA).
PhaseElement (at %)Calculated Formula
BCFeMnCrCr/Fe
M2B27.3(±0.6)4.8(±0.3)35.0(±1.2)4.4(±0.3)28.5(±0.8)0.89FeCr0.89Mn0.14(B,C)
M23(BC)619.2(±0.5)1.3(±0.3)61.5(±1)3.9(±0.3)14.1(±1)0.23Fe17.97Cr4.13Mn1.14(B,C)6
Table 3. Compositions of the martensite measured by using EPMA.
MatrixBCCrMnSiFeB/C
A11.16(±0.1)2.12(±0.2)19.57(±0.6)2.17(±0.3)1.63(±0.2)73.35(±1)0.54
A20.99(±0.1)1.98(±0.2)19.33(±0.6)2.01(±0.3)1.59(±0.2)74.99(±1)0.50
Table 4. Mechanical properties of the as-cast and heat-treated Fe-Cr-B alloys.
Mechanical PropertiesA1A2
Bulk hardness/HRC58.6(±1)57.2(±1)
Microhardness of matrix(martensite)/HV568.3(±20)516.5(±20)
Microhardness of boride/HV1548(±10)1531(±10)
Impact toughness/J∙cm−24.2(±0.4)5.0(±0.4)
Table 5. Surface profile and weight loss of the Fe-Cr-B alloys after the abrasion test.
SimpleRaRtRzWear Loss (mg)
A11.38(±0.1)14.32(±0.5)11.5(±0.5)24(±2)
A21.50(±0.1)15.24(±0.5)13.2(±0.5)37(±2)

