Article

Research on Surface Roughness of AlSi10Mg Parts Fabricated by Laser Powder Bed Fusion

1
School of Materials Science and Engineering, North University of China, Taiyuan 030051, China
2
School of Mechanical Engineering, North University of China, Taiyuan 030051, China
*
Authors to whom correspondence should be addressed.
These authors contributed equally to this work.
Metals 2018, 8(7), 524; https://doi.org/10.3390/met8070524
Submission received: 12 June 2018 / Revised: 2 July 2018 / Accepted: 4 July 2018 / Published: 6 July 2018

Abstract

:
AlSi10Mg cubes were fabricated with the laser powder bed fusion (LPBF) process, using different exposure times and scan strategies to gain insight into the effect of energy density and part orientation on surface roughness. The results showed that, with increasing energy density, the five-face roughness first decreased and then increased, whereas the top roughness increased slightly. Moreover, considerable differences in roughness appeared for the different faces. A good surface quality was obtained at 175 J/mm3 and 200 J/mm3 when the rotation start angle and rotation increment angle were set as 0 in meander scan mode. The roughness variation was caused by the scan direction, gas flow direction, and wiper movement direction. The scan strategies with rotation increments of 90° effectively narrowed the variation. These results support direct part orientation and placement and can guide users to further reduce roughness through process optimisation or simplification of post-processing procedures.

1. Introduction

Over the last decade, the laser powder bed fusion (LPBF) technique, one of the most promising additive manufacturing (AM) processes, has emerged to produce end-use parts or customised products with complex shapes of several structural alloys [1]. Moreover, recent literature has demonstrated that LPBF can also be used to manufacture metal matrix composites. Examples are good toughness Ti-TiB composite materials [2,3], highly dense bulk Cu–10Sn bronze [4], high-strength Al85Nd8Ni5Co2 alloy [5], and high elastic modulus and mechanical strength CNTs/AlSi10Mg composites [6]. Since the geometry of the product is not confined by tools or moulds, complex parts can be fabricated directly from its computer-aided design data, which also allows the potential for innovating product manufacturing methods [7,8]. In addition, there are other important advantages, including a high usage rate of material, topological optimisation [9], and the possibility to recycle unmelted powder [10].
Although the LPBF process has many advantages when compared to conventional processes, limited surface quality is one of the major drawbacks of LPBF-produced parts. Traditional mechanical methods, such as milling and grinding, have arithmetic mean surface roughness (Ra) values of less than 1–2 μm. However, the Ra value of LPBF parts is usually more than 10 μm [11]. In many applications, the surface roughness is significantly critical and requires a fine surface to avoid premature failure from surface-initiated cracking. Therefore, LPBF-processed parts generally require post-processing operations to obtain an excellent part surface finish, which eventually leads to additional time and thus delays part completion [12].
Researchers have investigated the surface quality of LPBF parts. Han et al. [13] investigated the surface roughness of LPBF-produced AlSi10Mg inclined struts. They found that low surface roughness and high dimensional accuracy, as well as high density, can be achieved simultaneously by using high scanning speed. Boschetto et al. [14] developed a model to predict the roughness, and the model took into account the staircase effect and actual defects (balling and satellites). The experimental results demonstrated the validity of the model applied to a curved complex geometry. Wang et al. [15] studied the effect laser energy density on surface roughness. The results showed that excessively high laser energy density may lead to a balling effect, while insufficient laser energy density tends to produce defects, such as porosity and microcrack, and then affect surface roughness. Mohammadi et al. [16] reduced surface roughness by applying specific process parameters to the up-skin layers. A higher energy density and lower beam offset were applied to the up-skin layers (the last 3–10 layers), which led to 3D-printed aluminium alloys with a very low surface roughness and unaffected part core properties. They attributed this phenomenon to surface tension due to the variations in the thermal behaviour of the melt pool.
These studies and models investigated the influence of process parameters on surface roughness. However, to date, there is little research on the top and side surface roughness. Furthermore, there is no apparent literature investigating the significant different roughness existing between different surfaces. In this study, several samples were manufactured with different exposure times (ET) and scan strategies using the process of LPBF. The effects of energy density on surface roughness were determined, and the differences in surface roughness were analysed in detail, aimed to enrich the database. This will help to further decrease surface roughness and narrow the variation in roughness by directing users to place parts in the most appropriate orientation.

2. Experimental

The AlSi10Mg powder used in this study was provided by LPW Technology. The average particle size was 45 μm, obeying normal distribution and having good flowability. The test cubes of 10 × 10 × 10 mm were fabricated by a Renishaw AM400 laser melting machine. Two samples were produced for each process parameter. The machine is equipped with a modulated ytterbium fibre laser with a wavelength of 1070 nm. The laser moves step by step with the specific ET and point distance (PD) on the powder bed. The parameter ET is the time at which each point is radiated by the laser before jumping to the next point, while the PD indicates the distance between adjacent points. In general, the scanning speed can be approximatively determined by [15]:
v = P D E T
The process parameters employed are listed in Table 1, with the ET employed varying from 100 μs to 180 μs at increments of 20 μs. The meander scan mode was used, with different rotation start angles (θ1) and rotation increment angles (θ2), as shown in Figure 1. The LPBF process was conducted under an argon atmosphere with an oxygen level below 0.2%. As shown in Figure 2, the gas enters the build chamber from the lower right-hand side and exits from the lower left-hand side (e.g., the minus x-direction), which generates a gas circuit. The raw powder is flatted uniaxially by the wiper in the minus y-direction. The building direction is along the z-direction.
The energy density is defined as the energy per volume of printed material, per Cherry et al. [17]. The formula is calculated as follows:
Energy   density [ J mm 3 ] = P ( E T S * P D ) h
where P is the laser power; S is the hatching space; and h is the layer thickness. According to this formula, the energy density in the LPBF process is 125, 150, 175, 200, 225, 250, and 275 J/mm3.
In this study, the JB-4c stylus type roughness tester, with a measurement accuracy of 0.4 μm, was used to measure Ra. When measuring the Ra, the Gaussian filter was applied. According to ISO 5436, the sampling length was 0.8 mm, the evaluation length was 4 mm, and measurement speed was 0.5 mm/s. The measurements were performed 10 times per surface on the top and four sides, as shown in Figure 2. On top face, measurements were performed five times along the x-direction and five times along the y-direction; on back and front sides, measurements were performed five times along the x-direction and five times along z-direction; on left and right sides, measurements were performed five times along the y-direction and five times along the z-direction. The 10 measured results for each surface were then averaged to obtain the final Ra value and its standard deviation. Besides, the part’s surface topography was captured by an ultradeep three-dimensional microscope VHX-600. The relative density was measured based on Archimedes’ principle, and each sample was measured three times and then averaged.

3. Results

To explore roughness evolution under different energy inputs, Case 1 was employed, and the resulting top macro-morphologies are shown in Figure 3. When the ET increased from 100 μs to 160 μs, the top surface became smoother. When the ET exceeded 160 μs, the top surface changed slightly but micro-balling occurred. The changes in Ra with different ET values is presented in Figure 4. The Ra value first decreased and then increased. In particular, the Ra on the top and front faces increased slightly. At the same time, it was noted that a significant difference in Ra existed between the left and right faces, and the back and front faces (Figure 5). The values for the left side were greater than those for the right side, and values for the back were greater than those for the front. When the ET was within the range of 140–160 μs, corresponding to an energy density from 175 J/mm3 to 200 J/mm3, the minimum Ra was attained. The relative density changed inversely: when the ET was equal to 140 μs, the relative density reached its maximum (97.5%).
In Case 1, the appropriate energy density was obtained by optimising the surface roughness, thus improving the surface quality. However, a considerable difference still existed on various surfaces. Thus, the experiments (Case 1, Case 2, and Case 3) were further performed using an optimised process (ET = 140 μs and PD = 80 μm). The change in side-surface Ra is presented in Figure 5 and Figure 6. It can be seen that, regardless of which case was selected, the Ra on the top was lower than that on the side faces, and the Ra on the back was larger than that on the front. At the same time, the Ra on the left was larger than that on the right (Figure 5). It is important to note that the difference between the left and the right was greater than that between the back and the front when Case 1 (θ1 = 0°, θ2 = 0°) was used, while in Case 2 (θ1 = 90°, θ2 = 0°), the difference between the left and the right was less than that between the back and the front. Moreover, when the scan strategy was Case 3 (θ1 = 90°, θ2 = 90°), the difference among the five faces was smaller.

4. Discussion

4.1. The Effects of Energy Density on Roughness

During the LPBF process, the quality of the generated part strongly depends on the stability of the melting process. The stability of the melt pool directly influences the shape of the melt pool and mechanical properties of the final parts [18]. Poor wettability is caused by insufficient energy input, which results in poor metallurgical bonding and self-balling effects so that some pores and cracks remain after alloy solidification. Under poor overlapping conditions, as shown in Figure 6, the unmelted particles remain in between adjacent tracks and pile onto a local, larger layer after the next recoating phase. This results in imperfect fusion with the previously solidified layer and ultimately decreases the surface quality. While the fusion interlayer in this area lacks sufficient strength and can easily be removed by the wiper in the following layer, the surface will be worse. Li et al. [19] found that when the cooling rate of the melt pool is larger and the liquid lifetime is shorter at a low energy density, the lack of fusion pores and balling phenomenon are easily formed during the LPBF process. The same results were conducted by Ding et al. [15]. They found that if the energy density is higher (until material vaporisation significantly increases), the maximum temperature of the melt pool also increases, which leads to a longer lifetime of the melt pool, good wettability and flowability, more liquid infiltrates into the powder gaps, and defects are eliminated. Gu et al. [20] reported that a higher laser energy density promotes a higher temperature of the melt and better surface tension and wettability, which is beneficial to the formation of a stable melt pool and smooth track surface. Under these circumstances, parts with high surface quality accompanied by nearly full density will be obtained. When excessive energy density is inputted, material may overheat and evaporate to form a reduced working height. As multi-layered parts were produced, a lower height results in a constantly elevated powder thickness. Until the process is unable to fully melt, the same result occurs and influences surface quality (Figure 7). At the same time, scatter occurs with material evaporation and results in the production of parts with a significant amount of micrometre-scaled balls [21]. The balls tend to fall on either side of the melt pool rather than settling on the top surface, which leads to a slight increase in Ra of the top face (Figure 3c) but a significant increase in Ra of the sides. Wu et al. observed that the melt pool overlap conditions changed from conduct mode to keyhole mode with increasing laser energy density. In the keyhole mode, the melt gasified and then deepened the melt pool. Gas pores were induced due to the deeper heat-affected zone [22], hence, the surface roughness increased.
As the energy density increased from 125 to 175 J/mm3, the relative density increased from 94.1% to 97.5%; when further increasing energy density, the relative density was diminished. When the laser energy density was 225 J/mm3, the relative density was 96.95%. An inverse change was observed between roughness and relative density in LPBF-processed AlSi10Mg, which is accordant with chrome–cobalt alloy [23] and 316 stainless steel [24] produced by LPBF. Mumtaz et al. [25] discovered that reduced scan speed, e.g., increased energy density, reduced top surface roughness but increased side roughness. In this study, by reducing the scan speed (i.e., increasing the ET), the variation trend in the top surface roughness was in accordance with that of the sides; the Ra first decreased, then increased (Figure 3 and Figure 4). Similar results for the top Ra were also obtained by Han et al. [13]. It is thought that the balling phenomenon is alleviated by increasing the energy density (the energy density less than the threshold) and, therefore, the energy density influences the characteristic of melt pool and thus affects the roughness.

4.2. The Effects of Part Orientation on Roughness

Although the optimised process effectively reduced the LPBF-produced part’s roughness, the differences in various surfaces were still not eliminated. The phenomenon of the Ra on the top face being far less than the side’s has also been found in LPBF-produced parts with an angle of inclination [13,26], and it is ascribed to the “filleting effect” and “stair stepping effect”. In the LPBF process, the hatch offset is usually set to decrease porosity, but this also causes stairs on the sides between interlayers. When parts are fabricated vertically, sufficient quantities of powder are absorbed and adhere to the lower surface melt pool, as shown in Figure 8, resulting in a rough side. In Cases 1 and 2, the scan lines started from the left face and the back face, respectively, and, correspondingly, end at the right face and front face, respectively. At the beginning of scanning, the laser heat cannot dissipate in a short time due to a lower thermal conductivity. A large quantity of powder absorbs heat and adheres to the melt pool, causing a higher Ra on the left in Case 1 and on the back in Case 2. However, in Case 2 and Case 3, the differences between the left and the right still exist but appear to have decreased. Anwar et al. [27] discovered that splash—the spattered powder—is carried into the laser beam path by the gas flow, which leads to an incomplete melting of the powder, and, consequently, lowers the ultimate tensile strength of the parts. As shown in Figure 9, under the action of gas flow velocity from the right to the left, the spattered powder quickly fell, and was distributed at the left edge of the cube parts (the white box). As a result of more inclusions and oxide in the spattered powder [27], the spattered powder possessed a high melting point, which was half melted and stuck on the left side. The powder was absorbed into melt pool, which led to the balling due to poor wettability. An increasing gas flow velocity may relieve this drawback. If the scan line starts from the left at the maximum temperature, the dimensions and liquid lifetime of the melt pool at this position are larger, aggravating the formation of balling; the Ra will be enlarged by the scanning strategy with a rotation increment angle of 0° and rotation start angle of 0°. Besides, the difference between the back and the front was still found in Case 1 and Case 3 and is thought to be caused by the pressure effect by the wiper on the back. When the wiper moves from the back to the front, the powder is compacted and the stacking density is increased: the direction of pressure is in lower front. After a new powder layer is spread out, when the laser radiated this area, a great deal of powder is absorbed into the melt pool in a short time, leading to more liquid. The melt liquid infiltrates the surrounding powder but fails to melt it sufficiently, resulting in an enhanced Ra on the back. If the scan line starts from the back, the Ra at this position will be enlarged by the scanning strategy with a rotation start angle of 90° and rotation increment angle of 0°.
The laser energy density and part orientation play a vital role in determining the surface roughness. In order to obtained good surface quality, designers need to consider the two factors. A complex face, which requires a good surface quality and is difficult to machine, serving as the back side or left side should be avoided. The scan line starting from this side can further increase the roughness. While the face is flat and easy to post-process, it can be treated as the back side and left side. Besides, an appropriate rotation increment angle is helpful to reduce roughness and decrease the roughness variation among different faces.

5. Conclusions

In this work, the effects of energy density and part orientation on roughness were studied by employing different exposure times and scan strategies for parts processed by LPBF. The scan strategies included: Case 1 with rotation start angle of 0° and rotation increment angle of 0°; Case 2 with a rotation start angle of 90° and rotation increment angle of 0°; and Case 3 with a rotation start angle of 0° and rotation increment angle of 90°.
The main results can be summarised as follows:
(1)
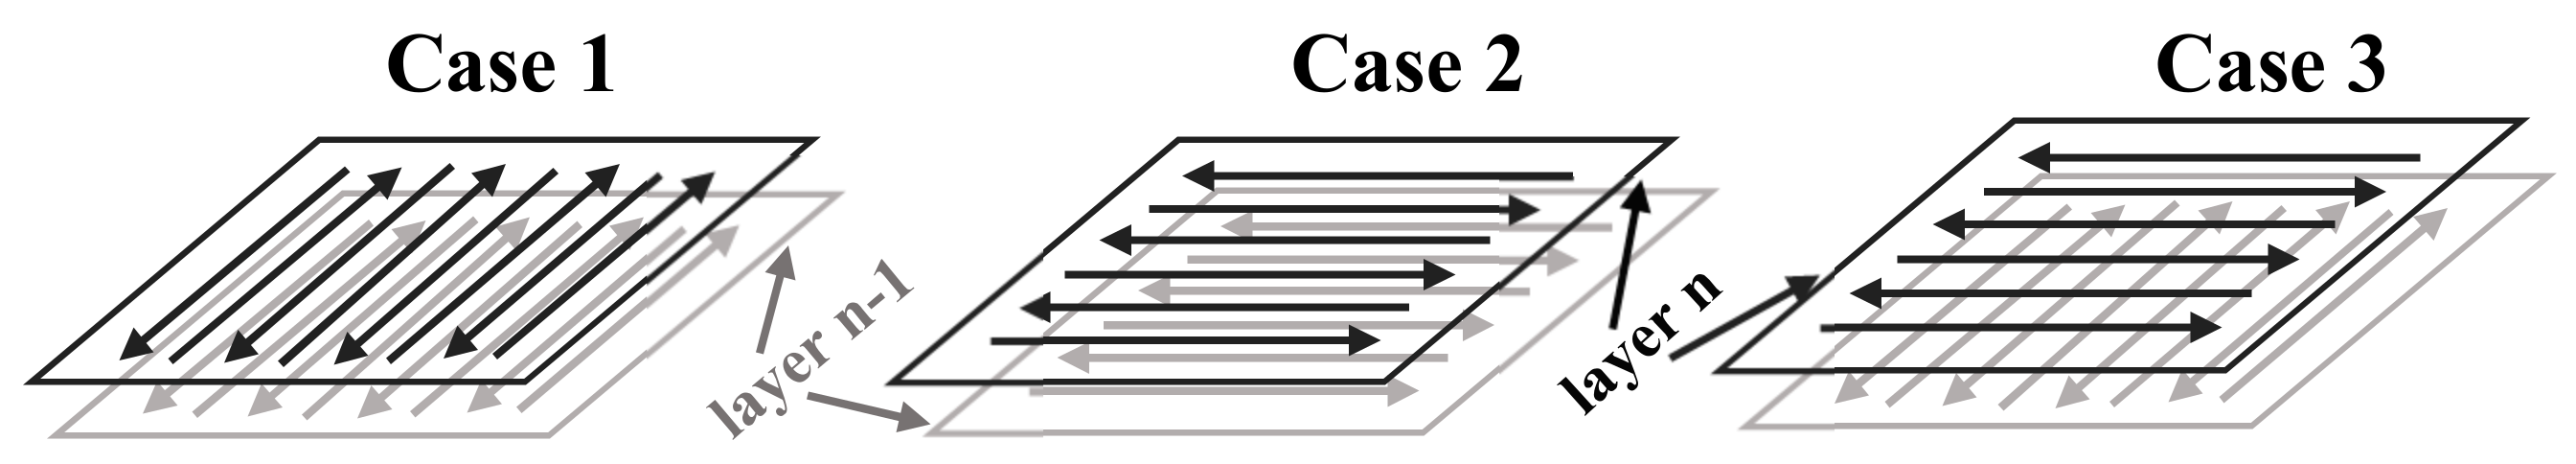
Under Case 1, the roughness of the AlSi10Mg parts fabricated by LPBF is relatively low (the minimum average Ra is 8.04 μm on the top surface) when the exposure time is 140–160 μs. Excessive and insufficient exposure times lead to increases in the roughness.
(2)
With increasing laser energy density, the surface roughness first decreases and then increases, and excessive or insufficient laser energy density leads to poor surface quality. However, when the energy density exceeds 200 J/mm3, the top roughness increases slightly.
(3)
The scan direction, gas flow direction, and the wiper movement direction have an important influence on the roughness of the parts. The side roughness from which the scan line starts is larger than the finishing side, and the splash is carried into the side of the parts by gas flow, increasing the side roughness. The side toward the initial position of the wiper has a larger roughness caused by the wiper pressure applied to it.
(4)
Although Case 3 effectively decreased the roughness variation among the five faces, the back and left roughness values are higher than other faces. If the part has complex surfaces, such surfaces should be placed to avoid very rough faces, and if the part has large plane easy for post-processing, the face should be placed on its left side and back side.

Author Contributions

P.B. and Z.L. conceived and designed the experiments. B.-Q.L. and Z.K. performed the experiments. B.-Q.L. prepared the manuscript and. Z.L. and B.L. revised it. All authors discussed the results and commented on the manuscript.

Funding

This research was funded by the National Natural Science Foundation of China (61475056).

Acknowledgments

The Authors thank the Tai Yuan 3D printing public service platform for the experimental activities.

Conflicts of Interest

The authors declare no conflict of interest.

References

  1. Tang, M.; Pistorius, P.C. Oxides, porosity and fatigue performance of AlSi10Mg parts produced by selective laser melting. Int. J. Fatigue 2017, 94, 192–201. [Google Scholar] [CrossRef]
  2. Attar, H.; Ehtemam-Haghighi, S.; Kent, D.; Dargusch, M.S. Recent developments and opportunities in additive manufacturing of titanium-based matrix composites: A review. Int. J. Mach. Tools Manuf. 2018, 133, 85–102. [Google Scholar] [CrossRef]
  3. Attar, H.; Ehtemam-Haghighi, S.; Kent, D.; Okulov, I.V.; Wendrock, H.; Bӧnisch, M.; Volegov, A.S.; Calin, M.; Eckert, J.; Dargusch, M.S. Nanoindentation and wear properties of Ti and Ti-TiB composite materials produced by selective laser melting. Mater. Sci. Eng. A 2017, 688, 20–26. [Google Scholar] [CrossRef] [Green Version]
  4. Scudino, S.; Unterdörfer, C.; Prashanth, K.G.; Attar, H.; Ellendt, N.; Uhlenwinkel, V.; Eckert, J. Additive manufacturing of Cu–10Sn bronze. Mater. Lett. 2015, 156, 202–204. [Google Scholar] [CrossRef]
  5. Prashanth, K.G.; Shahabi, H.S.; Attar, H.; Srivastava, V.C.; Ellendt, N.; Uhlenwinkel, V.; Eckert, J.; Scudino, S. Production of high strength Al85Nd8Ni5Co2 alloy by selective laser melting. Addit. Manuf. 2015, 6, 1–5. [Google Scholar] [CrossRef]
  6. Zhao, X.; Song, B.; Fan, W.; Zhang, Y.; Shi, Y. Selective laser melting of carbon/AlSi10Mg composites: Microstructure, mechanical and electronical properties. J. Alloys Compd. 2016, 665, 271–281. [Google Scholar] [CrossRef]
  7. Kumar, S. Selective Laser Sintering/Melting. Compr. Mater. Process. 2014, 26, 93–134. [Google Scholar] [CrossRef]
  8. Trevisan, F.; Calignano, F.; Lorusso, M.; Pakkanen, J.; Aversa, A.; Ambrosio, E.P.; Lombardi, M.; Fino, P.; Manfredi, D. On the Selective Laser Melting (SLM) of the AlSi10Mg Alloy: Process, Microstructure, and Mechanical Properties. Materials 2017, 10. [Google Scholar] [CrossRef] [PubMed]
  9. Seabra, M.; Azevedo, J.; Araújo, A.; Reis, L.; Pinto, E.; Alves, N.; Rui, S.; Mortágua, J.P. Selective laser melting (SLM) and topology optimization for lighter aerospace componentes. Procedia Struct. Integr. 2016, 1, 289–296. [Google Scholar] [CrossRef]
  10. Ardila, L.C.; Garciandia, F.; González-Díaz, J.B.; Álvarez, P.; Echeverria, A.; Petite, M.M.; Deffley, R.; Ochoa, J. Effect of IN718 Recycled Powder Reuse on Properties of Parts Manufactured by Means of Selective Laser Melting. Phys. Procedia 2014, 56, 99–107. [Google Scholar] [CrossRef]
  11. Wang, D.; Liu, Y.; Yang, Y.; Xiao, D. Theoretical and experimental study on surface roughness of 316L stainless steel metal parts obtained through selective laser melting. Rapid Prototyp. J. 2016, 22, 706–716. [Google Scholar] [CrossRef]
  12. Dai, D.; Gu, D. Tailoring surface quality through mass and momentum transfer modeling using a volume of fluid method in selective laser melting of TiC/AlSi10Mg powder. Int. J. Mach. Tools Manuf. 2015, 88, 95–107. [Google Scholar] [CrossRef]
  13. Han, X.; Zhu, H.; Nie, X.; Wang, G.; Zeng, X. Investigation on Selective Laser Melting AlSi10Mg Cellular Lattice Strut: Molten Pool Morphology, Surface Roughness and Dimensional Accuracy. Materials 2018, 11, 392. [Google Scholar] [CrossRef] [PubMed]
  14. Boschetto, A.; Bottini, L.; Veniali, F. Roughness modeling of AlSi10Mg parts fabricated by selective laser melting. J. Mater. Process. Technol. 2017, 241, 154–163. [Google Scholar] [CrossRef]
  15. Wang, L.; Wang, S.; Wu, J. Experimental investigation on densification behavior and surface roughness of AlSi10Mg powders produced by selective laser melting. Opt. Laser Technol. 2017, 96, 88–96. [Google Scholar] [CrossRef]
  16. Mohammadi, M.; Asgari, H. Achieving low surface roughness AlSi10Mg_200C parts using direct metal laser sintering. Addit. Manuf. 2018, 20, 23–32. [Google Scholar] [CrossRef]
  17. Cherry, J.A.; Davies, H.M.; Mehmood, S.; Lavery, N.P.; Brown, S.G.R.; Sienz, J. Investigation into the effect of process parameters on microstructural and physical properties of 316L stainless steel parts by selective laser melting. Int. J. Adv. Manuf. Technol. 2015, 76, 869–879. [Google Scholar] [CrossRef]
  18. Khoo, Z.X.; Liu, Y.; An, J.; Chua, C.K.; Shen, Y.F.; Kuo, C.N. A Review of Selective Laser Melted NiTi Shape Memory Alloy. Materials 2018, 11, 519. [Google Scholar] [CrossRef] [PubMed]
  19. Li, Y.; Gu, D. Parametric analysis of thermal behavior during selective laser melting additive manufacturing of aluminum alloy powder. Mater. Des. 2014, 63, 856–867. [Google Scholar] [CrossRef]
  20. Gu, D.; Shen, Y. Balling phenomena in direct laser sintering of stainless steel powder: Metallurgical mechanisms and control methods. Mater. Des. 2009, 30, 2903–2910. [Google Scholar] [CrossRef]
  21. Li, R.; Liu, J.; Shi, Y.; Wang, L.; Jiang, W. Balling behavior of stainless steel and nickel powder during selective laser melting process. Int. J. Adv. Manuf. Technol. 2012, 59, 1025–1035. [Google Scholar] [CrossRef]
  22. Weingarten, C.; Buchbinder, D.; Pirch, N.; Meiners, W.; Wissenbach, K.; Poprawe, R. Formation and reduction of hydrogen porosity during selective laser melting of AlSi10Mg. J. Mater. Process. Technol. 2015, 221, 112–120. [Google Scholar] [CrossRef]
  23. Zhao, J.; Qiu, Y.; Liu, F.; Chen, J. Research of Surface Roughness and Relative Density of SLM Medical Co-Cr Alloy. Appl. Laser 2014, 34, 524–527. [Google Scholar] [CrossRef]
  24. Liu, R. The Study on Surface Roughness of Metal Parts Fabricated by Selective Laser Melting and the Application on Non-Assembly Mechanisms; Youth China University of Technology: Guangzhou, China, 2014. [Google Scholar]
  25. Mumtaz, K.; Hopkinson, N. Top surface and side roughness of Inconel 625 parts processed using selective laser melting. Rapid Prototyp. J. 2009, 15, 96–103. [Google Scholar] [CrossRef]
  26. Bacchewar, P.B.; Singhal, S.K.; Pandey, P.M. Statistical modelling and optimization of surface roughness in the selective laser sintering process. Proc. Inst. Mech. Eng. 2007, 221, 35–52. [Google Scholar] [CrossRef]
  27. Anwar, A.B.; Pham, Q.-C. Selective laser melting of AlSi10Mg: Effects of scan direction, part placement and inert gas flow velocity on tensile strength. J. Mater. Process. Technol. 2017, 240, 388–396. [Google Scholar] [CrossRef]
Figure 1. Overview of the meander scan mode. In the three cases, the rotation start angle and rotation increment angle are 0°, 90°, 0° and 0°, 0°, 90°, respectively.
Metals 08 00524 g001
Figure 2. Indication of surface roughness measurements on blocks.
Metals 08 00524 g002
Figure 3. The top macro-morphology via different exposure times: (a) 100 μs; (b) 160 μs; and (c) 220 μs.
Metals 08 00524 g003
Figure 4. The roughness with different exposure times.
Metals 08 00524 g004
Figure 5. The side macro-morphologies with different scan strategies: case 1 with a rotation increment angle of 0° and rotation start angle of 0°, and case 3 with a rotation increment angle of 0° and rotation start angle of 90°.
Metals 08 00524 g005
Figure 6. The roughness with different scan strategies.
Metals 08 00524 g006
Figure 7. The schematic diagram of melt pool overlap.
Metals 08 00524 g007
Figure 8. Effect of scan direction on roughness.
Metals 08 00524 g008
Figure 9. Effect of gas flow direction on roughness.
Metals 08 00524 g009
Table 1. The process parameters used in the laser powder bed fusion (LPBF) process.
ParameterValue
Laser power, P200 W
Hatching space, S80 μm
Hatching offset30 μm
Spot diameter, D80 μm
Layer thickness, h25 μm
Exposure Time, ET100, 120, 140, 160, 180, 200, 220 μs
Point Distance, PD90 μm

