Abstract
The mechanical properties and degradation behavior of both as-cast and extruded Mg(100−7x)Zn6xYx alloys (x = 0.2, 0.4, 0.6, 0.8 at %) were systematically studied in this paper. The results indicated that with the increase in x value, the mechanical properties and corrosion resistance of the Mg(100−7x)Zn6xYx alloys were improved. The extruded Mg95.8Zn3.6Y0.6 alloy exhibited excellent mechanical properties, showing a tensile strength of 320 MPa, yield strength of 240 MPa, and elongation of 16%, which is much higher than that of commercially extruded AZ31 alloy. The weight loss experiment presented a higher degradation rate for the extruded Mg95.8Zn3.6Y0.6 alloy compared with the wrought AZ31 alloy, indicating a good bioactivity and biocompatibility. More detailed and long-term studies for evaluating and further controlling the degradation behavior of Mg–Zn–Y-based alloys remain to be performed.
1. Introduction
Compared with traditional biomedical titanium alloys and stainless steels, biodegradable magnesium (Mg) alloys are considered as revolutionary bio-metallic materials [1] due to their inherent properties. Firstly, Mg alloys are the lightest metallic structural material in practical application. Secondly, Mg alloys possess similar elastic modulus to human bones which may remit the stress-shielding effect [2]. Thirdly, Mg, with excellent biocompatibility, is an essential element of the human body, in other words, the existence of Mg does not produce any toxic effects. The degradation products of Mg also can be eliminated from the body through urine and sweat. Fourthly, the most attractive advantage of Mg alloys is that it can be completely degraded in the human body, avoiding any requirement for secondary surgery to remove the implant. Their prospective utilizations in medical fields include vascular stent [3], orthopedic implants [4], and tissue engineering scaffold [5]. However, the biggest drawback of Mg alloys is their fast degradation rate [6]. Thus, many attempts have been performed to restrain the degradation rate [7,8]. Alloying method is the most simple and effective method, in which the selection of alloying elements must be non-toxic to organisms. Unfortunately, many widely used commercial Mg alloys such as AZ91 and AZ31 contain the element of aluminum, which is good for strengthening in Mg alloys but acts as a toxic element to that elevates the risk of Alzheimer’s disease [9]. In addition, another problem of Mg is its relatively low mechanical strength and elongation, which retards the applications of Mg alloys as load-carrying implant metals. Hence, one of the primary missions for biomedical Mg exploitation is to assemble Mg alloys with high strength, acceptable elongation, and low degradation rate. Among all the chemical elements, Zn is a potential option as it is non-toxic to organisms. It presents a remarkable strengthening effect on Mg alloys. Mg–Zn alloys containing suitable atom ratios have been proven to have potential for application in biodegradable metals [10]. Furthermore, a small amount of yttrium plays a significant role in modifying the microstructure, mechanical properties, and degradation rate of Mg alloys [11]. In this way, Mg–Zn–Y alloys with proper strength, ductility, and relatively low degradation rate, draw much attention for biomedical applications [12,13].
Tens of literatures related to all kinds of performances of Mg–Zn–Y-based alloys have been published recently [14,15,16,17]. Specifically, a Mg–Zn–Y alloy with Zn/Y atom ratio equal to 6 was developed [18], which presented excellent mechanical properties because of the existence of the thermally stable icosahedral quasi-crystal phase (I-phase) as the only second phase. And, the I-phases decreased the corrosion rate of the alloys in a certain volume fraction range due to its higher corrosion potential than α-Mg [19]. More and more papers [19,20] have verified that a better corrosion resistance of Mg–Zn–Y alloys could be obtained when a single secondary phase existed. In this circumstance, Mg–Zn–Y alloys with various atom ratios and containing an I-phase as the single secondary phase are hoped to be constantly developed. Thus, more studies related to performance evaluation should be carried out. In this work, Mg(100−7x)Zn6xYx alloys (in as-cast and extruded state) with Zn/Y = 6 were prepared. The microstructure, mechanical properties and degradation behavior of the alloys were studied and discussed. This work will not only enrich the research data onto Mg–Zn–Y-based alloys, but also provide the basic evaluation for their potential applications.
2. Materials and Methods
2.1. Materials and Processing
Table 1 represents the nominal composition of the experimental alloys. High purity Mg ingot (99.95 wt %), Zn ingot (99.95 wt %), and Mg-20 wt % Y master alloys were melted in a crucible electric resistance furnace (SG2-5-10A) under protection of SF6/CO2 gas mixture. The melt, stabilized at 720 °C for 30 min, was then poured into a steel mold. The as-cast Mg(100−7x)Zn6xYx ingots were subsequently homogenized at 350 °C for 12 h and cooling in air. After preheating at 310 °C for 10 min, the machined billets with diameter of 60 mm and length of 120 mm were extruded at 310 °C with an extrusion ratio of 16:1 at a ram speed of 1.0 mm·s−1. Commercial as-cast AZ91D and extruded AZ31 with the same extrusion ratio were also prepared for comparison.

Table 1.
The nominal compositions of Mg(100−7x)Zn6xYx alloys (at %).
2.2. Microstructure and Mechanical Properties
The phases were identified by X-ray diffraction (XRD, D8, Bruker, Karlsruhe, Germany) using Cu Kα radiation. The superficial morphologies of the samples were observed using an optical microscope (OM, BX41M, OLYMPUS, Tokyo, Japan) and a scanning electron microscope (SEM, S4800, Hitachi, Tokyo, Japan) equipped with energy-dispersive spectroscopy (EDS). The micro-hardness of samples was tested by a hardness-meter (HB-3000, Caikon, Shanghai, China). Dog-bone-shaped specimens with a gauge length of 80 mm and a diameter of 10 mm were machined for tensile tests. The tensile properties were tested using universal tensile testing machine (WE-10, Sinter, Changchun, China) at ambient temperature starting with a strain rate of 0.5 × 10⁻³ s−1. In order to exactly present the properties of materials, five samples were examined in every condition. Standard deviation was used for data representation.
2.3. Electrochemical Measurements
Open circuit potential (OCP) curves of the specimens were measured in simulated body fluid (SBF) at 37 ± 1 °C using electrochemical workstation (LK2005A, LANLIKE, Tianjin, China). The chemical composition of the adopted SBF (g/L) [21] is 0.40 KCl, 8.00 NaCl, 0.20 MgSO4·7H2O, 0.09 Na2HPO4·7H2O, 0.19 CaCl2·2H2O, 0.35 NaHCO3, 1.00 glucose, and 0.06 KH2PO4. For all measurements, a three-electrode electrochemical cell was used, in which the sample as the working electrode, a platinum electrode as the counter, and a saturated calomel electrode (SCE) as the reference electrode. OCP curves were collected immediately after the specimens were immersed into the SBF. The testing time lasted for 3000 s.
2.4. Immersion Test
Samples for immersion tests were machined into ϕ15 mm × 4 mm. Before testing, the specimen surfaces were polished to 2000 grit. Degradation tests lasted for 24 h in SBF at 37 ± 1 °C. Photos of the specimens were taken after immersion by digital camera and SEM, respectively. The surface characteristics of the sample after immersion were identified by EDS and Fourier Transform Infrared spectroscopy (FTIR, Vertex 80V, Bruker, Karlsruhe, Germany).
3. Results and Discussion
3.1. Microstructure and Mechanical Properties
XRD analysis (Figure 1) shows that the solidification phases of the as-cast Mg(100−7x)Zn6xYx alloys are mainly α-Mg and I-phase. The relative intensity of the α-Mg diffraction peaks weakens and the I-phase diffraction peaks were gradually enhance with the increase in x value, indicating that the I-phase content gradually increases with greater addition of Y element.
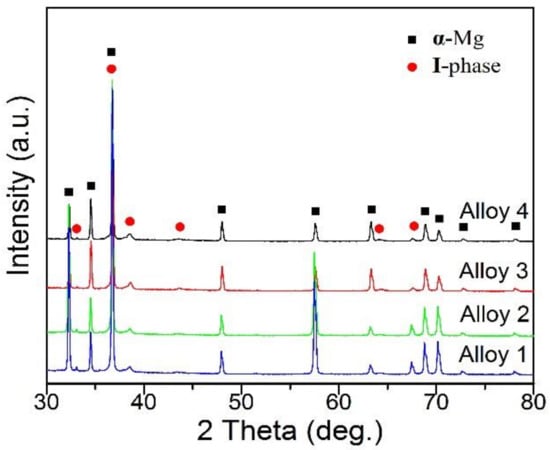
Figure 1.
X-ray diffraction (XRD) patterns of experimental alloys.
Figure 2 reveals SEM images of the as-cast Mg(100−7x)Zn6xYx alloys. The microstructures of the alloys mainly comprise α-Mg matrix and precipitated I-phases. Only α-Mg matrix and grainy I-phase can be obtained when x is 0.2 (Figure 2a). With the enhancement in x value, the volume fraction of the precipitated phases gradually improves. For Alloy 2, a grainy and bacilliform I-phase was dispersed in α-Mg matrix (Figure 2b). When the value of x was greater than 0.6, an increasing lamellar eutectic was formed. This lamellar eutectic can be clearly observed by magnified SEM images (Figure 3a,b). EDS analysis (Figure 3c) on the lamellar phase presents that the Zn:Y atom ratio is close to 5.4, which implies that the lamellar eutectic phase maybe a composite of I-phase and α-Mg phase. When x reached 0.8 (Figure 2d), the primary α-Mg grains were almost completely surrounded by the continuous networks of the lamellar eutectic phase and grainy I-phase. W-phase (Mg3Y2Zn3) and long period stacking order (LPSO, Mg12YZn) phase [22,23,24,25] were not formed in this solidification process based on current testing analysis.
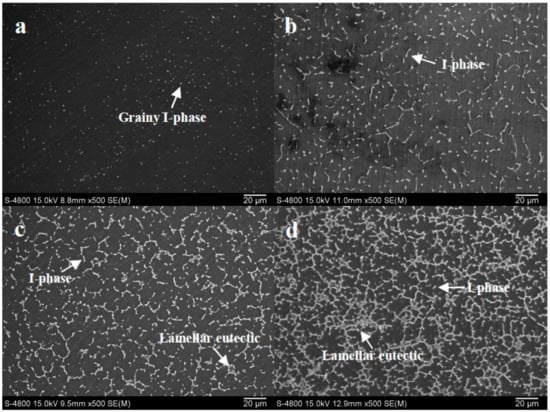
Figure 2.
Scanning electron microscopy (SEM) images of as-cast Mg(100−7x)Zn6xYx alloys: (a) Alloy 1, x = 0.2; (b) Alloy 2, x = 0.4; (c) Alloy 3, x = 0.6; (d) Alloy 4, x = 0.8.
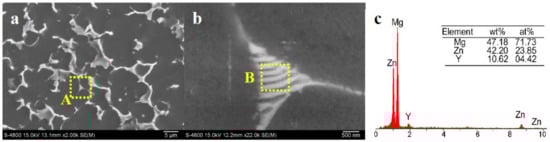
Figure 3.
(a) SEM images of as-cast Alloy 3; (b) SEM morphology of lamellar eutectic marked by rectangle A in (a); (c) EDS analysis of lamellar eutectic marked by rectangle B in (b).
Figure 4 shows the optical microstructures of Alloy 3 and Alloy 4 (transverse sections) before and after hot extrusion. The microstructures of the extruded alloys show much finer grains compared to that of their as-cast counterparts. Lot of particle phases are observed in Figure 4b,d, whereas different eutectic phases was generated in Figure 4a,c, which means that bacilliform phases were crushed into small particle phases during hot deformation. Due to the higher Y content and finer initial grain size of the as-cast Alloy 4 compared with Alloy 3, the corresponding grain of extruded Alloy 4 is much finer.
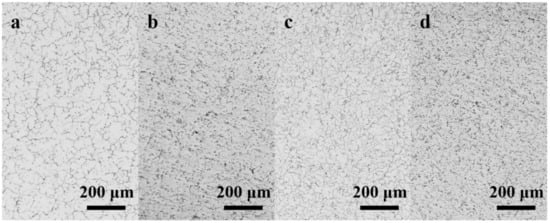
Figure 4.
Optical microstructure of Mg(100−7x)Zn6xYx alloys: (a) as-cast Alloy 3; (b) extruded Alloy 3; (c) as-cast Alloy 4; (d) extruded Alloy 4.
Figure 5a shows the micro-hardness test results of the studied alloys. With the increase in x value, the micro-hardness of the as-cast alloys increases, implying that the micro-hardness of the alloys gradually increases with more I-phase content. In addition, the micro-hardness value grows quickly when the value range of x changes from 0.2 to 0.6, but this increase becomes slow when the x value increases from 0.6 (HV76) to 0.8 (HV80). This tendency can be ascribed to the effect of grain refinement and ever-increasing strengthening phase (I-phase). After extrusion, the micro-hardness of the extruded alloys is lower than that of the corresponding as-cast alloys. A weakened strengthening effect from the broken I-phases may be the possible reason for this phenomenon. Figure 5b compares the micro-hardness value of I-phase-bearing Alloy 3 with other Mg alloys. It shows that the Alloy 3 with I-phase built-in represents higher micro-hardness than that of AZ31 alloy both in the as-cast state and extruded state, indicating the superiority of Mg95.8Zn3.6Y0.6 compared to commercial Mg alloys.
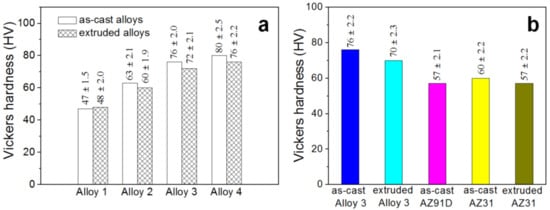
Figure 5.
Micro-hardness of the experimental alloys: (a) Alloy 1–4; (b) Alloy 3 and commercial AZ31 and AZ91D alloys in various states.
Figure 6 summarizes the mechanical properties of all the experimental alloys. It is shown that the mechanical properties (including elongation, yield strength, and tensile strength) of the extruded alloys are superior to their corresponding as-cast alloys. With the increase in x value, the extruded alloys present dramatically enhanced mechanical properties, demonstrating that the mechanical properties of the extruded alloys are strongly affected by the content of I-phase. In particular, the mechanical properties of extruded Alloy 3 and Alloy 4 are superior to that of extruded AZ31 alloy, showing the advantage of the as-obtained alloys in terms of mechanical properties. In consideration of cost, the lower the content of rare earth element Y, the better cost-efficiency can be obtained. When the balance of cost and performance is taken into mind, the extruded Alloy 3 (320 MPa, 240 MPa, and 16% for tensile strength, yield strength, and elongation rate, respectively) is highly recommended for the following corrosion tests.
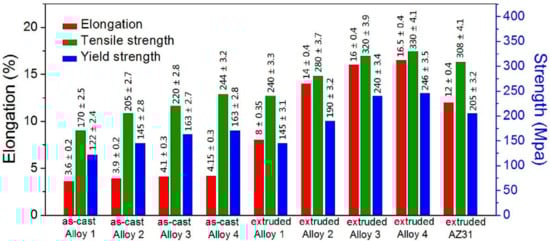
Figure 6.
Mechanical properties of the experimental alloys.
3.2. Electrochemical and Degradation Behavior
OCP curves of the four as-cast alloys in SBF are recorded for 3000 s, and their evolution with time is displayed in Figure 7a. During the primary immersion (2 min), the OCP of as-cast Mg(100−7x)Zn6xYx alloys increase clearly with time. After 2 min, with fluctuations in certain extent, the OCPs of the four alloys finally become stable. The stabilization potentials of Alloy 1–Alloy 4, namely the active state dissolution potentials, are −1.63425, −1.56276, −1.53023, and −1.51783, respectively. It reveals that the OCP of the as-cast alloys rise greatly with the increase in x value. Generally, the corrosion resistant property of Mg alloys is mainly dependent on their chemical composition. However, Y has a standard electrochemical potential (−2.37 V) equal to that of Mg (−2.37 V). Zn has a standard electrochemical potential (−0.76 V) above that of Mg. So, the OCP of Mg(100−7x)Zn6xYx alloys are mainly dependent on the content of Zn. Additionally, Zn, Y, and Mg elements make up a new second phase (I-phase) in Mg(100−7x)Zn6xYx alloys. Actually, the variation on the volume fraction of I-phase also determines the OCP of the Mg(100−7x)Zn6xYx alloys. As seen in Figure 2a–d, the volume fraction of I-phase changed only a little between Alloy 3 and Alloy 4. Therefore, the OCP of Alloy 3 and Alloy 4 are very closely. Figure 7b compares OCP of Alloy 3 to contrast materials. It can be seen that the OCP is similar between extruded and as-cast Alloy 3, which implies the hot extrusion process did not affect the stabilization potentials for Alloy 3 and the stable I-phase was not transformed in this process. That is because the reaction to L → α-Mg + I-phase occurs at about 400 °C [26] and the extrusion temperature was only at 310 °C, which cannot trigger the reaction. Moreover, it can be seen that the OCP of the extruded AZ31 alloy is the highest in the tested materials, indicating that good corrosion resistance and lower degradation rate has been achieved in our material.
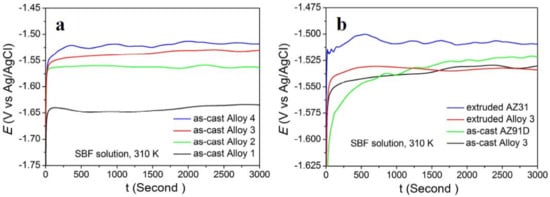
Figure 7.
Open circuit potential (OCP) curves of different alloys in SBF (simulated body fluid) solution: (a) as-cast Mg(100−7x)Zn6xYx alloys; (b) Alloy 3 and contrast alloys.
Figure 8a shows the macroscopic images of Mg(100−7x)Zn6xYx alloys after immersing in SBF for 24 h. As shown from the images, the as-cast alloys present relatively uniform corrosion, while the extruded alloys show clearly localized corrosion. With more addition of Y, the corrosion resistance of the as-cast alloys improves gradually. Two zones, including a deep corrosion zone and a shallow corrosion zone, constitute the surfaces of corroded alloys. Figure 8b,c represent deep corrosion zone of as-cast and extruded Alloy 3, respectively. Though the corrosion seems to occur at limited areas for extruded Alloy 3, it shows deeper eroding pits (300–500 μm in depth) than the as-cast alloy (200–300 μm in depth). The shallow corrosion zones of as-cast and extruded Alloy 3 are displayed in Figure 8d,e, respectively. Lots of corrosion products and superficial cracks can be seen in the shallow corrosion zone of as-cast Alloy 3, while very few products and cracks can be found in the shallow corrosion zone of extruded Alloy 3. As a result, compared with as-cast alloys, the extruded alloys present more shining surfaces after corrosion.
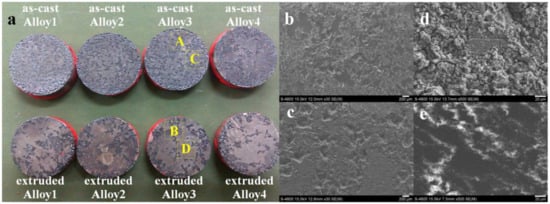
Figure 8.
Macroscopic and SEM images of Mg(100−7x)Zn6xYx alloys after immersing in SBF for 24 h: (a) macroscopic photos; (b–e) magnified images of areas marked in (a), (b–e) represents areas A–D, respectively.
The weight loss of different alloys after corrosion is shown in Figure 9. It is shown in Figure 9a that with the increase in x, the weight loss for both as-cast alloys and extruded alloys reduces sharply. In addition, the extruded alloy shows a little higher weight loss compared to the as-cast alloy with the same composition. The weight loss of commercial as-cast AZ91D and extruded AZ31 can be acquired in Figure 9b. The as-obtained Alloy 3 shows higher weight loss than these commercial alloys, indicating a higher degradation rate of the material in the testing time. This tendency different from the OCP results, suggesting further testing with longer time is needed.
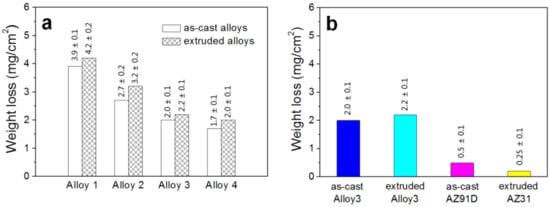
Figure 9.
Weight loss of different alloys in SBF solution for 24 h: (a) experimental alloys; (b) Alloy 3 and contrast alloys.
Figure 10 shows SEM micrographs of extruded Alloy 3 after immersing in SBF for 24 h. As seen in Figure 10a–c, only the local region was eroded after immersion. Plentiful corrosion products were generated on these limited local regions. EDS results (Figure 10d) show that area E in Figure 10c was rich in calcium, oxygen, magnesium, and phosphorus, accompanied by little chloride. The Ca/P atom ratio is close to 1:1, indicating calcium phosphates were possibly created. In general, when Mg is exposed to aqueous solution, the following reaction will take place [27]:
Mg + 2H2O → Mg2+ + 2OH− + H2
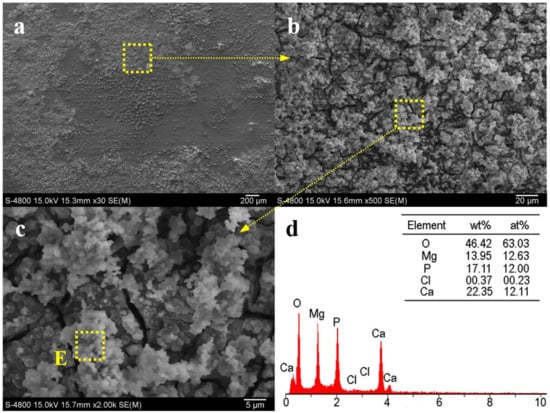
Figure 10.
(a–c) SEM micrographs of extruded Alloy 3 after immersing in SBF solution for 24 h; (d) EDS analysis of area E in (c).
As a result, bubbles come out in the corrosion process and parts of Mg will dissolve in solution, resulting in pits on the surfaces. Moreover, some insoluble phosphates will be generated through the following reaction, which has been reported by many studies [28]:
Mg2+ (or Ca2+) + OH−+ HPO42− + (n − 1) H2O → Mg(or Ca)x·(PO4)y·nH2O
For biomedical orthopedic applications, hydroxyapatite or calcium-phosphate coatings with various types are generally significant, and such coatings have been proven to have excellent bioactivity and biocompatibility [29,30]. Therefore, extruded Alloy 3 exhibits a high biocompatibility and bioactivity. In addition to being beneficial to biocompatibility, Ca–P coatings influence the corrosion rate of Mg [29,30]. With an increasing volume fraction of Ca–P coatings, the corrosion rate of extruded Alloy 3 may slightly slower, resulting in a low degradation rate of the alloy. More detailed and longer-term studies are now under way.
Figure 11 shows the superficial FTIR spectrum of the extruded Alloy 3 after immersing in SBF solution at 310 K for 1, 3, and 7 days, respectively. The absorption peaks of the spectra located at green areas are allocated to the phosphate group, which is related to one type of apatite [31]. The minor carbonate group is affirmed by the peaks at the yellow area [32]. In addition, the broad absorption peaks at the blue areas are representative of bound water or a hydration layer associated with apatite [33]. As a result, the above tests reveal that the degradation products at the alloy surface are carbonate apatite mixed with Mg(OH)2 [34]. It is observed that the peak intensity of phosphate groups increases greatly with extension of the immersion time, meaning that the amount of the apatite increases with the increase in immersion time. All the tests present good biocompatibility and bioactivity of the extruded Alloy 3.
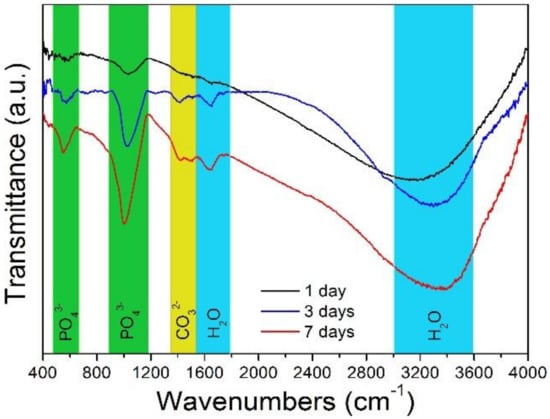
Figure 11.
Superficial FTIR (Fourier Transform Infrared spectroscopy) of the extruded Alloy 3 immersed in SBF at 310 K for 1, 3, and 7 days, respectively.
4. Conclusions
In summary, a series of Mg(100−7x)Zn6xYx alloys with Zn:Y ratio of 6 were prepared. With the increase in x value, the mechanical properties (including micro-hardness, tensile strength, yield strength, and elongation rate) of Mg(100−7x)Zn6xYx alloys (in both as-cast and extruded state) improved, while the degradation rates reduced gradually. Compared with extruded AZ31 alloy, the extruded Mg95.8Zn3.6Y0.6 alloy (Alloy 3) exhibited better mechanical properties and higher degradation rate (in 24 h), showing potential for biomedical application. However, the long-term degradation behavior and comprehensive evaluation of related alloys still require investigation.
Acknowledgments
This work is financially supported by Natural Science Foundation of Hebei Province, China (E2015202081, E2016202130), China Postdoctoral Science Foundation (2016M600190) and National Natural Science Foundation of China (51701060).
Author Contributions
Hanqing Xiong, Zhifeng Wang and Hui Yu conceived and designed the experiments; Hanqing Xiong and Zhuofan Liang performed the experiments; Chunling Qin and Weimin Zhao contributed reagents/materials/analysis tools; Hanqing Xiong and Zhifeng Wang wrote the paper.
Conflicts of Interest
The authors declare no conflict of interest.
References
- Yun, Y.; Dong, Z.; Lee, N.; Liu, Y.; Xue, D.; Guo, X.; Kuhlmann, J.; Doepke, A.; Halsall, H.B.; Heineman, W.; et al. Revolutionizing biodegradable metals. Mater. Today 2009, 12, 22–32. [Google Scholar] [CrossRef]
- Jin, W.H.; Chu, P.K. Surface functionalization of biomaterials by plasma and ion beam. Surf. Coat. Technol. 2018, 336, 2–8. [Google Scholar] [CrossRef]
- Zhang, J.; Li, H.Y.; Wang, W.; Huang, H.; Pei, J.; Qu, H.Y.; Yuan, G.Y.; Li, Y.D. The degradation and transport mechanism of a Mg-Nd-Zn-Zr stent in rabbit common carotid artery: A 20-month study. Acta Biomater. 2018, 69, 372–384. [Google Scholar] [CrossRef] [PubMed]
- Bian, D.; Zhou, W.R.; Deng, J.X.; Liu, Y.; Li, W.T.; Chu, X.; Xiu, P.; Cai, H.; Kou, Y.H.; Jiang, B.G.; et al. Development of magnesium-based biodegradable metals with dietary trace element germanium as orthopaedic implant applications. Acta Biomater. 2017, 64, 421–436. [Google Scholar] [CrossRef] [PubMed]
- Mutlu, I. Production and fluoride treatment of Mg−Ca−Zn−Co alloy foam for tissue engineering applications. Trans. Nonferr. Met. Soc. China 2018, 28, 114–124. [Google Scholar] [CrossRef]
- Song, G.L. Control of biodegradation of biocompatable magnesium alloys. Corros. Sci. 2007, 49, 1696–1701. [Google Scholar] [CrossRef]
- Luo, D.; Liu, Y.; Yin, X.M.; Wang, H.Y.; Han, Z.W.; Ren, L.Q. Corrosion inhibition of hydrophobic coatings fabricated by micro-arc oxidation on an extruded Mg–5Sn–1Zn alloy substrate. J. Alloys Compd. 2018, 731, 731–738. [Google Scholar] [CrossRef]
- Kong, X.D.; Wang, L.; Li, G.Y.; Qu, X.H.; Niu, J.L.; Tang, T.T.; Dai, K.R.; Yuan, G.Y.; Hao, Y.Q. Mg-based bone implants show promising osteoinductivity and controllable degradation: A long-term study in a goat femoral condyle fracture model. Mater. Sci. Eng. C 2018, 86, 42–47. [Google Scholar] [CrossRef] [PubMed]
- Mirza, A.; King, A.; Troakes, C.; Exley, C. Aluminium in brain tissue in familial Alzheimer’s disease. J. Trace Elem. Med. Biol. 2017, 40, 30–36. [Google Scholar] [CrossRef] [PubMed]
- Hua, N.B.; Chen, W.Z.; Wang, Q.T.; Guo, Q.H.; Huang, Y.T.; Zhang, T. Tribocorrosion behaviors of a biodegradable Mg65Zn30Ca5 bulk metallic glass for potential biomedical implant applications. J. Alloys Compd. 2018, 745, 111–120. [Google Scholar] [CrossRef]
- Peng, Q.M.; Huang, Y.D.; Zhou, L.; Hort, N.; Kainer, K.U. Preparation and properties of high purity Mg–Y biomaterials. Biomaterials 2010, 31, 398–403. [Google Scholar] [CrossRef] [PubMed]
- Zhao, X.; Shi, L.L.; Xu, J. Mg–Zn–Y alloys with long-period stacking ordered structure: In vitro assessments of biodegradation behavior. Mater. Sci. Eng. C 2013, 33, 3627–3637. [Google Scholar] [CrossRef] [PubMed]
- Hazi, A.C.; Gerber, I.; Schinhammer, M.; Löffler, J.F.; Uggowitzer, P.J. On the in vitro and in vivo degradation performance and biological response of new biodegradable Mg-Y-Zn alloys. Acta Biomater. 2010, 6, 1824–1833. [Google Scholar]
- Ye, L.; Liu, Y.; Zhao, D.S.; Zhuang, Y.L.; Gao, S.B.; Liu, X.Q.; Zhou, J.P.; Gui, J.N.; Wang, J.B. Effects of Sn on the microstructure and mechanical properties of a hot-extruded Mg-Zn-Y-Sn alloy. Mater. Sci. Eng. A 2018, 724, 121–130. [Google Scholar] [CrossRef]
- Liu, H.; Ju, J.; Bai, J.; Sun, J.P.; Song, D.; Yan, J.L.; Jiang, J.H.; Ma, A.B. Preparation, microstructure evolutions, and mechanical property of an ultra-fine grained Mg-10Gd-4Y-1.5Zn-0.5Zr alloy. Metals 2017, 7, 398. [Google Scholar] [CrossRef]
- Lyu, S.Y.; Li, G.D.; Hu, T.; Zheng, R.X.; Xiao, W.L.; Ma, C.L. A new cast Mg-Y-Sm-Zn-Zr alloy with high hardness. Mater. Lett. 2018, 217, 79–82. [Google Scholar] [CrossRef]
- Zhang, L.; Zhang, J.H.; Xu, C.; Liu, S.J.; Jiao, Y.F.; Xu, L.J.; Wang, Y.B.; Meng, J.; Wu, R.Z.; Zhang, M.L. Investigation of high-strength and superplastic Mg–Y–Gd–Zn alloy. Mater. Des. 2014, 61, 168–176. [Google Scholar] [CrossRef]
- Zhang, Y.B.; Yu, S.R.; Song, Y.L.; Zhu, X.Y. Microstructures and mechanical properties of quasicrystal reinforced Mg matrix composites. J. Alloys Compd. 2008, 464, 575–579. [Google Scholar] [CrossRef]
- Kim, D.H.; Kim, Y.K.; Kim, W.T.; Kim, D.H. Mechanical property and corrosion resistance of Mg-Zn-Y alloys containing icosahedral phase. Korean J. Met. Mater. 2011, 49, 145–152. [Google Scholar]
- Zhang, E.L.; He, W.W.; Du, H.; Yang, K. Microstructure, mechanical properties and corrosion properties of Mg–Zn–Y alloys with low Zn content. Mater. Sci. Eng. A 2008, 488, 102–111. [Google Scholar] [CrossRef]
- Qin, C.L.; Hu, Q.F.; Li, Y.Y.; Wang, Z.F.; Zhao, W.M.; Louzguine-Luzgin, D.V.; Inoue, A. Novel bioactive Fe-based metallic glasses with excellent apatite-forming ability. Mater. Sci. Eng. C 2016, 69, 513–521. [Google Scholar] [CrossRef] [PubMed]
- Li, Y.; Xiao, W.L.; Wang, F.; Hu, T.; Ma, C.L. The roles of long period stacking ordered structure and Zn solute in the hot deformation behavior of Mg-Gd-Zn alloys. J. Alloys Compd. 2018, 745, 33–43. [Google Scholar] [CrossRef]
- Liu, X.Q.; Zhao, D.S.; Ye, L.; Zhuang, Y.L.; Gao, S.B.; Wang, J.B. Effect of Er contents on the microstructure of long period stacking ordered phase and the corresponding mechanical properties in Mg-Dy-Er-Zn alloys. Mater. Sci. Eng. A 2018, 718, 461–467. [Google Scholar] [CrossRef]
- Jiang, H.S.; Qiao, X.G.; Xu, C.; Kamado, S.; Wu, K.; Zheng, M.Y. Influence of size and distribution of W phase on strength and ductility of high strength Mg-5.1Zn-3.2Y-0.4Zr-0.4Ca alloy processed by indirect extrusion. J. Mater. Sci. Technol. 2018, 34, 277–283. [Google Scholar] [CrossRef]
- Li, Z.M.; Wan, D.Q.; Huang, Y.; Ye, S.T.; Hu, Y.L. Characterization of a Mg95.5Zn1.5Y3 alloy both containing W phase and LPSO phase with or without heat treatment. J. Magnes. Alloys 2017, 5, 217–224. [Google Scholar]
- Zhang, Y.B.; Yu, S.R.; Zhu, X.Y.; Luo, Y.R. Study on as-cast microstructures and solidification process of Mg–Zn–Y Alloys. J. Non-Cryst. Solids 2008, 354, 1564–1568. [Google Scholar] [CrossRef]
- Song, G.L.; Atrens, A. Corrosion mechanisms of magnesium alloys. Adv. Eng. Mater. 1999, 1, 11–33. [Google Scholar] [CrossRef]
- Xin, Y.C.; Hu, T.; Chu, P.K. Degradation behavior of pure magnesium in simulated body fluids with different concentrations of HCO3−. Corros. Sci. 2011, 53, 1522–1528. [Google Scholar] [CrossRef]
- Virtanen, S. Biodegradable Mg and Mg alloys: Corrosion and biocompatibility. Mater. Sci. Eng. B 2011, 176, 1600–1608. [Google Scholar] [CrossRef]
- Xu, L.P.; Pan, F.; Yu, G.N.; Yang, L.; Zhang, E.L.; Yang, K. In vitro and in vivo evaluation of the surface bioactivity of a calcium phosphate coated magnesium alloy. Biomaterials 2009, 30, 1512–1523. [Google Scholar] [CrossRef] [PubMed]
- Qin, C.L.; Xiao, T.N.; Li, Y.Y.; Wang, Z.F.; Liu, L.; Xiong, H.Q.; Zhao, W.M. Corrosion behavior of Mg-Zn-Ca amorphous alloys with Nd addition in simulated body fluids. China Foundry 2014, 11, 503–509. [Google Scholar]
- Chen, J.D.; Wang, Y.J.; Wei, K.; Zhang, S.H.; Shi, X.T. Self-organization of hydroxyapatite nanorods through oriented attachment. Biomaterials 2007, 28, 2275–2280. [Google Scholar] [CrossRef] [PubMed]
- Pekounov, Y.; Petrov, O.E. Bone resembling apatite by amorphous-to-crystalline transition driven self-organisation. J. Mater. Sci. Mater. Med. 2008, 19, 753–759. [Google Scholar] [CrossRef] [PubMed]
- Zhu, Y.Y.; Wu, G.M.; Zhang, Y.H.; Zhao, Q. Growth and characterization of Mg(OH)2 film on magnesium alloy AZ31. Appl. Surf. Sci. 2011, 257, 6129–6137. [Google Scholar] [CrossRef]
© 2018 by the authors. Licensee MDPI, Basel, Switzerland. This article is an open access article distributed under the terms and conditions of the Creative Commons Attribution (CC BY) license (http://creativecommons.org/licenses/by/4.0/).