Article

Machinability of Eco-Friendly Lead-Free Brass Alloys: Cutting-Force and Surface-Roughness Optimization

by
Anagnostis I. Toulfatzis
1,2,
George A. Pantazopoulos
1,*,
Constantine N. David
3,
Dimitrios S. Sagris
3 and
Alkiviadis S. Paipetis
2,*
1
ELKEME Hellenic Research Centre for Metals S.A., 56th km Athens—Lamia National Road, 32011 Oinofyta, Greece
2
Department of Materials Science and Engineering, University of Ioannina, 45110 Ioannina, Greece
3
Department of Mechanical Engineering, Technological Education Institute of Central Macedonia, 62124 Serres, Greece
*
Authors to whom correspondence should be addressed.
Metals 2018, 8(4), 250; https://doi.org/10.3390/met8040250
Submission received: 22 March 2018 / Revised: 3 April 2018 / Accepted: 4 April 2018 / Published: 8 April 2018

Abstract

:
The machinability in turning mode of three lead-free brass alloys, CuZn42 (CW510L), CuZn38As (CW511L) and CuZn36 (C27450) was evaluated in comparison with a reference free-cutting leaded brass CuZn39Pb3 (CW614N), as far as the quality characteristics, i.e., cutting force and surface roughness, were concerned. A design of experiments (DOE) technique, according to the Taguchi L16 orthogonal array (OA) methodology, as well as analysis of variance (ANOVA) were employed in order to identify the critical-to-machinability parameters and to obtain their optimum values for high-performance machining. The experimental design consisted of four factors (cutting speed, depth of cut, feed rate and alloy) with four levels for each factor using the “smaller-the-better” criterion for quality characteristics’ optimization. The data means and signal-to-noise (S/N) responses indicated that the depth of cut and the feed rate were the most influential factors for the cutting force and surface roughness, respectively. The optimized machining parameters for cutting force (34.59 N) and surface roughness (1.22 μm) minimization were determined. Confirmation experiments (cutting force: 39.37 N and surface roughness: 1.71 μm) seem to show that they are in close agreement to the main conclusions, thereby validating the findings of the statistical evaluation performed.

1. Introduction

Brass alloys, one of the most important classes of copper alloys, are widely used for many mechanical and industrial applications such as mechanical, electrical and hydraulic systems [1]. Brasses exhibit a beneficial combination of low cost, improved machinability, corrosion resistance and good formability [2]. The fabrication of the final brass component, i.e., in a turning operation, is facilitated significantly by the lead (Pb) that exists in leaded-brass alloys [3]. In recent years, the dangerous effects of lead upon human health and the environment, stricter regulations for allowable lead content levels in products, have encouraged the development of lead-free brass alloys [4]. However, the absence of lead from the brass alloys deteriorates the machining quality due to the fact that lead acts as a lubricant and chip-breaking component [5]. Understanding the material behaviour in lead-free brass alloys concerning chip fracture and formation mechanisms is vital in order to design candidate alloys for the substitution of conventional leaded brasses without compromising the reliability and performance of manufactured components [6]. Due to recent regulations that encourage the promotion of new lead-free brasses, scientific research concerning the study and the development of special machinable brasses concerning machinability performance and optimization has become very challenging and important. The development of a suitable grain and phase structure (the presence of α, β or γ phases in Cu-Zn system), through various metallurgical methods, e.g., alloying, forming, heat treating, etc. exerts a major influence on fracture behaviour and, consequently, on chip-breaking properties and machinability performance [7,8,9,10].
The effect of alloy additives, such as graphite and bismuth, was investigated concerning the machinability and mechanical properties of lead-free brass alloys. A lead-free machinable brass (CuZn40) exhibiting good balance between the elongation and the machinability was obtained by using the mixed powder containing 0.5 wt % graphite particles and 2.2 wt % Bi additions [11]. Relevant research revealed the benefits of the recycled bismuth-tin solder addition in lead-free brass alloy (Cu-38Zn-0.5Si) by reducing the chip-size morphology as well as the required cutting force [12]. The improvement of chip-breaking efficiency was attributed to the presence of κ-phase in CuZn21Si3P, as opposed to the effect of α-phase in CuZn38As brass. Likewise, the high percentage of β-phase in the microstructure of CuZn41.5 resulted in the reduction of chip morphology and cutting forces [13]. Heat treatments were also performed in lead-free brass alloys (CuZn42, CuZn38As and CuZn36) in order to modify the microstructure and increase the β-phase content providing a promising ground for better chip breakability and improved machinability [14]. The influence of the coating type (TiN, TiAlN, TiB2 and DLC on carbide tools) as well as the use of polycrystalline diamond (PCD) tools on machining forces, chip formation and workpiece quality, was analyzed for the evaluation of machinability in three low-lead brass alloys (CuZn38As, CuZn42, and CuZn21Si3P). The machining problems were diminished using a diamond-like carbon coating, especially by the reduction of the friction in the secondary shear zone [15]. A machinability comparison between leaded (CuZn39Pb3) and lead-free brass (CuZn21Si3P) alloys was implemented in a relevant work concerning tool wear during machining. Machining of the lead-free brass alloy (CuZn21Si3P) resulted in higher cutting forces, longer chip size and, eventually, higher tool-wear rates using cemented carbides. The use of coating on carbide tools (e.g., (Ti,V,Zr,Hf,Nb,Ta)N), was recommended as a possible solution for overcoming excessive tool-wear rates [16].
Surface quality is of major significance, and explicitly demanded in high-precision and productivity machining processes. Moreover, the use of high-speed cutting ensures increased productivity, workpiece dimensional accuracy and improved surface finish [17]. Cutting force is also another important machinability performance indicator, which constitutes a criterion for the selection of optimal process conditions, affecting tool lifetime significantly. Cutting forces could also be calculated using mathematical models and employing renowned machining theories (Oxley’s machining theory) based on the determination of strain rates along the shear plastic zone and tool/chip interface [18,19].
Design of experiments (DOE) and genetic algorithm (GA) approaches are powerful and well-established techniques employed to investigate the optimization of cutting parameters such as cutting speed, feed rate, depth of cut, minimum quantity of lubrication (MQL), and alloy type [20,21,22,23].
Artificial neural networks (ANN) and response surface methodology (RSM) were used to determine the effect of cutting conditions (cutting speed, feed rate and depth of cut) on cutting force, surface roughness and tool wear during milling of Ti-6242S alloy [24]. In micromilling, tool wear and fracture as well as intense burr formation, and poor surface quality, are considered as the major quality problems. A relevant study investigated the effect of cutting path on the cutting force and surface quality in a micromilling process under different cooling conditions (e.g., dry, air blow, and flood-cooling agent) at fixed cutting parameters [25].
Cutting force and chip segmentation are also well reproduced using finite element method (FEM) (arbitrary Lagrangian-Eulerian and Lagrangian methods) and it was found that chip fragmentation can be correlated to the results of the cutting force development [26].
In a previous research work, the chip morphology and power consumption were employed as the major quality characteristics (criteria) for the ranking of machining performance [8]. In this work, a first effort was made to optimize two quality characteristics, cutting force and surface roughness, during turning of the studied brass alloys. The methodology used for the optimization was supported by signal-to-noise ratio data means, as dictated by the Taguchi experimental design and ANOVA. This technique is an efficient and economical way to treat and optimize industrial processes [27,28,29]. The present work is an original contribution, pertaining to the optimization of machinability of environmentally friendly lead-free brass alloys (CuZn42, CuZn38As and CuZn36), in comparison to a conventional leaded-brass alloy (CuZn39Pb3). The emergence of new legislation for the environment and health and safety (e.g., drinking-water regulations), together with the necessity to design and manufacture new lead-free machinable alloys, render this project as of high industrial significance. To the best of our knowledge, the present work is novel, since there is not any other published work in this specific area that provides an optimization guideline for cutting force and surface roughness during machining of these lead-free brass alloy classes. It reflects also the original experimental and statistical work performed by the authors, as a part and continuation of a long-term industrial research and development (R&D) project.

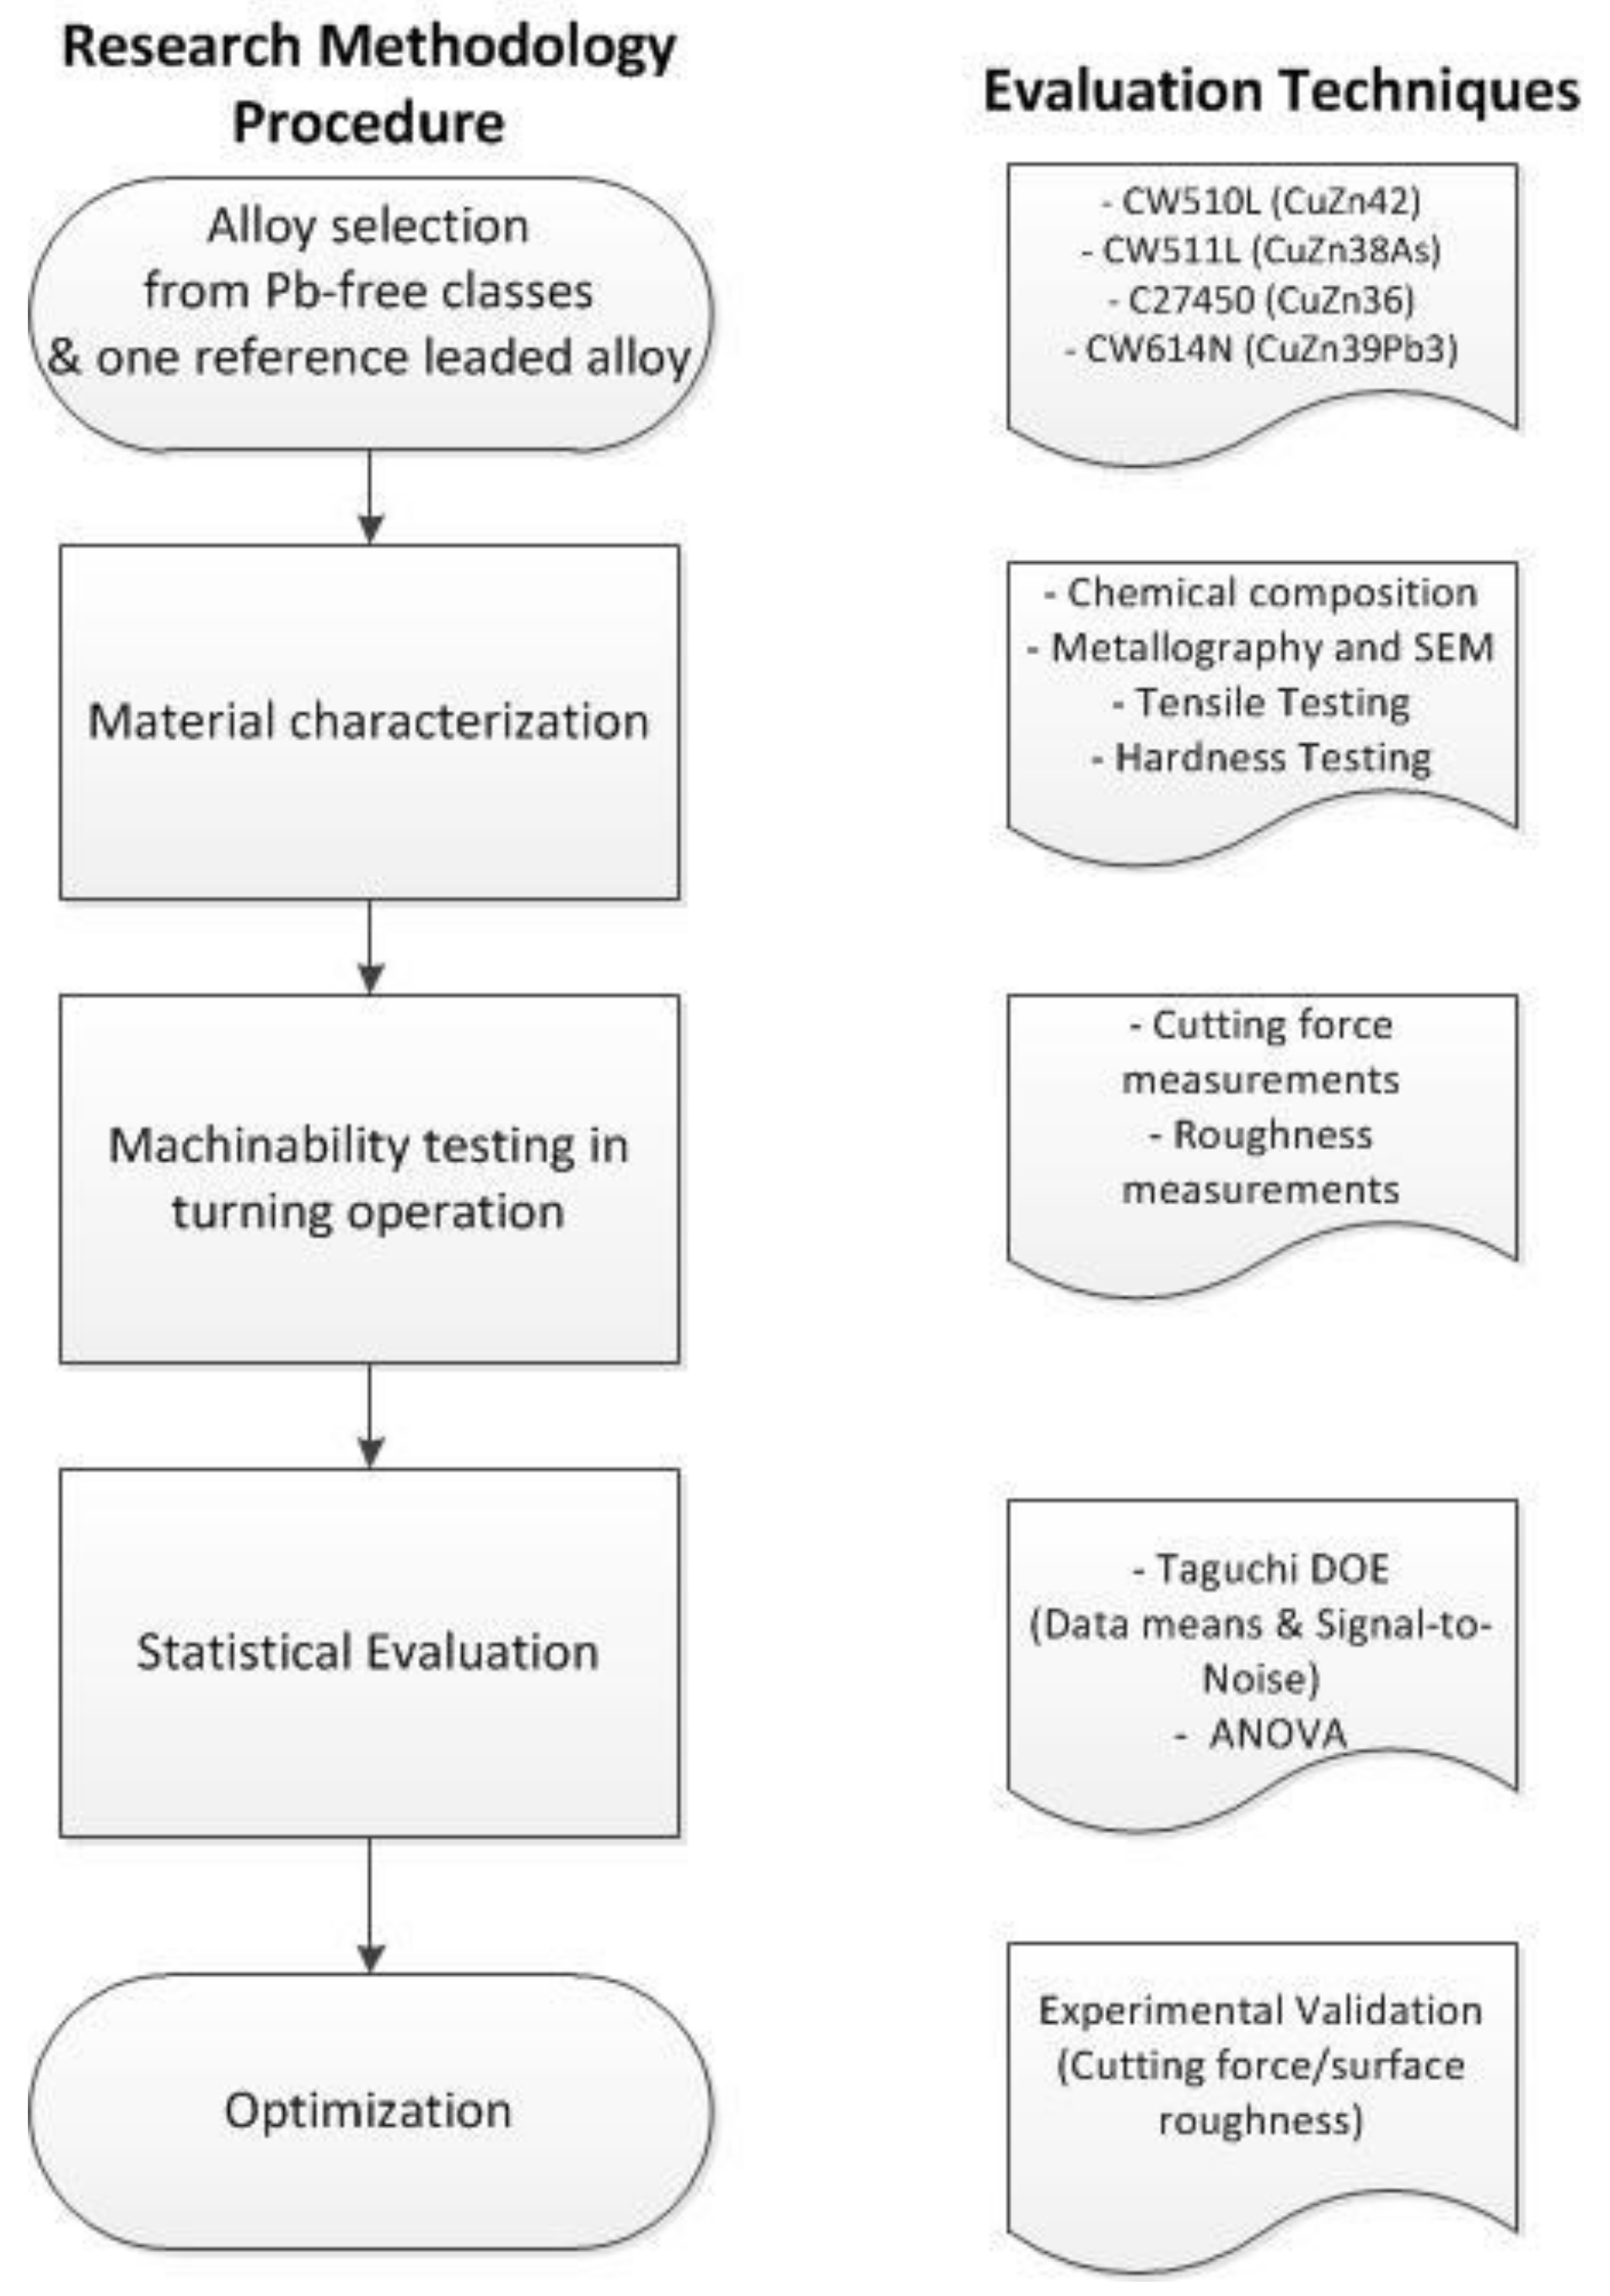
2. Materials and Methods

2.1. Experimental Design

The research approach was based on the experimental methodology applied aiming to evaluate the alloy performance in a more holistic view, which is presented schematically in the following flow chart (Figure 1).

2.2. Alloys and Chemical Composition

Extruded and drawn bars of 35 mm diameter and 200 mm length manufactured from three lead-free brass alloys, namely CuZn42 (CW510L), CuZn38As (CW511L) and CuZn36 (C27450), as well as a leaded brass, namely CuZn39Pb3 (CW614N), were selected for this study. The metallurgical condition of the bars was adjusted at the standard half-hard temper by the applied manufacturing process. The microstructure and mechanical properties were studied in previous research works [6,8,14], as shown in Table 1.
The composition of the alloys, as determined by optical emission spectrometry (OES) (ARL, Waltham, MA, USA) and X-ray fluorescence (XRF) (ARL, Waltham, MA, USA, is shown in Table 2. The chemical composition of the samples was compared with the EN 12164 standardand the Copper Development Association (CDA) [30].

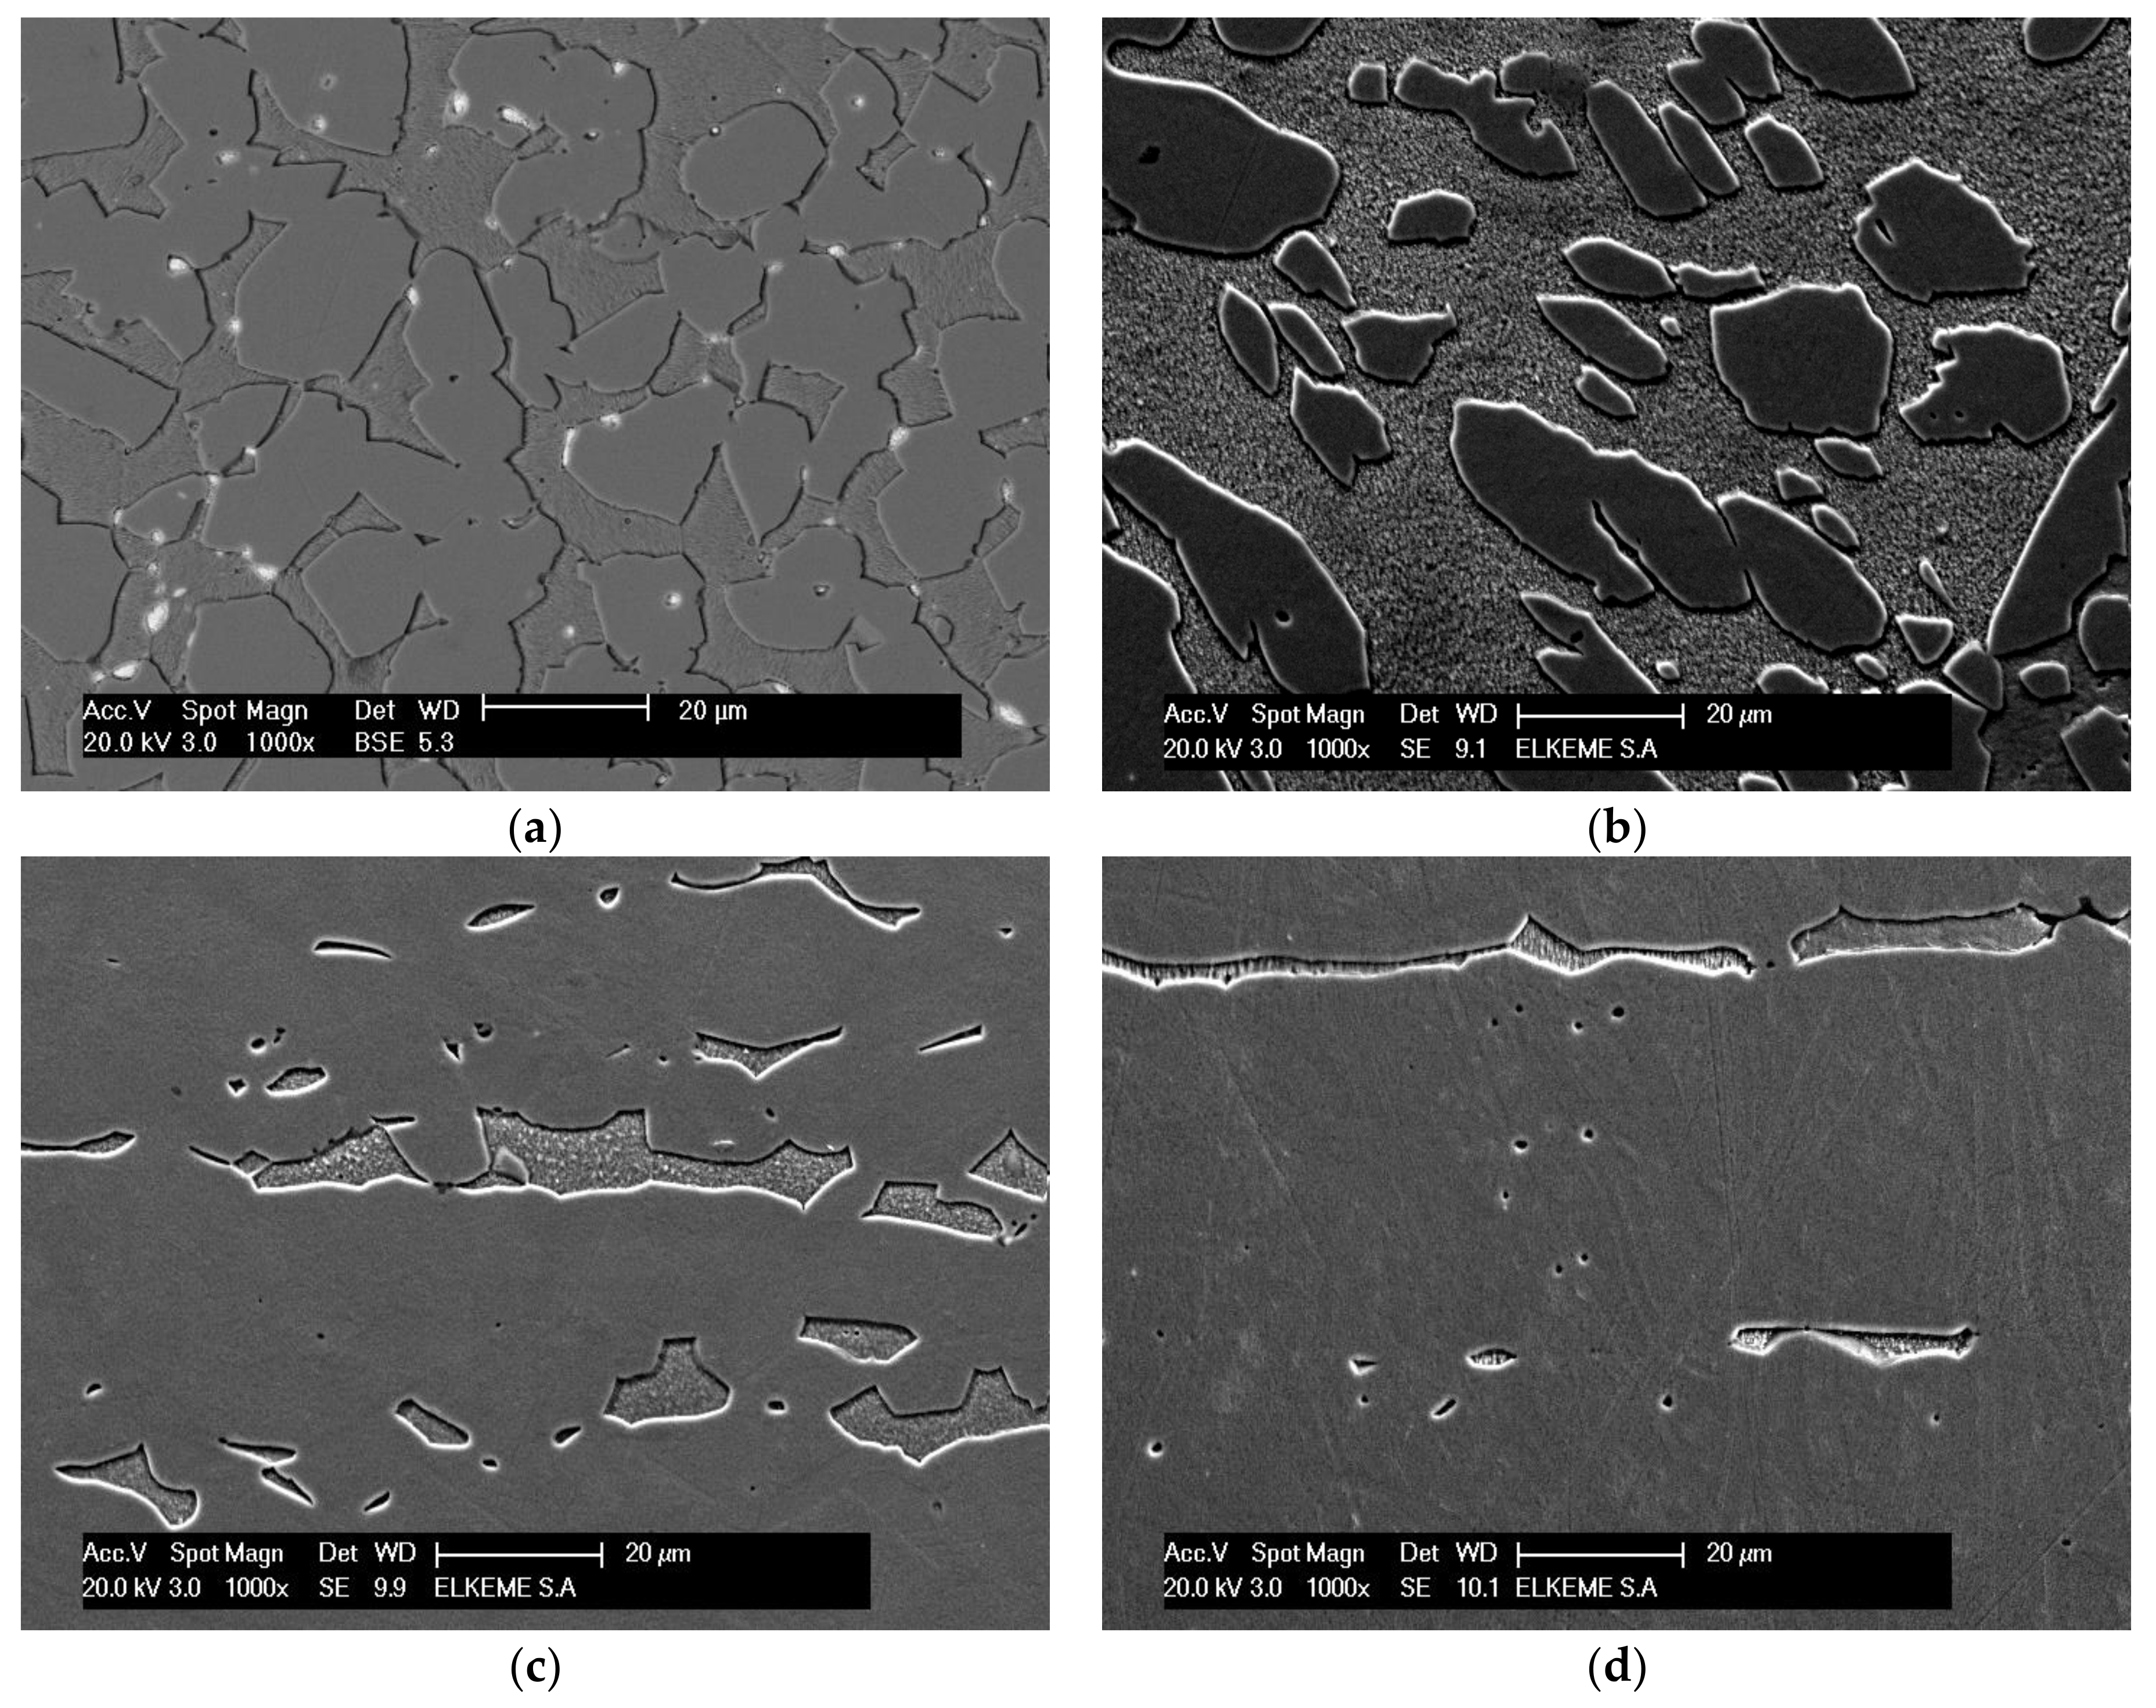
2.3. Microstructure and Mechanical Testing

Microstructural characterization of the subject materials was conducted on transverse cross-sections after wet grinding by up to 1200 grit SiC paper followed by fine polishing using diamond and silica suspensions. Subsequently, immersion chemical etching for approximately 5 s at room temperature was performed using FeCl3-based solutions according to the ASTM E407-07 standard [31]. Quantitative optical metallography was performed using a Nikon Epiphot 300 (Nikon, Tokyo, Japan) inverted light optical microscope using image analysis software (Image Pro Plus, Rockville, MD, USA) for phase (area) fraction measurements. High-magnification observations, utilizing a FEI XL40 SFEG scanning electron microscope (FEI, Eindhoven, The Netherlands), were performed on mounted specimens using both secondary electron (SE) and back-scattered electron (BSE) signals under 20 kV accelerating voltage. Tensile tests were performed using an Instron 8802 250 kN (Instron, Norwood, MA, USA) servohydraulic testing machine at ambient temperature according to BS EN ISO 6892-1 standard [32]. Vickers hardness tests, using a diamond indenter, were performed at various locations on transverse sections (surface-midway-centre) employing an Instron Wolpert 2100 hardness tester, under 1.0 kg (9.807 N) applied load, according to BS EN ISO 6507 [33].

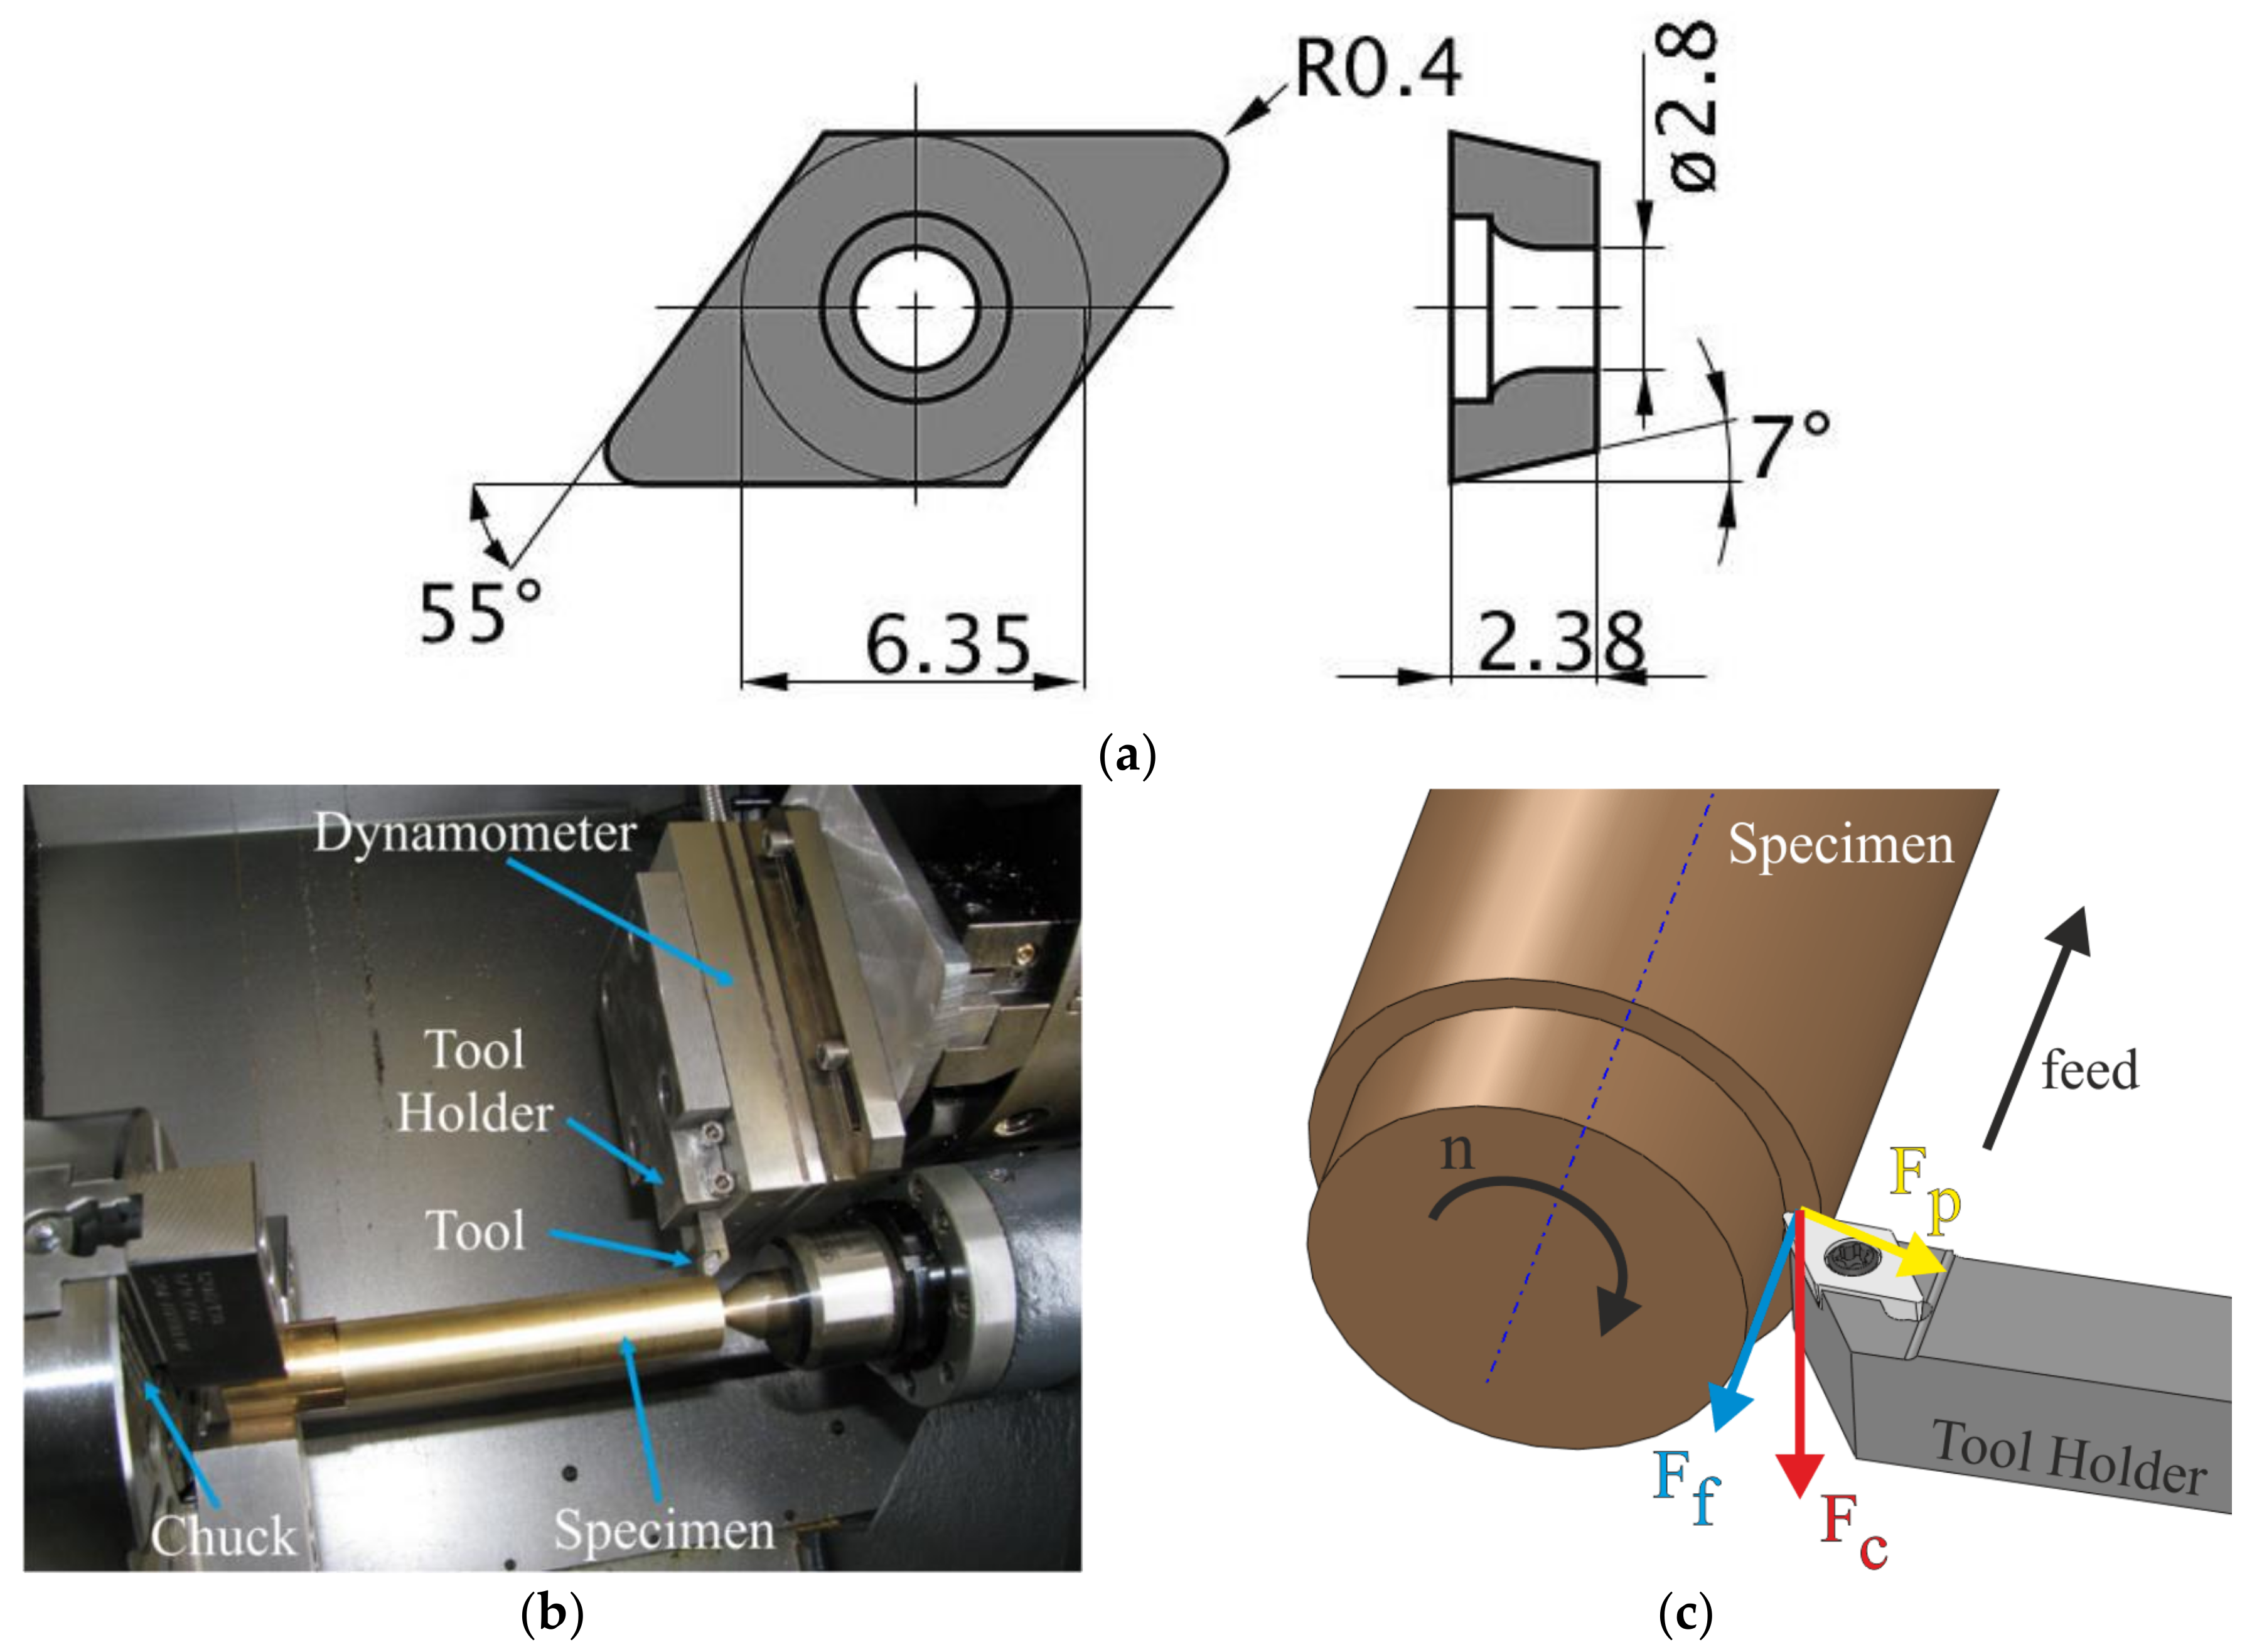
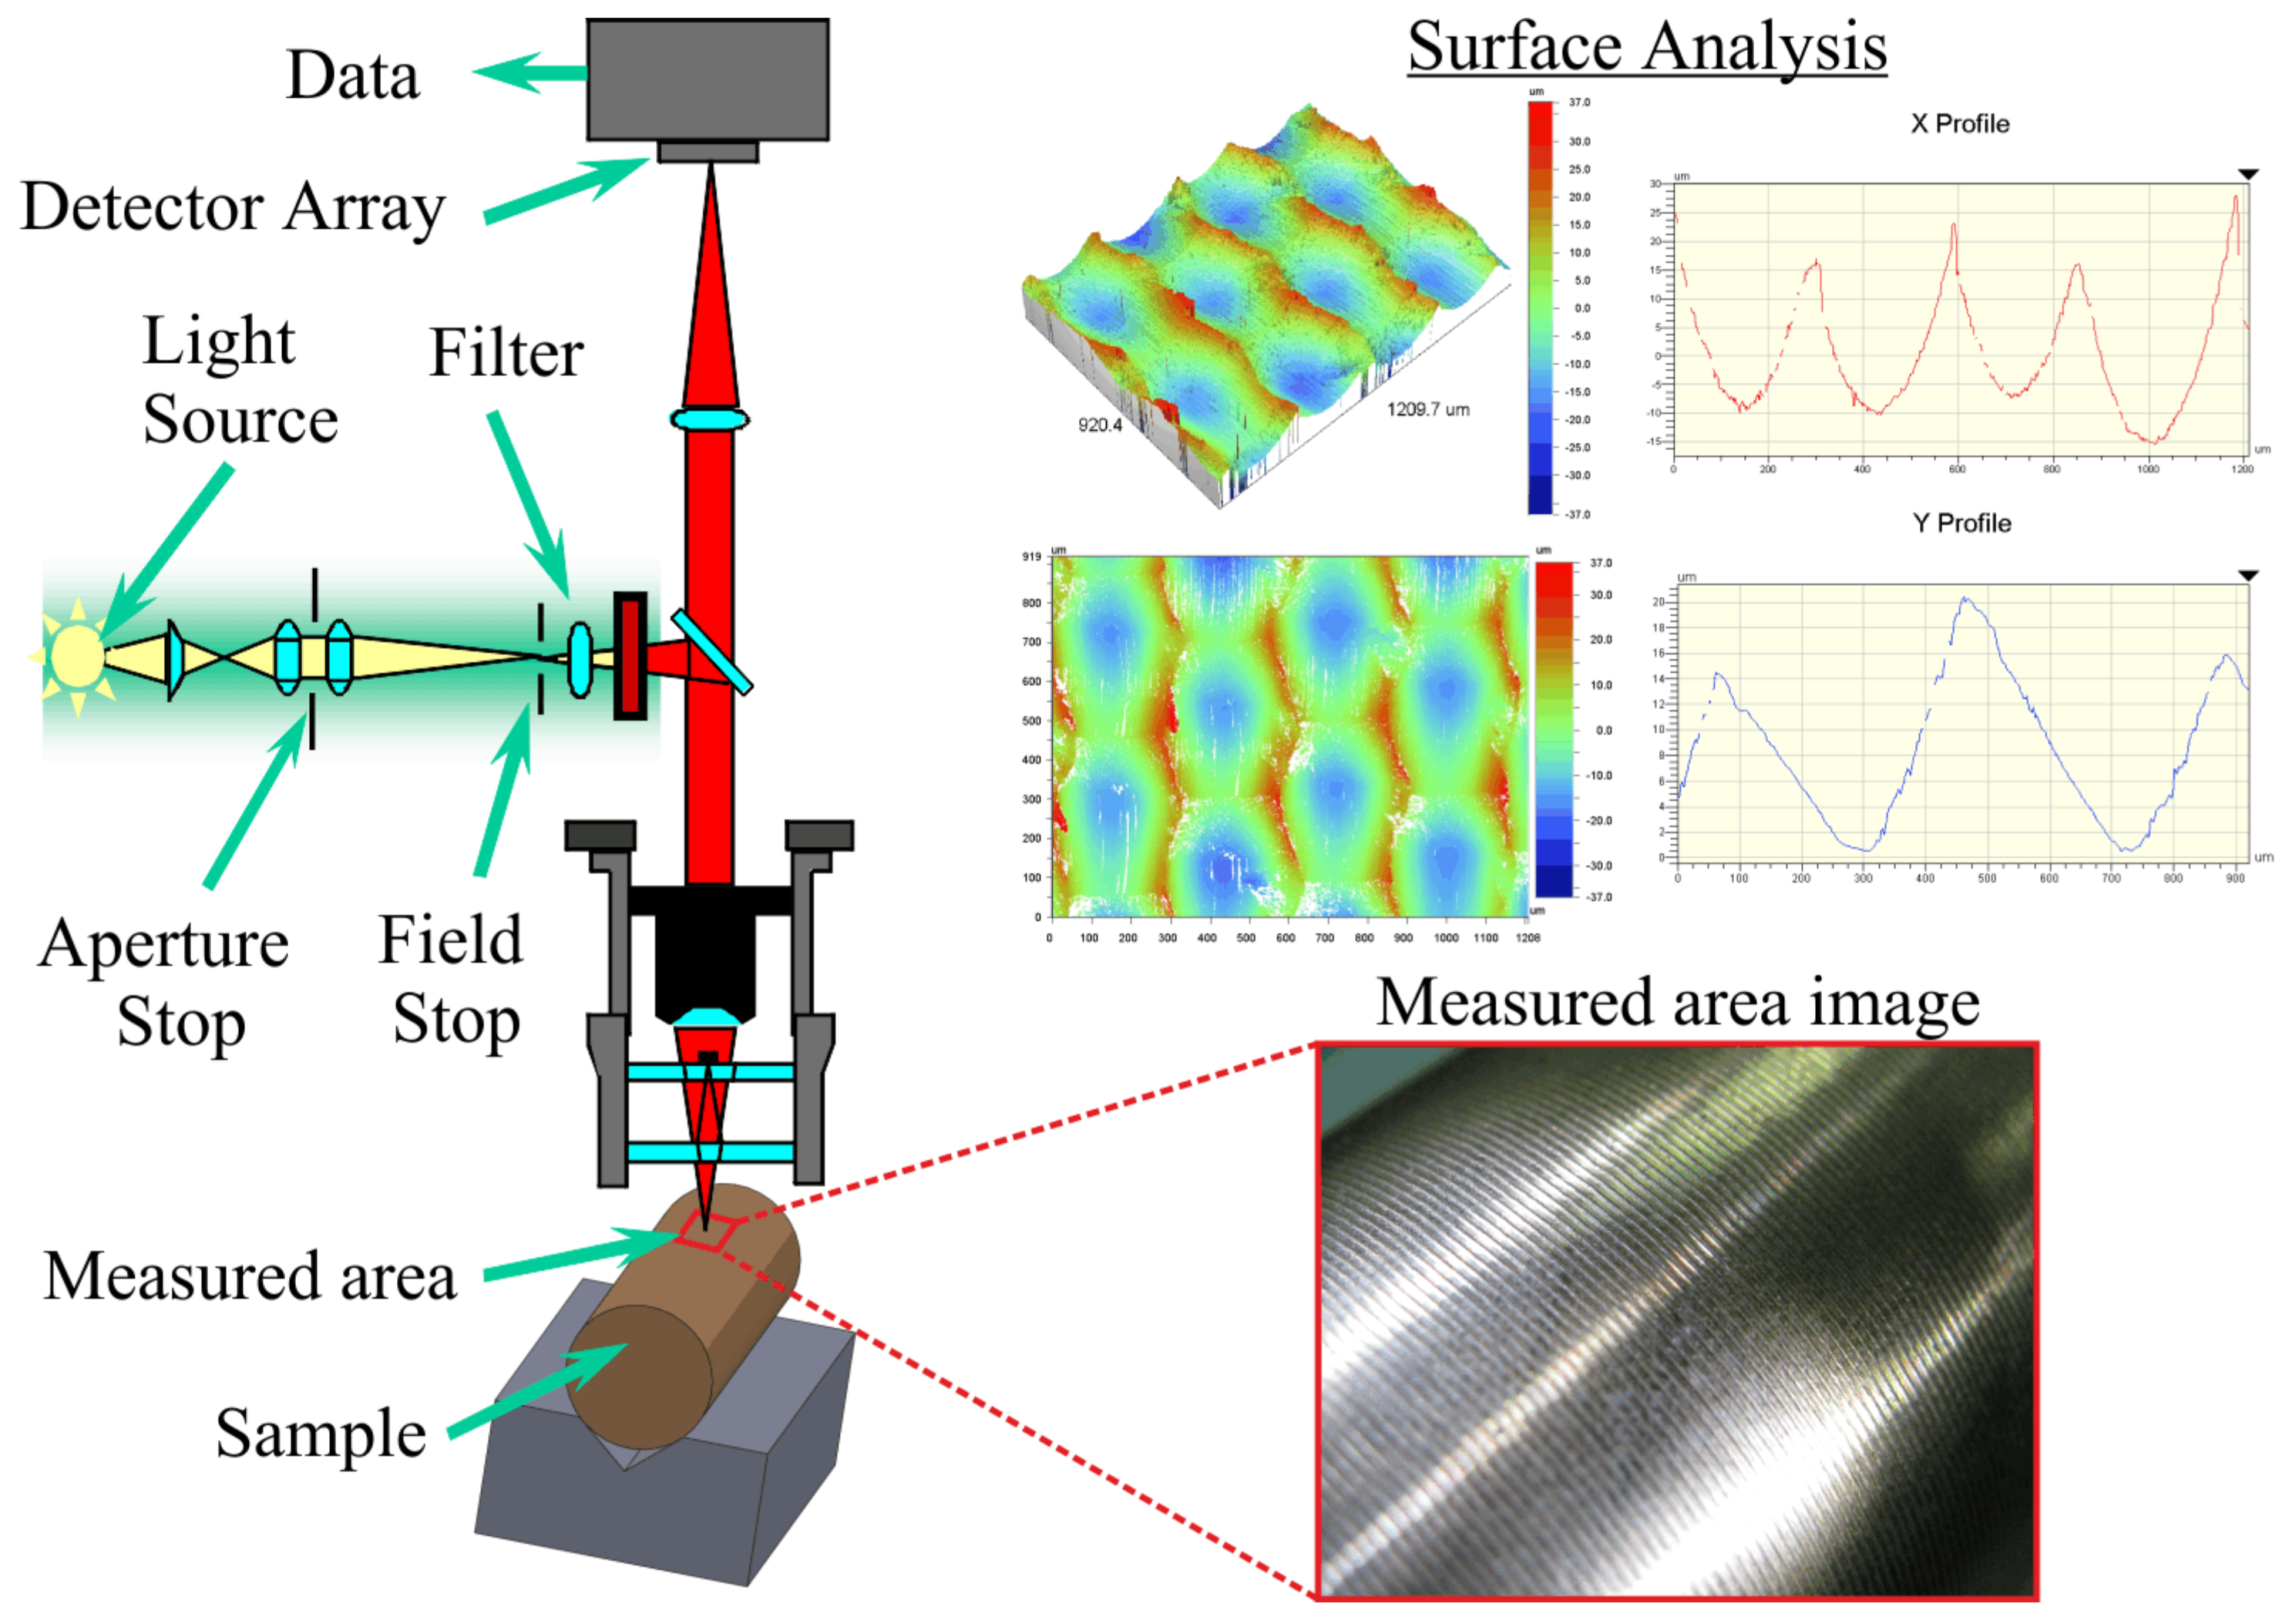
2.4. Machinability Testing

The machinability of the studied brass alloys was experimentally evaluated in terms of cutting force (CF) and surface roughness (SR) measurements. Machinability tests were performed in a turning operation on a Computerized Numerical Control (CNC) lathe machine (DMG Alpha 500, DMG MORI CO. LTD, Tokyo, Japan) according to the instructions of ISO 3685 standard [34]. Uncoated cemented Mitsubishi carbide cutting-tool inserts, with grade name HTi10, ISO range K10 and ANSI range C3 (Figure 2a), were used to conduct the machinability tests [20]. The selected carbide grade is ideal for turning non-ferrous metals, while it ensures high rigidity and wear resistance. The machining length for each bar was 150 mm and it was kept constant throughout all the experiments. The turning process was performed without any lubrication.
For the measurement of the cutting forces, a specific setup, as illustrated in Figure 2b, was employed. The cutting forces were acquired using a 3-axis dynamometer (Kistler 9257B) and an appropriate analog-to-digital device (NI PCI-MIO-16E—1MHz) controlled by means of a graphical user interface (GUI) code developed under LabVIEW 11 software (National Instruments, Austin, TX, USA).
Figure 2c illustrates the machining kinematics and the cutting-force components that were measured in all experiments. The three cutting-force components that arise due to the cutting process and the chip formation are the following: the main cutting force Fc, the passive force Fp, and the feed direction force Ff. The magnitude of the main cutting force was dominant in comparison to the other force components and, therefore, the machinability study was focused specifically on this force component. As shown, the main cutting force Fc is built up immediately at the entry of the cutting tool in the rotating specimen and it becomes both a static (Fc, st) and dynamic part (Fc, dyn), apparently.
The static part is stable throughout the whole measurement and determines the mean value of the main cutting force, which is taken into account in this study. Moreover, it expresses the specific cutting resistance of the machined material and, therefore, is assumed as a criterion of the machinability evaluation. Regarding the emerged dynamic part of the cutting force, an amplitude distortion due to the chip formation, chip flow and chip segmentation was evident. In order to achieve reliable results, two repetitions of the turning tests were performed for each set of the selected cutting parameters and the average value of the measured main cutting force was considered in the subsequent evaluation analysis.
The surface roughness (SR) as the second criterion selected for machinability evaluation was exploited. A complete system for quantitative 3D topography including a Wyko NT1100 Optical Profiling system (Veeco, Tucson, AZ, USA) supported by Wyko Vision 32 analysis software was utilized. This provides an accurate, non-contact surface metrology based on white-light interferometry to achieve a high resolution of 3D surface roughness measurements at nanometer scale. In this study, the three-dimensional roughness average (Ra) over the entire measured area according to ASME-ANSI B46.1 was evaluated [35]. Roughness average (Ra) was selected as the most representative surface-roughness characteristic, used in case of industrial applications in brass component manufacturing. Although this is a partial surface-topography evaluation (other features of roughness were also retrieved, such as Rz, Rt, etc.), it is considered the most suitable parameter for such comparison measurements since it constitutes a very common quality criterion included in relevant customer specifications.
Figure 3 illustrates the principle of 3D white-light interferometry for surface roughness measurement, which was adopted as the most adequate technique for the scope of the current research. The surface analysis results comprise the 3D topographical map and 2D cross-sections, which show both the shape and the resulting roughness. Furthermore, all tribological data according to the ASME-ANSI B46.1 standard were calculated. As mentioned above, two repetitions were also exploited for each set of the selected cutting parameters and the average roughness value was deduced.

2.5. Statistical Evaluation

For the elaboration of machinability optimization, a method of Taguchi for 4 factors at 4 levels was employed. The number of levels is defined mainly by the available brass alloys for comparison (CW614N, CW510L, CW511L and C27450). The individual cutting parameters (depth of cut, feed rate and cutting speed) for each level, were carefully selected in order to apply this methodology for the entire spectrum of machining conditions utilized on the present equipment. A design of experiments (DOE) Taguchi method and ANOVA were conducted to reduce the number of experiments using Minitab Software (version 16, Minitab Inc., State College, PA, USA). The orthogonal array approach proposed by Taguchi has been used for the experimental design. Four machining parameters, namely cutting speed (CS), depth of cut (DC), feed rate (FR) and material (M), were selected as control factors. Several preliminary experiments were executed for the determination of the ranges of the cutting conditions. Table 3 presents the process parameters and their levels. The appropriate choice for planning the experiments, according to Taguchi’s quality in design concept, was the standard L16 (44) orthogonal array (OA), which is shown in completed form in Table 4.

3. Results and Discussion

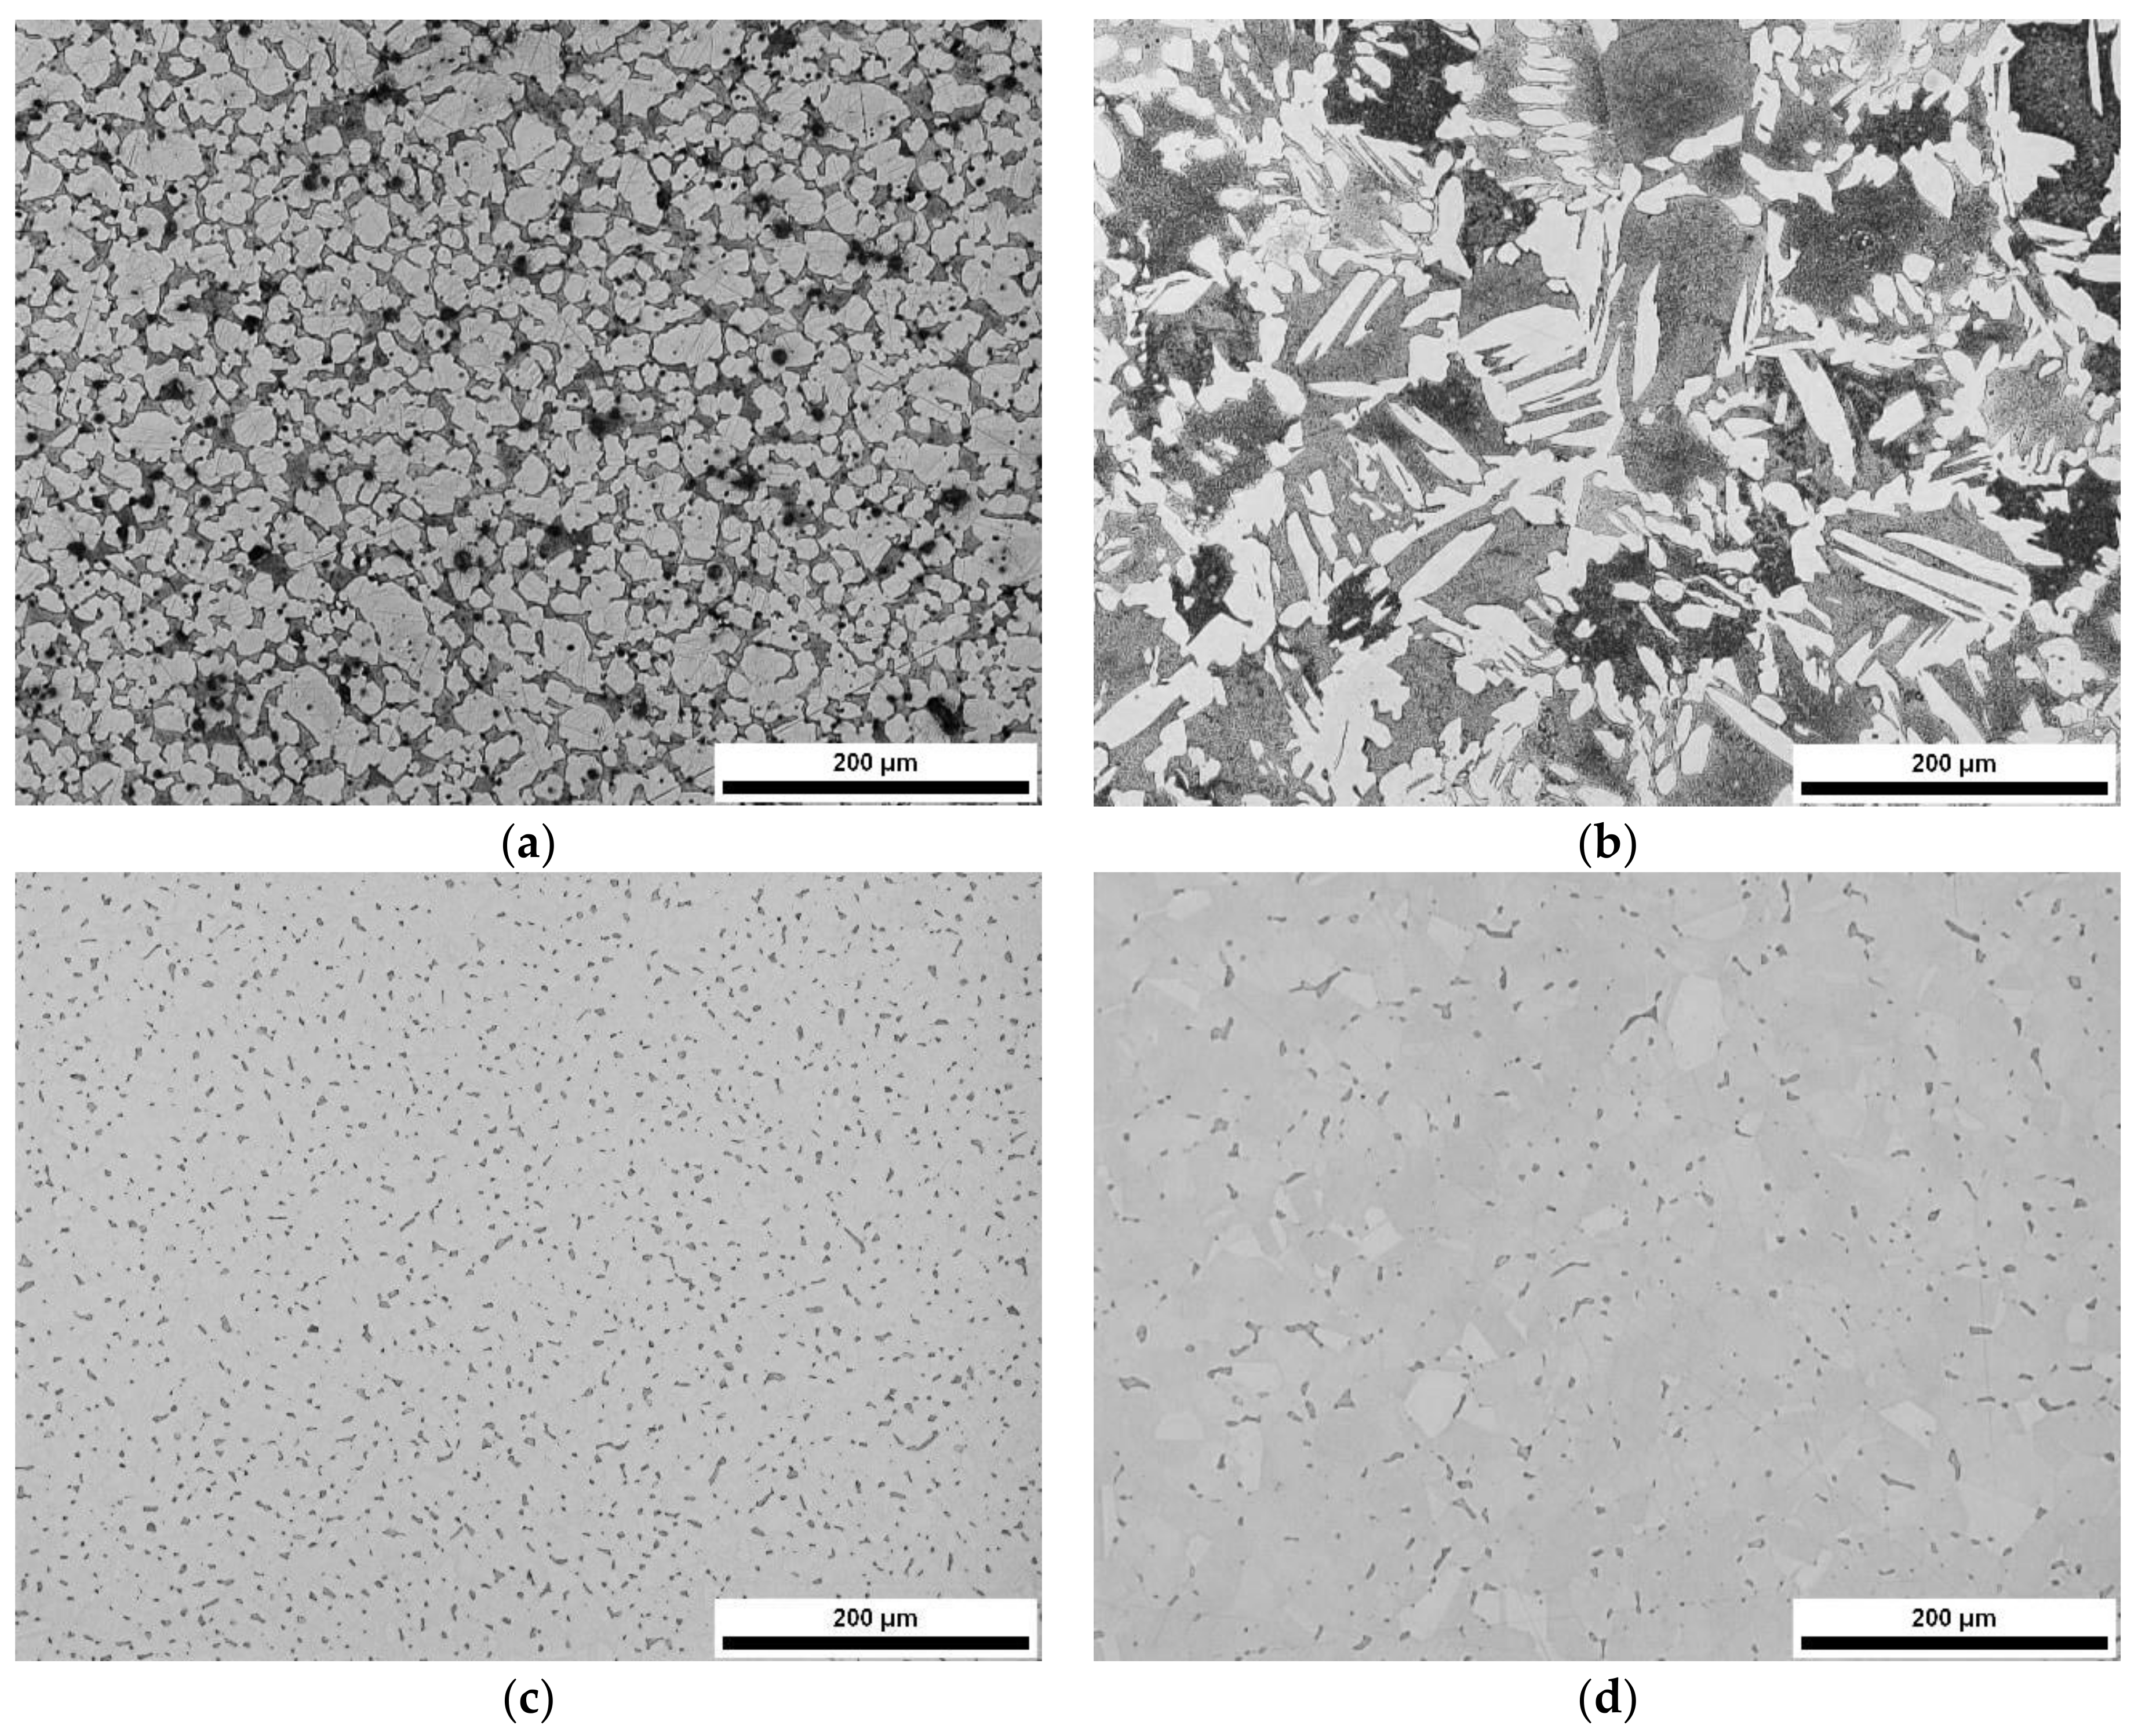
3.1. Microstructure and Mechanical Properties

Metallographic evaluation revealed a duplex-phase microstructure consisting of a mixture of α-β phases of variable content, as anticipated in the Cu-Zn alloy system (Figure 4 and Figure 5). Moreover, the microstructure of the CW614N alloy contains ~3% Pb particles, which appeared as black dots (in optical micrographs), that are non-dissolved in α- or β-phase (Figure 4a). Scanning electron microscopy (SEM) observations at higher magnification (×1000) confirmed the findings of the optical microscopy concerning the variation of β-phase content for each studied brass alloy (Figure 5).
The tensile properties augmented significantly with the increase of β-phase volume fraction in brass alloys. More specifically, CW510L (60% β-phase) and CW614N (33% β-phase) exhibited the highest tensile strength (460 MPa and 430 MPa, respectively) and hardness (127 HV and 132 HV, respectively), while they show the lowest total elongation (41% and 28%, respectively), compared to CW511L and C27450 alloys, see also Table 1 and Figure 4 and Figure 5 [6]. The β-phase content is inherently related to the machinability and most effectively to the chip breakability [36]. Chip breaking is mainly controlled by the distribution of Pb particles in conventional leaded brass alloys, while β-phase fraction exerts a major influence on shear band formation and micro-crack generation in lead-free alloys. In a previous research work, CW614N and CW510L possessed the optimum chip-breaking capability, followed by C27450 and CW511L alloys. The C27450 was marginally superior compared with CW511L alloy, due to its slightly higher content of Pb, which promotes chip breaking [8]. Apart from chip-breaking capability, additional characteristics such as cutting force and surface roughness play an important role in ranking machinability performance. The respective results, pertaining to the optimization of the aforementioned characteristics, are discussed in the following sections.

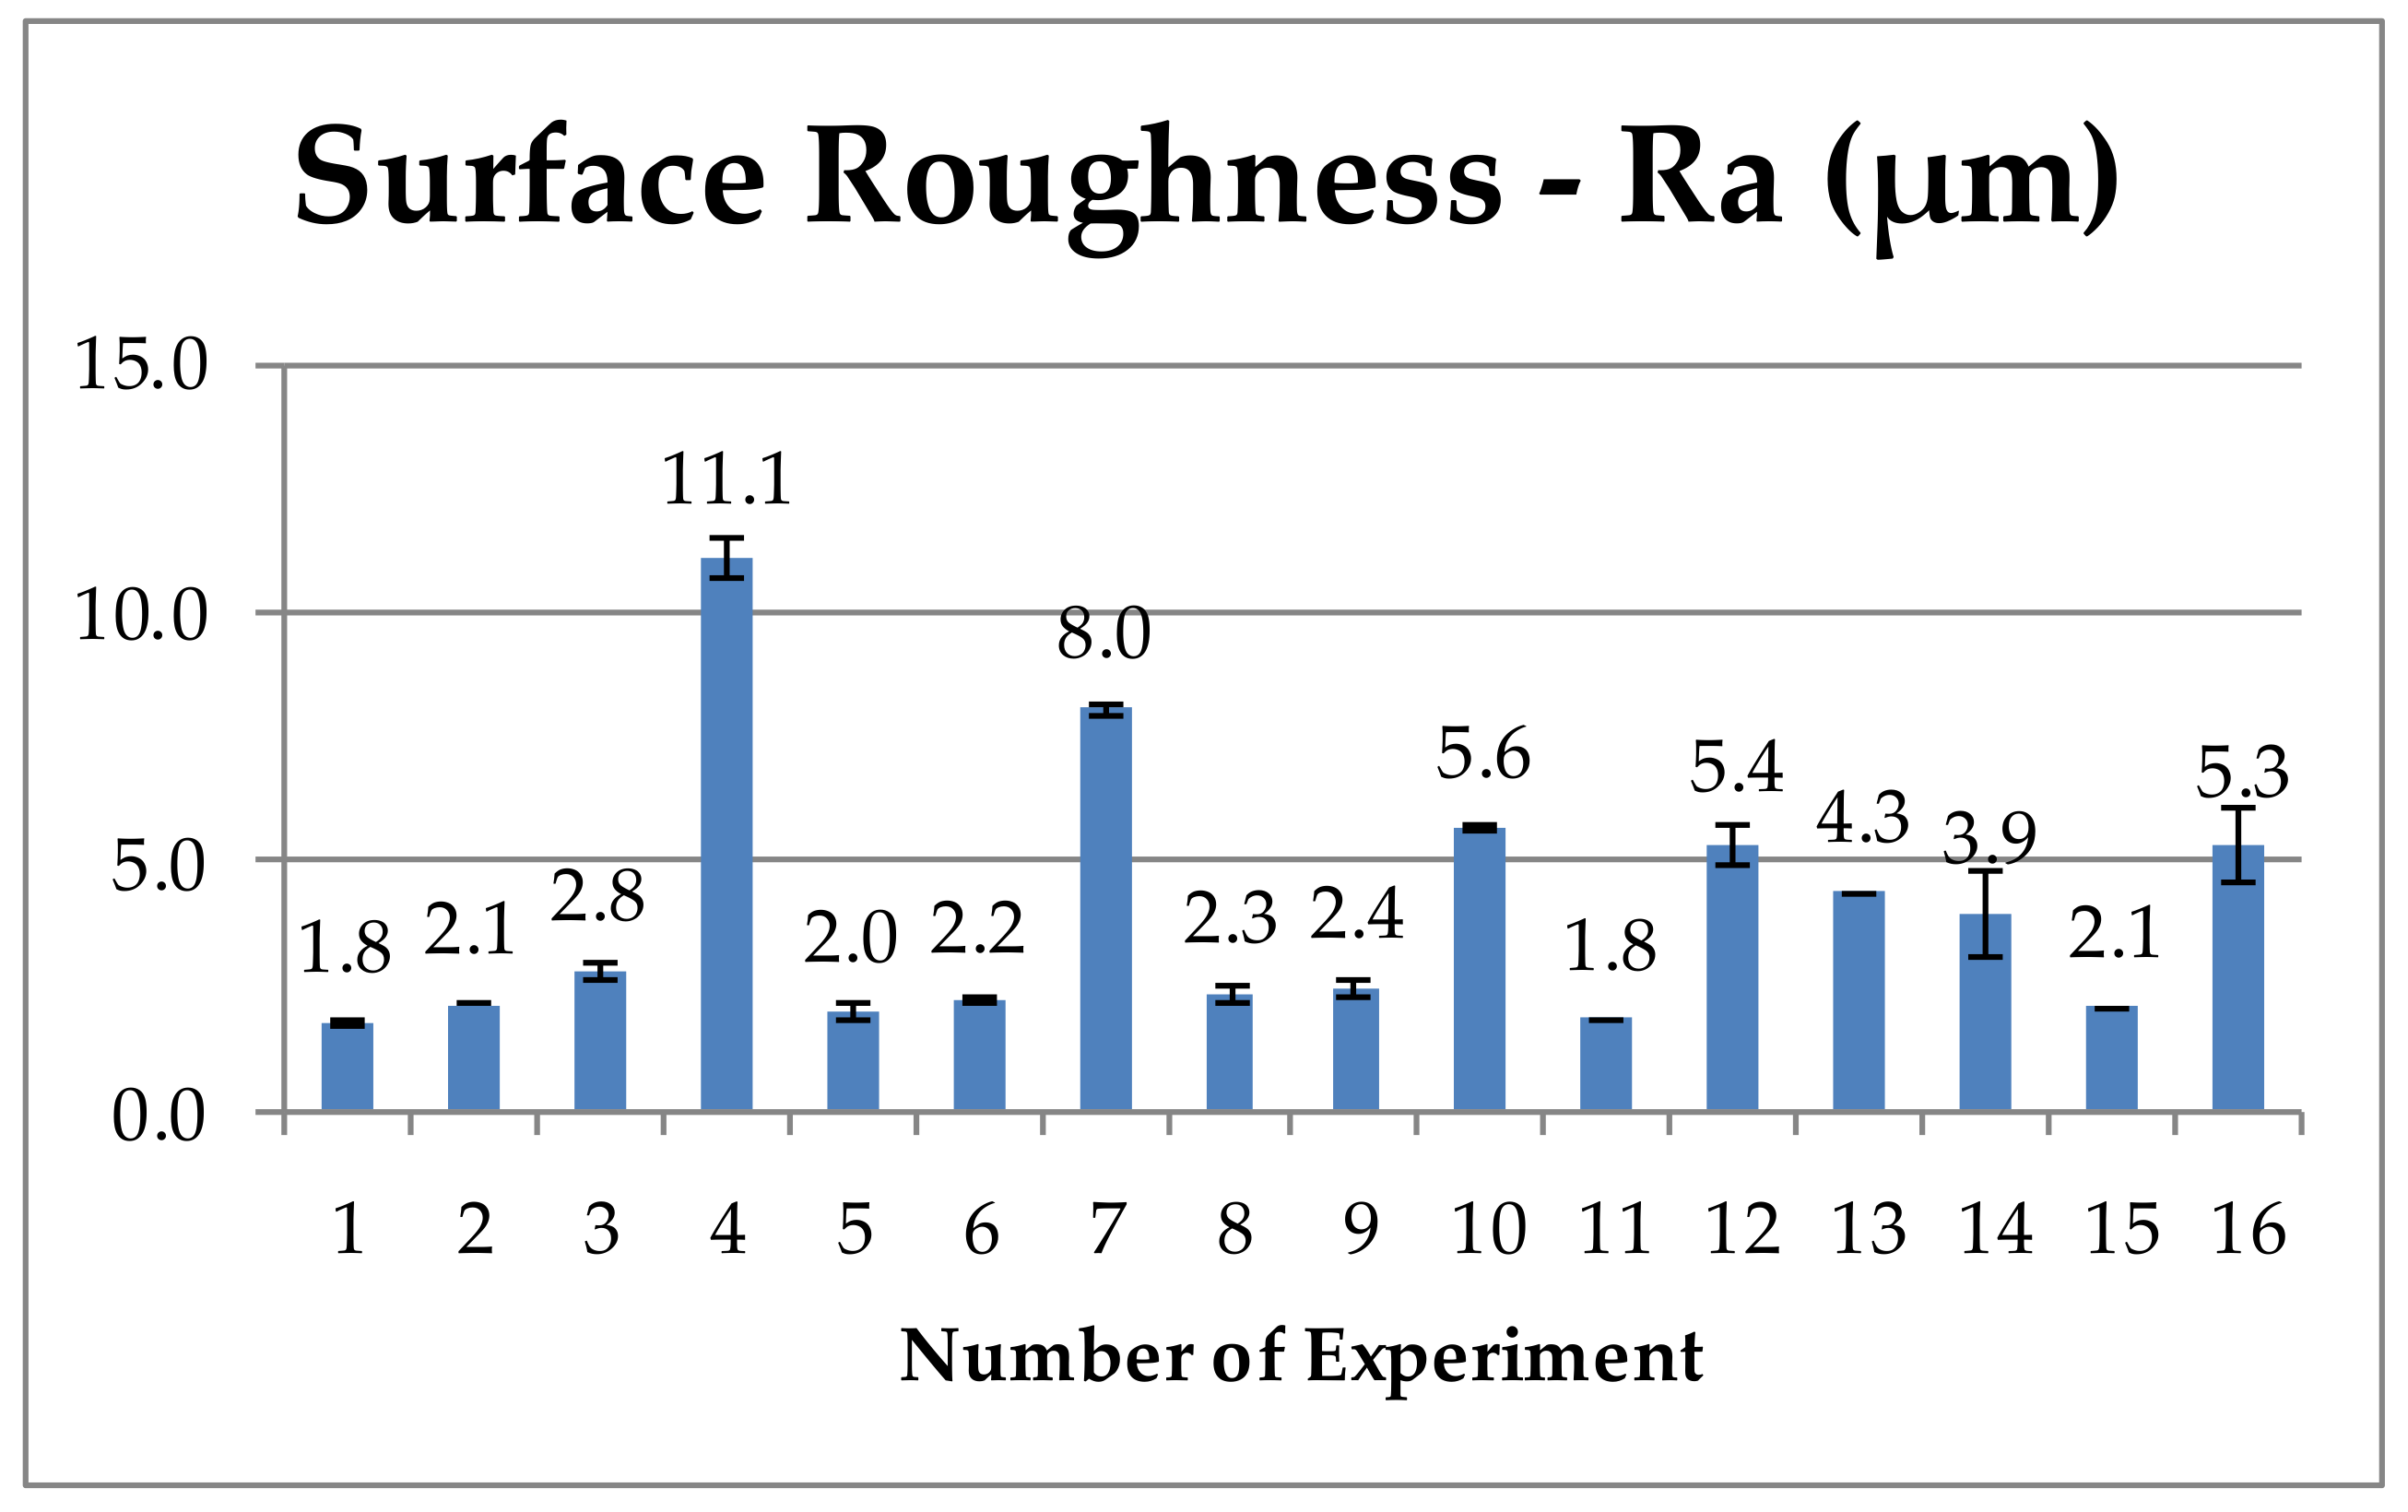
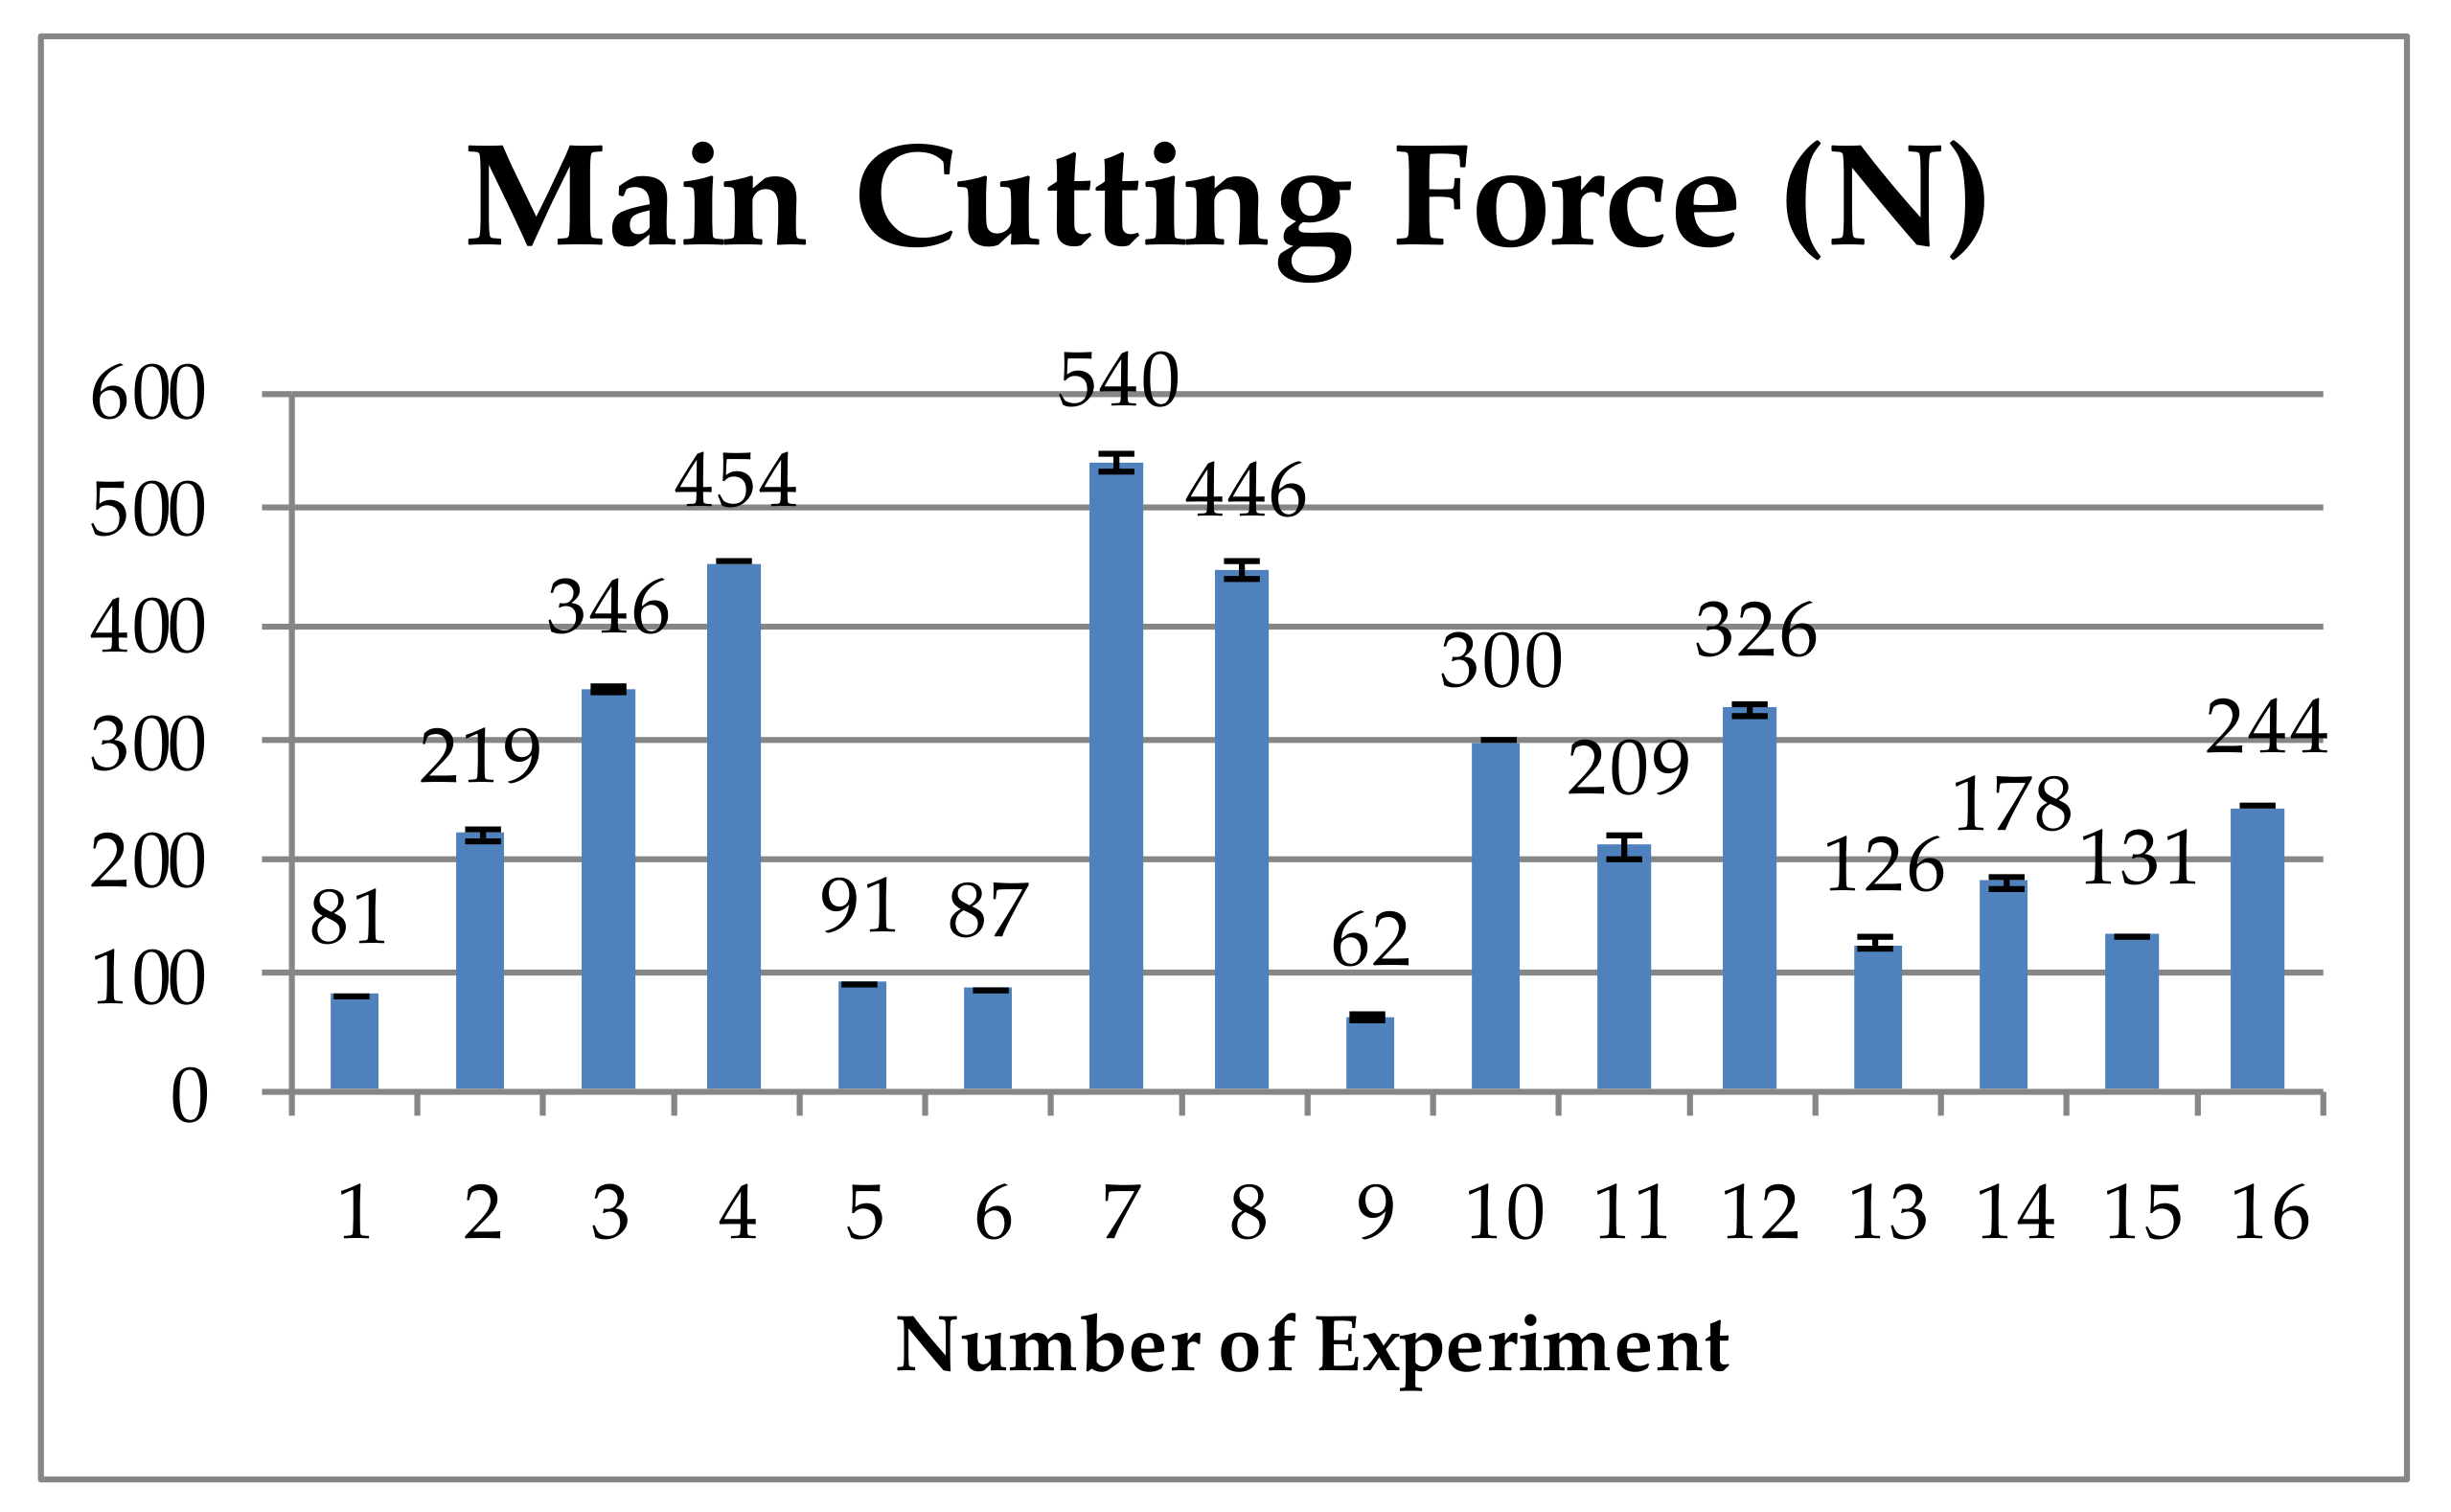
3.2. Machinability Evaluation

During the machinability evaluation, two quality characteristics were selected: the cutting force (CF) and the surface roughness (SR). For reliability reasons, the experiments for the two quality characteristics were repeated twice; see experimental results in Table 5 (“REP” stands for replicate). The particular quality characteristics, namely cutting force (CF) and surface roughness (SR), have to be minimized and hence the “smaller-the-better” type quality criterion has been selected for each of the data means and signal-to-noise responses. The governing Equation (1) for the signal-to-noise ratio (S/N) using the above criterion was:
S / N = 10 log ( y i 2 / n ) ,
where yi corresponds to the performance value of the ith experiment and n was the number of repetitions.

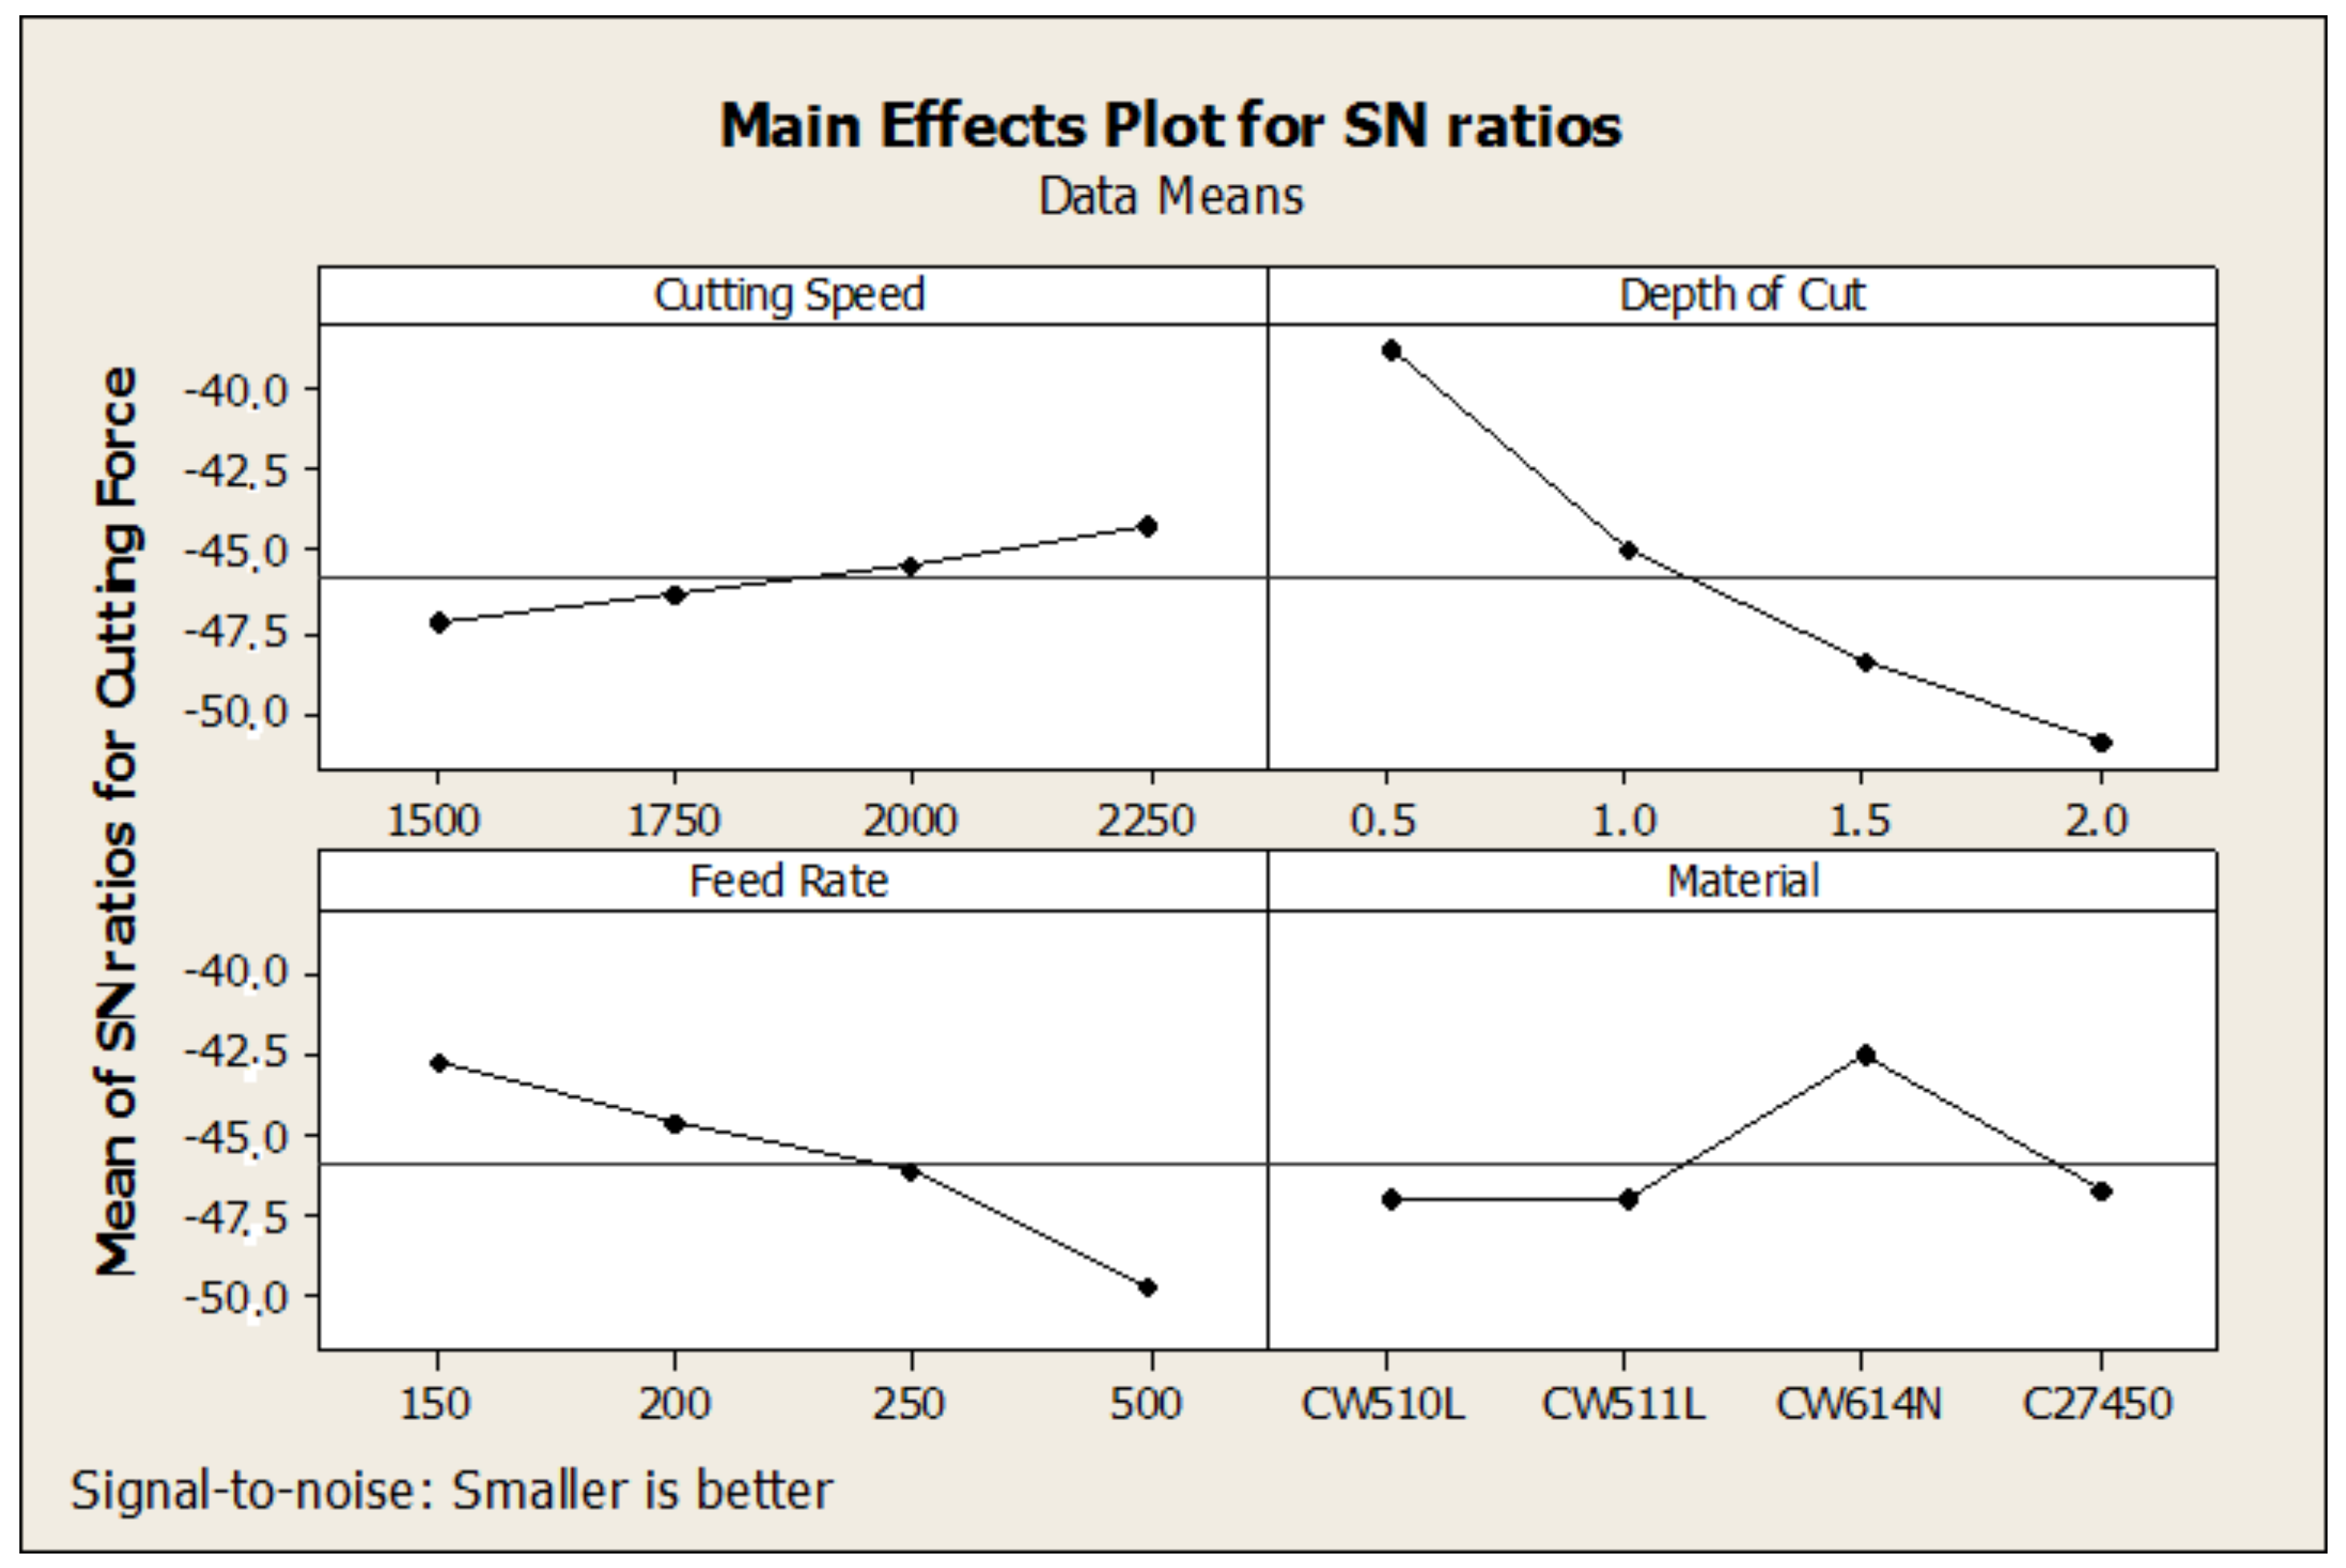
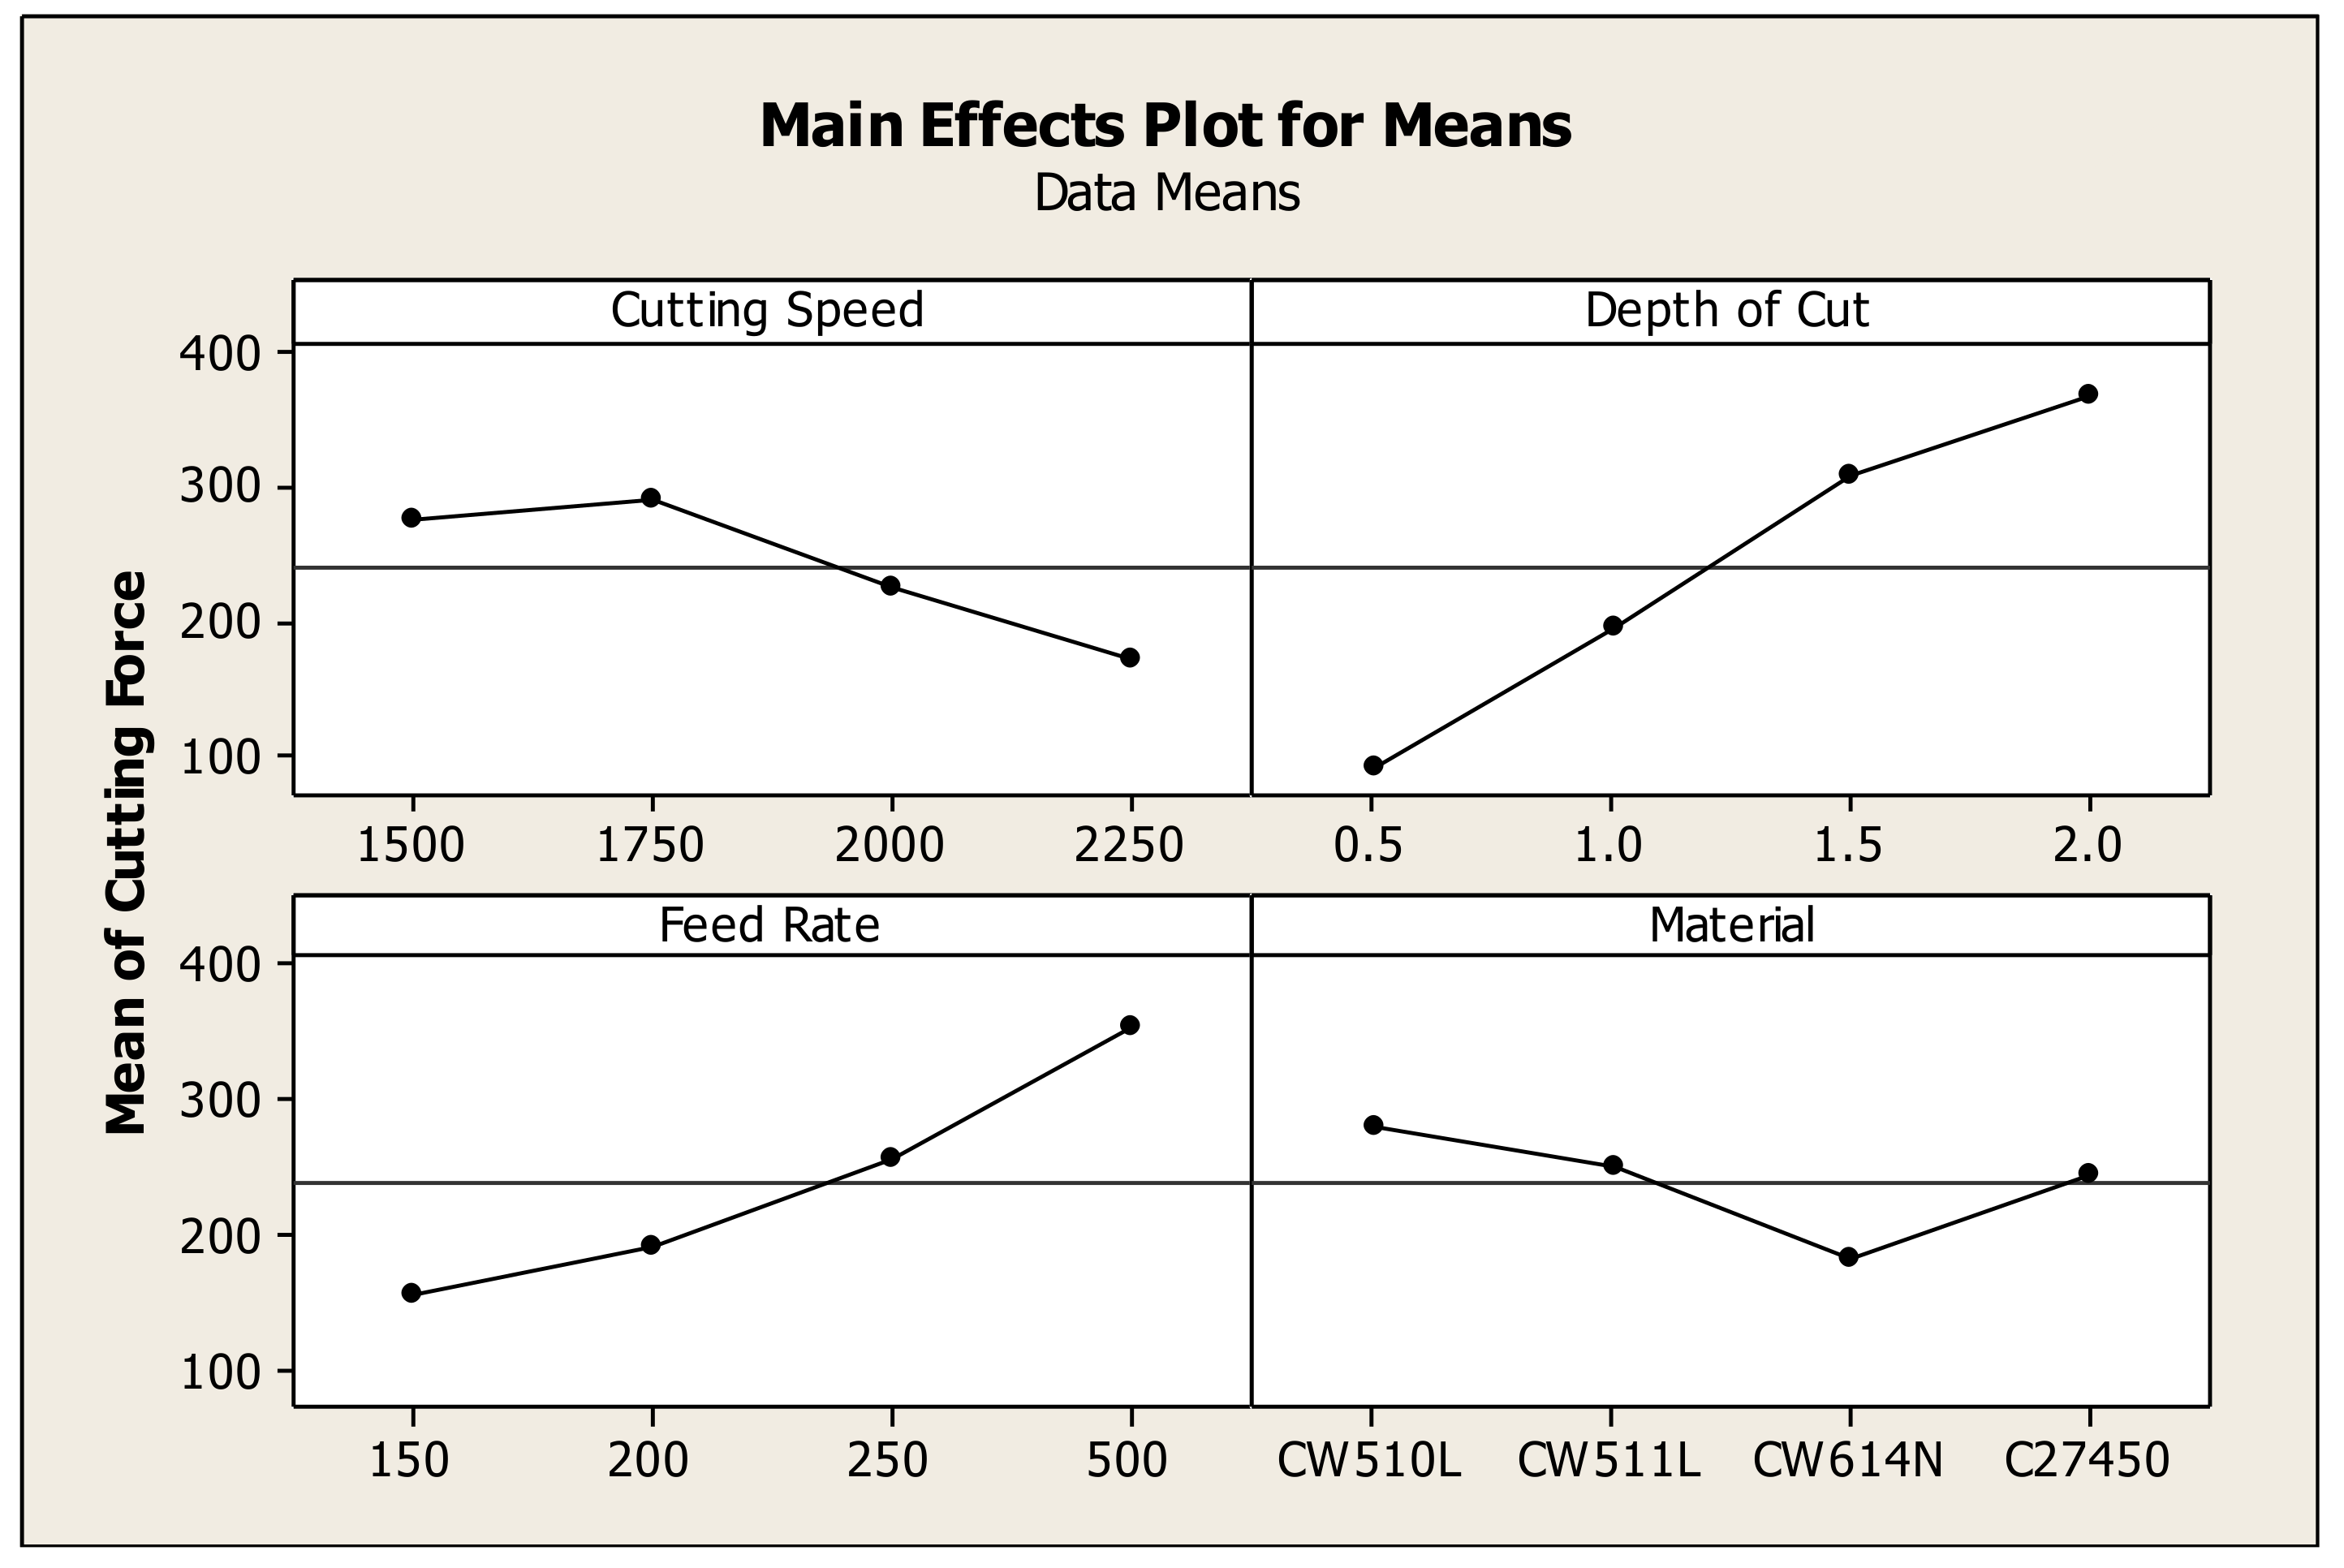
3.3. Cutting-Force Optimization

Characteristic histograms of cutting force, produced under various turning conditions, are shown in Figure 6.
The plots of main effects of S/N ratios (Figure 7) and data means (Figure 8) indicated that the optimum values of cutting parameters that minimize the cutting force were the following:
  • Alloy type: CW614N;
  • Cutting speed: 2250 rpm;
  • Depth of cut: 0.5 mm;
  • Feed rate: 150 mm/min.
Experimental results indicated that the most critical factor affecting the cutting force (CF), during brass-bar machining, is the depth of cut, while the less influential factors for CF are the cutting speed and the type of brass alloy (Table 6). An important step in the Taguchi methodology is to perform confirmation experiments. The predicted S/N ratio using the optimal level of the design parameters can be calculated by the following equation [37]:
( S / N ) predicted = ( S / N ) m + i = 1 n ( ( S / N ) i ( S / N ) m ) ,
where (S/N)m is the total mean S/N ratio, (S/N)i is the S/N ratio at the optimal level of the ith parameter, and n is the number of the main design parameters that affect the quality characteristic.
In the case of cutting force: (S/N)m = −45.8369.
So, the predicted S/N ratio using the optimal parameters for cutting force (CF) is given below:
(S/N)predicted = −30.78
From Equation (1) and substituting the (S/N) term with the predicted value (−30.78) this yields to:
y = Predicted Cutting Force = 34.59 N
Table 7 shows the comparison of the estimated (predicted) and the measured (experimental) cutting force values using the optimal conditions, where it has been deduced that there is sufficient agreement between the predicted (34.59 N) and the experimental cutting force (39.37 N) values.
In terms of cutting force, it seems that the conventional leaded alloy CW614N exhibits the highest machinability performance, signifying the dominant effect of the presence of Pb on cutting force reduction, as was also confirmed in case of chip breakability [8].

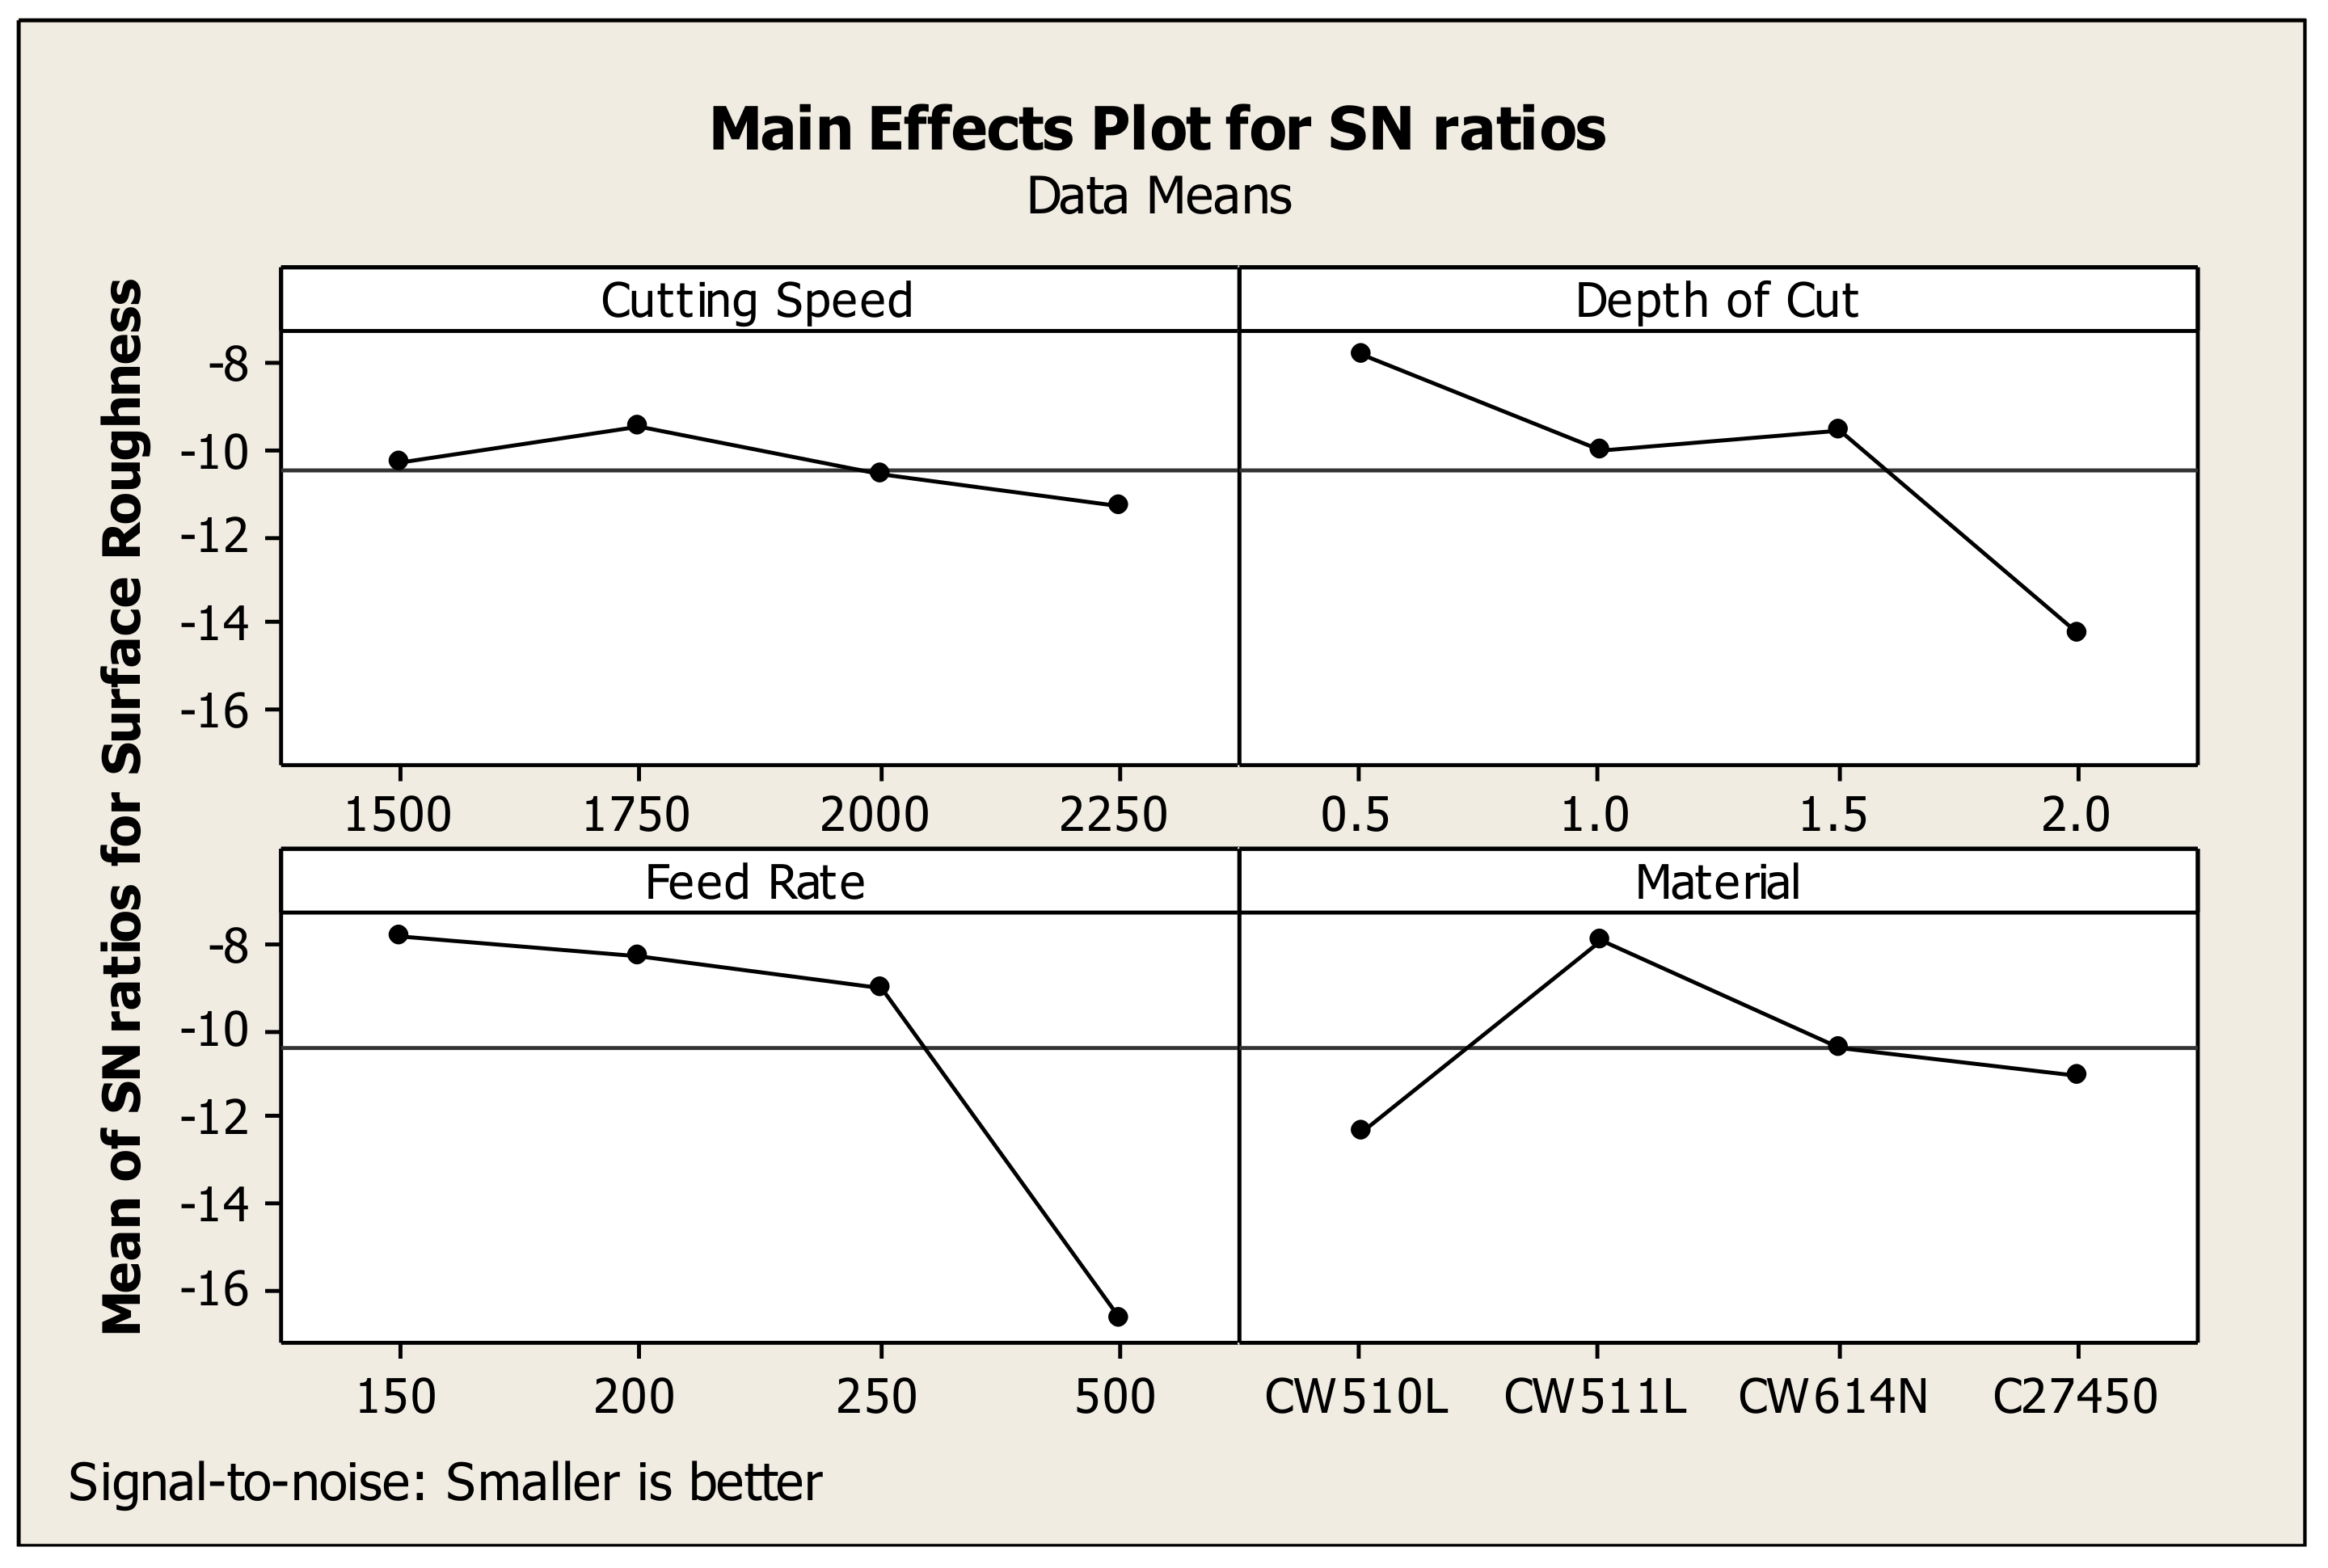
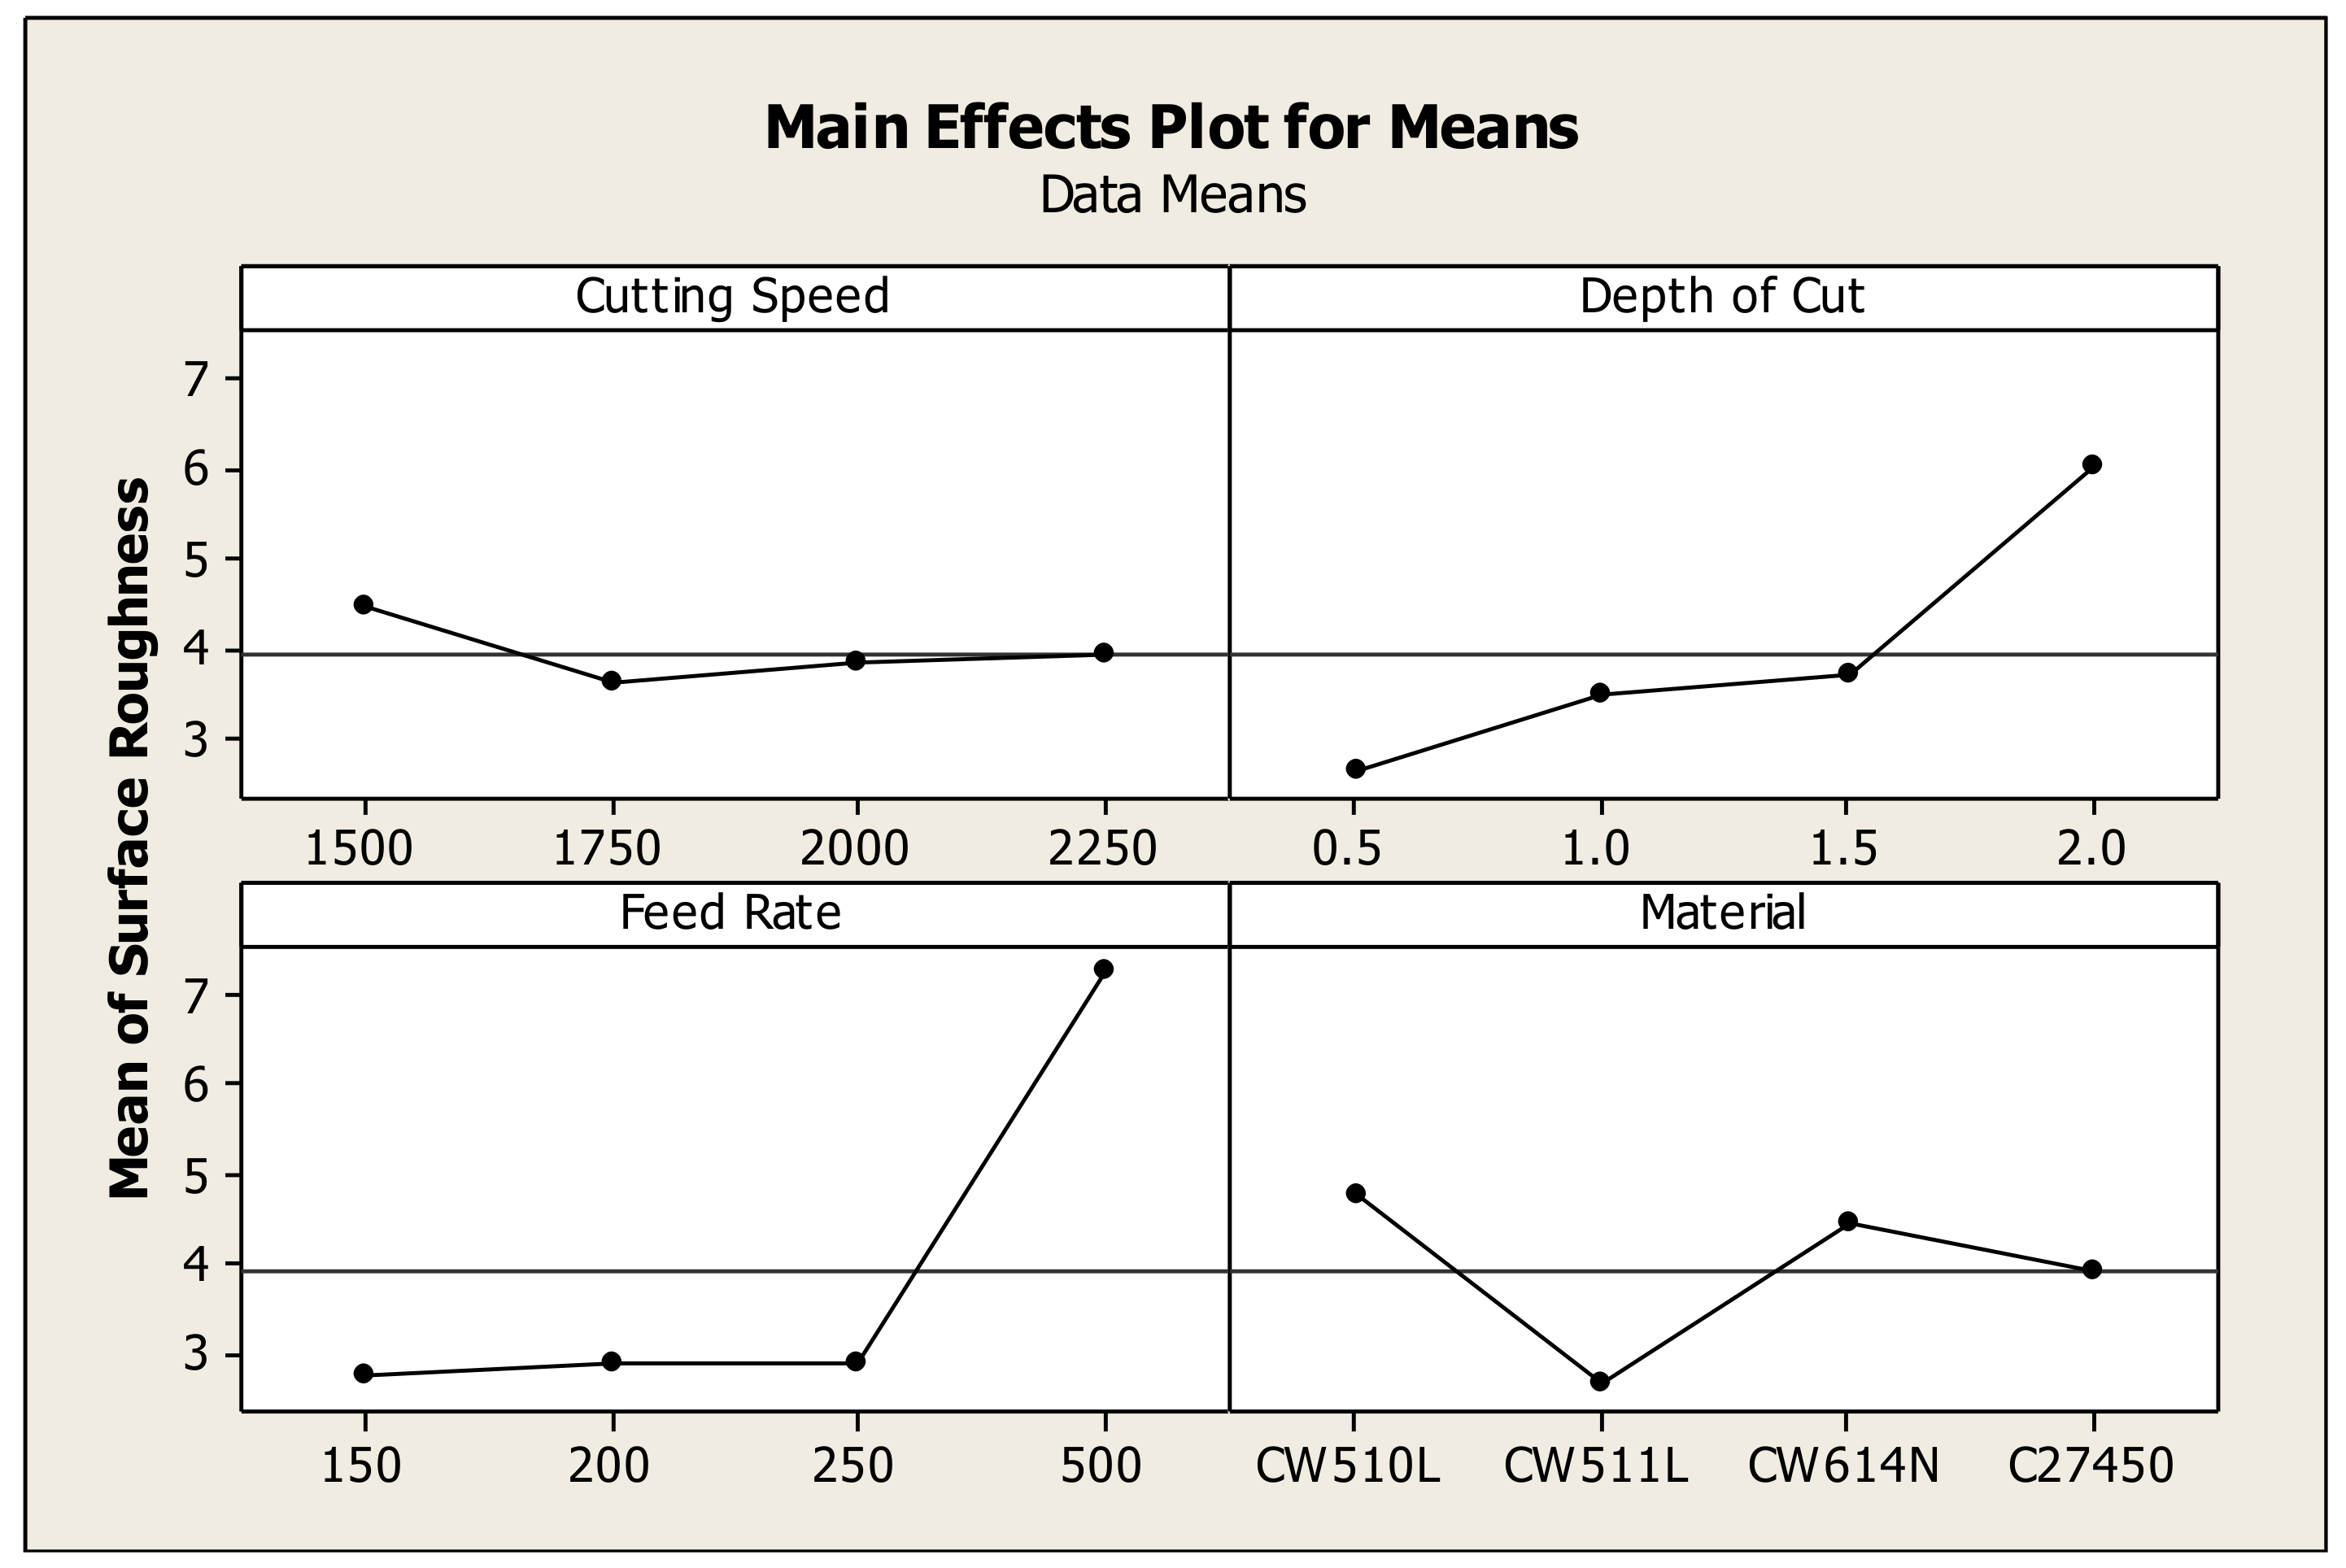
3.4. Surface-Roughness Optimization

Characteristic histogram of surface roughness, produced under various turning conditions, is shown in Figure 9.
The graphs of the responses of S/N ratios (Figure 10) and data means (Figure 11) indicated that the values of cutting parameters which optimize the surface roughness were the following:
  • Alloy type: CW511L;
  • Cutting speed: 1750 rpm;
  • Depth cut: 0.50 mm;
  • Feed rate: 150 mm/min.
Experimental results indicated that the most critical factor affecting the surface roughness (SR), during brass-bar machining, is the feed rate, while SR seems to be not so highly sensitive to cutting speed and the type of brass alloy used varied (Table 8). In order to verify the adequacy of the Taguchi methodology, a confirmation test was performed. The predicted S/N ratio using the optimal level of the design parameters can be calculated by Equation (2).
In the case of surface roughness:
(S/N)m = −10.4436
So, the predicted S/N ratio using the optimal parameters for surface roughness (SR) can be obtained and calculated as previously:
(S/N)predicted = −1.72
Therefore, the predicted surface roughness, as calculated by Equation (1), is:
y = Predicted Surface Roughness = 1.22 μm
Table 7 shows the comparison of the estimated (predicted) and the measured (experimental) surface roughness where it seems that there is a relative agreement between the predicted (1.22 μm) and the experimental (1.71 μm) surface-roughness values.
Regarding surface roughness, the highest score was achieved by lead-free alloy CW511L, compared with the other lead-free alloys studied and a typical leaded one, which pinpoints a promising candidate whereby surface quality is considered as the most critical machinability criterion.

3.5. Analysis of Variance (ANOVA)

The contribution of each factor to the cutting force and surface roughness during the machining of lead-free brass alloys can be determined by performing ANOVA based on equations [37,38,39], which are listed below:
SS T = i m n i 2 1 m ( i = 1 m n i ) 2 ,   Total   Sum   of   Squares   ( SS T )
SS p = j = 1 t ( S n j ) 2 t 1 m ( i = 1 m n i ) 2 ,   Factorial   Sum   of   Squares   ( SS p )
V p ( % ) = SS p D p × 100 % ,   Factorial   Variance   ( V p )
SS p = SS p D p V e ,   Corrected   Sum   of   Squares   of   a   factor   ( SS p )
P p ( % ) = SS p SS T × 100 % ,   Percent   Contribution   ( P p )
where m is the total number of the experiments, ni is the S/N ratio at the ith test, Snj the sum of the S/N ratio involving this factor and level j, Dp is the degree of freedom for each factor, and Ve is the error variance.
The percent contribution (Pp) is used to evaluate the significance of the factorial change on the quality characteristic, i.e., cutting force and surface roughness [40]. The results of ANOVA for the cutting force and surface roughness are summarized in Table 9 and Table 10. The data given in Table 9 and Table 10 show the contribution of the four factors, i.e., cutting speed, depth of cut, feed rate and materials to the quality characteristics. It is clear that, among the selected factors, the depth of cut and feed rate have the major influence on the cutting force and surface roughness, respectively. By ranking their relative contributions, the sequence of the four factors affecting the cutting force is the depth of cut, the feed rate, the material type and, finally, the cutting speed, while for surface roughness the corresponding sequence in decreasing order is the following: feed rate, depth of cut, material type and, finally, cutting speed. In the ANOVA analysis, the percentage error (Pe) contribution to the total variance is lower than 15% (0.43% and 10.51% for cutting force and surface roughness, respectively), showing that no important factor is missing in the experimental design [37].

4. Conclusions

The continuously increasing strictness of regulations governing drinking-water quality parameters has required explicitly the design and use of new and environmentally friendly alloys for the fabrication of components in use in domestic water circuits. Copper alloys (brasses) are principally used for the manufacturing of fittings, valves and connectors for such applications. In this framework, the present study was focused on machinability research using optimization techniques for lead-free brass alloys which are destined to replace conventional leaded brasses for the fabrication of complex-shaped components. The findings of the current research are summarized below.
The optimization, of the two additional machinability criteria, i.e., cutting force and surface roughness, was attempted using DOE and ANOVA approaches for the selected lead-free brass alloys (CW510L, CW511L and C27450) compared with a reference leaded alloy (CW614N). The main findings of this investigation are the following:
  • Cutting force is optimized using the following conditions (using signal-to-noise and data means): the optimal alloy type is CW614N, cutting speed = 2250 rpm, depth cut = 0.5 mm and feed rate = 150 mm/min. ANOVA showed that the contributions of the above factors are 11.13%, 3.57%, 64.40% and 20.47%, respectively. The analysis coming from data means and S/N response tables indicated that the depth of cut is the most influential factor, while ANOVA proved that this parameter has the highest percent contribution (Pp = 64.40%) and, consequently, plays the most affecting role in the determination of cutting-force measurements. Also, since the percentage error (0.43%) contribution in ANOVA analysis is lower than 50%, no repetition of any experiment is needed.
  • Surface roughness is optimized using the following conditions (using signal-to-noise and data means): the optimal alloy type is CW511L, cutting speed = 1750 rpm, depth cut = 0.50 mm and feed rate = 150 mm/min. The contributions of the above factors are 9.78%, 0.95%, 23.46% and 55.31%, respectively, according to the ANOVA technique. The same ranking order was also achieved by the S/N method. Feed rate has the highest percentage contribution (Pp = 55.31%), as it was proven by ANOVA and it constitutes also the most influential factor according to data means and S/N response tables. Since the percentage error (10.51%) contribution deduced from ANOVA analysis is lower than 50%, no experimental repetition is required.
  • Confirmation experiments indicated that a considerable agreement leading to around 10% deviation was achieved for cutting force (predicted 34.59 N vs. experimental 39.37 N). Although surface-roughness experiments resulted in higher differences (predicted 1.22 μm vs. experimental 1.71 μm), the obtained values are considered comparable and of the same order of magnitude, taking into account the entire spectrum of the tested conditions.
  • In terms of cutting-force optimization, the leaded alloy CW614N exhibited the highest machinability performance, while for surface roughness, the lead-free CW511L was appointed as the optimum alloy selection. Although leaded brasses still dominate in the machining industry, this result offers a hopeful perspective, expanding the horizons for further research towards machinability improvement through further alloy and microstructural design.

5. Further Research

This study was a part of an extended industrial research project mostly dedicated to delineating the properties and machinability of eco-friendly brass alloys compared with a common machinable brass widely used in industry. The next steps have also been planned in order to pursue a modification of microstructure using thermal-processing routes without changing the standard alloy composition, and aiming to achieve and/or exceed high machinability standards. This innovative work is in progress and the prospective results are going to be completed and disseminated in a future work shortly.

Acknowledgments

The authors wish to express special thanks to the Administration and Quality Division of FITCO S.A. for continuous support and providing samples for the current investigation. Special thanks are also addressed to A. Rikos and A. Vazdirvanidis (ELKEME S.A.), for their assistance in metallographic sample preparation and examination and for the constructive technical discussion.

Author Contributions

All authors contributed to the implementation of this scientific research work.

Conflicts of Interest

The authors declare no conflict of interest.

References

  1. Kim, H.S.; Kim, W.Y.; Song, K.H. Effect of post-heat treatment in ECAP processed Cu-40%Zn brass. J. Alloys Compd. 2012, 536, S200–S203. [Google Scholar] [CrossRef]
  2. Kumar, R.; Dasharath, S.M.; Kang, P.C.; Koch, C.C.; Mula, S. Enhancement of mechanical properties of low stacking fault energy brass processed by cryorolling followed by short-annealing. Mater. Des. 2015, 67, 637–643. [Google Scholar] [CrossRef]
  3. Pantazopoulos, G.; Toulfatzis, A. Fracture modes and mechanical characteristics of machinable brass rods. Metallogr. Microstruct. Anal. 2012, 1, 106–114. [Google Scholar] [CrossRef]
  4. Li, S.; Kondoh, K.; Imai, H.; Atsumi, H. Fabrication and properties of lead-free machinable brass with Ti additive by powder metallurgy. Powder Technol. 2011, 205, 242–249. [Google Scholar] [CrossRef]
  5. La Fontaine, A.; Keast, V.J. Compositional distributions in classical and lead-free brasses. Mater. Charact. 2006, 57, 424–429. [Google Scholar] [CrossRef]
  6. Toulfatzis, A.; Pantazopoulos, G.; Paipetis, A. Fracture behavior and characterization of lead-free brass alloys for machining applications. J. Mater. Eng. Perform. 2014, 23, 3193–3206. [Google Scholar] [CrossRef]
  7. Pantazopoulos, G. Leaded brass rods C38500 for automatic machining operations. J. Mater. Eng. Perform. 2002, 11, 402–407. [Google Scholar] [CrossRef]
  8. Toulfatzis, A.I.; Pantazopoulos, G.A.; Besseris, G.J.; Paipetis, A.S. Machinability evaluation and screening of leaded and lead-free brasses using a non-linear robust multifactorial profiler. Int. J. Adv. Manuf. Technol. 2016, 86, 3241–3254. [Google Scholar] [CrossRef]
  9. Doostmohammadi, H.; Moridshahi, H. Effect of Si on microstructure, ordering transformation and properties of the Cu60Zn40 alloy. J. Alloys Compd. 2015, 640, 401–407. [Google Scholar] [CrossRef]
  10. Rajabi, Z.; Doostmohammadi, H. Effect of addition of tin on the microstructure and machinability of α-brass. Mater. Sci. Technol. 2018. [Google Scholar] [CrossRef]
  11. Imai, H.; Shufeng, L.; Atsumi, H.; Kosaka, Y.; Kojima, A.; Kondoh, K. Development of lead-free machinable brass with bismuth and graphite particles by powder metallurgy process. Mater. Trans. 2010, 51, 855–859. [Google Scholar] [CrossRef]
  12. Suksongkarm, P.; Rojananan, S.; Rojananan, S. Using recycled bismuth-tin solder in novel machinable lead-free brass. Mater. Trans. 2017, 58, 1754–1760. [Google Scholar] [CrossRef]
  13. Nobel, C.; Hofmann, U.; Klocke, F.; Veselovac, D. Experimental investigation of chip formation, flow, and breakage in free orthogonal cutting of copper-zinc alloys. Int. J. Adv. Manuf. Technol. 2016, 84, 1127–1140. [Google Scholar] [CrossRef]
  14. Toulfatzis, A.; Pantazopoulos, G.; Paipetis, A. Microstructure and properties of lead-free brasses using post-processing heat treatment cycles. Mater. Sci. Technol. 2016, 32, 1771–1781. [Google Scholar] [CrossRef]
  15. Klocke, F.; Nobel, C.; Veselovac, D. Influence of tool coating, tool material, and cutting speed on the machinability of low-leaded brass alloys in turning. Mater. Manuf. Process. 2016, 31, 895–1903. [Google Scholar] [CrossRef]
  16. Schultheiss, F.; Johansson, D.; Bushlya, V.; Zhou, J.; Nilsson, K.; Ståhl, J.E. Comparative Study on the Machinability of Lead-Free Brass. J. Clean. Prod. 2017, 149, 366–377. [Google Scholar] [CrossRef]
  17. Ekinovic, S.; Begovic, E.; Silajdzija, A. Comparison of machined surface quality obtained by high-speed machining and conventional turning. Mach. Sci. Technol. 2007, 11, 531–551. [Google Scholar] [CrossRef]
  18. Huo, D.; Chen, W.; Teng, X.; Lin, C.; Yang, K. Modeling the influence of tool deflection on cutting force and surface generation in micro-milling. Micromachines 2017, 8, 188. [Google Scholar] [CrossRef]
  19. Jomaa, W.; Songmene, V.; Bocher, P. Predictive analytical modeling of cutting forces generated by high-speed machining of ductile and hard metals. Mach. Sci. Technol. 2017, 21, 335–361. [Google Scholar] [CrossRef]
  20. Toulfatzis, A.; Besseris, G.; Pantazopoulos, G.; Stergiou, C. Characterization and comparative machinability investigation of extruded and drawn copper alloys using non-parametric multi-response optimization and orthogonal arrays. Int. J. Adv. Manuf. Technol. 2011, 57, 811–826. [Google Scholar] [CrossRef]
  21. Hassan, K.; Kumar, A.; Garg, M.P. Experimental investigation of material removal rate in CNC turning using Taguchi method. Int. J. Eng. Res. Appl. 2012, 2, 1581–1590. [Google Scholar]
  22. Vaxevanidis, N.M.; Kechagias, J.D.; Fountas, N.A.; Manolakos, D.E. Evaluation of machinability in turning of engineering alloys by applying artificial neural networks. Open Constr. Build. Technol. J. 2014, 8, 389–399. [Google Scholar] [CrossRef]
  23. Gaitonde, V.N.; Karnik, S.R.; Davim, J.P. Optimal MQL and cutting conditions determination for desired surface roughness in turning of brass using genetic algorithms. Mach. Sci. Technol. 2012, 16, 304–320. [Google Scholar] [CrossRef]
  24. Kilickap, E.; Yardimeden, A.; Çelik, Y.H. Mathematical modelling and optimization of cutting force, tool wear and surface roughness by using artificial neural network and response surface methodology in milling of Ti-6242S. Appl. Sci. 2017, 7, 1064. [Google Scholar] [CrossRef]
  25. Koklu, U.; Basmaci, G. Evaluation of tool path strategy and cooling condition effects on the cutting force and surface quality in micromilling operations. Metals 2017, 7, 426. [Google Scholar] [CrossRef]
  26. Haddag, B.; Atlati, S.; Nouari, M.; Moufki, A. Dry machining aeronautical aluminum alloy AA2024-T351: Analysis of cutting forces, chip segmentation and built-up edge formation. Metals 2016, 6, 197. [Google Scholar] [CrossRef]
  27. Ahmed, Y.S.; Youssef, H.; El-Hofy, H.; Ahmed, M. Prediction and optimization of drilling parameters in drilling of AISI 304 and AISI 2205 steels with PVD monolayer and multilayer coated drills. J. Manuf. Mater. Process. 2018, 2, 16. [Google Scholar] [CrossRef]
  28. Box, G.E.P.; Hunter, W.G.; Hunter, J.S. Statistics for Experimenters: Design, Innovation, Discover, 2nd ed.; Wiley: Hoboken, NJ, USA, 2005. [Google Scholar]
  29. Taguchi, G. Introduction to Quality Engineering; Asian Productivity Organization: Tokyo, Japan, 1986. [Google Scholar]
  30. European Committee for Standardization (CEN). BS EN 12164: Copper and Copper Alloys: Rod for Free Machining Purposes; European Committee for Standardization (CEN): Brussels, Belgium, 2011. [Google Scholar]
  31. American Society for Testing and Materials (ASTM). ASTM E407-07ε1: Standard Practice for Microetching Metals and Alloys; American Society for Testing and Materials (ASTM): West Conshohocken, PA, USA, 2007. [Google Scholar]
  32. CEN. BS EN ISO 6892-1: Metallic Materials—Tensile Testing—Part 1: Method of Test at Room Temperature; European Committee for Standardization (CEN): Brussels, Belgium, 2009. [Google Scholar]
  33. International Organization for Standardization (ISO). ISO 6507-1: Metallic Materials—Vickers Hardness Test—Part 1: Test Method; International Organization for Standardization (ISO): Geneva, Switzerland, 2005. [Google Scholar]
  34. ISO. ISO 3685: Tool-Life Testing with Single-Point Turning Tools; International Organization for Standardization (ISO): Geneva, Switzerland, 1993. [Google Scholar]
  35. ASME. ANSI B46.1: Surface Texture (Surface Roughness, Waviness, and Lay); ASME: New York, NY, USA, 2009. [Google Scholar]
  36. Pantazopoulos, G.; Vazdirvanidis, A. Characterization of microstructural aspects of machinable α-β phase brass. Microsc. Anal. 2008, 22, 13–16. [Google Scholar]
  37. Yousefieh, M.; Shamanian, M.; Arghavan, A.R. Analysis of design of experiments methodology for optimization of pulsed current GTAW process parameters for ultimate tensile strength of UNS S32760 welds. Metallogr. Microstruct. Anal. 2012, 1, 85–91. [Google Scholar] [CrossRef]
  38. Ma, Y.; Hu, H.; Northwood, D.; Nie, X. Optimization of the electrolytic plasma oxidation processes for corrosion protection of magnesium alloy AM50 using the Taguchi method. J. Mater. Process. Technol. 2007, 182, 58–64. [Google Scholar] [CrossRef]
  39. Yousefieh, M.; Shamanian, M.; Saatchi, A. Optimization of the pulsed current gas tungsten arc welding (PCGTAW) parameters for corrosion resistance of super duplex stainless steel (UNS S32760) welds using the Taguchi method. J. Alloys Compd. 2011, 509, 782–788. [Google Scholar] [CrossRef]
  40. Mariajayaprakash, A.; Senthilvelan, T. Optimizing process parameters of screw conveyor (sugar mill boiler) through failure mode and effect analysis (FMEA) and Taguchi method. J. Fail. Anal. Prev. 2014, 14, 772–783. [Google Scholar] [CrossRef]
Figure 1. Flowchart of the experimental methodology applied for the present research.
Metals 08 00250 g001
Figure 2. (a) Cemented carbide-cutting insert geometry (in mm) [8]; (b) set-up for the measurement of the cutting forces; and (c) machining kinematics and the cutting-force components that were measured in all experiments.
Metals 08 00250 g002
Figure 3. 3D white-light interferometry for surface-roughness measurement.
Metals 08 00250 g003
Figure 4. Optical micrographs of the microstructure on transverse sections: (a) CuZn39Pb3 (CW614N) leaded brass as well as (b) CuZn42 (CW510L); (c) CuZn38As (CW511L) and (d) CuZn36 (C27450) lead-free brasses. Light areas represent α-phase and dark areas represent β-phase. In (a) there is an appreciable amount of Pb particles, which appeared as black dots.
Metals 08 00250 g004
Figure 5. Scanning electron microscopy (SEM) micrographs under secondary and backscattered electron imaging: (a) CuZn39Pb3 (CW614N) leaded brass as well as (b) CuZn42 (CW510L); (c) CuZn38As (CW511L) and (d) CuZn36 (C27450) lead-free brasses. White dots in (a) represent Pb particles in the α/β interfaces. The β-phase is located in the recess areas, as a result of its higher dissolution during chemical etching.
Metals 08 00250 g005
Figure 6. Histogram showing the main cutting force (N) that resulted under various turning conditions.
Metals 08 00250 g006
Figure 7. Diagrams showing the variation of signal-to-noise (S/N) ratios for cutting force as a function of the cutting parameters (cutting speed, depth of cut, feed rate and material).
Metals 08 00250 g007
Figure 8. Diagrams showing the data means for cutting force as a function of the cutting parameters (cutting speed, depth of cut, feed rate and material).
Metals 08 00250 g008
Figure 9. Histogram showing the surface roughness—Ra (μm) resulting under various turning conditions.
Metals 08 00250 g009
Figure 10. Diagrams showing the variation of S/N ratios for surface roughness as a function of the cutting parameters (cutting speed, depth of cut, feed rate and material).
Metals 08 00250 g010
Figure 11. Diagrams showing the data means for surface roughness as a function of the cutting parameters (cutting speed, depth of cut, feed rate and material).
Metals 08 00250 g011
Table 1. Mechanical properties and β-phase percentage.
Brass AlloysRp0.2 (MPa)Rm (MPa)A50 (%)Hardness HV1β-Phase (%)
CW614N3004302813233
CW510L2504604112760
CW511L250380421165
C2745018532048982
Table 2. Chemical composition of the studied brass alloys (expressed in % m/m).
Alloy/(Spec. Limits)SnZnPbFeNiAlCu
CuZn39Pb3 (CW614N)0.26Rem.2.970.230.0640.01858.32
EN 12164 (CuZn39Pb3/CW614N)0.30 maxRem.2.5–3.50.30 max0.30 max0.050 max57–59
CuZn42 (CW510L)0.0058Rem.0.100.03420.00300.000257.46
EN 12164 (CuZn42/CW510L)0.30 maxRem.0.20 max0.30 max0.30 max0.050 max57–59
CuZn38As (CW511L)0.0042Rem.0.090.01890.00120.000262.04
EN 12164 (CuZn38As/CW511L)0.10 maxRem.0.20 max0.10 max0.30 max0.050 max61.5–63.5
CuZn36 (C27450)0.0144Rem.0.210.02440.00300.024763.38
Copper Development Association (CDA) (CuZn36/C27450)-Rem.0.25 max0.35 max--60–65
Table 3. Process parameters and their levels.
ParametersUnitsLevel 1Level 2Level 3Level 4
Cutting Speedrpm (m/min)1500 (165)1750 (192)2000 (220)2250 (247)
Depth of Cutmm0.51.01.52.0
Feed Ratemm/min150200250500
Material-CW510LCW511LC27450CW614N
Table 4. L16 standard orthogonal array for the experiments.
Number of ExperimentParameters
Cutting Speed (rpm)Depth of Cut (mm)Feed Rate (mm/min)Material
115000.5150CW510L
215001.0200CW511L
315001.5250C27450
415002.0500CW614N
517500.5200C27450
617501.0150CW614N
717501.5500CW510L
817502.0250CW511L
920000.5250CW614N
1020001.0500C27450
1120001.5150CW511L
1220002.0200CW510L
1322500.5500CW511L
1422501.0250CW510L
1522501.5200CW614N
1622502.0150C27450
Table 5. Experimental results for cutting force (CF) and surface roughness (SR).
Number of ExperimentMaterialQuality Characteristics Results
CF (N)
REP 1
CF (N)
REP 2
CF (N)
AVERAGE
SR (µm) REP 1SR (µm) REP 2SR (µm)
AVERAGE
1CW510L8180811.81.71.8
2CW511L2142232192.12.22.1
3C274503443483462.92.72.8
4CW614N45445445410.811.411.1
5C274509190911.92.02.0
6CW614N8687872.12.22.2
7CW510L5445355408.18.08.0
8CW511L4414504462.22.52.3
9CW614N6361622.62.32.4
10C274503012993005.75.65.6
11CW511L2022152091.81.81.8
12CW510L3283243265.65.15.4
13CW511L1221291264.44.34.3
14CW510L1811741783.34.53.9
15CW614N1311311312.12.12.1
16C274502422452444.75.85.3
Table 6. Response table for signal-to-noise (S/N) ratios for cutting force.
Response TableCutting Speed (rpm)Depth of Cut (mm)Feed Rate (mm/min)Material
Level 1−47.21−38.77−42.74−47.00
Level 2−46.37−45.01−44.63−47.03
Level 3−45.51−48.54−46.15−42.52
Level 4−44.26−51.03−49.82−46.80
Difference2.9512.267.084.51
Rank4123
Table 7. Results of confirmation experiment.
Quality CharacteristicCutting Speed (rpm)Depth of Cut (mm)Feed Rate (mm/min)MaterialExperimental ValuePredicted Value
Cutting Force22500.5150CW614N39.37 N34.59 N
Surface Roughness17500.5150CW511L1.71 μm1.22 μm
Table 8. Response table for S/N ratios for surface roughness.
Response TableCutting Speed (rpm)Depth of Cut (mm)Feed Rate (mm/min)Material
Level 1−10.325−7.819−7.776−12.368
Level 2−9.496−10.034−8.315−7.957
Level 3−10.623−9.603−8.983−10.396
Level 4−11.331−14.318−16.700−11.054
Difference1.8366.4998.9244.411
Rank4213
Table 9. Analysis of variance (ANOVA) for the cutting force.
FactorDegrees of FreedomSum of Squares (SS)Corrected Sum of Squares (SS’)VariancePercent Contribution Pp (%)Rank
Cutting Speed319.042518.82546.34753.57284
Depth of Cut3339.5408339.3238113.180364.39921
Feed Rate3108.0831107.866036.027720.47152
Material358.866058.648919.622011.13083
Error191.37462.24280.07230.4257-
Total31526.9070526.9070-100.0000-
Table 10. Analysis of variance (ANOVA) for the surface roughness.
FactorDegrees of FreedomSum of Squares (SS)Corrected Sum of Squares (SS’)VariancePercent Contribution Pp (%)Rank
Cutting Speed37.34983.54222.44990.94604
Depth of Cut391.660687.853030.553523.46252
Feed Rate3210.9051207.097470.301755.30851
Material340.410136.602513.47009.77533
Error1924.114939.34531.269210.5078-
Total31374.4404374.4404-100.0000-

