Article

The Influence of Thermal History on the Multistage Transformation of NiTi Shape-Memory Alloys

by
Isabel Ruiz-Larrea
1,*,
Angel López-Echarri
2,
Tomasz Breczewski
1,
Gabriel A. López
1,
Iñaki Lopez-Ferreño
2,
María L. Nó
1 and
Jose M. San Juan
2
1
Departamento de Física Aplicada II, Universidad del País Vasco, UPV/EHU Apdo.644, 48080 Bilbao, Spain
2
Departamento de Física de la Materia Condensada. Facultad de Ciencia y Tecnología, Universidad del País Vasco, UPV/EHU Apdo.644, 48080 Bilbao, Spain
*
Author to whom correspondence should be addressed.
Metals 2018, 8(4), 246; https://doi.org/10.3390/met8040246
Submission received: 12 March 2018 / Revised: 29 March 2018 / Accepted: 3 April 2018 / Published: 7 April 2018

Abstract

:
The multistage martensitic phase transformation of a polycrystalline NiTi shape-memory alloy (50.3 at. %Ni–49.7 at. % Ti) has been studied by means of calorimetric measurements. After a conventional thermal treatment followed by successive thermal cycles, the initial two-step forward transformation splits into four-overlapping stages. However, the reverse martensitic transformation maintains the initial two-step sequence, usually assigned to the B19′→R→B2 transformation. The correlation between the forward and reverse steps has been established by means of selected thermal cycles together with an estimation of their enthalpy and thermal hysteresis. These results have also provided information about the storage of the elastic strain energy and the frictional works associated with the variants’ nucleation. Moreover, the study around the forward transformation temperature range by means of uncompleted thermal cycles undoubtedly shows the presence of temperature memory effects in both stages.

Graphical Abstract

1. Introduction

As it is well-known, nickel–titanium (NiTi) shape-memory alloys (SMA) have been widely studied in the few last years due to the scientific interest in the martensitic transformations (MT) they exhibit, as well as for their technological applications [1,2,3]. In particular, the quasi-equiatomic NiTi alloys have been already used in many practical devices. Some general reviews have been published, and interesting examples can be found in [4,5,6]. In the case of near-equiatomic NiTi shape-memory alloys, three different phases have been reported as a function of temperature: the high temperature cubic B2 phase (austenite, space group Pm 3 ¯ m), which has a CsCl structure at high temperatures; the intermediate R phase (R), which is rhombohedral (space group P3); and the monoclinic B19′ phase (martensite, space group P21/m). In some cases, only one of the two martensitic phases occurs, while in others both may appear simultaneously.
The technological applications of NiTi alloys are conditioned by a number of issues. First of all, the selection of the transformation temperature range, which largely depends on the composition of the alloy [7], affects the final product. Secondly, the thermal treatments that affect the general features of the transformation (temperature range, transformation steps, etc.) determine the evolution of the MT, which is dependent not only on aging times but also, in some cases, on thermal cycling [8,9,10,11]. The influence of so many physical parameters on the MT behavior makes it difficult to provide convincing interpretations. In some cases, to make matters worse, these alloys even show a multistage MT, which is characterized, for example, by the presence of various differential scanning calorimetry (DSC) peaks as a function of temperature [12,13,14,15,16,17,18]. This multistage behavior is present when the grain size is large enough to permit the low-temperature phase nucleation in different parts of the grains (boundaries, defects, dislocations, Ni4Ti3 precipitates, etc.) [5,19]. In our case, increasing the annealing temperatures and/or the annealing times is found to enlarge the grain size [20,21,22]. In addition, Ni4Ti3 shows a preferential precipitation in the grain boundary, which contributes to generate the heterogeneous microstructures on which the proposed multistage microscopic models are based [12,16,19,23].
In addition, it should be noted that the technological devices based on these alloys are usually subjected to many heating/cooling cycles during operation. Some of them include complete martensitic transformations (total thermal cycle), which, as happens in the samples selected for this work, can undergo a relevant evolution and a progressive division of MT in several steps that must be taken into account. In other cases, they merely undergo incomplete transformations (partial cycling) that promote the so-called “temperature memory effect” (TME) [24,25]. The question arises when a multistage MT is present. Previous works have undoubtedly found the TME in the B19′→R transformation, but it is not so clearly present in the R→Austenite transformation [26]. This seems to be due to the low calorimetric signal of this last transformation. However, under successive thermal cycles, the stability of the R phase spreads out into a wide temperature range, and the corresponding DSC peak is increased [8,27]. It has also been found that after a complete reverse MT, all these effects are erased. In the last few years, various interpretations have been proposed to explain the TME, which seems to be present in most SMAs and related to the relaxation of the elastic strain energy of the martensitic variants [26,28]. In the case of TiNi alloys, some qualitative descriptions have been developed in which the role of the elastic energy, dislocations, and grain boundaries are also discussed [26,29,30].
The study presented here is mainly based on DSC measurements, although preliminary microscopic experiments on the same alloy samples were also carried out to confirm the presence and evolution of the various crystallographic phases at low temperatures. In this work, we focus on three important aspects for a better characterization of these alloys, addressing their technological applications. Firstly, we present a study of the evolution of this complex sequence of phases under successive thermal cycles until a stabilized situation is reached. The results obtained should allow us to establish the thermal treatments and specific cycles that will guarantee the stabilization of the alloy. Secondly, we proceed to study the correlation between the successive steps of the forward and reverse transformations. This knowledge will permit us to determine the stability range of each phase based on the previous thermal history. Finally, we study the temperature memory effects in the two steps of the reverse transformation, in order to establish its remarkable displacement towards higher temperatures. All these tasks would be highly improved if accurate values for the thermodynamic functions of the phase transformation were available. The required accuracy can only be attained if the contribution of the crystal lattice to the specific heat is properly established. Through the procedure shown below, we will establish a precise evaluation of the enthalpy involved in each step, which is closely related to the progress of the transformed mass of the alloy in both the forward and the reverse MT. In addition, this experimental information will allow us to estimate the energies involved in the sequential nucleation of this complex martensitic transformation.

2. Experimental Results

In this study, a cold-deformed polycrystalline wire of TiNi shape-memory alloy supplied by Memory-Metalle GmbH (Weil am Rhein, Germany) was used. The average composition of the nickel-titanium ratio was 50.3:49.7 wt. %, as determined by the suppliers by means of a wet chemical method with a tolerance of 0.2 wt. %, and matched the relationship between the Ni content and the martensitic start temperature (Ms) found in these alloys [7,31]. A few different samples from the same TiNi wire were selected for the experiments, and the same thermal treatment was applied in order to verify the reproducibility of the various measurements. It consisted of annealing the samples at 950 °C for 1/2 h under high-purity argon and quenching them in ice water. Afterwards, the samples were aged at 400 °C for 1 h and then quenched again in ice water. Previous electron microscopy observations show that the samples exhibit equiaxed grains with diameters between 10 µm and 50 µm and included small 10–15-nm-sized particles of Ni4Ti3 precipitates. The 2-mm diameter wires were cut into disks of about 2-mm thickness for DSC measurements. They were carried out in a TA DSC Q2000 calorimeter (TA Instrument, New Castle, DE, USA), which presents high baseline stability and permits the direct measurement of the heat capacity. The specific heat capacity (Cp) values obtained by this DSC technique have been found to depend slightly on the heating-cooling rate, so we have used a fixed rate of 10 °C/min to avoid ulterior discrepancies due to this rate variation. As it will be later discussed, up to 75 heating-cooling runs from −100 °C to 100 °C at rates of 10 °C/min were required to stabilize the observed drift of the calorimetric curves and obtain reproducible results.

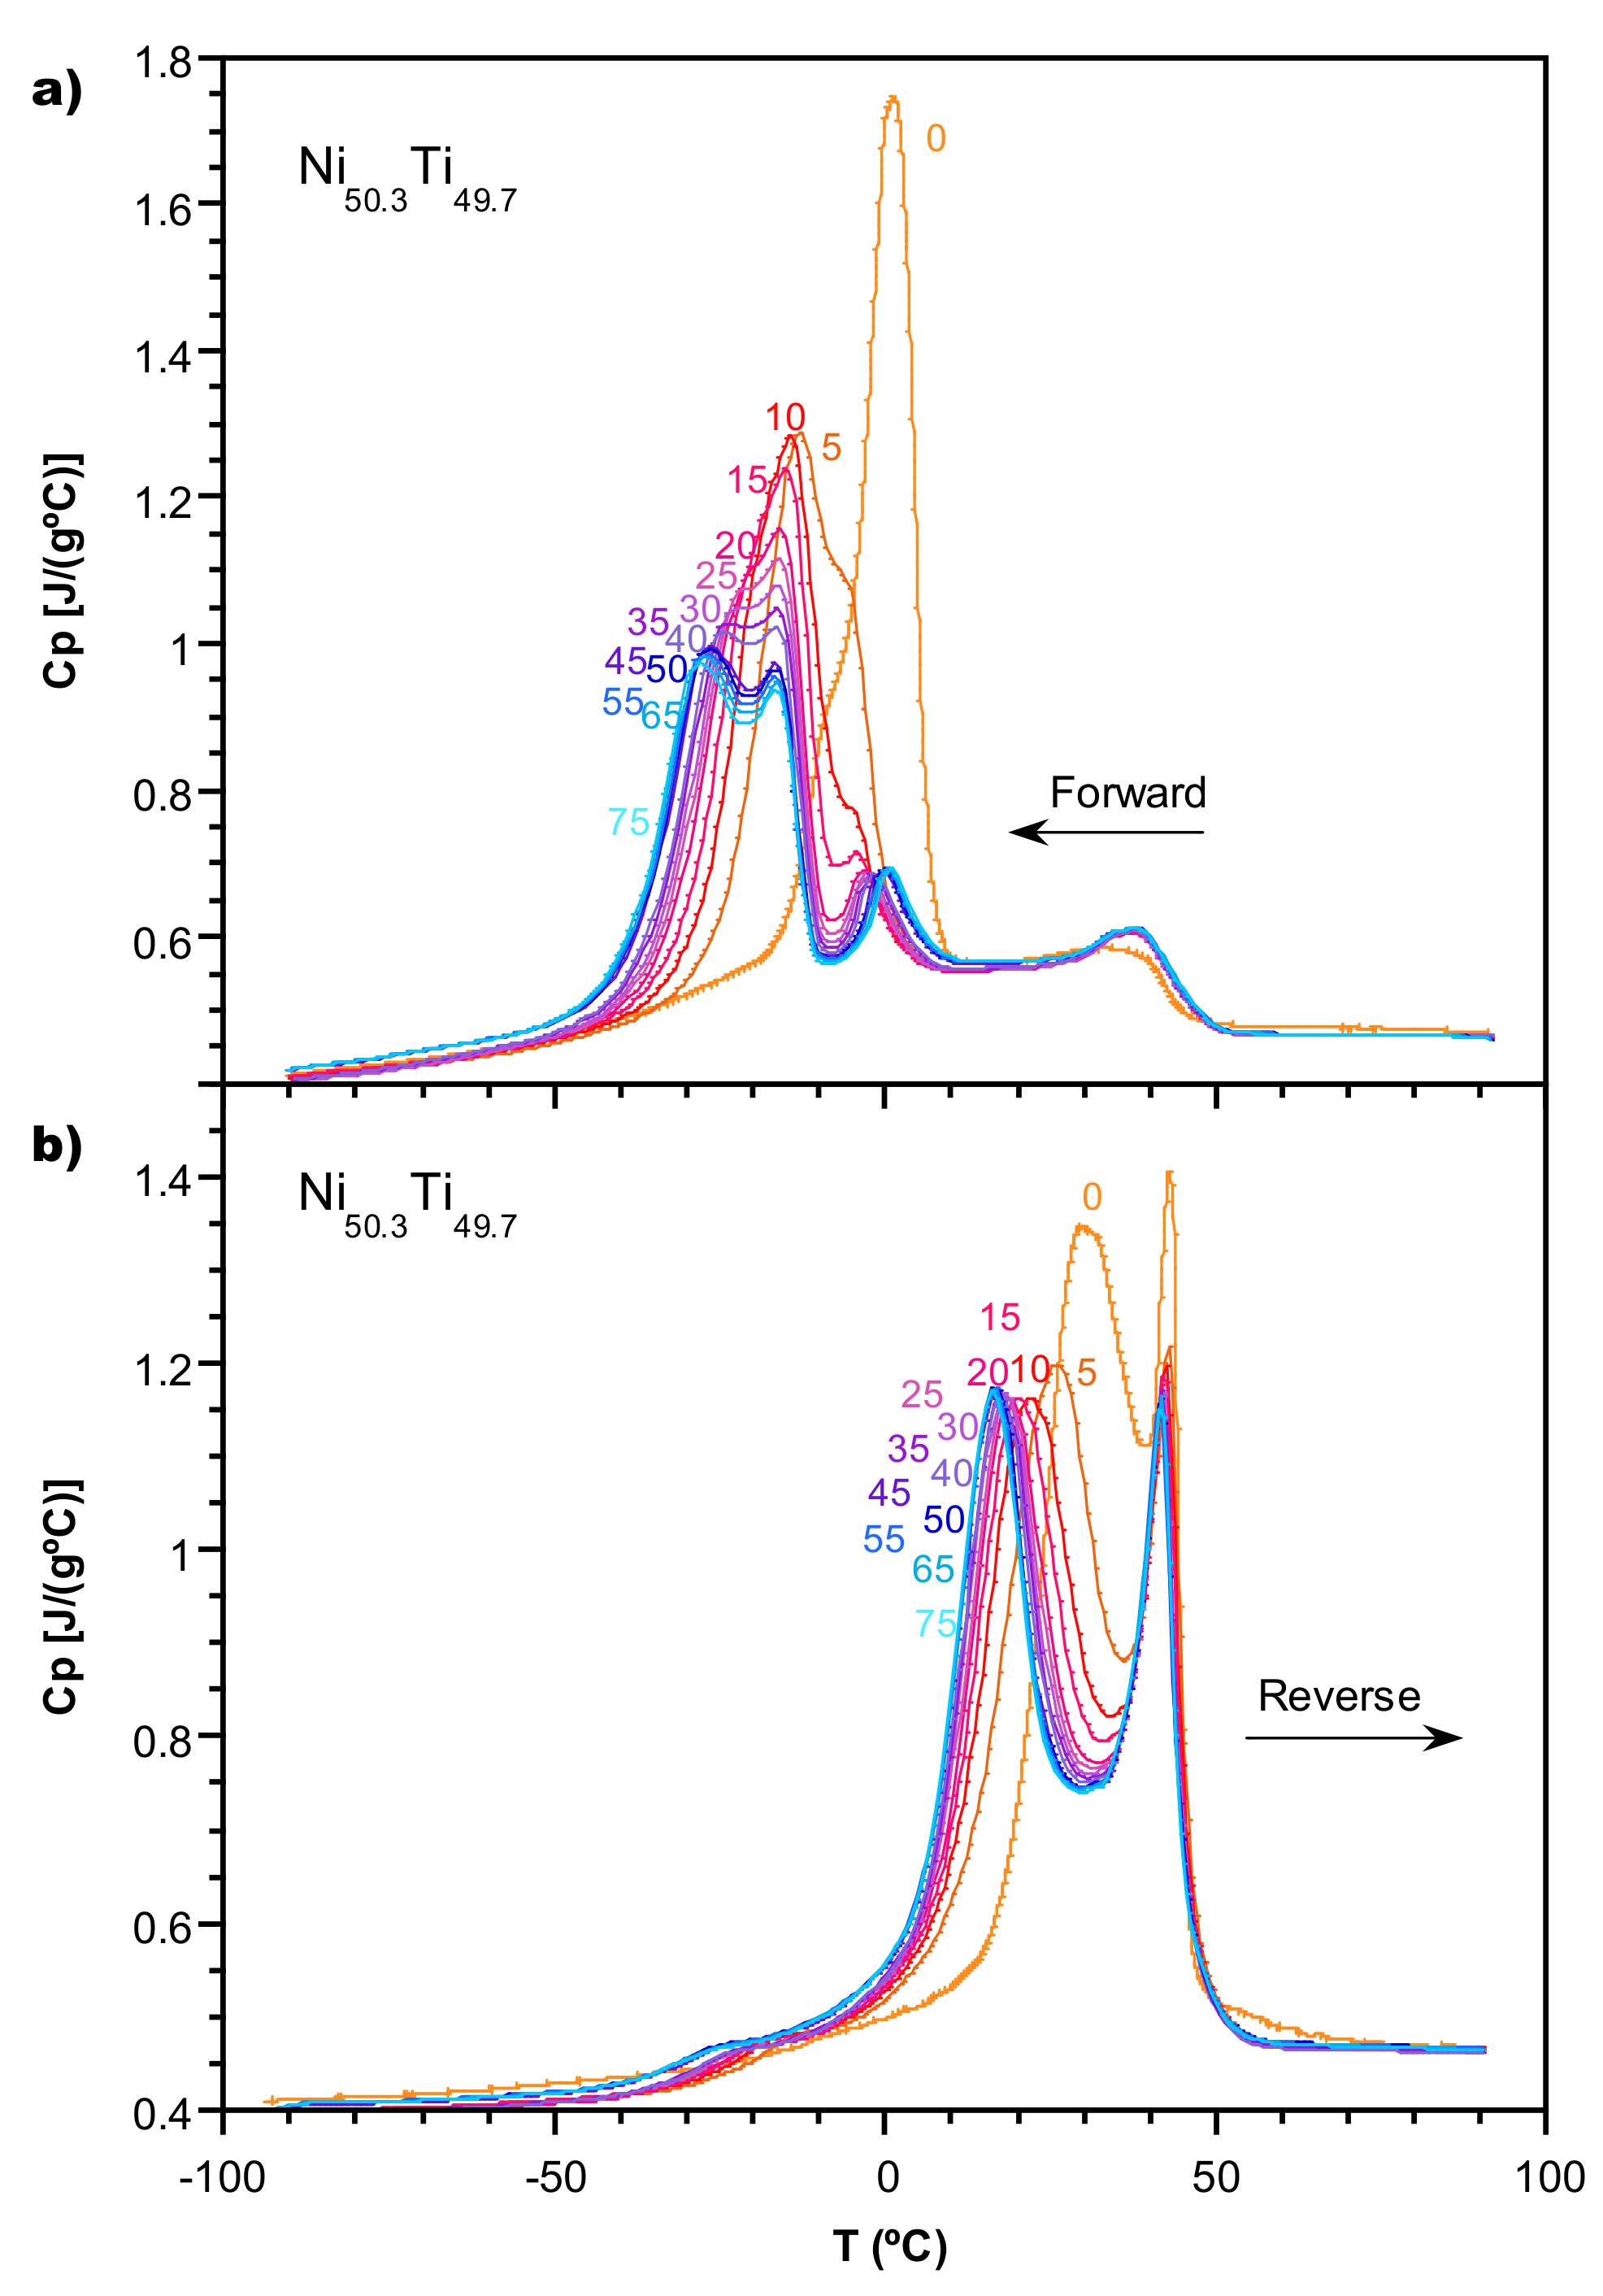
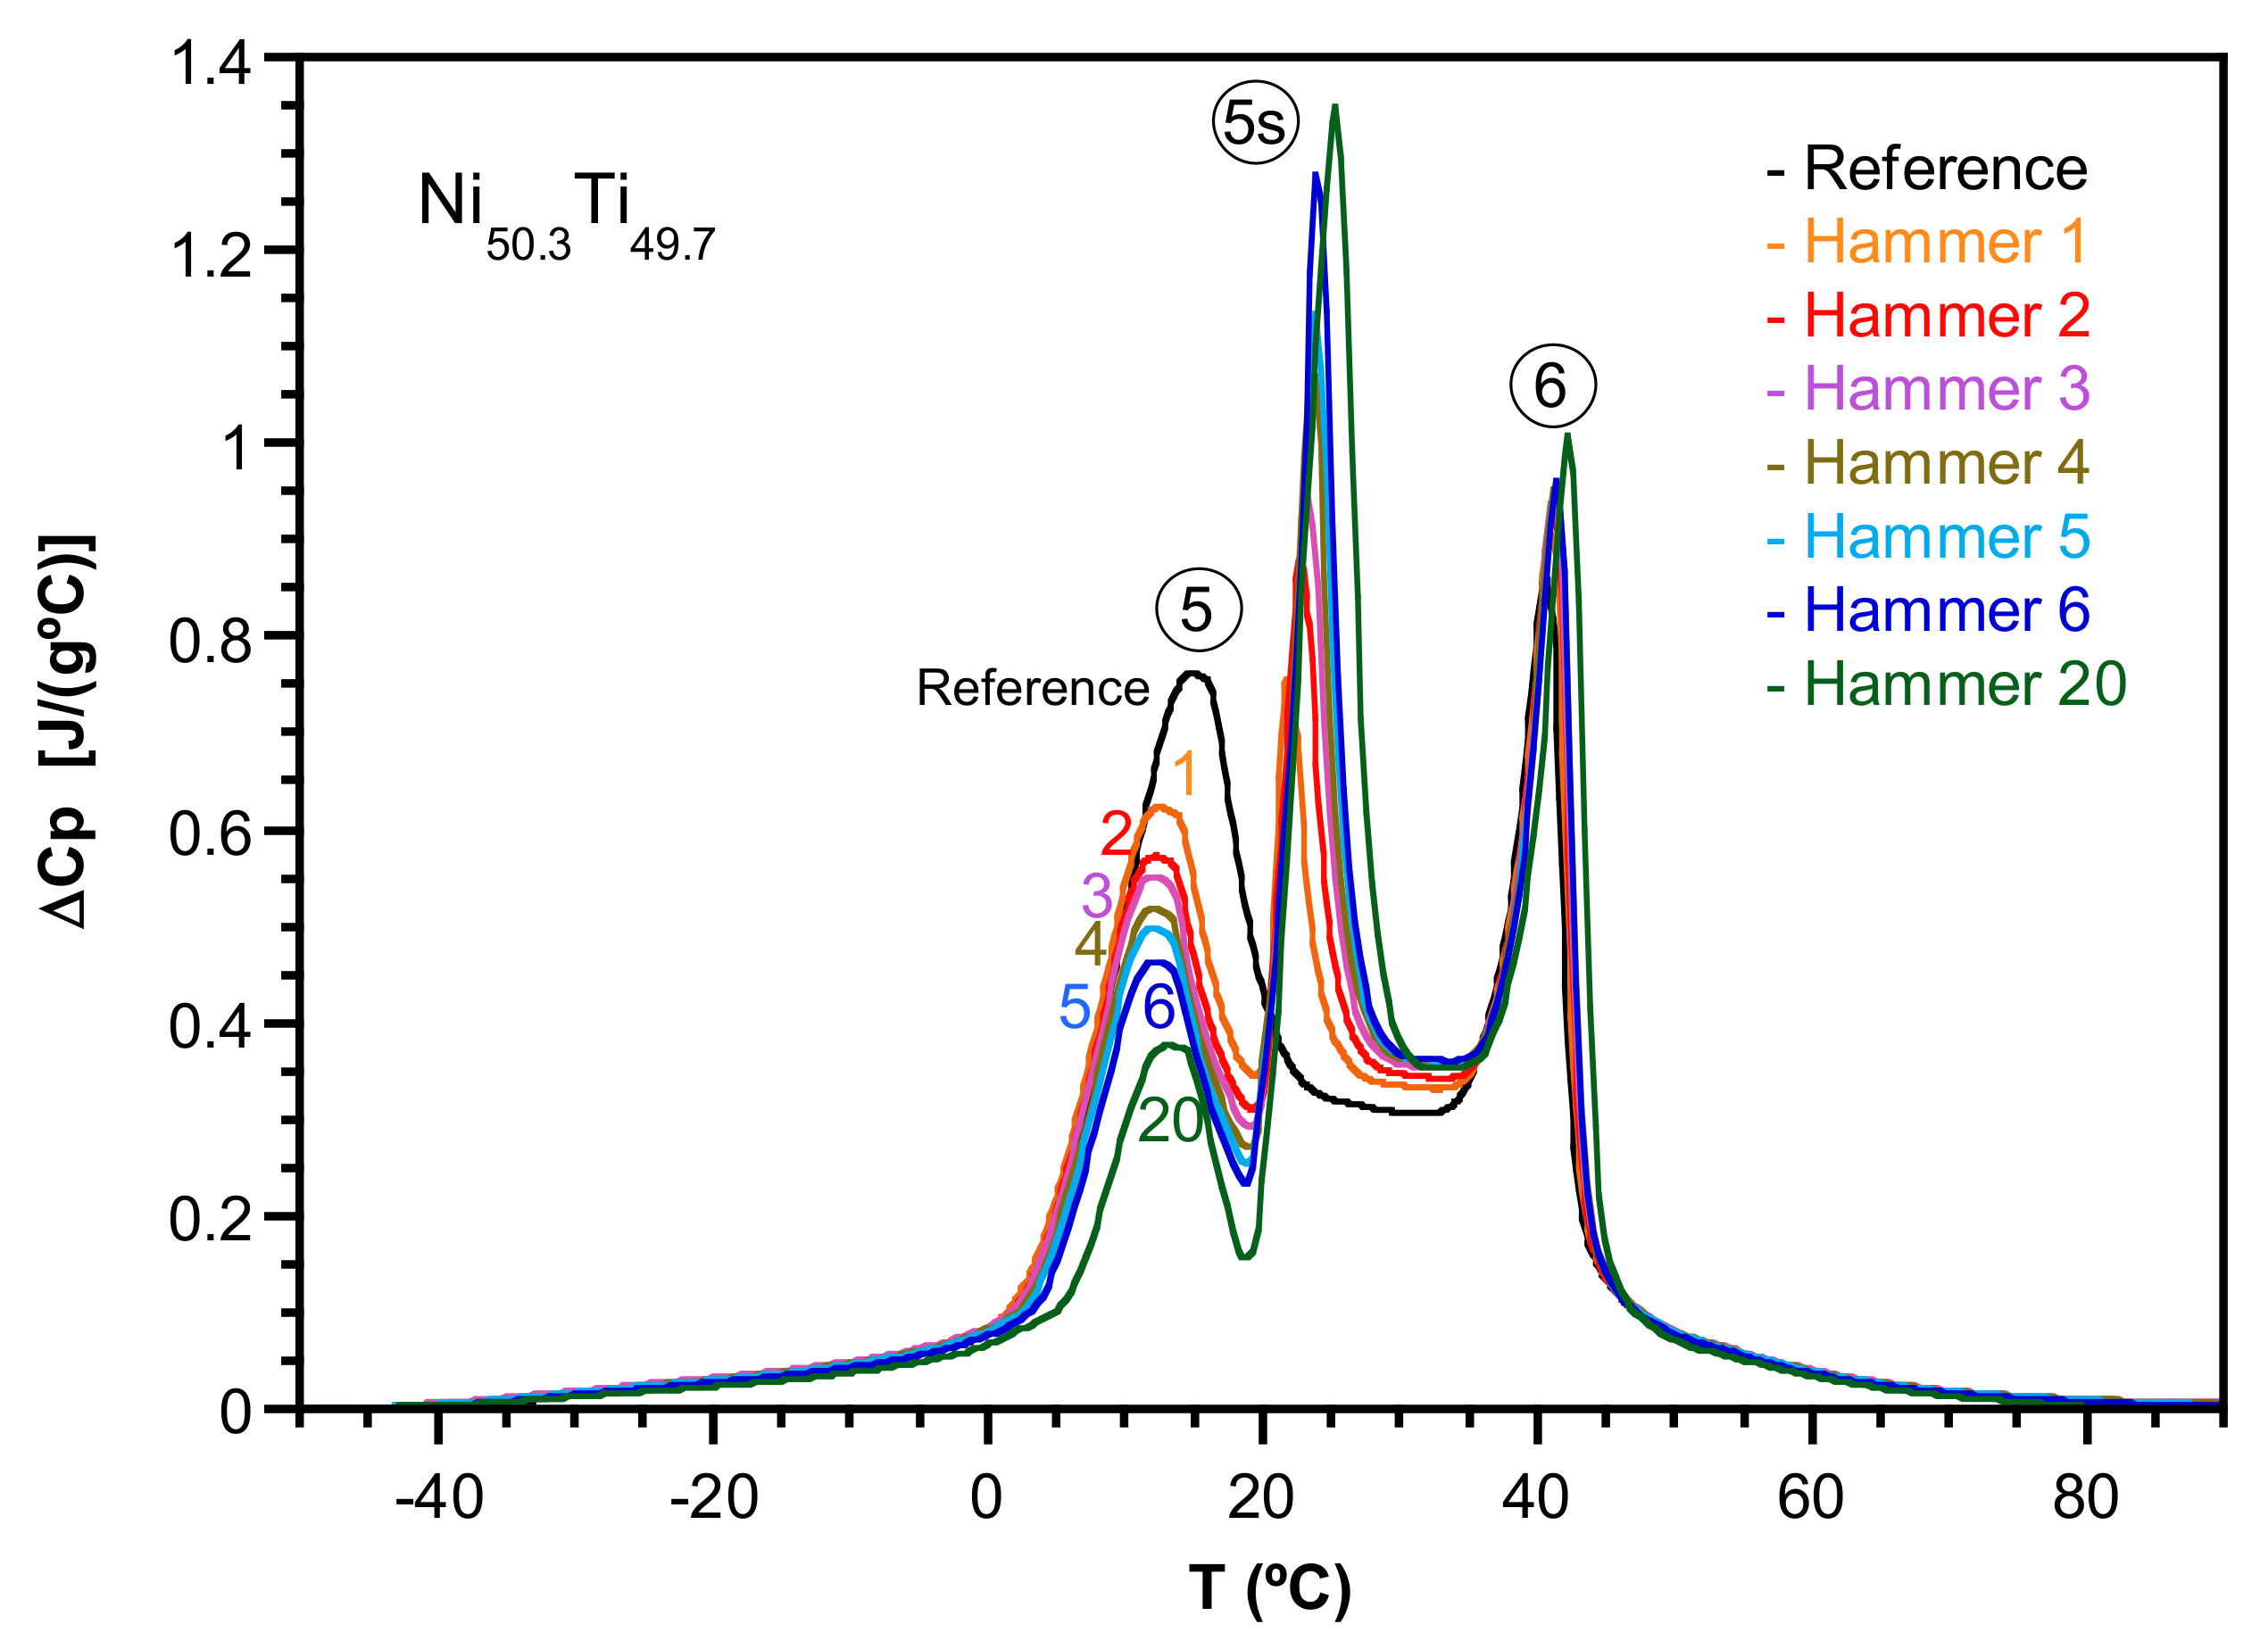
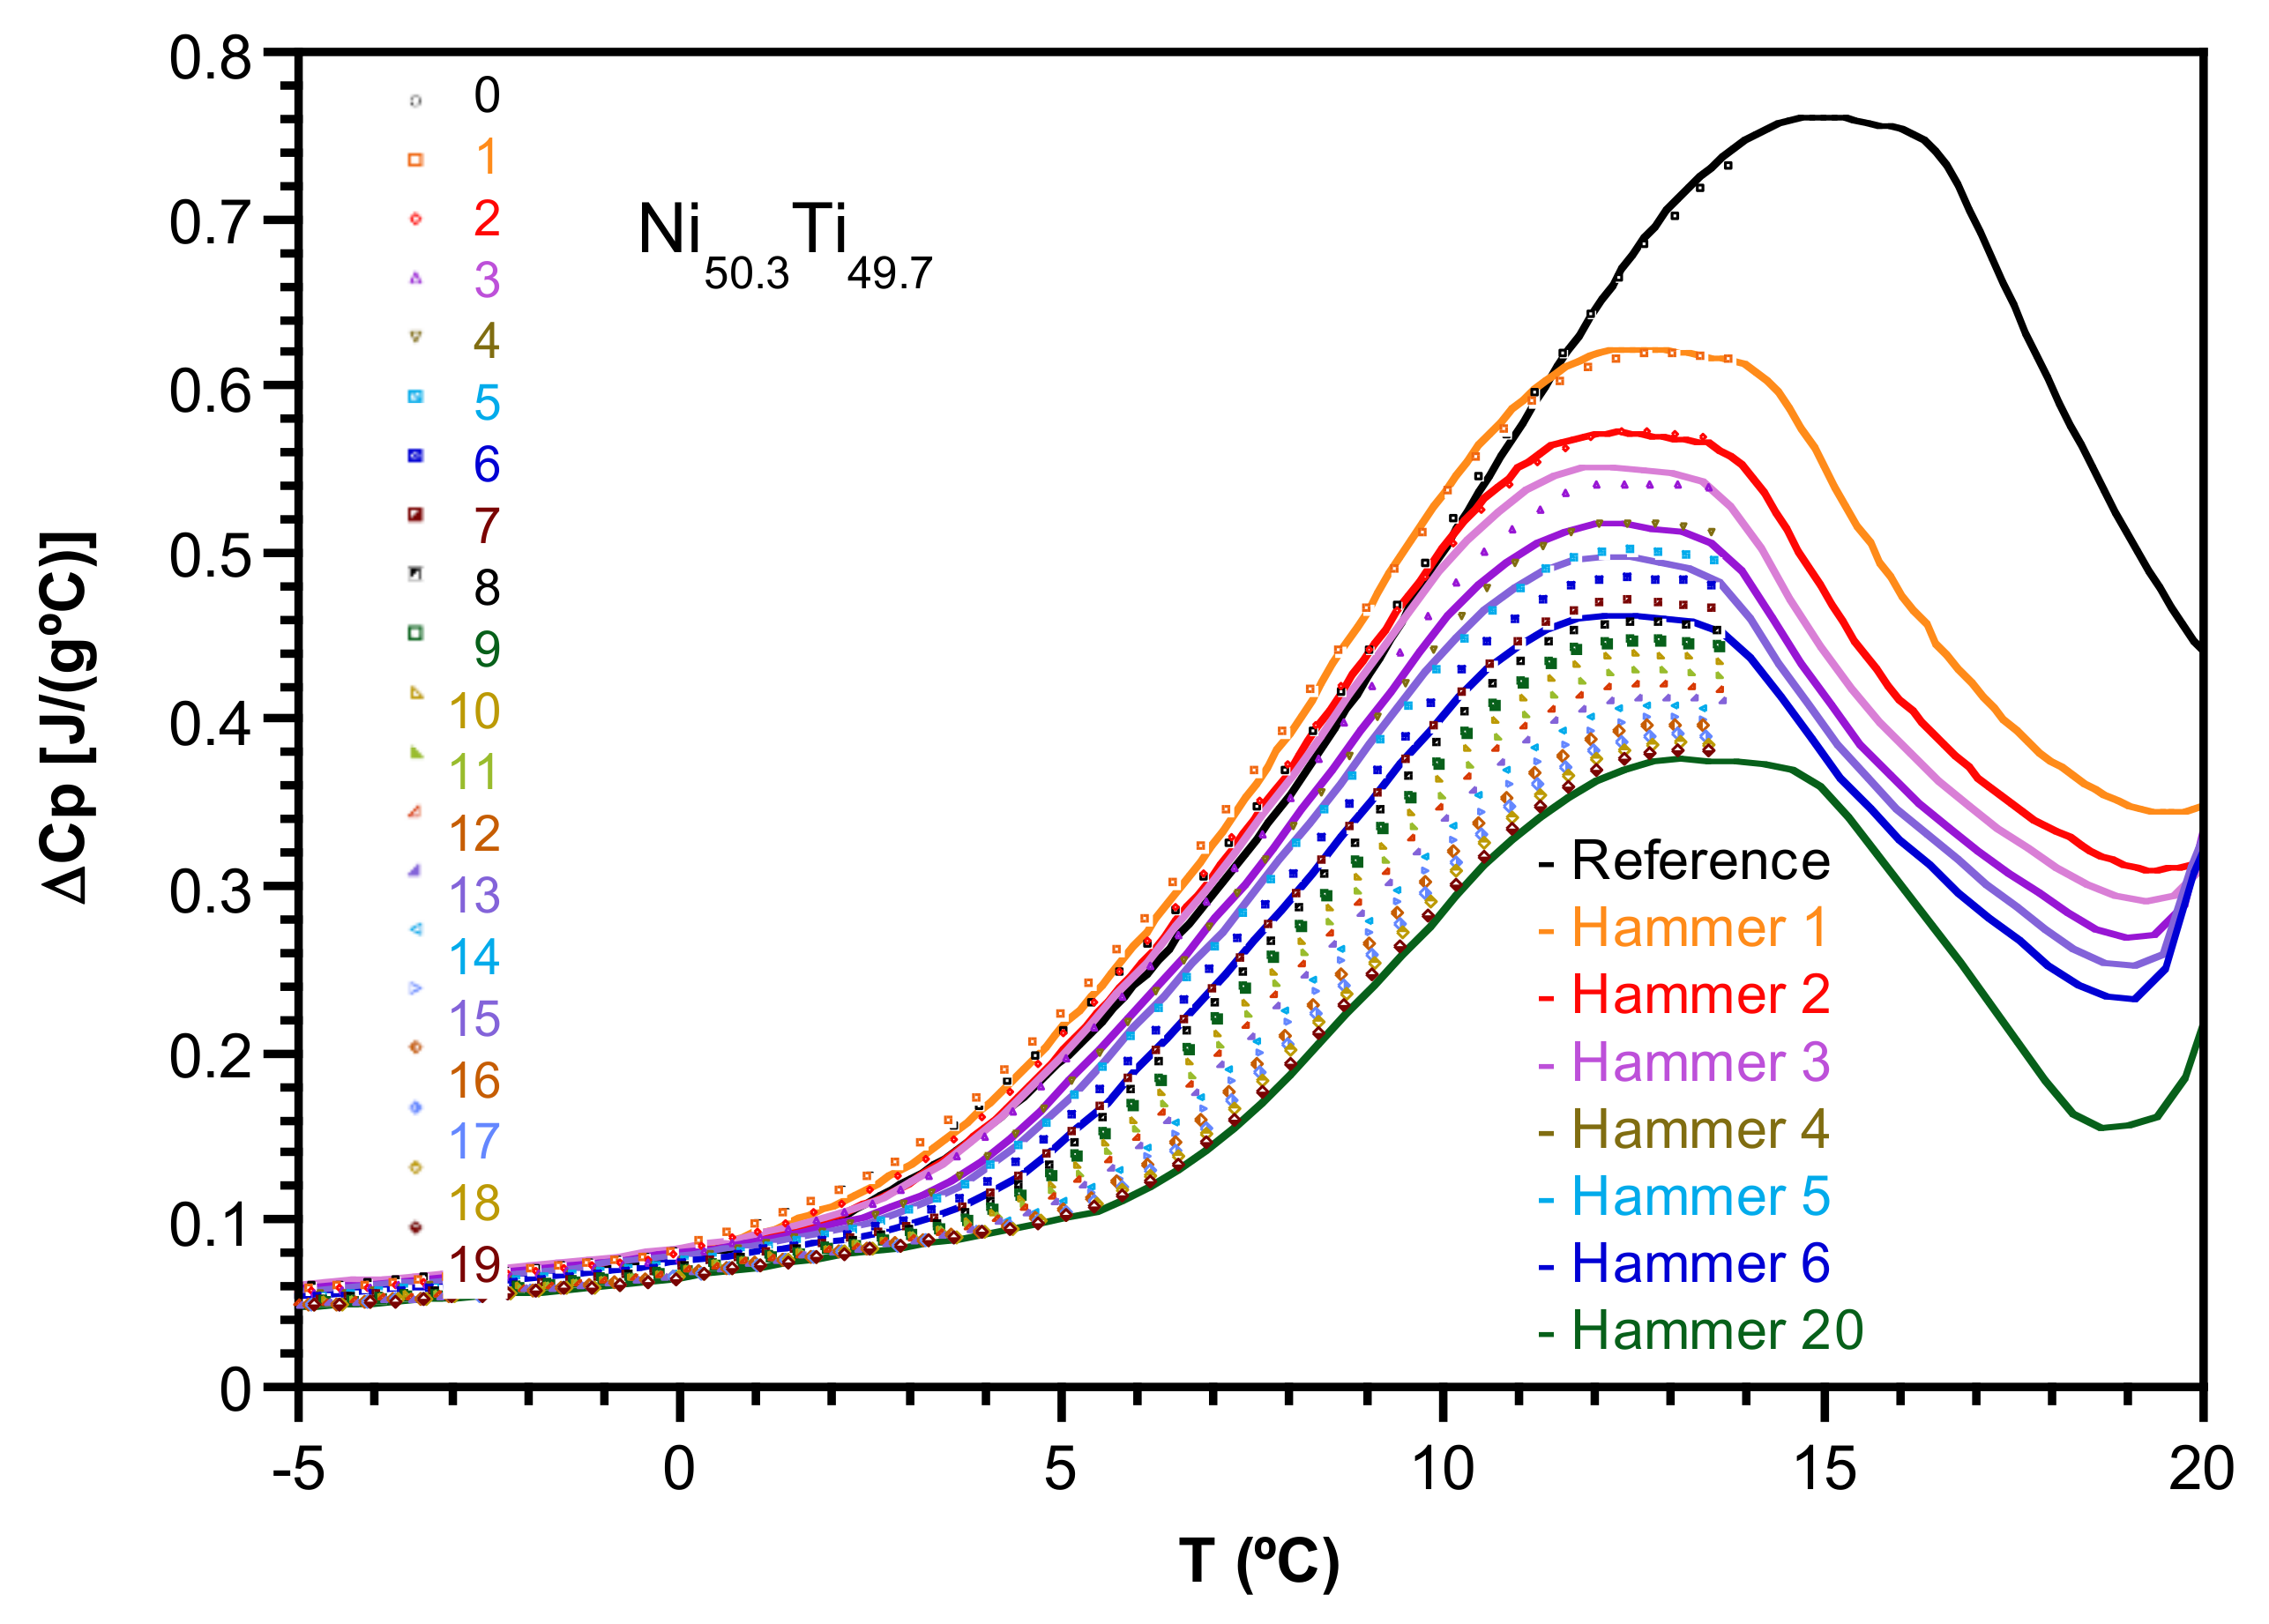
2.1. Transformation Evolution under Cycling

DSC measurements at 10 °C/min, which show the multistage martensitic transformation expected in aged polycrystalline TiNi samples, were performed. The evolution of the forward and reverse MTs multistep processes can be seen in Figure 1.
In the first cooling run, a Cp shoulder around 40 °C, followed by a neat high peak around 1 °C appeared. However, after successive cycles, some additional Cp peaks took place, and the evolution of the traces nearly stabilized after 50 cycles. As regards the reverse MT, only two Cp peaks were found. This behavior upon heating was maintained after cycling for up to 75 runs, and only small differences in the Cp traces were observed. The corresponding temperatures, as well as the assigned numbering, are shown in Figure 2 and Table 1. We note that the changes in the thermal behavior under cycling did not affect Peak 1 during the forward MT or Peak 6 during the reverse MT, which also presented a good correlation in temperatures.
A direct way to find the evolution of the alloy mass transformed as a function of temperature is to examine the behavior of the enthalpy throughout the MT. However, a detailed study of the transformation and the associated thermodynamic functions requires a previous estimation of the specific heat baseline, which accounts for the alloy lattice contribution. It has been found that the usual linear extrapolation of the Cp curve from both sides of the anomaly leads to significant errors, both in the actual MT temperature range and in the corresponding enthalpic values. A more accurate alternative, developed in previous works, is based on the previous calculation of the harmonic term (Ch), anharmonic (Canh), and electronic (Ce) contributions to Cp [32].
In this case, Canh has been established from the known values of the elastic constants [33] and the thermal expansion tensor [34] in the austenitic phase. This contribution has been extrapolated down to the low-temperature martensitic phase by means of the empirical Nernst-Lindemann law, whereas the electronic contribution was determined by using the free electron model [35]. This last term is found to represent about 0.5% of the total Cp at room temperature, around the limits of the experimental resolution. But, the main contribution to the specific heat in the intermediate temperatures comes from the harmonic Ch. This quantity was obtained from the available phonon density of states g(ν) of a NiTi alloy with a very close atomic proportion [36]. Small composition differences are found to be not relevant in the phonon spectrum and, as a consequence, in the calculated harmonic specific heat [35]. Even, the direct Ni [37] and Ti [38] density of states data, conveniently weighted for the alloy composition, show very close results. In general, this last method is a reasonable alternative when the complete vibrational spectrum of the alloy is not available [32]. As can be seen, for example, in Figure 2, this theoretical calculation provides a confident baseline for the specific heat of the alloy lattice. The usual dynamic DSC measurements finally performed show small discrepancies with this baseline at both sides of the MT temperature range. The fit between the two curves takes place at T = −63 °C and 97 °C upon heating and at T = 72 °C and −97 °C upon cooling. That means that the actual MT temperature ranges are about 160 °C and 169 °C for the reverse and forward MTs, respectively. These values are much higher than those normally assigned when a conventional straight line is used below the calorimetric curves of the MT for the enthalpy calculations. However, it should be noted that the contribution to the MT enthalpy is much less significant around the extremes of the transformation, where the experimental curve approaches our theoretical baseline. Nevertheless, we stress that the enthalpy evolves with temperatures of major importance, because it is associated with the transformed mass fraction.
By using this baseline, the enthalpy associated with the complete MT has been determined upon cooling and upon heating for all the Cp traces of the numerous cycles. In Table 1, we present the mean values of the enthalpy ΔH accompanied by the respective standard deviations. Within the limits of the experimental error (0.6 J/g), we can conclude that the forward and reverse MTs attain the same common ΔH value (21.2 J/g). However, a small decrease (below 5%) is observed through the first 10 cycles, but afterwards this quantity remains practically constant. This small effect may be due to the progressive production of irreversible dislocations under the successive thermal cycles as it gradually reaches saturation. These results do not agree with those reported by other authors, who find striking differences in enthalpy, especially between the direct MT and the reverse MT for samples under thermal cycles [9,39,40]. This notorious discrepancy can be due to the use of a common and precise baseline, which, as noted before, has a noticeable influence on the correct setting of the MT temperature range and also on the ΔH determination. The calorimetric results after 75 previous thermal cycles are summarized in Figure 2, which also includes the lattice contribution to the specific heat, as defined above. These experiments clearly show the progressive stabilization of the austenitic microstructure through thermal cycling. Finally, the nucleation of the different variants during the MT extends over a wide temperature range, although the sequential transformation shows up to four preferred temperature ranges associated with the observed specific heat anomalies. As will be discussed later, they must correspond to the nucleation in well-identified areas of the microstructure because of the remarkable heterogeneity of the austenitic framework, while the diversity of the associated thermal hysteresis values will provide direct information on the different energy barriers present during the forward transformation.

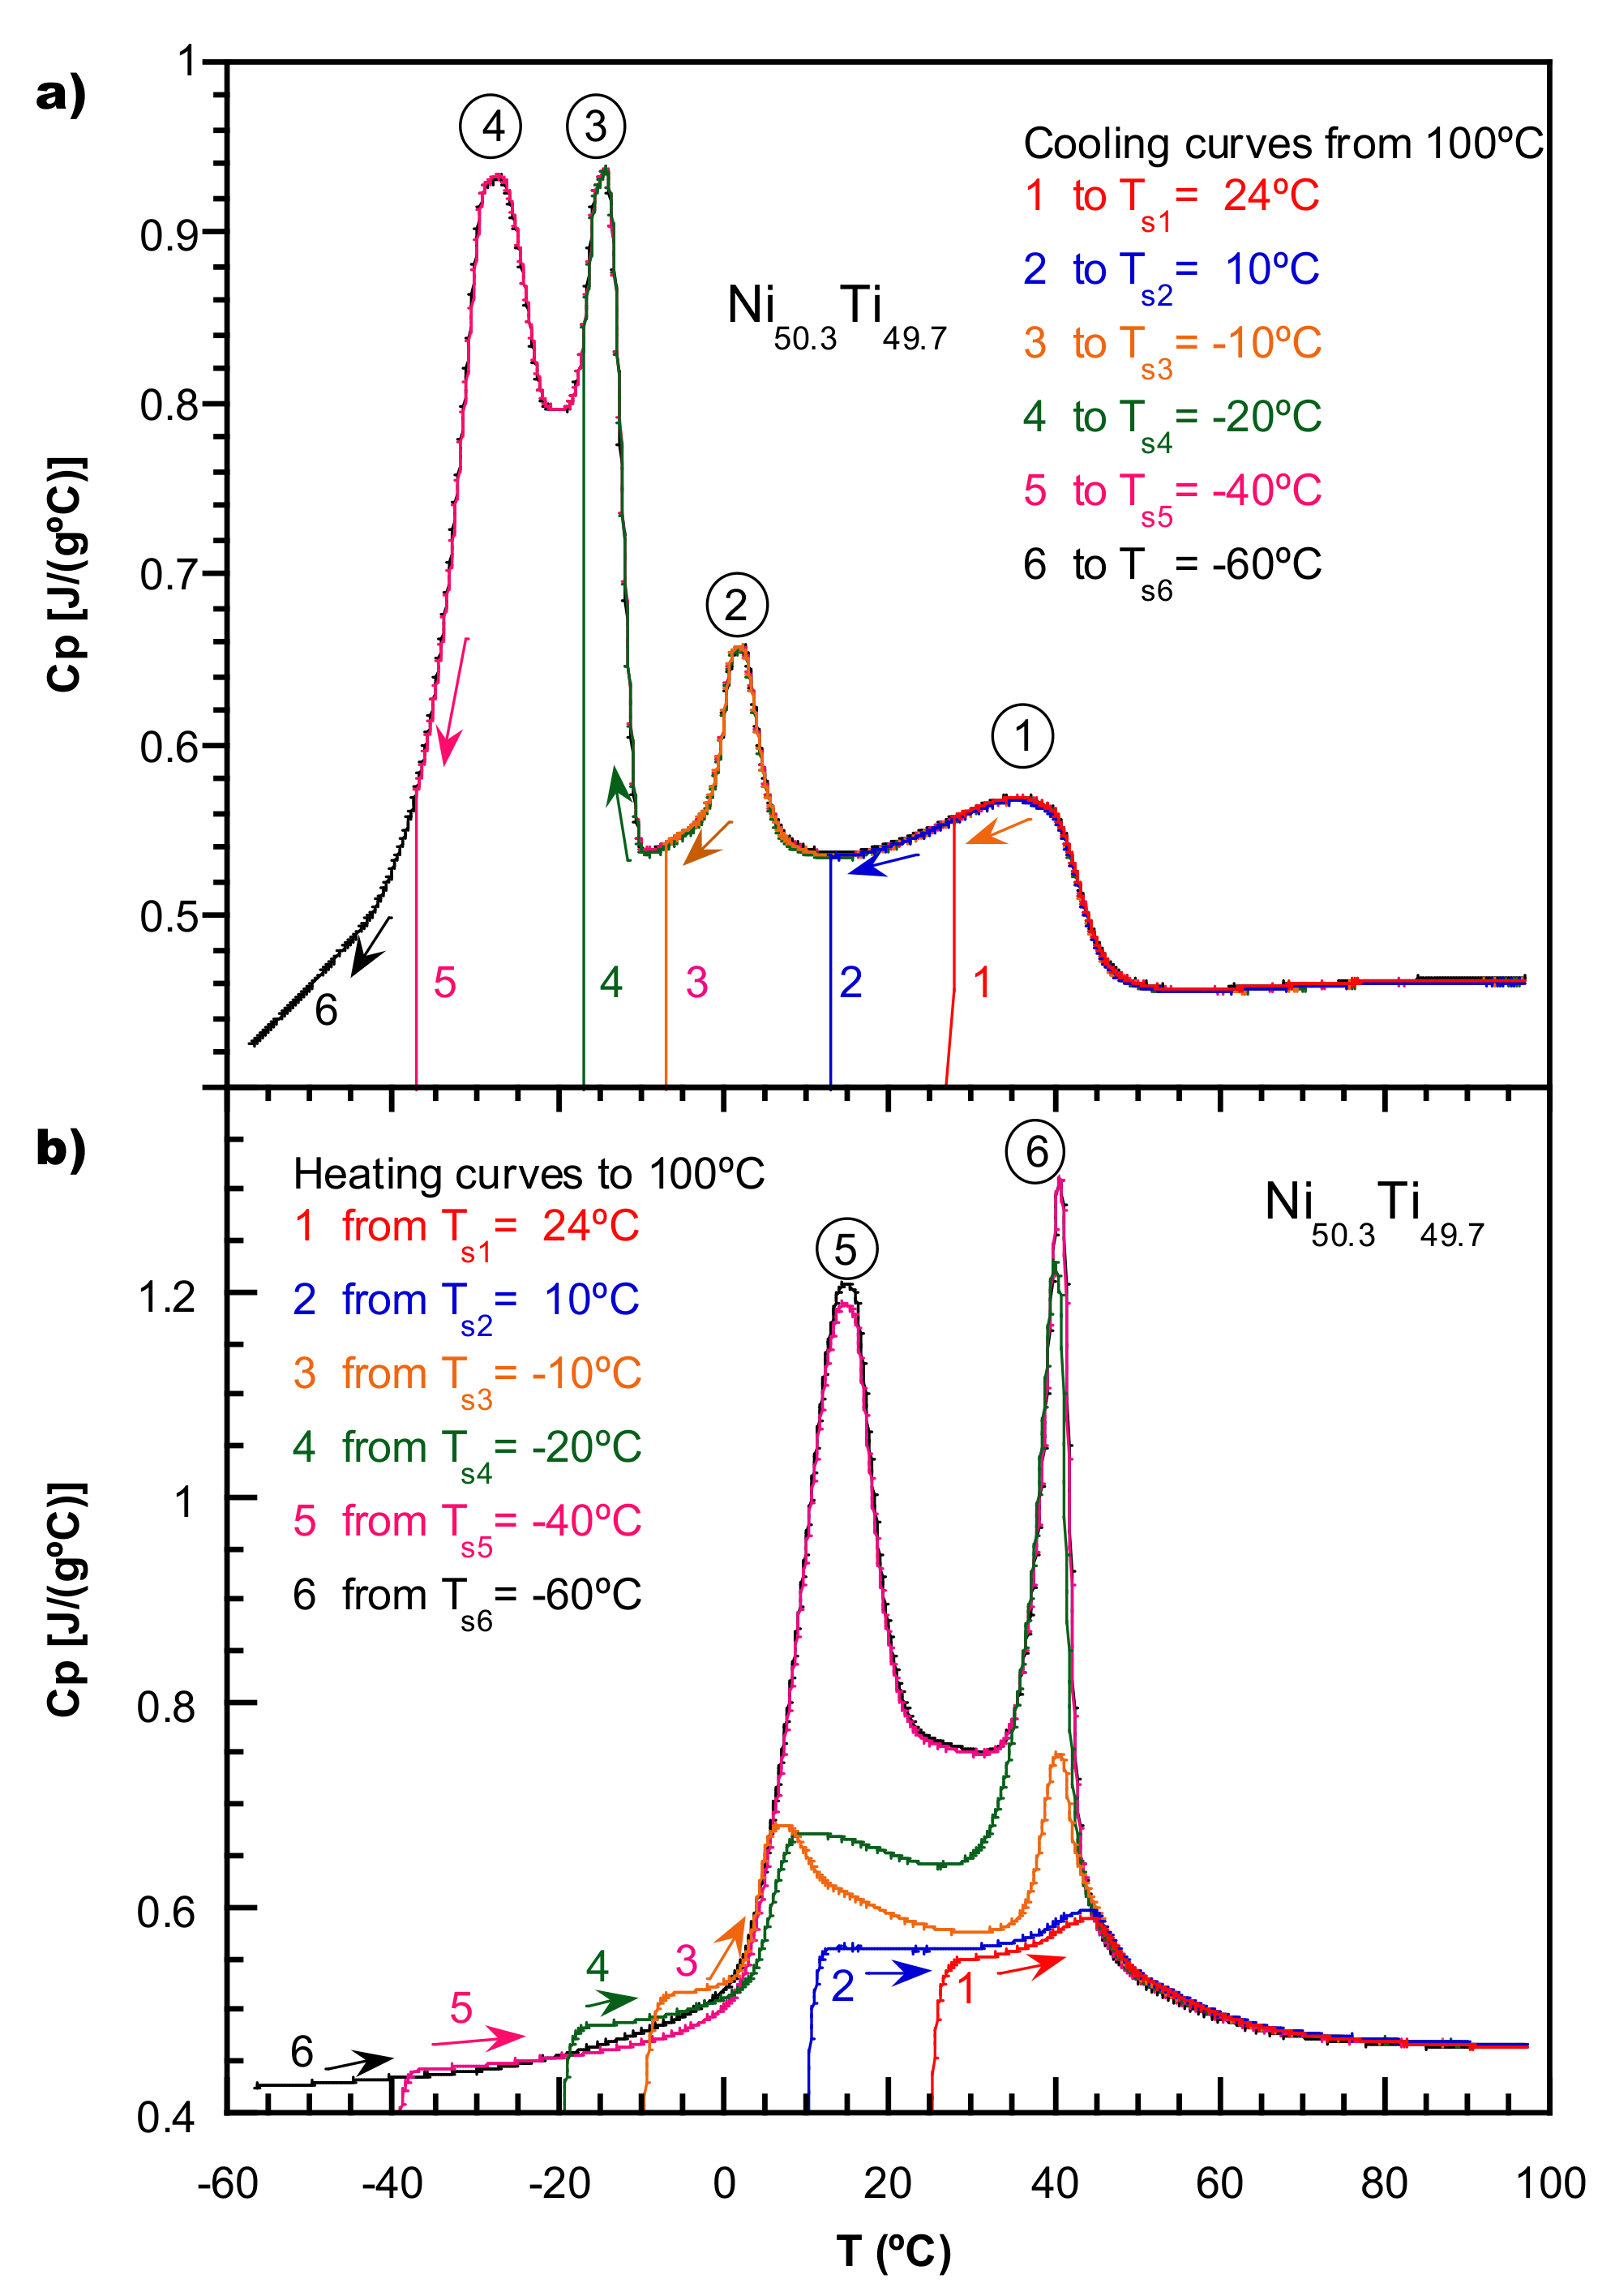
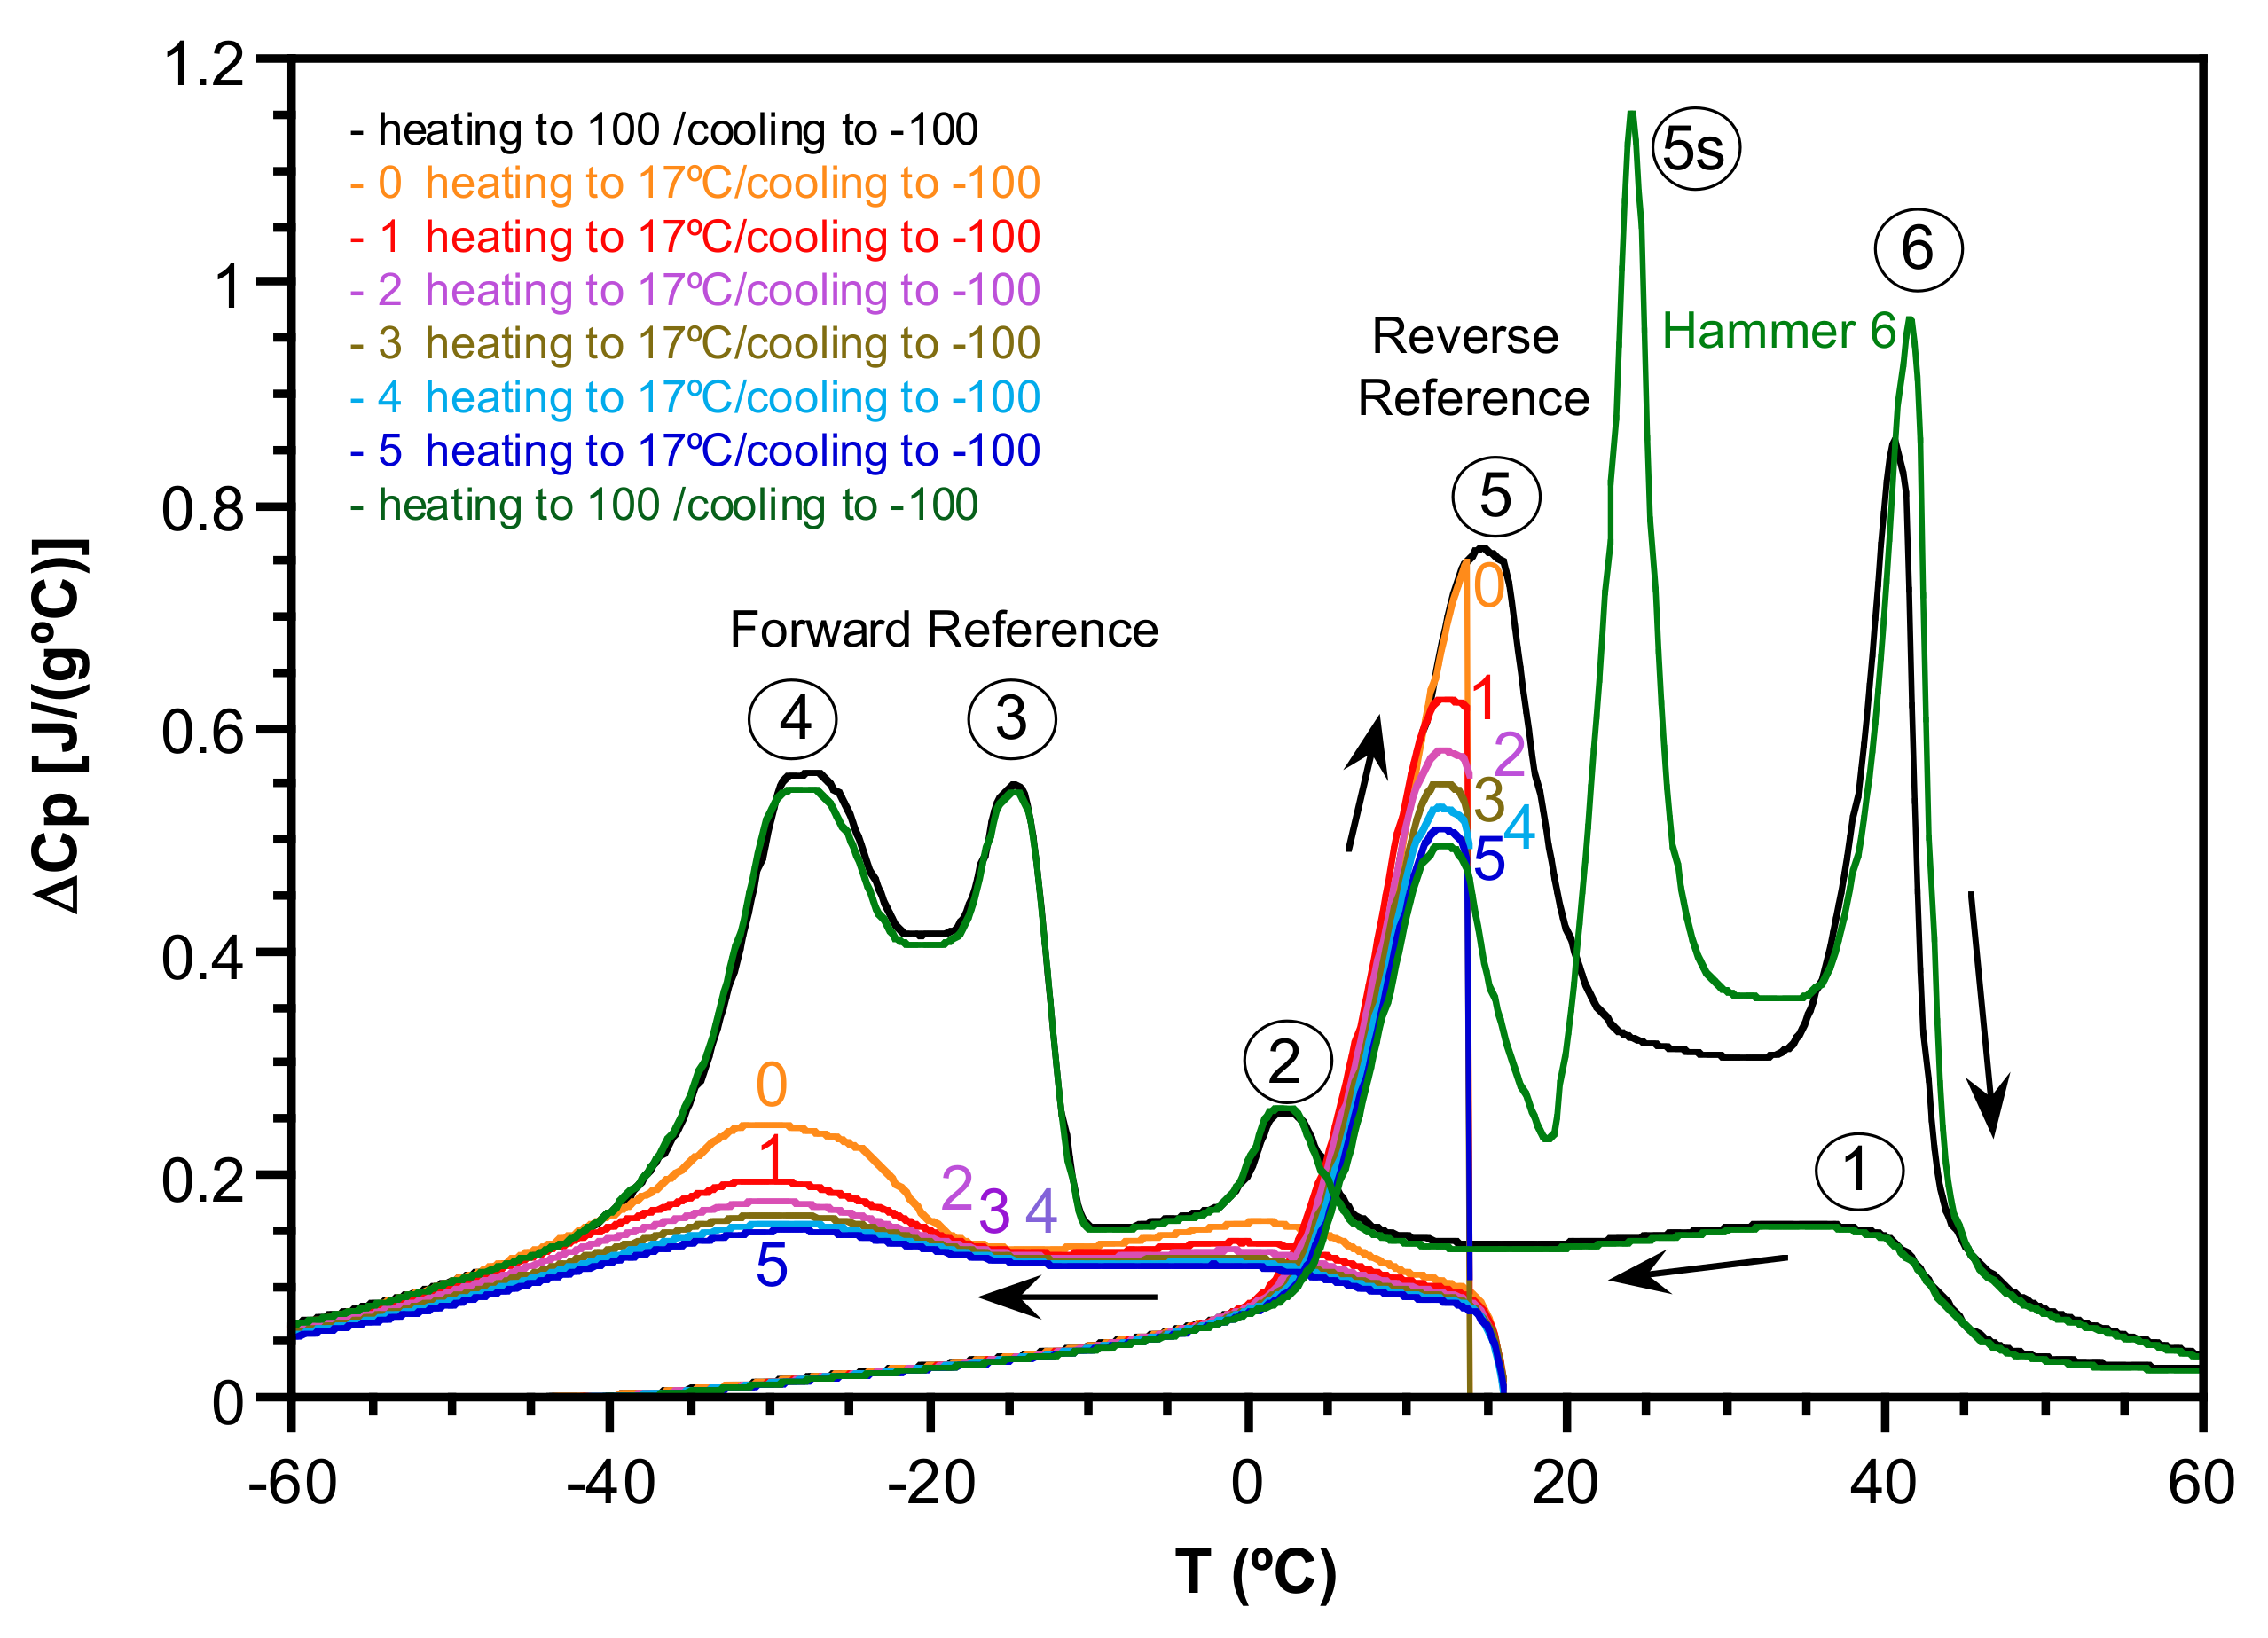
2.2. Study of the Transformation Stages

To establish the sequential process of the forward and reverse MTs, an attempt to obtain the correspondence among the various heating and cooling peaks was performed. For this purpose, the enthalpy contents of the various peaks observed upon cooling were compared with those detected upon heating. In order to study the transformation stages, several partial cooling-heating and heating-cooling experiments were performed. For the sake of clarity, as stated in Figure 2 and Table 1, the Cp peaks representing these stages are successively numbered from 1 to 4 with respect to cooling and are numbered 5 and 6 with respect to heating, as shown in Figure 3 and Figure 4. The calorimetric experiments consisted of successive partial cooling runs (Figure 3a) from 100 °C to a variable stop temperature (Ts), followed by the corresponding heating runs (Figure 3b) from Ts back to 100 °C. As can be seen in Figure 3, the selected Ts values were 24, 10, −10, −20, −40, and −60 °C, respectively. The vertical lines appearing in the DSC signals are only to indicate the experimental stopping process and, though with no physical meaning, are maintained in the plot as approximate references for Ts. These temperatures were selected to analyze each individual cooling transformation stage by means of partial forward MT. It has been observed that:
-
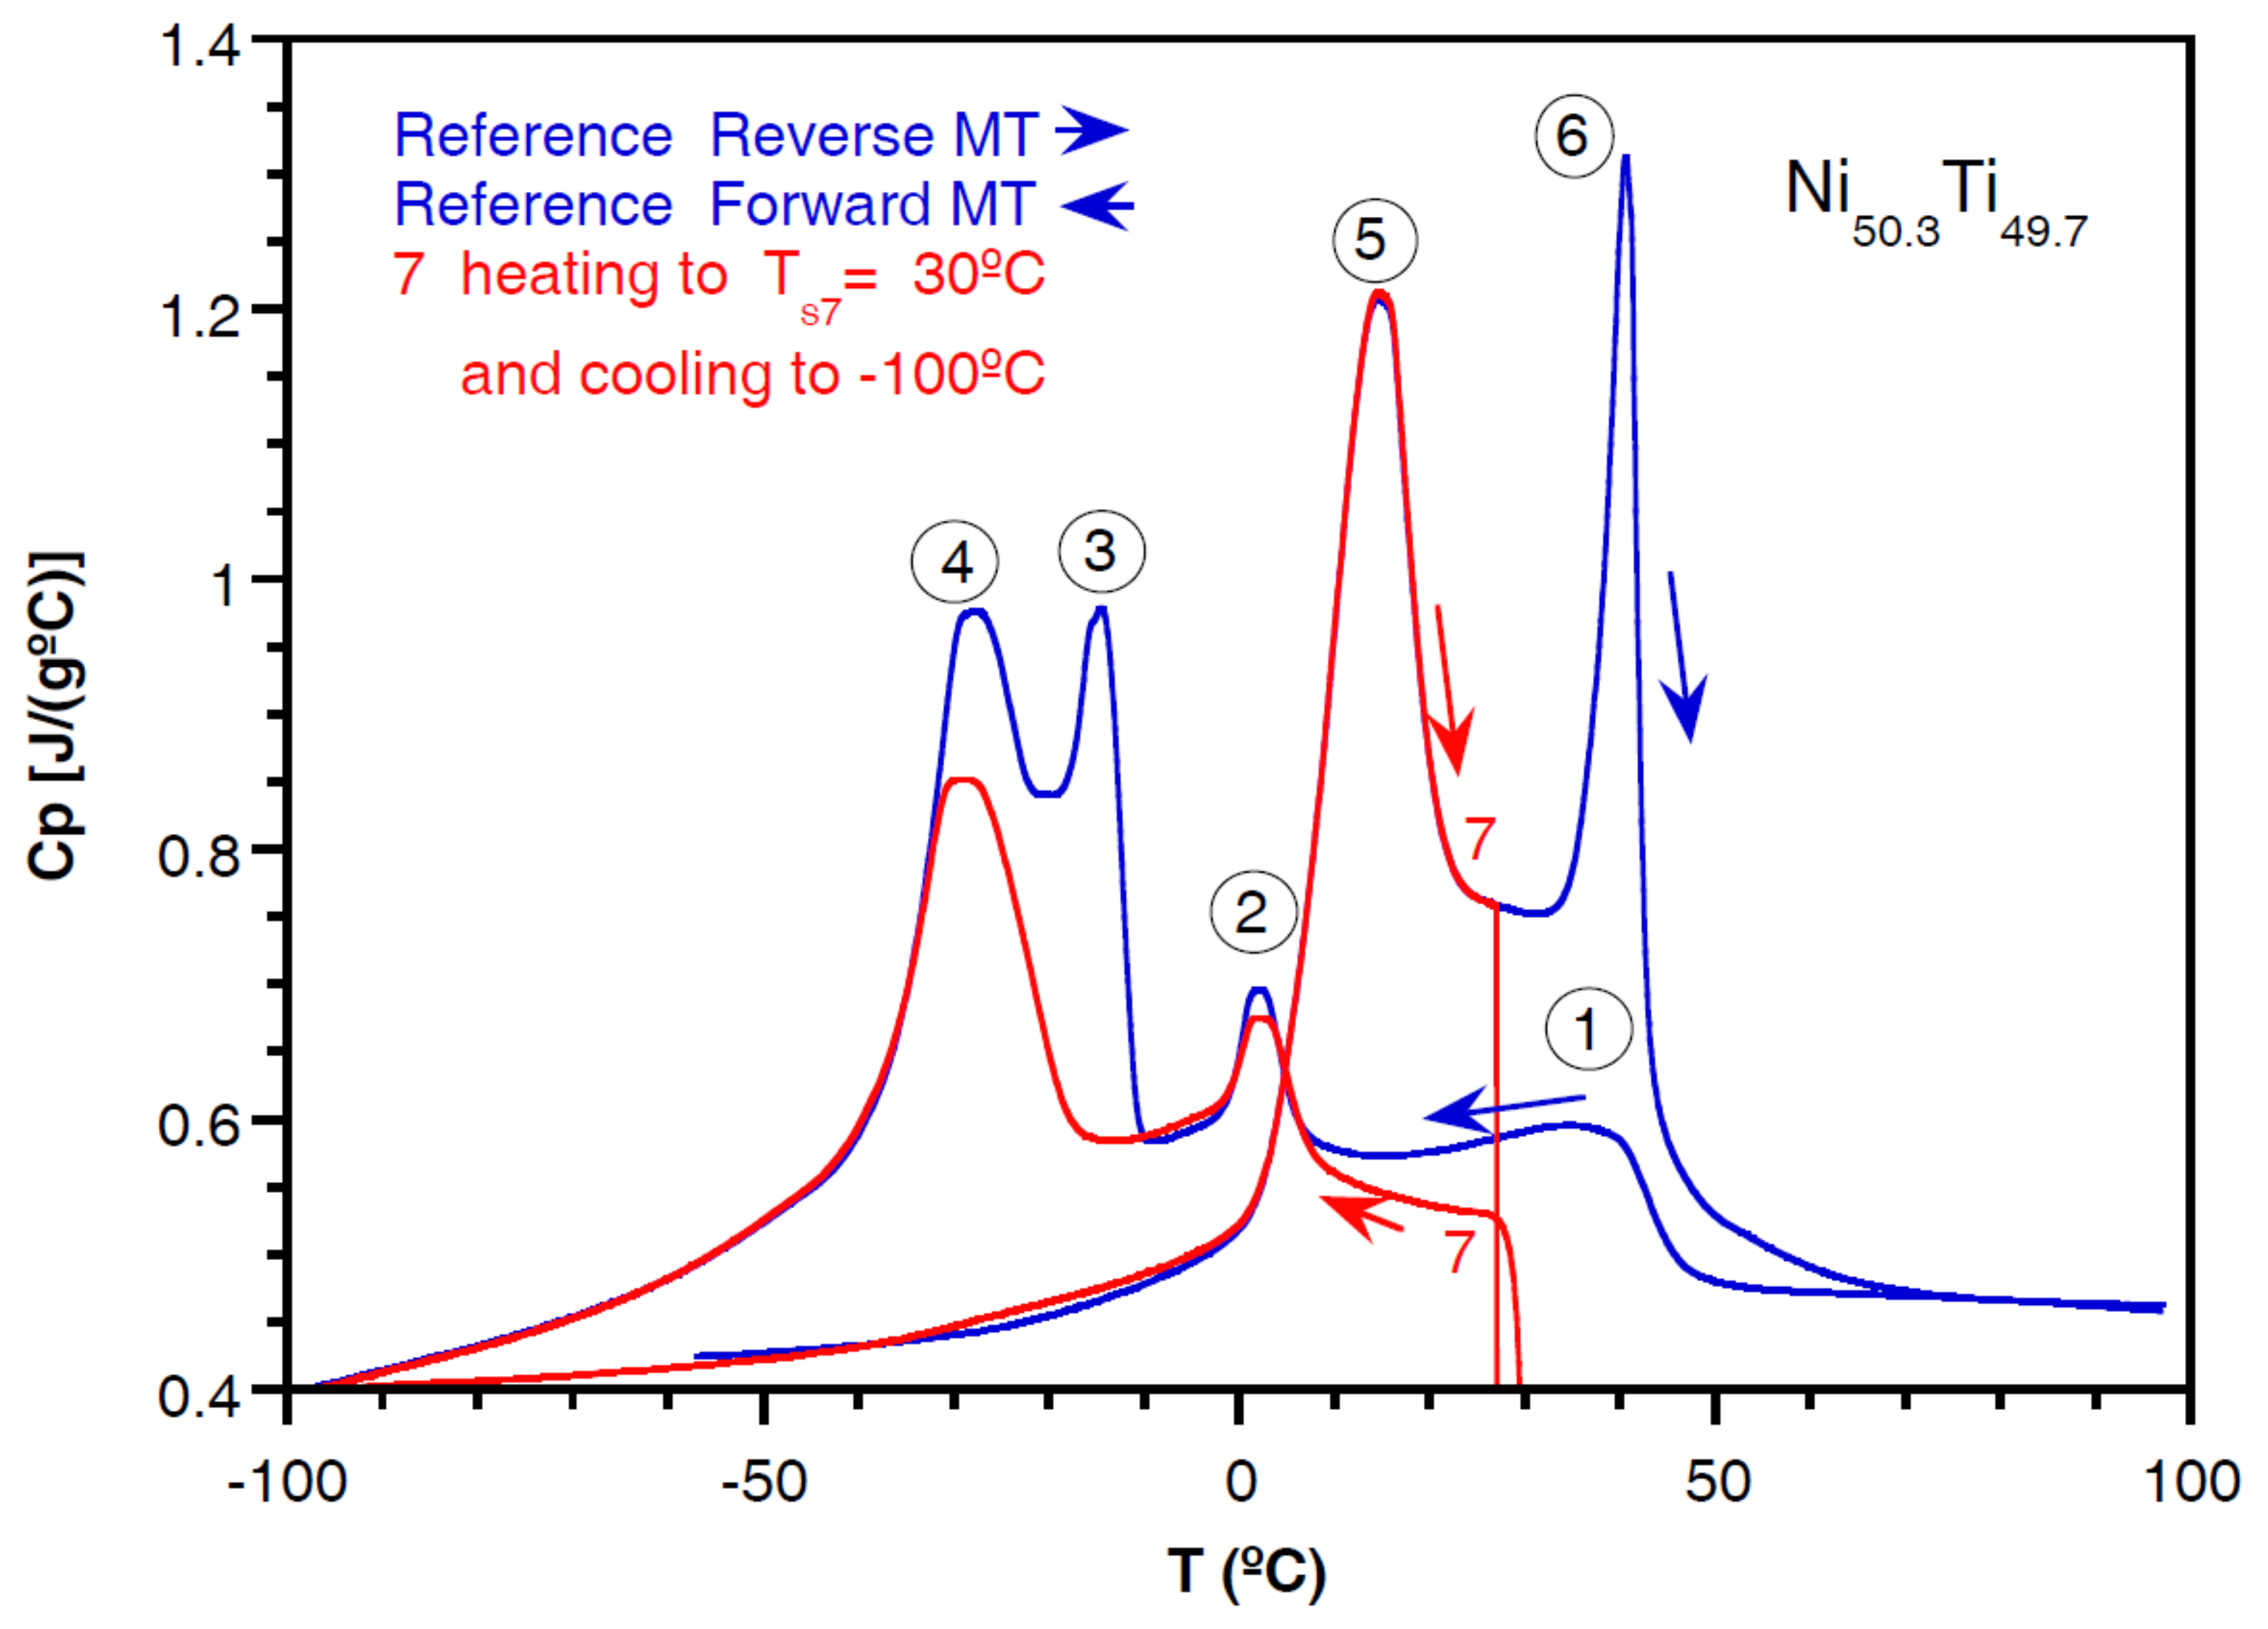
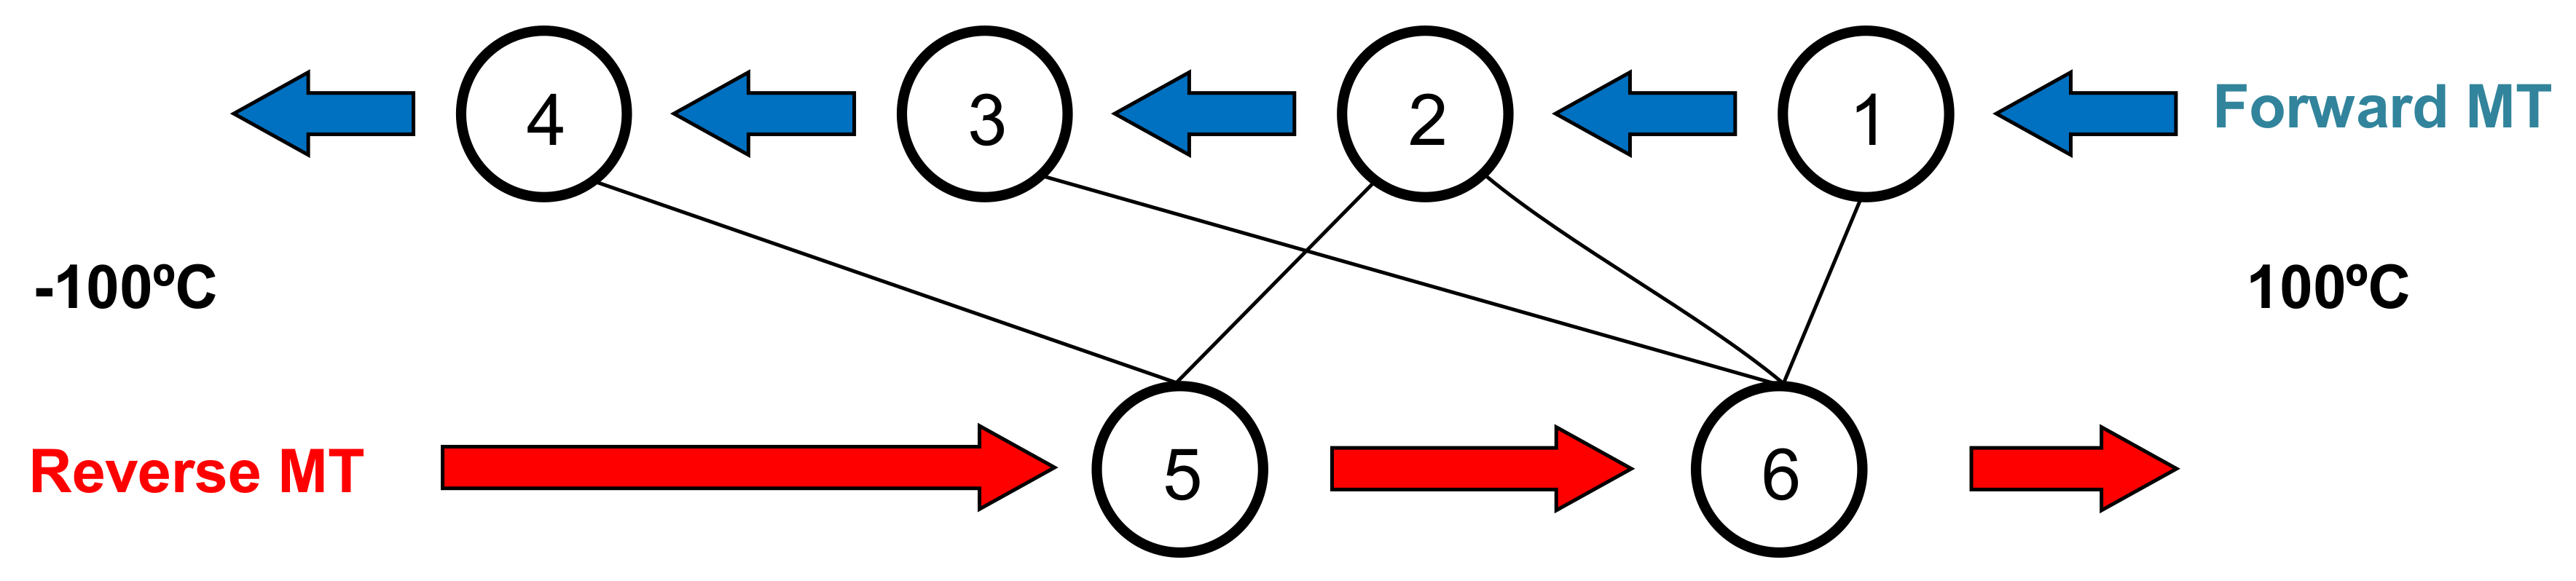
Cooling down to those temperatures that include stage 1 (Ts1 = 24 °C and Ts2 = 10 °C) increases successively the Cp of stage 6 upon heating.
-
Cooling down to Ts below stage 2 (Ts3 = −10 °C) shows an equal increase for Cp at both stages 5 and 6 upon heating.
-
Cooling down to Ts below stage 3 (Ts4 = −20 °C) mainly increases the Cp values around stage 6 up to its total final value upon heating.
-
Finally, cooling down to Ts below stage 4 (Ts5 = −40, Ts6 = −60 °C) only increases the Cp of stage 5, approaching its total final value upon heating.
In summary, we can conclude the following: stages 1 and 3 are mainly related to stage 6 and stage 4 is (only) related to stage 5, but stage 2 is related to both stages 5 and 6. Thus, stage 2 can be divided into 2a (related to 5) and 2b (related to 6).
These results can be strengthened and complemented by a partial reverse MT, as shown in Figure 4.
In this experiment, the sample has been heated from −100 °C to a selected intermediate temperature between peaks 5 and 6: Ts7 = 30 °C. The subsequent cooling trace down to −100 °C presents peak 2 and peak 4, but stage 3 is absent. This confirms that stage 5 is only related to stages 2 and 4, but not to stages 1 and 3. These results are consistent with the reference forward MT obtained by cooling from 100 °C to −100 °C. Within this scheme, calculations of the peak areas lead to the corresponding enthalpy assignment to the various stages, the values of which are shown in Table 1. In addition, the relationships among the various MT stages are summarized in Figure 5.
The microscopic description of the multistage MT together with the identification of the different phases have already been studied in previous works [12,15,23]. Very similar complex phase sequences, close to the one presented here, have been found in the works by G. Fan et al. [19] and B. Karbakhsh Ravari et al. [16,41]. In the latter study, up to a four-step transformation process was found in the forward MT of the samples after very similar thermal treatments, involving the same annealing temperature and time (950 °C, 1 h) and aging pattern (500 °C, 1 h), but no systematic thermal cycling seems to have been performed. However, their samples present a 50.6% Ni content, higher than that in our samples (50.3%), which would favor the Ni4Ti3 precipitation and, therefore, the presence of a heterogeneous nucleation. As we have described above, those authors also propose diverse relationships among the observed forward and reverse DSC peaks, but their results are somewhat different. In some cases [16,41], they have identified the various low-temperature phases (R and B19′ martensites) by means of in situ TEM measurements. As the phase sequences are extremely dependent on multiple physical parameters (mainly the composition and the thermomechanical history) these results cannot be confidently applied to our samples. In order to avoid these ambiguities, we have performed preliminary in situ TEM experiments in our quenched samples. Both the R and B19′ phases were identified, but it should be noted that the former is also found at very low temperatures well below the expected temperatures, as can be seen in Figure 6. The typical R phase spots at 1/3 <111> B2 positions were observed in the microdiffraction pattern acquired in the zone marked with circle 1, and spots occurring at 1/2 of the <110> B2 reflections characteristic of the B19′ martensite were clearly observed for the pattern acquired in the zone marked with circle 2.
This observation is not in agreement with the low thermal hysteresis usually claimed for this transformation [5,20,42]. However, in relation to this result, we must underline the following considerations. As it is well-known, the observed thermal hysteresis (ΔTH) in this kind of first-order phase transition is a consequence of the presence of dissipative effects usually grouped in the general term “frictional work” (Wf), which in general represents any kind of physical impediment requiring an additional energy to be overcome in order to observe the transition [43].
As reported in previous works [12,16,19,23], the presence of a highly heterogeneous microstructure makes the martensitic plates’ nucleation highly dependent on the different environments in the austenitic frame. Up to now, some of these locations have been identified [13,14,15,16], and among them are the grain boundaries, grain interiors, defects, and some other parts of the austenitic crystal, which hinder the transformation. As this affects both the martensitic B19′ and R phases, it can explain a wide variety of thermal hysteresis values and, consequently, the presence of the multiple and highly overlapped specific heat peaks. In this context, the observed thermal hysteresis should not be considered as an intrinsic property, fixed for each structural transformation. To analyze this problem, we can resort to the study of the Gibbs energy determined from the specific heat data together with the temperatures of transformation, which allow us to estimate the values associated with the elastic contribution and the dissipative works. As shown in previous studies [1], the intrinsic Gibbs energy (sometimes called the “chemical Gibbs energy”), as a function of temperature, corresponding both to the austenitic phase (GA) and to the low-temperature martensitic state (GM) well below the transformation temperature range, is directly obtained from the enthalpy and entropy of the crystal lattice. For this purpose, the general relation G = HTS can be used, together with the total enthalpy (ΔHT) and entropy (ΔST) changes associated with the complete transformation. Within this frame, the true thermodynamic equilibrium temperature (T0) between phases must be established by the GA = GM condition. However, the peculiarities of the plates’ nucleation in these alloys do not permit such a simple description. The difficulties for nucleation, which arise mainly from the crystallographic distortion of the crystal lattice during the transformation from the high-temperature cubic phase to the less symmetric low-temperature phases, lead to an elastic deformation of the variants [5,43]. This fact alters the effective value of the Gibbs energy in the martensitic phases, which can be now written as G M * = GM + Gel. So, the actual phase equilibrium temperature ( T 0 * ) for every individual plate must satisfy the condition: G M * = GA. As the values for Gel are different for the various single plates, so are their local equilibrium temperatures, providing a satisfactory description of the usual spread of the first-order martensitic transformations into a wide temperature range. That means that the distribution of the Gel among the plates explains the sequential character of these transformations, whereas, as cited above, Wf remains responsible for the observed ΔTH. For the sake of clarity, Figure 7 offers a schematic drawing to show the role of the quantities involved in the transformation of each plate.
In some cases, when a common thermal hysteresis value can be assigned for all the plates, the Gel and Wf values can be easily separated, as it is the case, for example, for some single crystals of Cu-Al-Ni shape-memory alloys [28].The direct relationship between Wf and ΔTH makes this last quantity a good measure of the extra energy required for the nucleation of the different martensite variants in the austenitic matrix. It is found that ΔTH is higher in polycrystalline samples than in single crystals [28,44,45] and shows a marked dispersion of values when we have a complex austenitic microstructure. This is the case of the thermally aged TiNi sample, showing a convoluted phase transformation sequence, where no common value for the plates phase transition ΔTH is found. It is manifest from the lack of symmetry between the observed Cp curves upon cooling and upon heating, which precludes a precise evaluation both of Gel and of Wf for each plate. However, the wide range of ΔTH observed values indicates the highly heterogeneous austenitic framework. The ΔTH values found for the various Cp peaks (using the tip of the peaks temperatures Ti as reference) can be obtained from the data in Table 1. The minimum value corresponds to peaks 1 and 6 (3.7 °C), probably related to the Austenite-R phase transformation near the grain boundaries. On the other hand, the maximum one is about 58 °C between peaks 3 and 6 and corresponds to the massive martensitic nucleation in the grains bulk, in agreement with the highest enthalpy value shown by this last forward transformation step (11.6 J/g, about 50% of the total transformation enthalpy). It leads to an estimation of about 4 J/g for Wf and 2.5 J/g to Gel, if we assume T 0 * = (T3 + T6)/2 = 286 °C. In total, they represent 6% of the average value of G at this temperature. As expected, all these figures are significantly higher than those found in more homogeneous microstructures [28].
Leaving apart the evident limitations, we finally stress the fact that the procedure described above constitutes an efficient tool for a first estimation of the energies associated with the multistep martensitic transformations, common in these materials, obtained by means of simple and easy experiments. There is another point that must be noted. Traditionally it has been argued that the R phase was buffered during the nucleation of martensite B19′, which justifies the presence of only one Cp peak in the reverse transformation. Nevertheless, our experiments summarized in Figure 3, Figure 4 and Figure 5 and in Table 1, show that the R phase nucleated in particular environments is not transformed to B19′. This fact becomes evident in the in situ TEM observations, where the R phase was undoubtedly identified at temperatures well below the end of transformation stage 4, which should correspond to the austenite–B19′ transformation. Finally, the elastic energy relaxation processes in the low-temperature phases may be the origin of the reduction of the observed steps in the reverse transformation, but more experimental work is necessary to clarify these points. Further TEM (using a Philips CM200 microscope, Amsterdam, The Netherlands) experiments are in progress in order to accomplish this task.

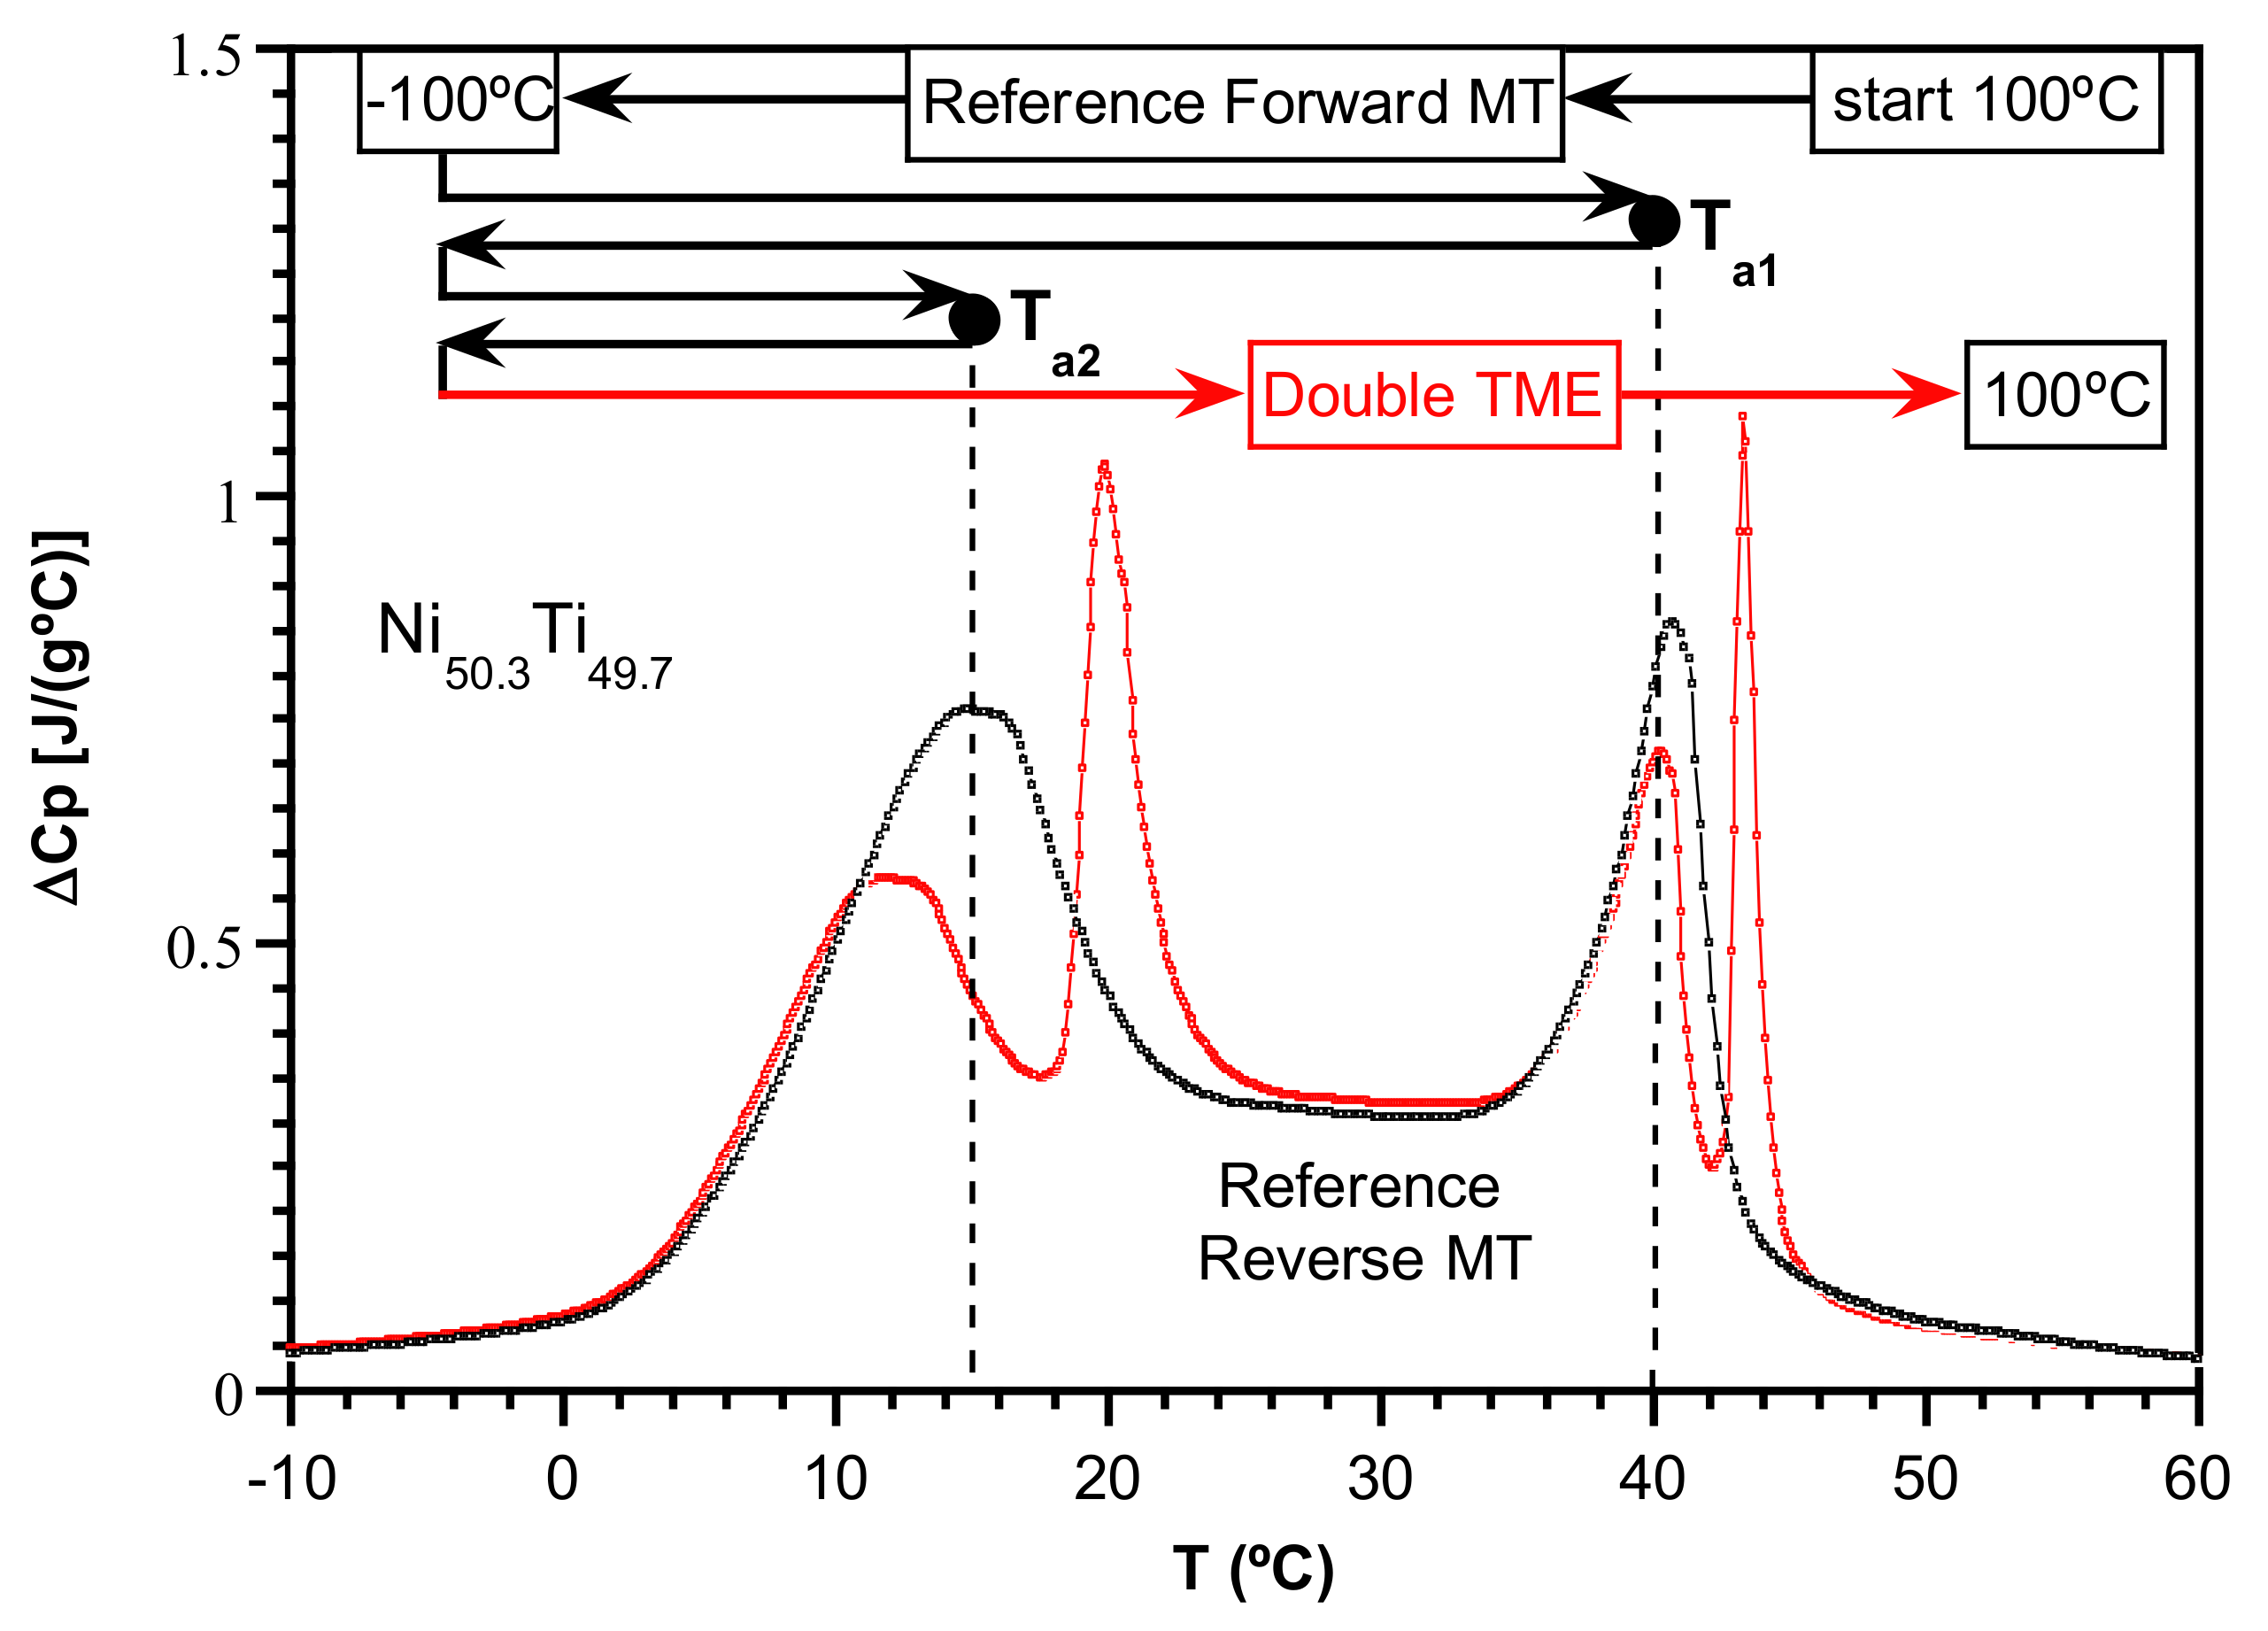
2.3. Evidence of the Temperature Memory Effect

The TME appears when partial heating cycles are performed from the low-temperature martensitic phase to an intermediate temperature (the so-called “arrested temperature”, Ta) between austenitic start temperature (As) and austenitic finish temperature (Af). It is characterized by a noticeable delay of the MT up to higher temperatures in the subsequent total heating cycle (the “reverse” MT), and it is considerably increased by the repetition of the partial cycles to Ta, previous to the final total MT (the so-called “hammer effect”) [25,46]. As two independent stages (5, 6) are present in the reverse transformation, we have examined the presence of the expected TME under partial heating/cooling cycles in both cases by means of the thermal sequence shown in Figure 8.
The experiments were started at 100 °C to guarantee that any previous TME is previously erased. The arrested temperatures were Ta1 = 40 °C and Ta2 = 15 °C close to the 6 and 5 peak temperatures, respectively. We note that the second partial heating up to Ta2 does not eliminate the first effect associated with Ta1, as Ta1 > Ta2 [25,47]. The final heating run undoubtedly shows the characteristic Cp peak split and confirms the presence of a clear TME in both stages. In the same figure, the Cp reference curve and the one showing the TME are plotted. Both the additional Cp peaks and the associated delay of the MT to higher temperatures are significantly larger in these TiNi alloys when compared, for example, with those observed in CuAlNi [32].
The repetition of the partial reverse MT from the martensitic state to the same arrested temperature Ta, is found to increase the TME [25,46]. To characterize this effect (the so-called “hammer” effect), we have focused only on stage 5 and selected Ta = 17 °C. After cooling from the austenitic phase, the partial sequence (ps): −100 °C → 17 °C → −100 °C is repeated n times (ps = 0, 1, 2…, n−1). Then, a complete reverse MT: −100 °C → 100 °C is made, and this last result is called the “Hammer n” curve. Independent experiments for n = 1 to n = 6 and n = 20 were performed. An example of these experiments for n = 6 is presented in Figure 9, where the various heating and cooling Cp curves are depicted after subtracting the calculated baseline. The reference cooling and heating curves (those which do not exhibit TME) are also plotted for comparison. The progressive delay of the MT is clearly shown by the ps heating curves 0–5 below Ta when compared with the reference curve. This means that at Ta the remaining martensite phase fraction is increased with cycles. Accordingly, the corresponding cooling curves also confirm this fact, as the area below the peaks clearly diminish after each cycle. It should be noted that only peaks 2 and 4 show this effect, but, as expected, peak 3 does not, being not present in all these cooling curves. This result again confirms that stage 5, upon heating, is only related to stages 2 and 4 on cooling as discussed before (see Figure 5 and Table 1). After the multiple partial cycling, the final complete MT shows the “hammer 6” TME curve with a high increase of the secondary peak (5 s) when compared with the single TME (n = 1), as seen in Figure 9. We finally note that, once the TME has been erased, the last cooling curve corresponding to the complete forward MT fits quite well the initial “reference” curve.
In Figure 10, the final complete MT heating traces for “Hammer n” (n = 1–6 and n = 20) around stage 5 are presented. As defined above, each “Hammer n” curve represents the complete reverse MT after n previous partial cycles. The progressive increase of the secondary peak on stage 5 (5 s) is evident from these results, whereas stage 6 remains practically unchanged. The enthalpy decrease below Ta, is found to match the corresponding increase of the secondary peak (5 s). An example of the evolution of the ΔCp below Ta in the 20 previous partial cycles, before the “Hammer 20” curve, is shown in Figure 11.
These measurements make it possible to calculate, by means of numerical integration, the enthalpy associated with each one of the partial transformations ( Δ H p s a ), which are directly related to the mass transformed over the successive heating cycles up to Ta:
Δ H p s a = Δ H ( T a ) Δ H T = 100 T a Δ C p d T 100 100 Δ C p d T .
As can be seen in Figure 12, an almost exponential decrease in this quantity is observed as a function of ps. The delay of the transformation approaches 50% of the initial value for n > 20. In previous works, similar results were explained by the progressive redistribution of the elastic energy among the martensitic plates by means of a simple relaxation model [28,45]. However, the complexity of the multistage transformation in these TiNi polycrystalline samples does not permit such an approach.

3. Summary and Conclusions

A thorough experimental analysis of the evolution of the calorimetric signal of the studied NiTi alloy under successive thermal cycling allowed us to observe the progressive stabilization of the microstructure. Above 75 cycles, the profile of the calorimetric signal can be considered fixed and the results repetitive. Once this stable situation is reached, a selective nucleation is observed because of a very heterogeneous austenitic microstructure with specific areas well-identified in the literature: grain boundaries, defects and dislocations, and interior of grains. This fact agrees with the presence of the various peaks of specific heat observed by DSC, although they include very wide overlaps. This behavior confirms the previous observations of other authors in NiTi samples with multistage transformations. Although the differences in the calorimetric signal vary considerably from one sample to another, their common denominator is the presence of up to four ranges of preferential nucleation temperatures, which are gradually defined as a consequence of the successive thermal cycles. As noted by other authors, these treatments also result in the progressive stabilization of the R phase. We have observed by TEM the presence of this phase at temperatures well below the full MT, so it can be deduced that its complete transformation into phase B19′, which is widely accepted, does not always take place.
The determination of the thermodynamic functions of the transformation associated with each stage has been substantially improved by using an accurate baseline, based on the calculation of the contribution of the crystalline lattice to the specific heat. These measurements have allowed us, in the first place, to unequivocally establish the correspondence between the four stages of the forward transformation with the two stages of the reverse MT.
These results, together with the thermal hysteresis data, permit us to estimate the dissipative works present in each nucleation. As one might expect from such a complex microstructure, they are very diverse but always high. Secondly, the calculation of the Gibbs energy in the different phases, together with the amplitude of the transforming temperature ranges in each stage, lead to an estimation of the elastic energies stored in the different variants. These values, also high, underline the microstructural impediments for nucleation in the different zones of the austenitic structure once stabilized. Finally, the use of partial cycles of heating and cooling around the two stages of the reverse transformation, commonly assigned to the B19′→R→B2 sequence, confirms in both cases the presence of the temperature memory effect. In addition, the repetition of these partial heating cycles (Hammer effect), allowed us to study the progressive delay of the transformation towards higher temperatures and the exponential decay of the transformed martensite mass, along successive incomplete reverse transformations.

Acknowledgments

This work has been supported by the Spanish Ministry of Economy and Competitiveness, MINECO, CONSOLIDER-INGENIO 2010 CSD2009-00013, as well as by the Consolidated Research Group IT-1090-16 and the ELKARTEK-ACTIMAT project from the Education and Industry Departments of the Basque Government. The University of the Basque Country has also supported this work with the Research Group grant: UPV/EHU GIU17/071. The authors appreciate the cooperation of J. Rodriguez-Aseguinolaza in the thermal treatments of the samples.

Author Contributions

All authors have contributed to the experiments and conclusions presented in this article. In particular I.R.-L., A.L.-E., M.L.N., J.M.S.J. designed the experiments; T.B., I.L.-F., G.A.L., prepared the samples and the thermal treatments; T.B., I.L. performed the DSC measurements and the related discussion, M.L.N. and G.A.L performed the TEM measurements and the related discussion; I.R.-L., A.L.-E., analyzed the data and the graphics design. Finally, with the cooperation of all authors and, as a result of periodic meetings, the main text of this article has been written.

Conflicts of Interest

The authors declare no conflict of interest.

References

  1. Otsuka, K.; Wayman, C.M. Shape Memory Materials; Cambridge University Press: Cambridge, UK, 1999; ISBN 978-0-521-66384-7. [Google Scholar]
  2. Lagoudas, D.C. Shape Memory Alloys: Modeling and Engineering Applications; Springer: Berlin, Germany, 2008; ISBN 978-0-387-47685-8. [Google Scholar]
  3. Ohkata, I.; Tsuchiya, K.; Miyazaki, S. Shape Memory and Superelastic Alloys: Applications and Technologies; Yamauchi, K., Ed.; Reprint Edition; Woodhead Publishing: Cambridge, UK, 2016; ISBN 978-0-08-101701-2. [Google Scholar]
  4. Schryvers, D.; Potapov, P.; Santamarta, R.; Tirry, W. Applications of advanced transmission electron microscopic techniques to Ni–Ti based shape memory materials. Mater. Sci. Eng. A 2004, 378, 11–15. [Google Scholar] [CrossRef]
  5. Otsuka, K.; Ren, X. Physical metallurgy of Ti–Ni-based shape memory alloys. Prog. Mater. Sci. 2005, 50, 511–678. [Google Scholar] [CrossRef]
  6. Povoden-Karadeniz, E.; Cirstea, D.C.; Lang, P.; Wojcik, T.; Kozeschnik, E. Thermodynamics of Ti–Ni shape memory alloys. Calphad 2013, 41, 128–139. [Google Scholar] [CrossRef]
  7. Frenzel, J.; George, E.P.; Dlouhy, A.; Somsen, C.; Wagner, M.F.-X.; Eggeler, G. Influence of Ni on martensitic phase transformations in NiTi shape memory alloys. Acta Mater. 2010, 58, 3444–3458. [Google Scholar] [CrossRef]
  8. Matsumoto, H. Transformation behaviour with thermal cycling in NiTi alloys. J. Alloys Compd. 2003, 350, 213–217. [Google Scholar] [CrossRef]
  9. Pattabi, M.; Ramakrishna, K.; Mahesh, K.K. Effect of thermal cycling on the shape memory transformation behavior of NiTi alloy: Powder X-ray diffraction study. Mater. Sci. Eng. A 2007, 448, 33–38. [Google Scholar] [CrossRef]
  10. Sitepu, H.; Schmahl, W.; Allafi, J.; Eggeler, G.; Dlouhy, A.; Toebbens, D.; Tovar, M. Neutron diffraction phase analysis during thermal cycling of a Ni-rich NiTi shape memory alloy using the Rietveld method. Scr. Mater. 2002, 46, 543–548. [Google Scholar] [CrossRef]
  11. Urbina, C.; De la Flor, S.; Ferrando, F. Effect of thermal cycling on the thermomechanical behaviour of NiTi shape memory alloys. Mater. Sci. Eng. A 2009, 501, 197–206. [Google Scholar] [CrossRef]
  12. Bataillard, L.; Bidaux, J.-E.; Gotthardt, R. Interaction between microstructure and multiple-step transformation in binary NiTi alloys using in-situ transmission electron microscopy observations. Philos. Mag. A 1998, 78, 327–344. [Google Scholar] [CrossRef]
  13. Dlouhy, A.; Khalil-Allafi, J.; Eggeler, G. Multiple-step martensitic transformations in Ni-rich NiTi alloys—An in-situ transmission electron microscopy investigation. Philos. Mag. 2003, 83, 339–363. [Google Scholar] [CrossRef]
  14. Carroll, M.C.; Somsen, C.; Eggeler, G. Multiple-step martensitic transformations in Ni-rich NiTi shape memory alloys. Scr. Mater. 2004, 50, 187–192. [Google Scholar] [CrossRef]
  15. Khalil Allafi, J.; Ren, X.; Eggeler, G. The mechanism of multistage martensitic transformations in aged Ni-rich NiTi shape memory alloys. Acta Mater. 2002, 50, 793–803. [Google Scholar] [CrossRef]
  16. Karbakhsh Ravari, B.; Farjami, S.; Nishida, M. Effects of Ni concentration and aging conditions on multistage martensitic transformation in aged Ni-rich Ti–Ni alloys. Acta Mater. 2014, 69, 17–29. [Google Scholar] [CrossRef]
  17. Zhou, Y.; Fan, G.; Zhang, J.; Ding, X.; Ren, X.; Sun, J.; Otsuka, K. Understanding of multi-stage R-phase transformation in aged Ni-rich Ti–Ni shape memory alloys. Mater. Sci. Eng. A 2006, 438–440, 602–607. [Google Scholar] [CrossRef]
  18. Xue, D.; Zhou, Y.; Ren, X. The effect of aging on the B2-R transformation behaviors in Ti-51 at% Ni alloy. Intermetallics 2011, 19, 1752–1758. [Google Scholar] [CrossRef]
  19. Fan, G.; Chen, W.; Yang, S.; Zhu, J.; Ren, X.; Otsuka, K. Origin of abnormal multi-stage martensitic transformation behavior in aged Ni-rich Ti–Ni shape memory alloys. Acta Mater. 2004, 52, 4351–4362. [Google Scholar] [CrossRef]
  20. Wang, X.; Li, K.; Schryvers, D.; Verlinden, B.; Van Humbeeck, J. R-phase transition and related mechanical properties controlled by low-temperature aging treatment in a Ti-50.8 at. % Ni thin wire. Scr. Mater. 2014, 72–73, 21–24. [Google Scholar] [CrossRef]
  21. Wang, X.; Verlinden, B.; Van Humbeeck, J. Effect of Aging Temperature and time on the Transformation Behavior of a Ti-50.8 at. % Ni Alloy with Small Grains. Mater. Today Proc. 2015, 2, S565–S568. [Google Scholar] [CrossRef]
  22. Wang, X.; Li, C.; Verlinden, B.; Van Humbeeck, J. Effect of grain size on aging microstructure as reflected in the transformation behavior of a low-temperature aged Ti-50.8 at. % Ni alloy. Scr. Mater. 2013, 69, 545–548. [Google Scholar] [CrossRef]
  23. Khalil-Allafi, J.; Dlouhy, A.; Eggeler, G. Ni4Ti3-precipitation during aging of NiTi shape memory alloys and its influence on martensitic phase transformations. Acta Mater. 2002, 50, 4255–4274. [Google Scholar] [CrossRef]
  24. Johnson, W.A.; Domingue, J.A.; Reichman, S.H. P/M processing and characterization of controlled transformation temperature NiTi. J. Phys. Colloq. 1982, 43, C4-285–C4-290. [Google Scholar] [CrossRef]
  25. Airoldi, G.; Corsi, A.; Riva, G. The hysteresis cycle modification in thermoelastic martensitic transformation of shape memory alloys. Scr. Mater. 1997, 36, 1273–1278. [Google Scholar] [CrossRef]
  26. Wang, Z.; Zu, X.; Fu, Y. Review on the temperature memory effect in shape memory alloys. Int. J. Smart Nano Mater. 2011, 2, 101–119. [Google Scholar] [CrossRef]
  27. Resnina, N.; Belyaev, S. Multi-stage martensitic transformations induced by repeated thermal cycling of equiatomic TiNi alloy. J. Alloys Compd. 2009, 486, 304–308. [Google Scholar] [CrossRef]
  28. Rodríguez-Aseguinolaza, J.; Ruiz-Larrea, I.; Nó, M.L.; López-Echarri, A.; San Juan, J. A new quantitative approach to the thermoelastic martensitic transformation: The density of elastic states. Acta Mater. 2008, 56, 6283–6290. [Google Scholar] [CrossRef]
  29. Krishnan, M. New observations on the thermal arrest memory effect in Ni–Ti alloys. Scr. Mater. 2005, 53, 875–879. [Google Scholar] [CrossRef]
  30. Sun, L.; Huang, W.M.; Cheah, J.Y. The temperature memory effect and the influence of thermo-mechanical cycling in shape memory alloys. Smart Mater. Struct. 2010, 19, 055005. [Google Scholar] [CrossRef]
  31. Tang, W. Thermodynamic study of the low-temperature phase B19′ and the martensitic transformation in near-equiatomic Ti-Ni shape memory alloys. Metall. Mater. Trans. A 1997, 28, 537–544. [Google Scholar] [CrossRef]
  32. Rodríguez-Aseguinolaza, J.; Ruiz-Larrea, I.; Nó, M.L.; López-Echarri, A.; San Juan, J.M. Temperature memory effect in Cu–Al–Ni shape memory alloys studied by adiabatic calorimetry. Acta Mater. 2008, 56, 3711–3722. [Google Scholar] [CrossRef]
  33. Ren, X.; Miura, N.; Zhang, J.; Otsuka, K.; Tanaka, K.; Koiwa, M.; Suzuki, T.; Chumlyakov, Y.; Asai, M. A comparative study of elastic constants of Ti–Ni-based alloys prior to martensitic transformation. Mater. Sci. Eng. A 2001, 312, 196–206. [Google Scholar] [CrossRef]
  34. Uchil, J.; Mohanchandra, K.P.; Ganesh Kumara, K.; Mahesh, K.K.; Murali, T.P. Thermal expansion in various phases of Nitinol using TMA. Phys. B Condens. Matter 1999, 270, 289–297. [Google Scholar] [CrossRef]
  35. Gopal, E. Specific Heats at Low Temperatures; Springer Science & Business Media: Berlin, Germany, 2012; ISBN 978-1-4684-9081-7. [Google Scholar]
  36. Herget, G.; Müllner, M.; Suck, J.B.; Schmidt, R.; Wipf, H. Phonon Spectra of the Memory Alloy NiTi. EPL Europhys. Lett. 1989, 10, 49. [Google Scholar] [CrossRef]
  37. Birgeneau, R.J.; Cordes, J.; Dolling, G.; Woods, A.D.B. Normal Modes of Vibration in Nickel. Phys. Rev. 1964, 136, A1359–A1365. [Google Scholar] [CrossRef]
  38. Rudin, S.P.; Jones, M.D.; Albers, R.C. Thermal stabilization of the HCP phase in titanium. Phys. Rev. B 2004, 69, 094117. [Google Scholar] [CrossRef]
  39. Liu, Y.; Laeng, J.; Chin, T.V.; Nam, T.-H. Effect of incomplete thermal cycling on the transformation behaviour of NiTi. Mater. Sci. Eng. A 2006, 435–436, 251–257. [Google Scholar] [CrossRef]
  40. Pattabi, M.; Ramakrishna, K.; Mahesh, K.K. Corrigendum to “Effect of thermal cycling on the shape memory transformation behavior of NiTi alloy: Powder X-ray diffraction study” [Mater. Sci. Eng. A. 448 (2007) 33–38]. Mater. Sci. Eng. A 2009, 505, 191. [Google Scholar] [CrossRef]
  41. Karbakhsh Ravari, B.; Nishida, M. In situ SEM studies of the transformation sequence of multistage martensitic transformations in aged Ti-50.8 at. % Ni alloys. Philos. Mag. 2013, 93, 2279–2296. [Google Scholar] [CrossRef]
  42. Wang, X.; Kustov, S.; Li, K.; Schryvers, D.; Verlinden, B.; Van Humbeeck, J. Effect of nanoprecipitates on the transformation behavior and functional properties of a Ti-50.8 at. % Ni alloy with micron-sized grains. Acta Mater. 2015, 82, 224–233. [Google Scholar] [CrossRef]
  43. Wollants, P.; Roos, J.R.; Delaey, L. Thermally- and stress-induced thermoelastic martensitic transformations in the reference frame of equilibrium thermodynamics. Prog. Mater. Sci. 1993, 37, 227–288. [Google Scholar] [CrossRef]
  44. Rodríguez-Aseguinolaza, J.; Ruiz-Larrea, I.; Nó, M.L.; López-Echarri, A.; San Juan, J. Kinetic effects in the mixed β to martensitic transformation in a Cu–Al–Ni shape memory alloy. Acta Mater. 2010, 58, 692–701. [Google Scholar] [CrossRef]
  45. Rodríguez-Aseguinolaza, J.; Ruiz-Larrea, I.; Nó, M.L.; López-Echarri, A.; Bocanegra, E.H.; San Juan, J. Thermal history effects of Cu–Al–Ni shape memory alloys powder particles compared with single crystals behaviour. Intermetallics 2010, 18, 2183–2190. [Google Scholar] [CrossRef]
  46. Airoldi, G.; Corsi, A.; Riva, G. Step-wise martensite to austenite reversible transformation stimulated by temperature or stress: A comparison in NiTi alloys. Mater. Sci. Eng. A 1998, 241, 233–240. [Google Scholar] [CrossRef]
  47. He, X.M.; Rong, L.J.; Yan, D.S.; Li, Y.Y. Temperature memory effect of Ni47Ti44Nb9 wide hysteresis shape memory alloy. Scr. Mater. 2005, 53, 1411–1415. [Google Scholar] [CrossRef]
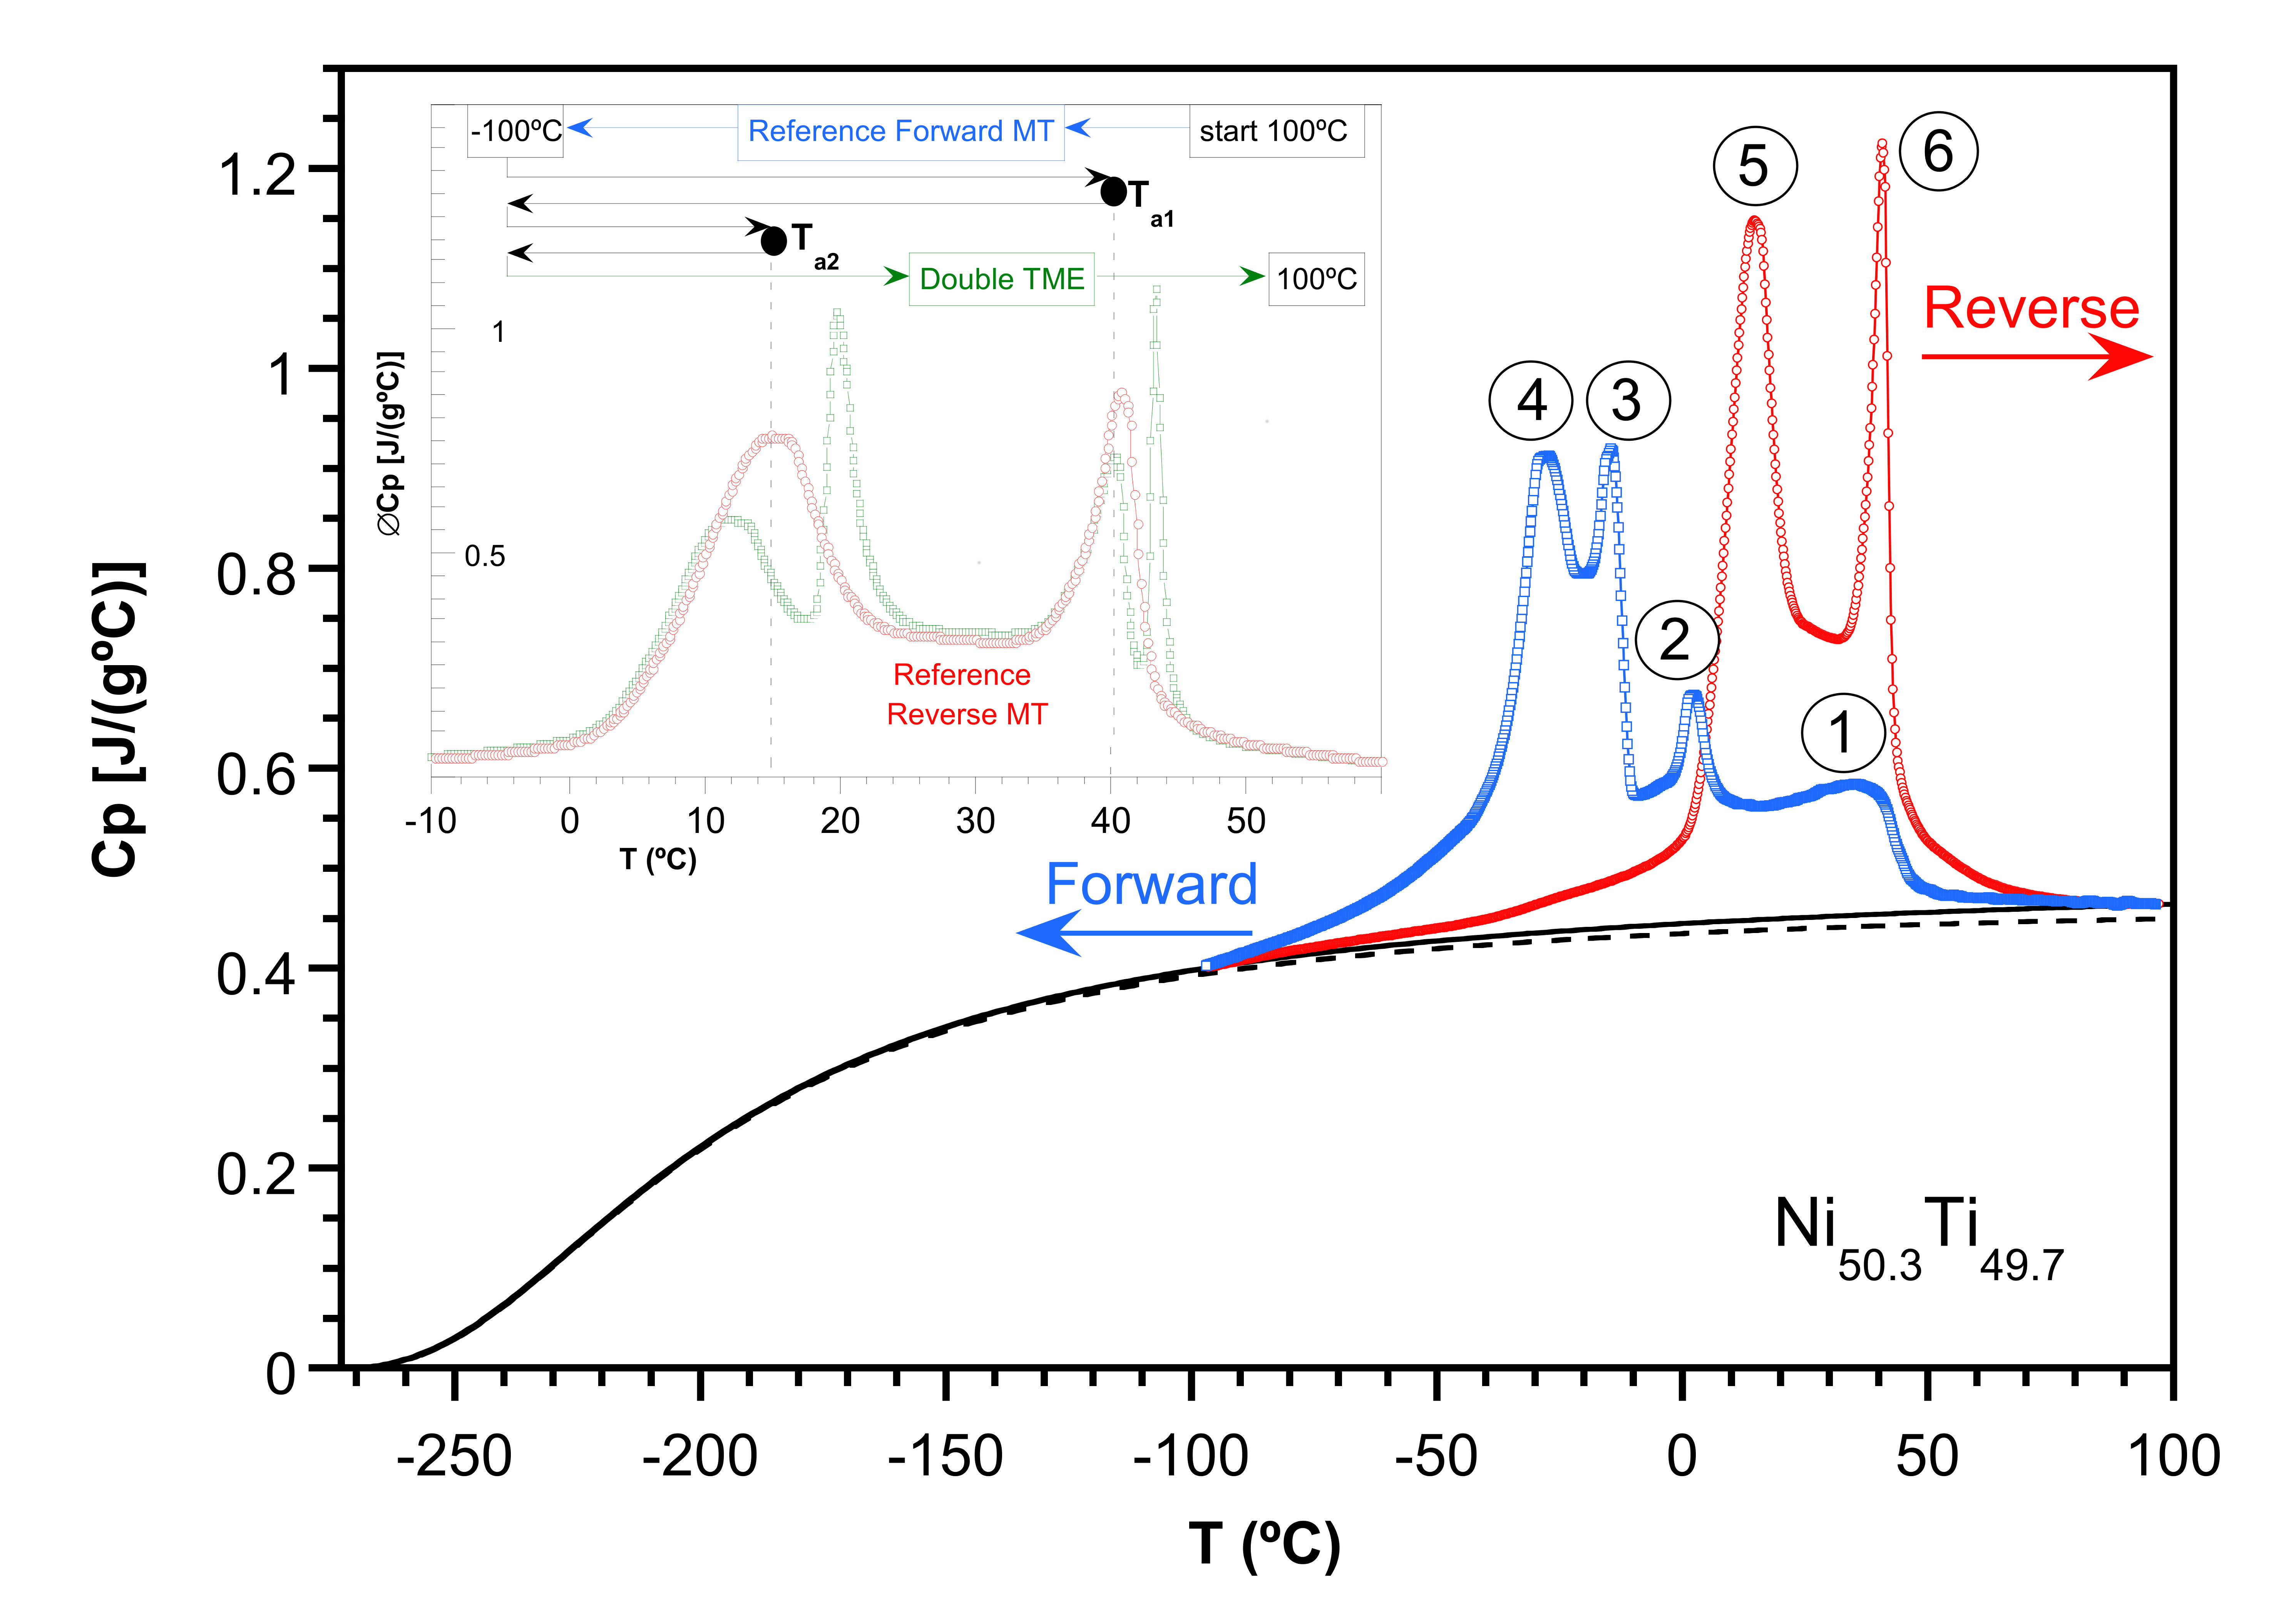
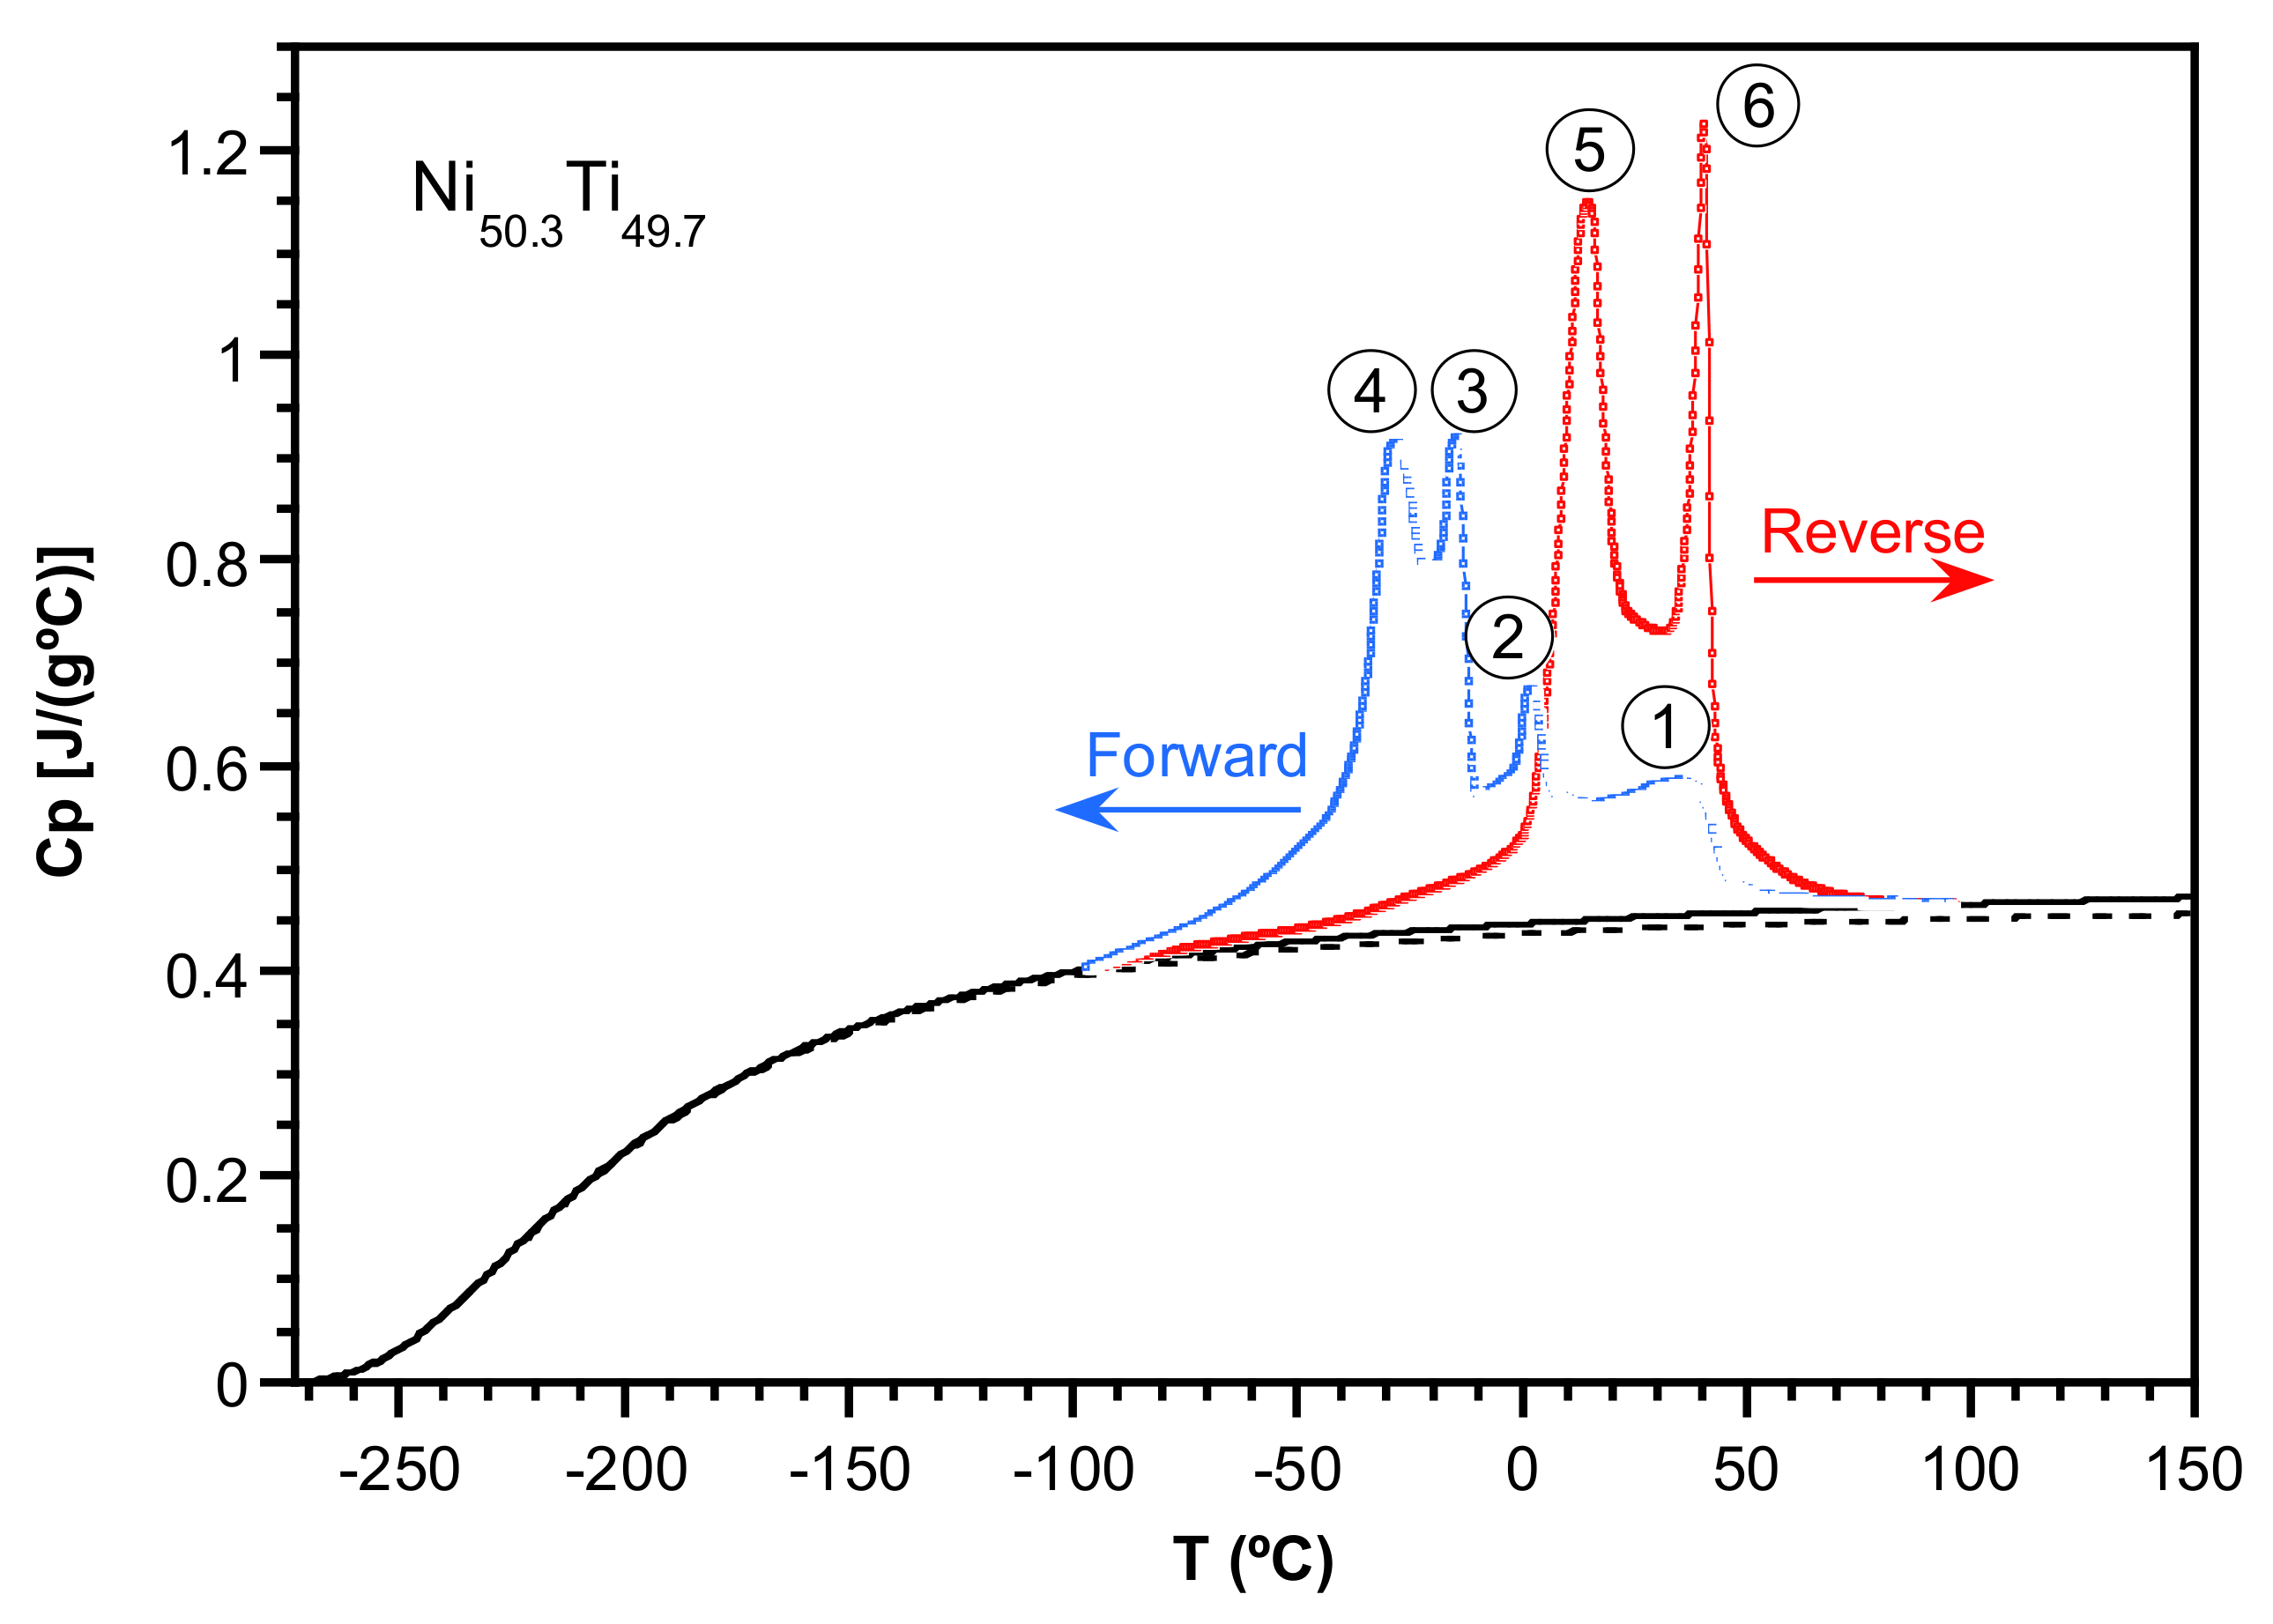
Figure 1. The Ni50.3Ti49.7 specific heat (Cp) under cycling, showing the evolution of the forward (a) and reverse (b) martensitic transformations (MT).
Metals 08 00246 g001
Figure 2. The Ni50.3Ti49.7 specific heat, once stabilized after 75 thermal cycles. Both the forward (□: blue) and reverse (o: red) martensitic transformations are shown. The encircled numbers indicate each MT stage. The continuous line is the calculated lattice contribution to Cp. The dotted line is the harmonic specific heat (Ch). The differences between these two curves represent the anharmonic contribution (Canh).
Metals 08 00246 g002
Figure 3. Description of the various thermal cooling (a) and heating (b) cycles performed on Ni50.3Ti49.7 for the study of the six MT stages. The vertical lines indicate the approximate temperature stops (Ts).
Metals 08 00246 g003
Figure 4. Partial cycling of Ni50.3Ti49.7 from −100 °C to 30 °C and then to −100 °C to complete the study of the multistage MT. The obtained Cp curve (red) is compared with the complete forward and reverse MTs between −100 °C and +100 °C (in blue).
Metals 08 00246 g004
Figure 5. Summary of the relationships between the six MT stages.
Metals 08 00246 g005
Figure 6. Preliminary transmission electron microscopy (TEM) study performed using a Philips CM200 microscope (Amsterdam, The Netherlands) on an electron transparent lamella obtained by electropolishing. On the left, a bright field image acquired at −180 °C from a quenched Ni50.3Ti49.7 electron transparent lamella showing some self-accommodating B19′ groups (circle 2) in a matrix completely transformed from austenite to R phase (circle 1). On the right, the microdiffraction patterns corresponding to the R phase (1) and to the B19′ martensite (2).
Metals 08 00246 g006
Figure 7. Schematic diagram of the Gibbs energy showing the transformation of a single variant at T 0 * . The Gibbs energy in the austenite phase GA in red, the one in the martensitic phase GM in blue, the effective Gibbs energy G M * in green. The associated elastic energy Gel and the thermal hysteresis ΔTH related to the “frictional work” (Wf) are also depicted.
Metals 08 00246 g007
Figure 8. The thermal sequence, including two independent partial transformation cycles to Ta1 and Ta2, are depicted in the top of this figure. Inside, the calorimetric curve clearly shows the presence of the temperature memory effect (TME) in both transformation stages (o: red). This result is compared with the “Reference Reverse MT” (□: black).
Metals 08 00246 g008
Figure 9. The “Hammer 6” effect study on stage 5 with Ta = 17 °C. Up to six heating-cooling cycles between −100 °C and 17 °C were performed, before the final complete heating run from −100 °C to +100 °C which shows the notorious reinforcement of the TME (5 s “hammer 6” green curve).
Metals 08 00246 g009
Figure 10. The various “Hammer n” effects, always on stage 5 and Ta = 17 °C, for n = 1–6 and n = 20. In all the studied cases, only the final curves showing the corresponding TME are plotted. The progressive increase of the 5 s peak as a function of n is clearly observed.
Metals 08 00246 g010
Figure 11. The points represent the partial 20 heating runs (ps = 0, 1, …, 19) previous to the “Hammer 20” curve. The continuous lines are the “Hammer n” curves for n =1–6 and n = 20 also shown in Figure 10.
Metals 08 00246 g011
Figure 12. Partial enthalpy Δ H p s a associated with each of the 20 partial transformations (ps) from −100 °C to Ta = 17 °C, during the “Hammer 20” experiments. It shows the exponential delay of the MT as a function of ps, fitted to an empiric law. The best fit (continuous line) is found for A = 0.21, B = 0.18 and α = 0.14.
Metals 08 00246 g012
Table 1. Cp peaks, temperature (Tp (°C)), transformation stages, and partial and total martensitic transformation MT enthalpy values (ΔH) after 75 cycles.
Martensitic TransformationPeakTp (°C)MT StagesH (J/g)H (J/g)H (J/g)H (J/g)
Forward MT137.914.57.721.2 ± 0.621.2 ± 0.6
21.02a1.4
3−16.531.8
21.02b2.013.6
4−28.0411.6
Reverse MT516.5513.6-21.2 ± 0.6
641.667.7

