Article

Physically-Based Modeling and Characterization of Hot Flow Behavior in an Interphase-Precipitated Ti-Mo Microalloyed Steel

1
School of Materials Science and Engineering, Northeastern University, Shenyang 110819, China
2
School of Mechanical Engineering and Automation, Northeastern University, Shenyang 110819, China
*
Author to whom correspondence should be addressed.
Metals 2018, 8(4), 243; https://doi.org/10.3390/met8040243
Submission received: 21 March 2018 / Revised: 1 April 2018 / Accepted: 3 April 2018 / Published: 6 April 2018
(This article belongs to the Special Issue Advances in Microalloyed Steels)

Abstract

:
In this contribution, a series of hot compression tests was conducted on a typical interphase-precipitated Ti-Mo steel at relatively higher strain rates of 0.1~10 s−1 and temperatures of 900~1150 °C using a Gleeble-2000 thermo-mechanical simulator. A combination of Bergstrom and Kolmogorov–Johnson–Mehl–Avrami models was first used to accurately predict the whole flow behaviors of Ti-Mo steel involving dynamic recrystallization, under various hot deformation conditions. By comparing the characteristic stresses and material parameters, especially at the higher strain rates studied, the dependence of hot flow behavior on strain rate and deformation temperature was further clarified. The hardening parameter U and peak density ρp exhibited an approximately positive linear relationship with the Zener–Hollomon (Z) parameter, while the softening parameter Ω dropped with increasing Z value. The Avrami exponent nA varied between 1.2 and 2.1 with lnZ, implying two diverse nucleation mechanisms of dynamic recrystallization. The experimental verification was performed as well based on the microstructural evolution and mechanism analysis upon straining. The proposed constitutive models may provide a powerful tool for optimizing the hot working processes of high performance Ti-Mo microalloyed steels with interphase precipitation.

Graphical Abstract

1. Introduction

A new generation of advanced high strength steels (AHSSs) with both high/ultrahigh strength and good cold formability is becoming more commonly used in commercial vehicles to meet the continuous demand for better fuel economy and passenger safety [1,2,3]. However, many of the conventional AHSSs, e.g., dual-phase (DP) steel, have limited the stretch-flangeability during cold stamping in view of the notable difference in hardness between the soft ferrite and the hard martensite [2,3]. As a solution, a ferritic matrix with interphase precipitation has been proposed to improve the stretch-flangeability of AHSSs through optimizing alloy design and thermomechanical processes [4,5].
Funakawa et al. [6] first reported a Ti-Mo ferritic steel strengthened by period arrangement of nanoscale interphase precipitates, which exhibited an ultimate tensile strength (UTS) of ~780 MPa and a hole expansion ratio (HER) of 120%. The basic principle designed for this type of steel was to facilitate the formation of a large fraction of nanoscale precipitates by controlling the coarsening kinetics of (Ti, Mo)C particles [1,4,5,7,8,9,10], thus giving rise to a large contribution to the strength of steels. More recently, some research has been carried out with respect to the influence of Mo on the formation of interphase precipitates. It has been demonstrated by atom probe tomography (APT) that the size of (Ti, Mo)C precipitates could be reduced to as fine as 1–3 nm [1].
Additionally, recent research on the hot-compressed Ti-Mo steel [8] revealed that hot deformation promoted segregation of C to grain boundaries and simultaneously reduced the size of precipitates at grain boundaries during the isothermal holding process. Kim et al. [9,10] also pointed out that precipitation hardening exhibited a stronger relation to rolling temperature rather than coiling temperature. However, very few studies have considered the hot flow behaviors of Ti-Mo microalloyed steels, especially at relatively higher strain rates of 0.1~10 s−1, which was relevant to the industrial hot rolling processes [11]. A full list of nomenclature for all physical parameters is presented in Table 1.
Therefore, the main aim of the present work was to study the hot flow behavior of an interphase-precipitated Ti-Mo microalloyed steel with a typical composition of Fe-0.04C-0.2Si-1.5Mn-0.08Ti-0.22Mo at strain rates of 0.1~10 s−1 and a series of deformation temperatures ranging from 900–1150 °C. The activation energy for hot deformation and peak stress of both steels were determined, in conjunction with physically-based modeling of hot flow behavior. The experimental verification was performed through microstructural evolution and mechanism analysis during hot deformation.

2. Experimental Procedures

A 30-kg ingot with a typical composition of Fe-0.04C-0.2Si-1.5Mn-0.08Ti-0.22Mo was prepared, followed by heating to 1200 °C for 2 h and hot rolling to ~20 mm in thickness. The calculated austenite to ferrite transformation start temperature Ar3 by Thermo-calc software is approximately 858.1 °C. The as hot-rolled microstructure consisted of ferrite with an average grain size of ~40 μm, along with a small amount of pearlite (~7%), as presented in Figure 1. Cylindrical specimens of Φ 8 × 15 mm were machined from the hot-rolled plates, with the axis parallel to the rolling direction.
A series of hot compression tests was conducted on a Gleeble-2000 thermo-mechanical simulator. Specimens were reheated at a rate of 10 °C/s to 1200 °C for 3 min for homogenization purposes, followed by cooling at 10 °C/s to diverse deformation temperatures. After soaking for 10 s, they were compressed in a single hit to ε = 0.8 at temperatures of 900~1150 °C and strain rates of 0.1~10 s−1, followed by immediate quenching in water. The selection of temperatures considered is based on the following two facts: (1) the austenite was deformed in the single austenitic region; (2) all three common deformation mechanisms appeared on the flow curves in this study.
Microstructural characterization after hot deformation was performed using an optical microscope (OM, OLYMPUS DSX500, Tokyo, Japan) and electron backscattered diffraction (EBSD) in a JEOL JSM-7100F (Jeol, Tokyo, Japan) field emission gun scanning electron microscope. The scanning step size was approximately 0.5 μm, and data post-processing was performed using a Tex-SEM Laboratories orientation-imaging microscope (OIM) system. Specimens for EBSD were prepared by standard mechanical grinding and electro-polishing using a perchloric acid-alcohol solution (1:15) at 30 V.

3. Results and Discussion

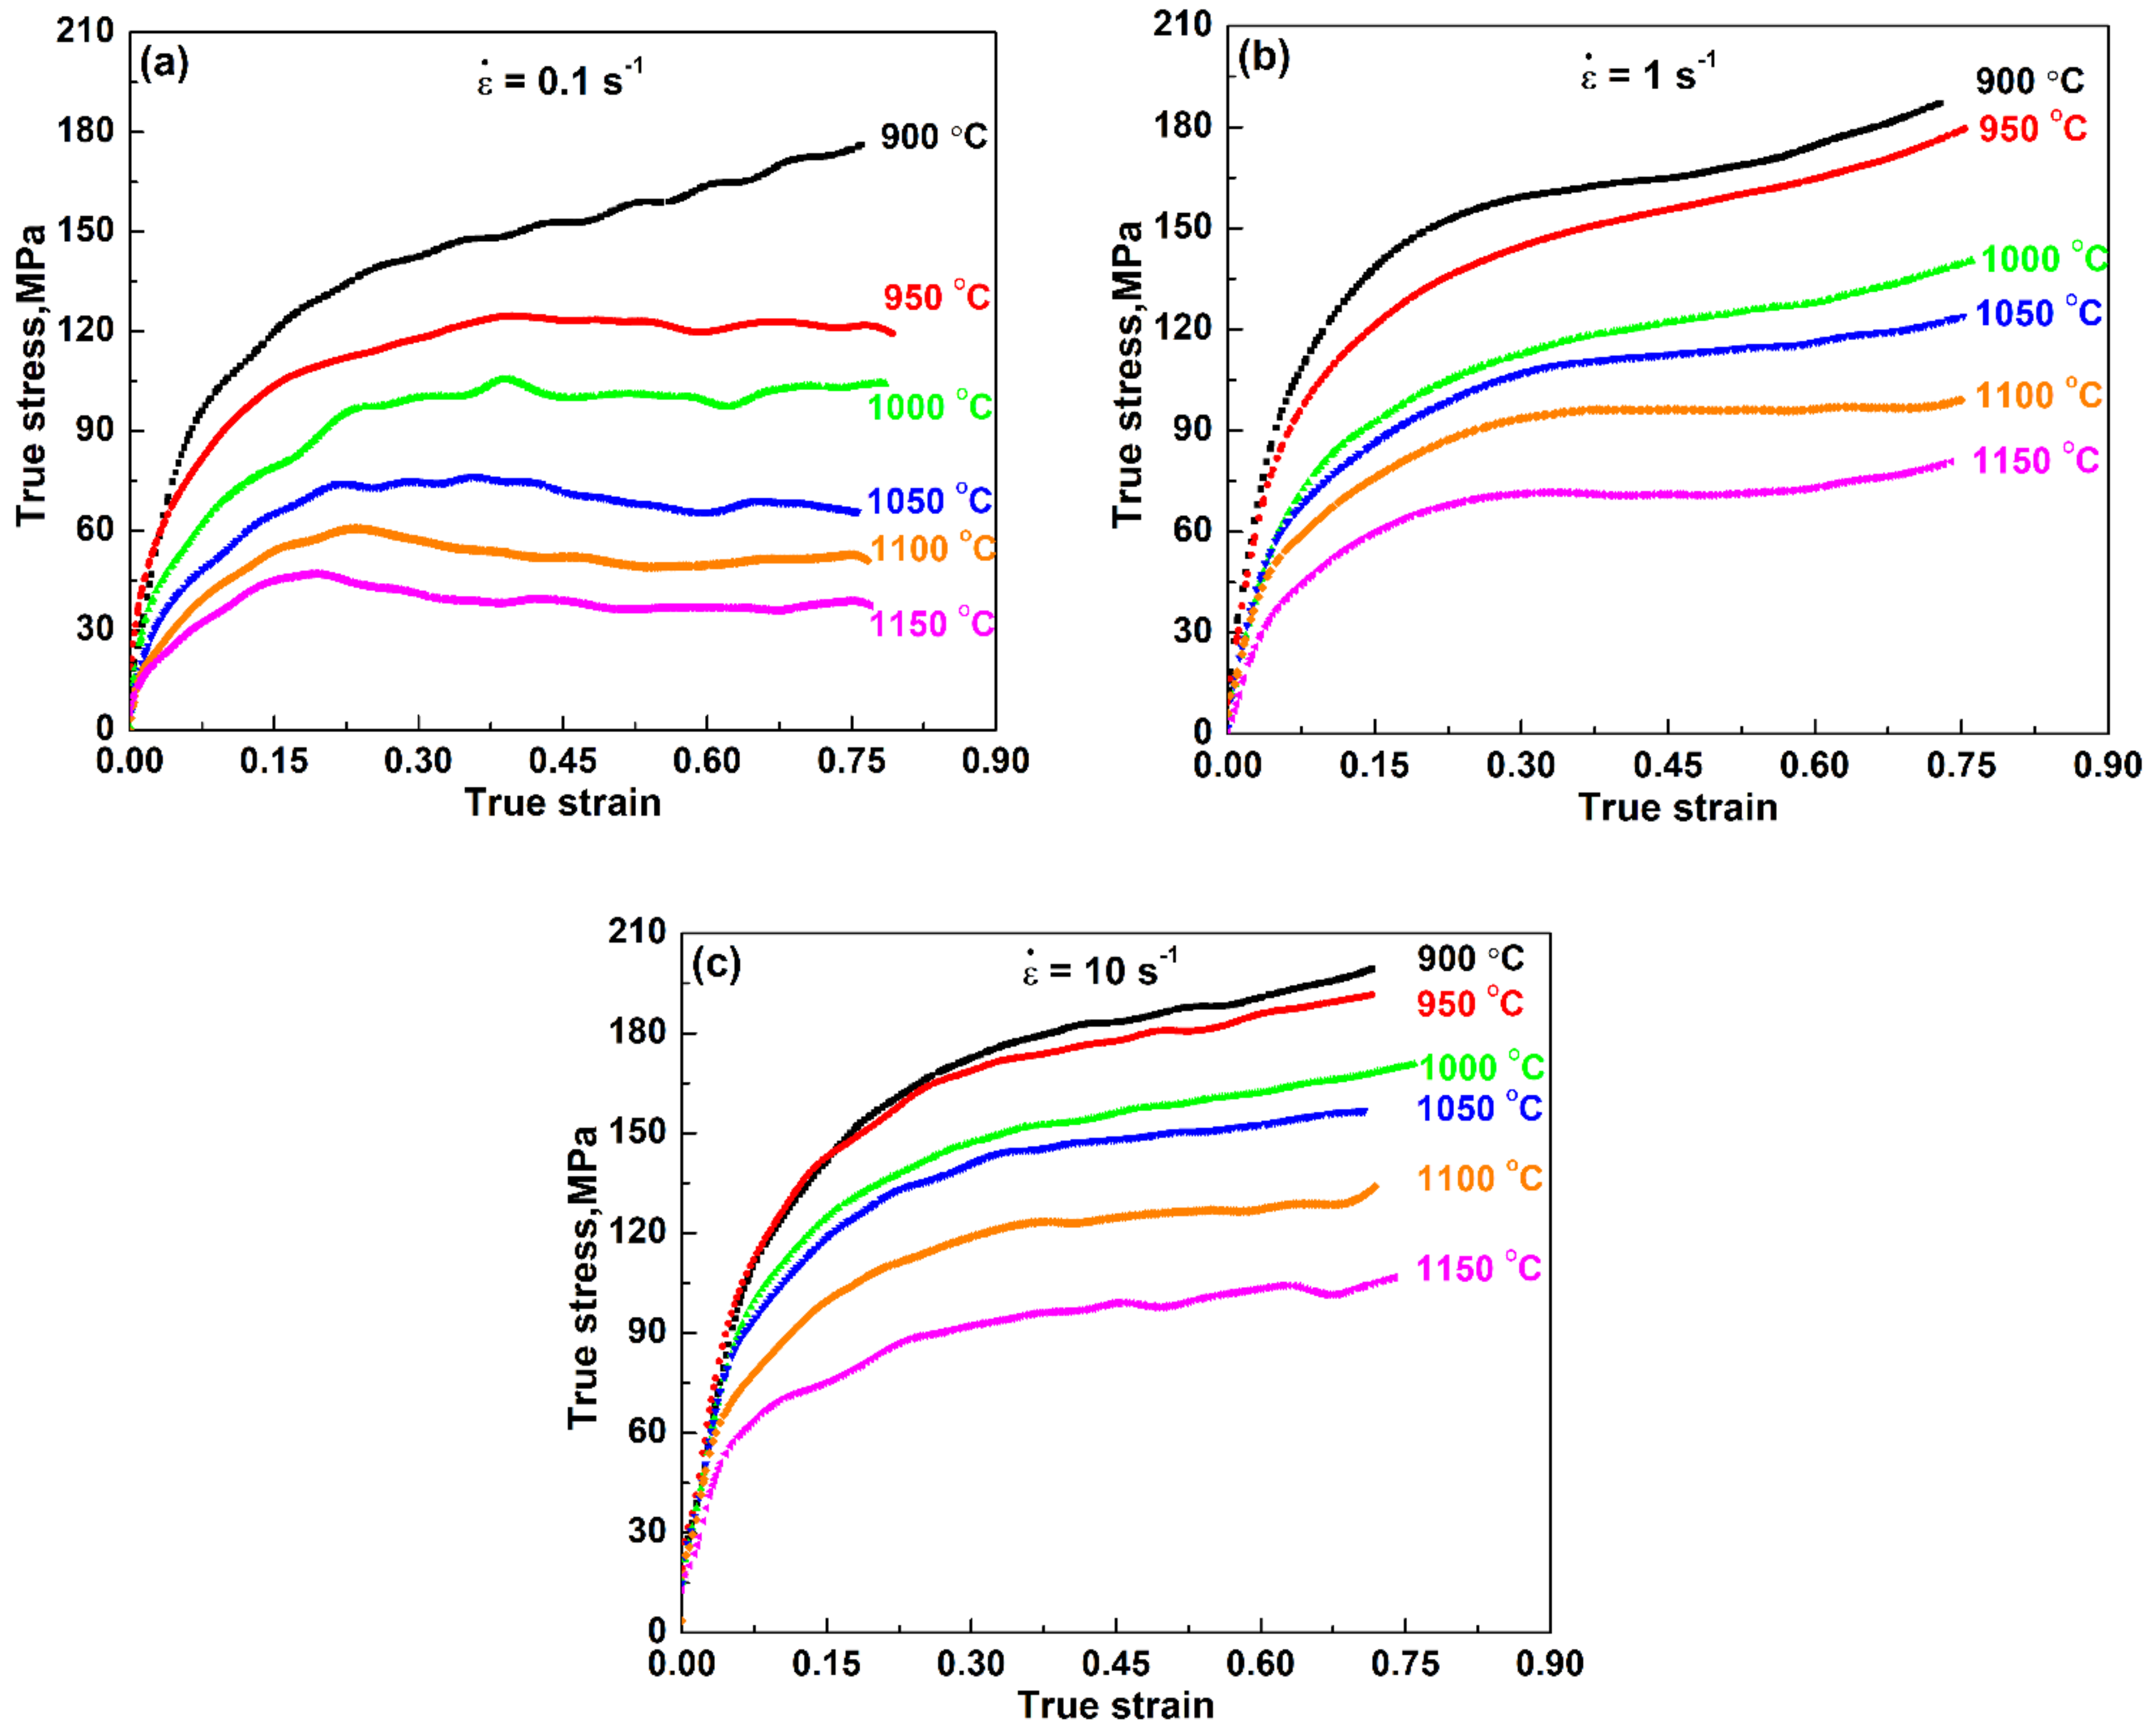
3.1. Hot Flow Behaviors

Figure 2 shows the representative true stress-strain curves obtained during hot deformation of Fe-0.04C-0.2Si-1.5Mn-0.08Ti-0.22Mo steel at temperatures of 900~1150 °C and strain rates of 0.1~10 s−1. As commonly observed, the flow stress level of experimental steel was elevated with increasing strain rate or dropping deformation temperature. In the relatively low strain rate (0.1 s−1), the flow curves were characterized by dynamic recovery (DRV) and dynamic recrystallization (DRX), except at 900 °C. Increasing strain rate was found to retard the progress of DRV or DRX, and no DRX phenomenon was observed at the stain rate of 10 s−1, irrespective of deformation temperature. The change in flow stress level with deformation temperature or strain rate was probably due to an increase in the rate of restoration processes and a decrease in the strain hardening rate [12]. The lower strain rate can provide enough time for energy accumulation, and the higher deformation temperature can accelerate the dissolution of precipitates, dislocation movement and grain boundary migration for the formation of DRX nuclei, which in turn lowered the stress level [12,13]. It is worth mentioning that the flow curves exhibited a prominent oscillation at all temperatures for the lowest strain rate of 0.1 s−1, while the oscillations were much slower with increasing strain rate. The oscillation phenomenon could be mainly attributed to the reduced accuracy and stability of sensors at the lowest strain rate of 0.1 s−1, as well as the competing effect between various deformation mechanisms [13].

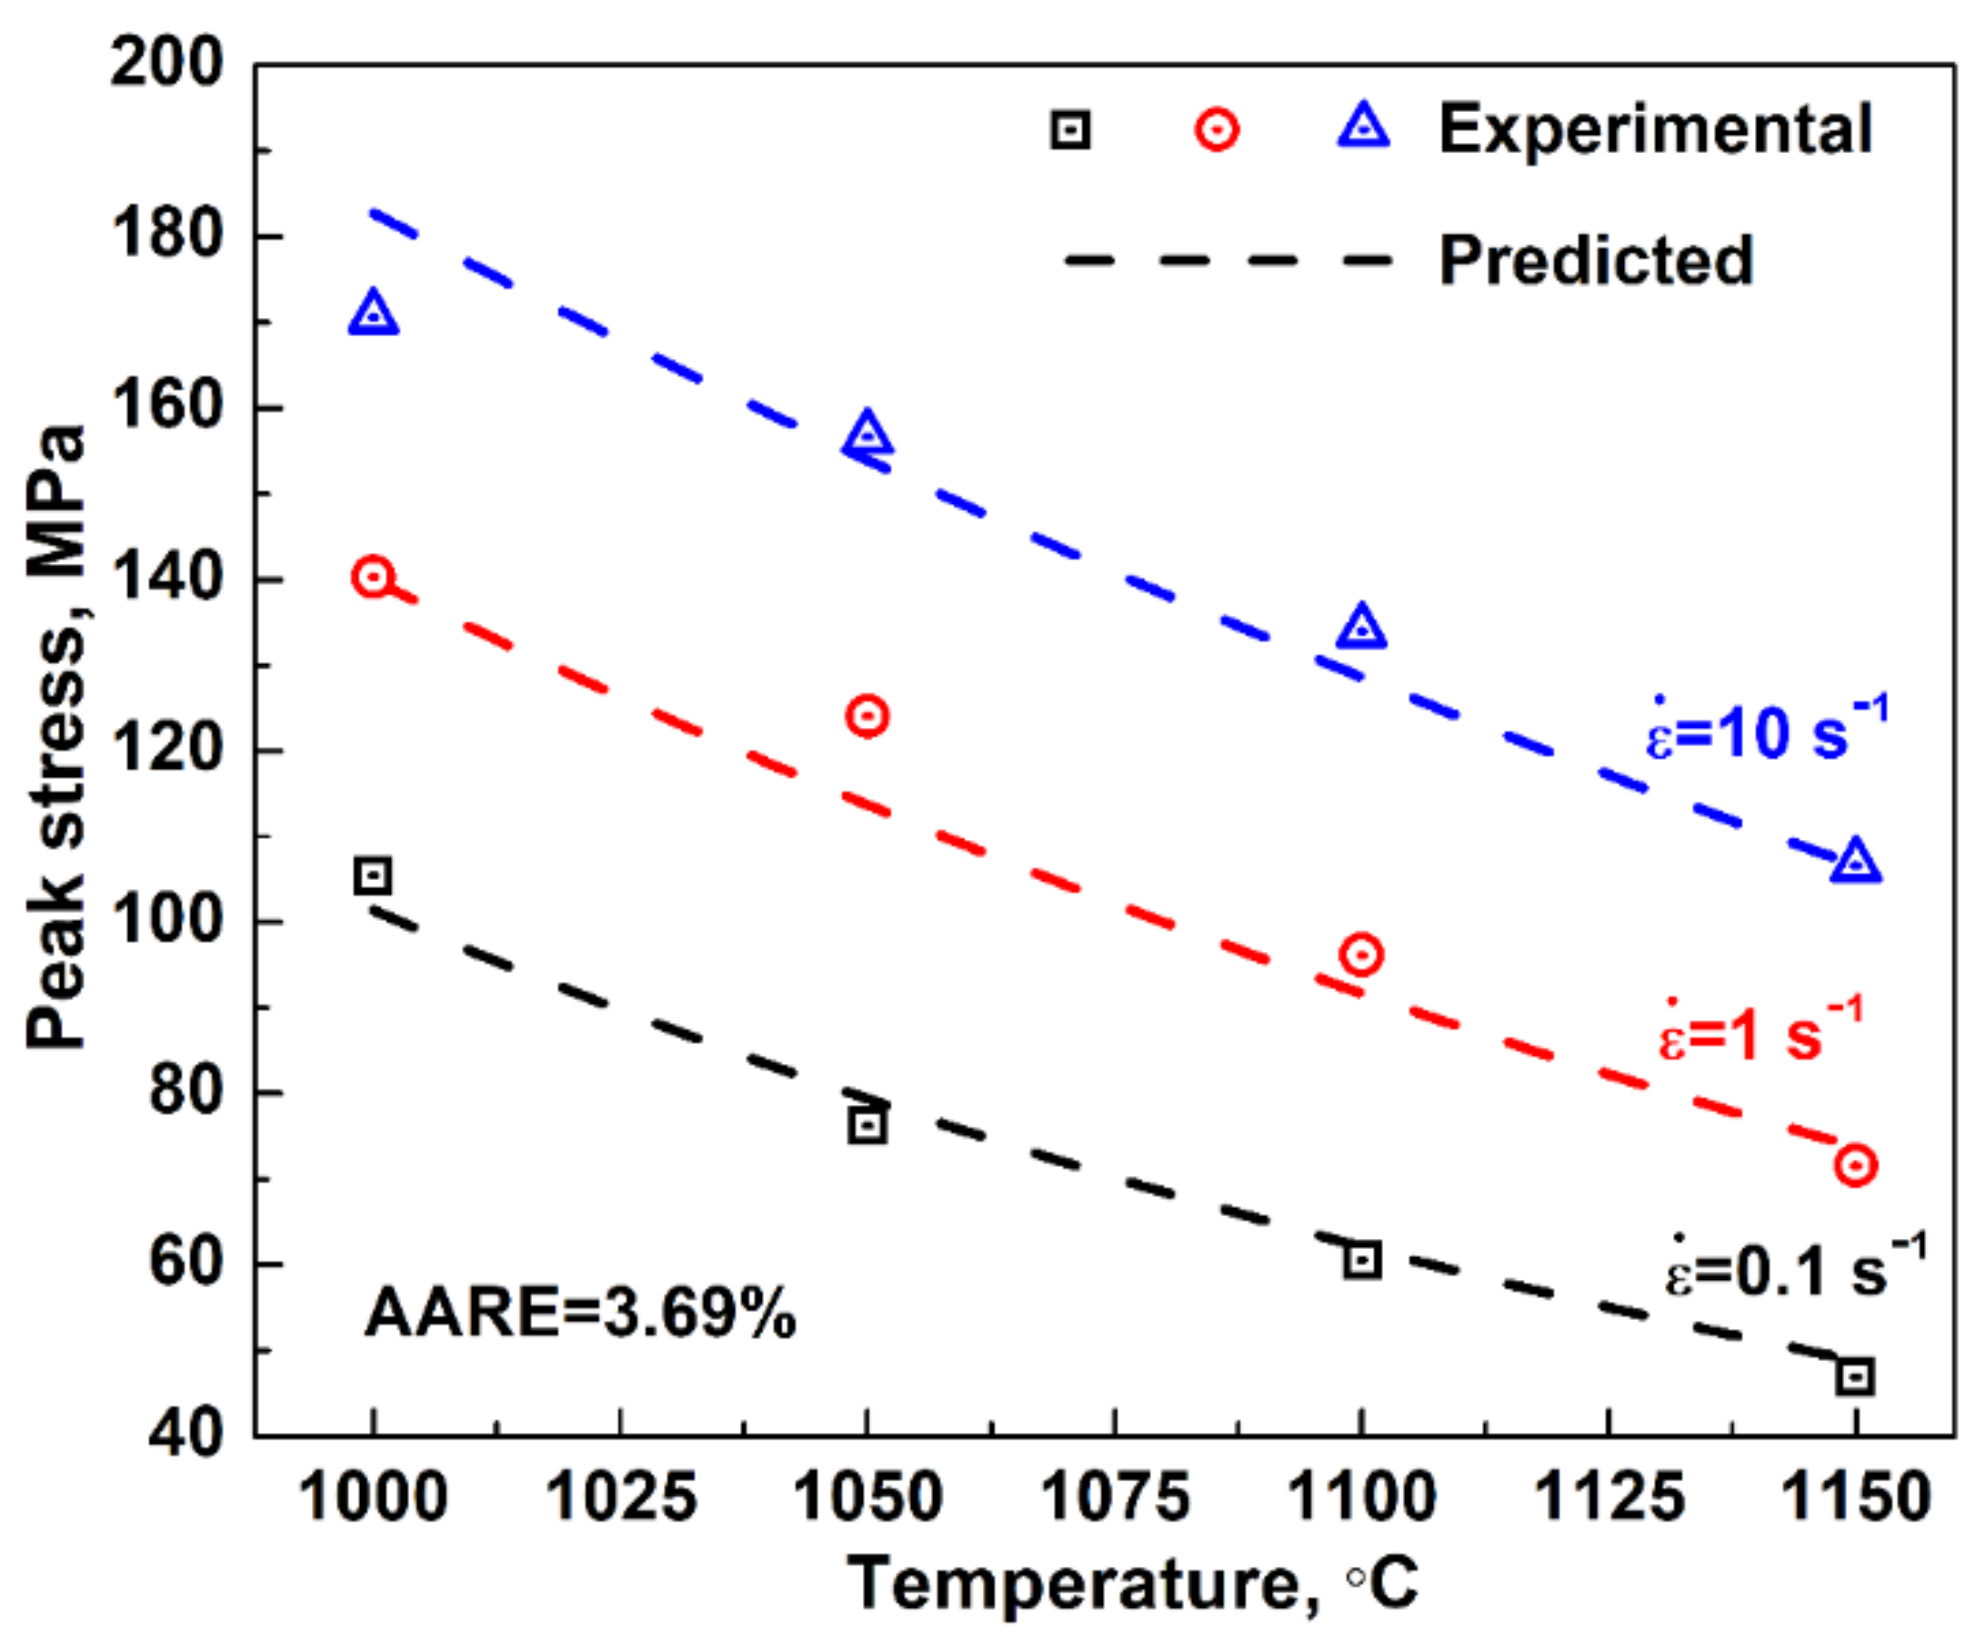
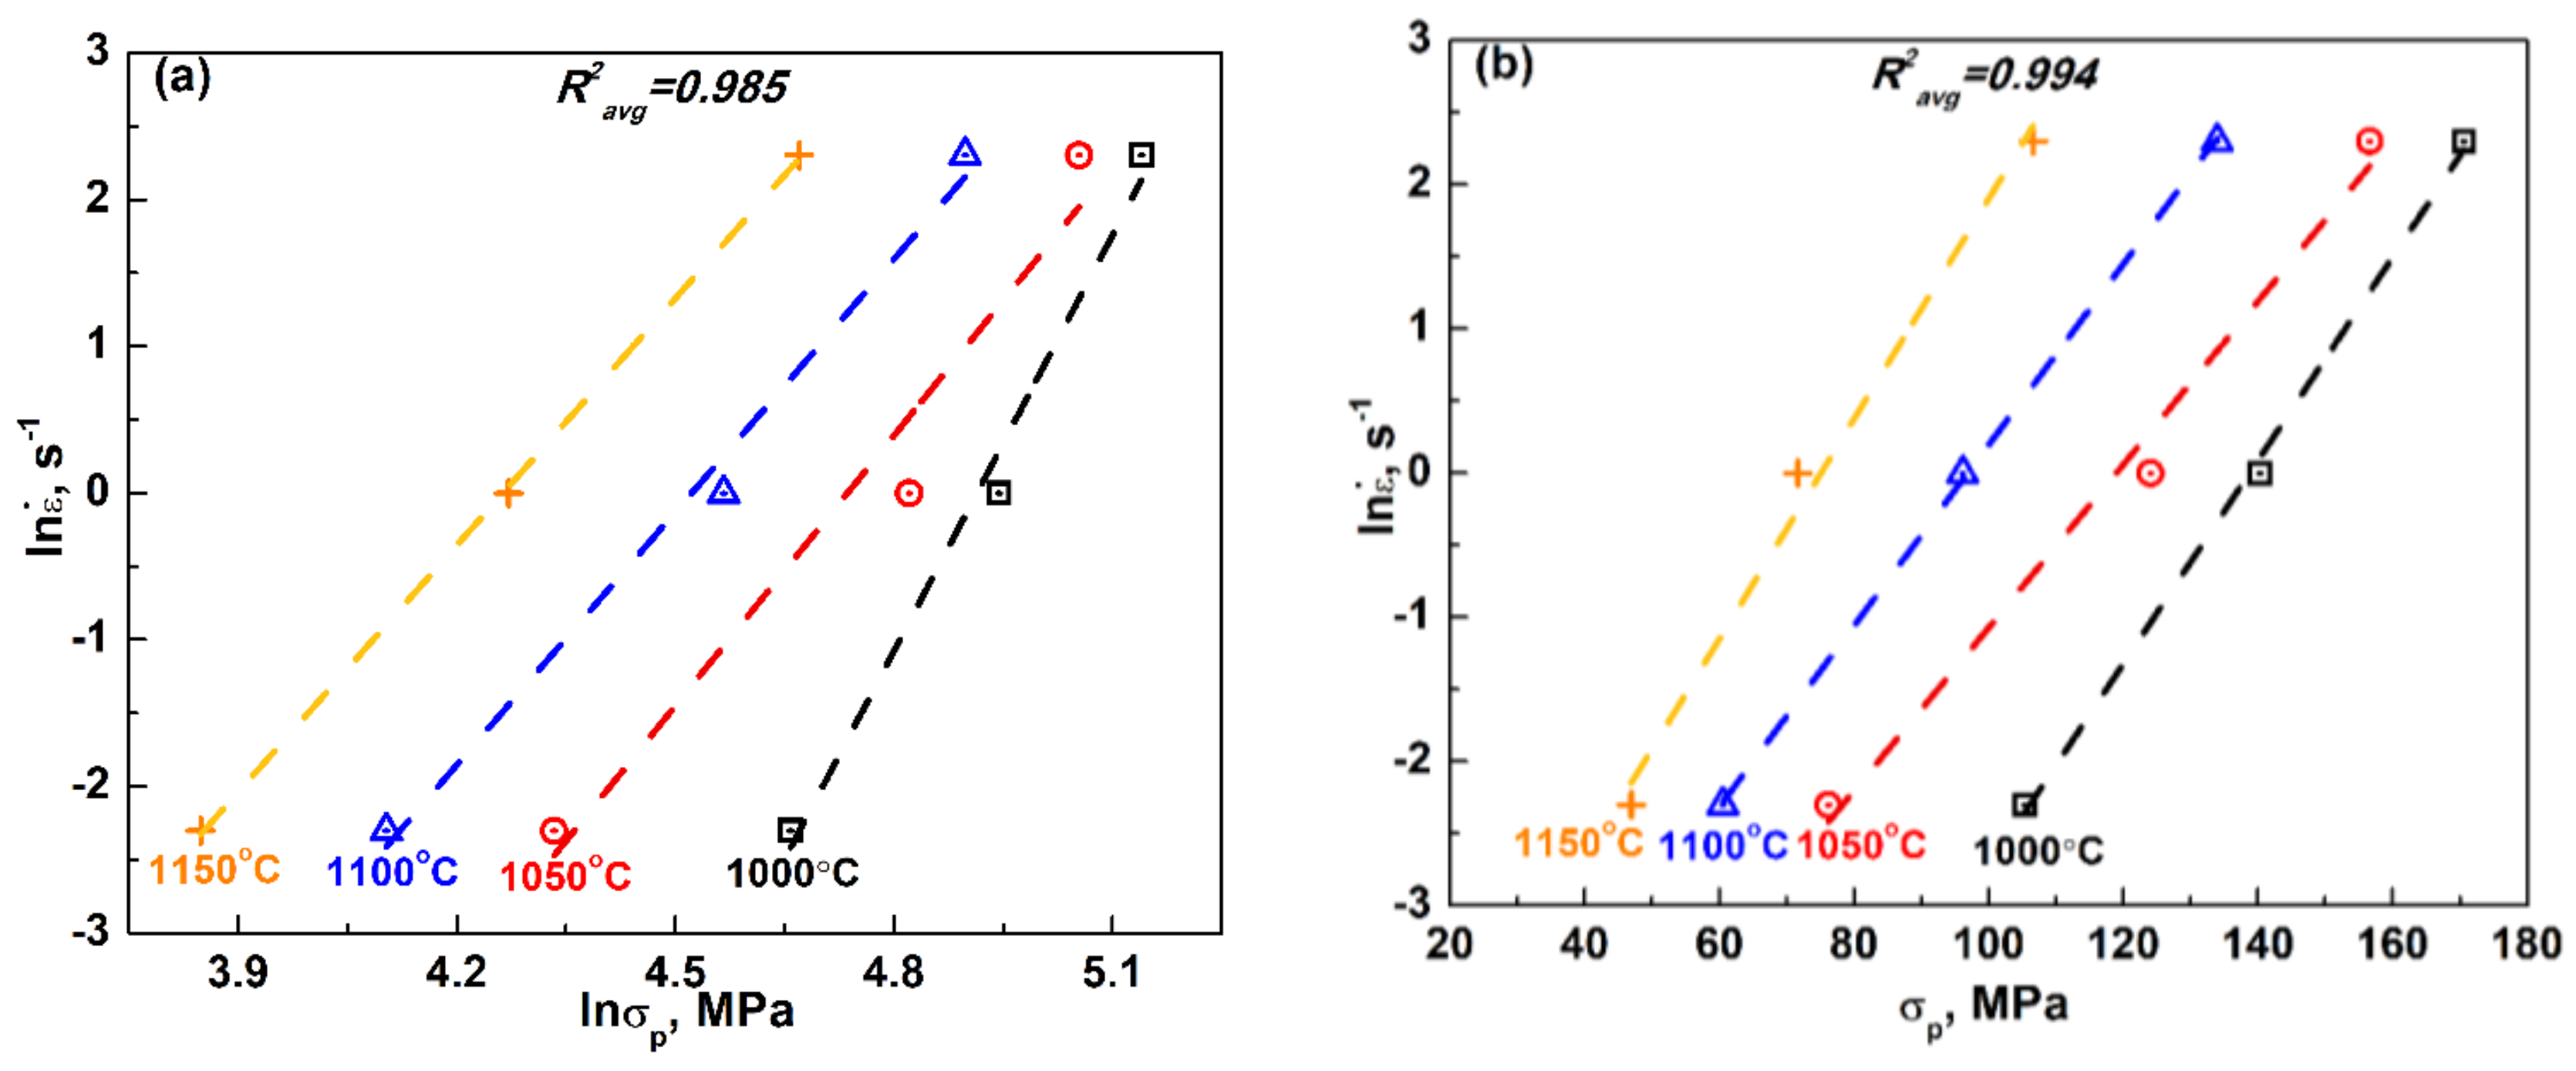
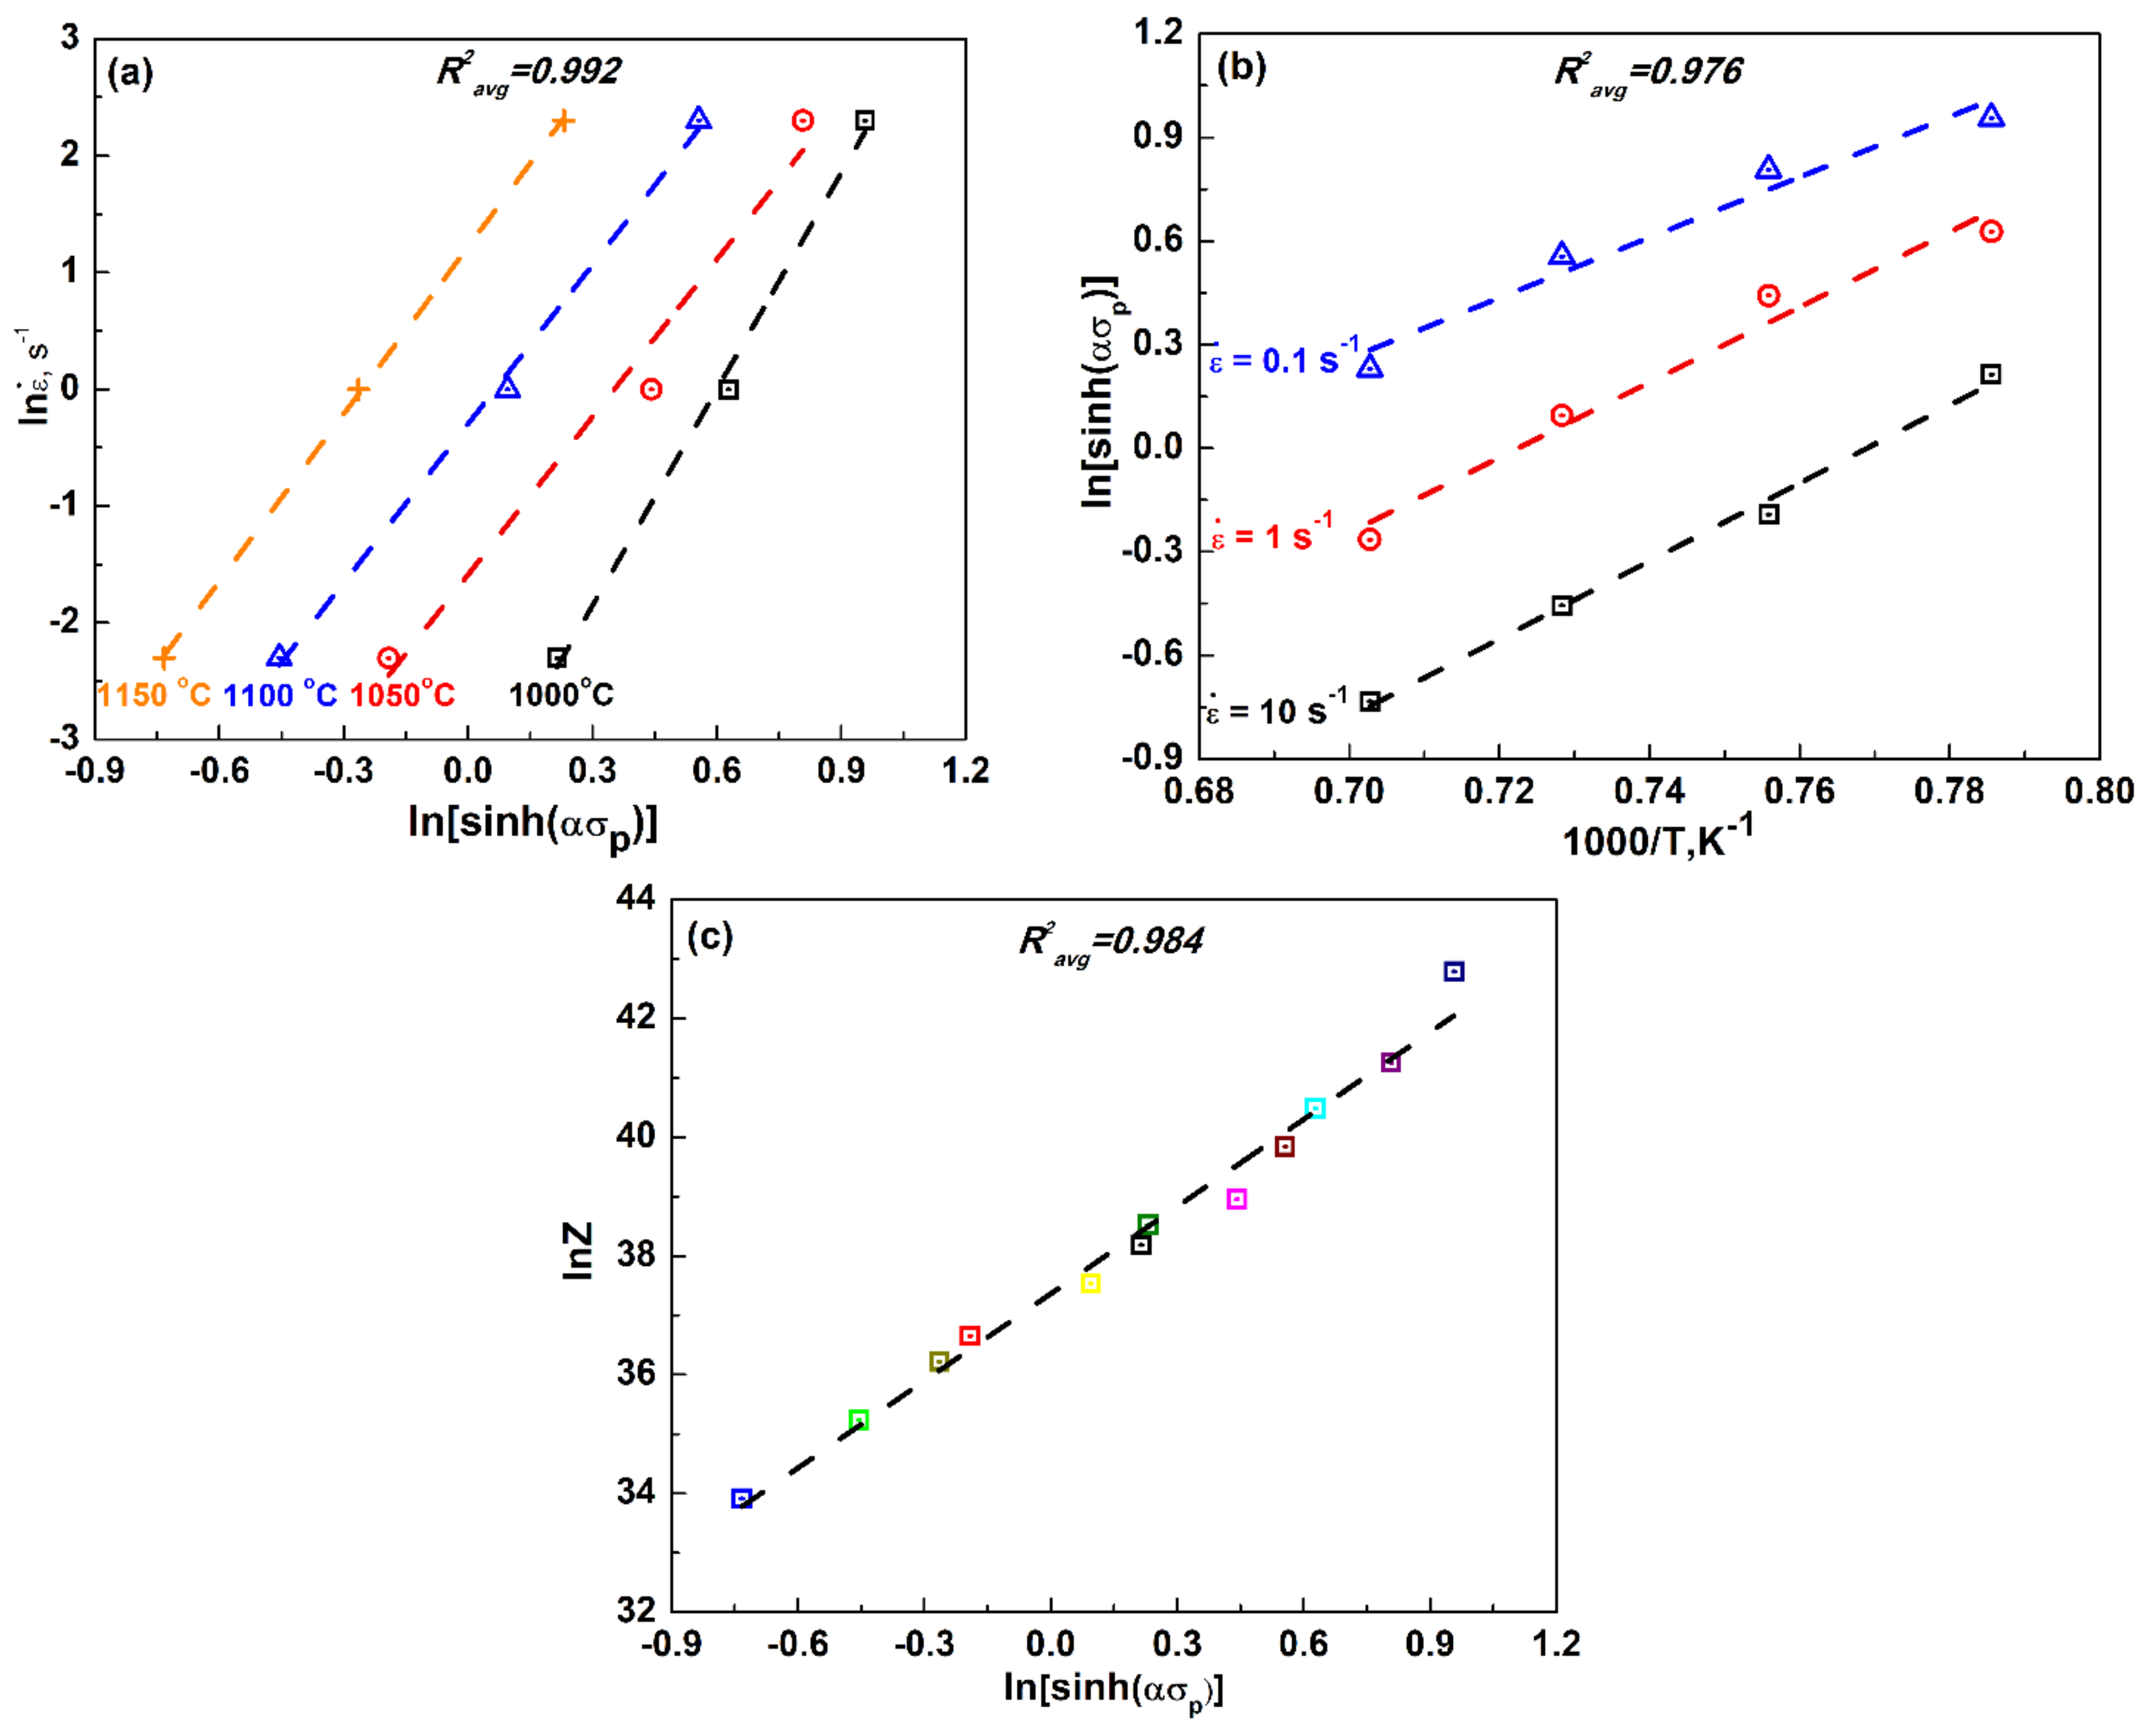
3.2. Peak Stress Analysis

In general, the peak stress was one of the most widely-accepted parameter used to find the hot working constants, especially for DRV and DRX types [14,15,16]. According to the analysis of flow curves, both DRV and DRX behaviors were found to happen in the temperature range from 1000–1150 °C for all strain rates. To elucidate the influence of deformation temperature and strain rate on the peak stress of experimental steel, a peak stress model, which was suitable for a wide range of strain rates and deformation temperatures, was expressed in the hyperbolic sine form [17].
ε = A [ sinh ( α σ p ) ] n exp ( Q / R T )
where σ p is the peak stress, ε ˙ is the strain rate, n is the stress exponent, A is a material constant, α is the stress multiplier, Q is the activation energy for hot deformation, R is the universal gas constant and T is the absolute deformation temperature.
In terms of various stress levels, Equation (1) can be simplified in the power law and exponential law:
ε = A 1 σ p n 1 exp ( Q / R T )                  ( α σ p < 0.8 )
ε = A 2 e x p ( β σ p ) exp ( Q / R T )                  ( α σ p > 1.2 )
where A1, A2, n1, β are material constants. According to the linear regression of experimental data, the values of n1 and β were determined using plots of ln ε ˙ -lnσp and ln ε ˙ -σp at each deformation temperature [18], as displayed in Figure 3. Thus, the stress multiplier is determined as α = β/n1 = 0.06653/6.736 = 0.009876.
To derive the value of n in Equation (1), plots of ln ε ˙ -ln[sinh(ασp)] at each deformation temperature are shown in Figure 4a. By linear fitting, the average value of n was approximately 5.0. Thus, the value of Q was obtained by taking the partial derivative of Equation (1) in the form of the natural logarithm.
Q = R n [ ln ( sinh ( α σ p ) ) ( 1 / T ) ] ε = R n S
where the value of S was determined as 10.31, based on the average slope of plots of ln[sinh(ασp)] − 1000/T at each strain rate (Figure 4b). The Q value of ~428.5 kJ/mol obtained here was much higher than the activation energy for self-diffusion in γ-iron (~280 kJ/mol) [19], indicating that the deformation mechanism at high temperature was not controlled by atomic diffusion.
A widespread parameter, the Zener–Hollomon (Z) parameter [20], was introduced to determine the material constant A, as expressed in Equation (5).
Z = ε exp ( Q R T )
By combining Equations (1) and (5), the following natural logarithm form was obtained:
ln Z = ln A + n ln [ sinh ( α σ p ) ]
According to the plot of lnZ-ln[sinh(ασp)] (Figure 4c), the value of A was determined as 1.69 × 10¹⁶ s−1. The detailed fit parameters associated with the peak stress model for both steels are summarized in Table 2. The correlation coefficients (R2) of all fit parameters were beyond 0.984, implying a desirable fit to experimental data.
By substituting the fit parameters into Equation (1), the σ p as a function of deformation temperature and strain rate can be expressed as:
ε = 1.69 × 10 16 ( sinh 0 . 009876 σ p ) 5 exp ( 428500 / R T )
When introducing the Z parameter into Equation (7), the σ p can be also obtained in the following form.
{ Z = ε exp ( 428500 R T ) σ p = 1 0 . 009876 ln { ( Z 1.69 × 10 16 ) 1 / 5 + [ ( Z 1.69 × 10 16 ) 2 / 5 + 1 ] 1 / 2 }
The experimental peak stresses were compared with those predicted using the constitutive Equation (8) under different deformation conditions, see Figure 5. The validity of the σ p model was further examined by an average absolute relative error (AARE):
AARE   = 1 N i = 1 N | E i P i E i | × 100 %
where Ei is experimental data, Pi is the predicted value and N is the number of fit data used in this study. The AARE value was about 3.69%, reflecting the accurate estimation of peak stress. The satisfactory agreement between the predicted and experimental data suggests that the constitutive equations we proposed herein gave an accurate prediction of flow stress during hot deformation.

3.3. Physically-Based Constitutive Analysis

In general, the dislocation density increased with strain during hot deformation, leading to work hardening (WH) or the DRV phenomenon. Regarding the flow curves of WH and DRV, the dislocation density (ρ)-based flow stress model proposed by Bergstrom [21] was used in this study as follows:
σ = σ 0 + M μ b ρ d ρ d ε = U Ω ρ
where σ 0 is the lattice friction stress, M is a dislocation strengthening constant, μ is the shear modulus, b is the burgers vector, U is the hardening parameter and Ω is the softening parameter. The value of M ranged from 0.88–0.9 [22], and the b value was taken as 2.5 × 10⁻¹⁰ m [6]. The value of μ varied from 43.5–48.4 GPa at temperatures of 900–1150 °C by extrapolating from the experimental data from the literature [23]. Thus, the values of σ 0 , U, Ω could be obtained based on the present experiment data.
After the onset of DRX, the hot flow behavior of Ti-Mo steel was described, based on the Kolmogorov–Johnson–Mehl–Avrami (KJMA) softening model as follows [24,25]:
σ = σ p X ( σ p σ R e x ) X = 1 exp ( k t n A )
where σ R e x is the steady state stress after DRX, X is the recrystallized volume fraction, k is a material constant and nA is Avrami’s exponent. Thus, the flow behavior of Ti-Mo steel involving DRX was modeled by the coupling of the Bergstrom and KJMA’s models. The former was used to model the flow stress before reaching peak stress; whereas the later for that after the onset of DRX. All undetermined parameters in Equations (10) and (11) can be obtained based on the MATLAB programing.
To verify the accuracy of the developed models, the predicted and experimental flow curves under different deformation conditions were compared, as plotted in Figure 6. According to Equation (9), the accurate estimation of flow stress using the Bergstrom and KJMA models was about 1.68%, which reflected a satisfactory agreement between the predicted and experimental data. In contrast, the combined Bergstrom and KJMA models could precisely predict the whole hot deformation behaviors of Ti-Mo steel involving DRX (Figure 6a).
Meanwhile, several important parameters such as U, Ω and nA were utilized to compare the variations in hot deformation behavior of Ti-Mo steel as a function of the Z parameter. From Figure 7, the U value was found to exhibit an approximately positive linear relationship with lnZ (Figure 7a). An increase in the Z value corresponded to the larger strain rate or the lower deformation temperature, implying more effective work hardening. On the contrary, the Ω value dropped with increasing Z value (Figure 7b). Furthermore, the peak dislocation density (ρp) exhibited a similar tendency with the U (Figure 7c), due to the proportional relationship between these two parameters.
Additionally, the values of the Avrami exponent, nA, were found to vary between 1.2 and 2.1 with lnZ, as presented in Figure 7d, which was comparable with those values reported in previous studies [11,26]. The variation in nA indicated different mechanisms of DRX. In the lower Z region, the nA value was close to one, suggesting a larger probability of nucleation sites on the interfacial surface of grain and twin boundaries. In the larger Z region, however, the nA value reached ~2, implying that nucleation of DRX happened on the grain and twin edges [27].

3.4. Experimental Verification and Mechanism Analysis

To analyze the influence of hot deformation on the microstructural features of Ti-Mo steel, both OM and EBSD were employed to study the deformed specimens. When the specimen was deformed at 900 °C to a strain of 0.8 at 0.1 s−1, the severely pancaked prior austenitic grains were observed (Figure 8a), implying that WH was the dominant deformation mechanism. Furthermore, the fresh ferrite formed at the prior grain boundaries (inset of Figure 8a), which suggests that the strain-induced ferrite (SIF) occurred due to the lower deformation temperature, just above the Ar3 temperature (~858.1 °C). With increasing deformation temperature to 1150 °C at 0.1 s−1, the fully-equiaxed grains were observed (see the black lines in Figure 8b), indicating that the hot deformation of Ti-Mo steel was mainly controlled by DRX. This was in agreement with the continuous softening mechanism observed on the flow curves in Figure 2a. Accordingly, the formation of new equiaxed grains was mainly associated with the rearrangement or annihilation of dislocations [28,29]. Meanwhile, further straining was accompanied by an acceleration of the transformation of low to high angle grain boundaries resulting from the recovery-assisted absorption of dislocations in the existing sub-boundaries. The whole microstructural evolution upon straining at 1150 °C and 0.1 s−1 is schematically illustrated in Figure 8d as well.
However, at the higher stain rate of 10 s−1 and deformation temperature of 1150 °C, some deformation bands and substructures were still observed in the large pancaked prior austenite grains (Figure 8c). This suggests that DRV played an important role during hot compression in the high strain rate domain (e.g., 10 s−1) at higher temperatures, which was also in accordance with the steady flow stress with strain in Figure 2c. As schematically displayed in Figure 8d, the new grain evolution involved the development of strain-induced HAGBs resulting from an increase in the misorientations of individual LAGBs and progressive subgrain rotation [30,31] upon further straining.
The change in boundary misorientation angle as a function of deformation temperature and strain rate is displayed in Figure 9. In EBSD analysis, the number of high angle austenitic/martensitic boundaries was distinguished, in view of the variation between their crystal orientations. When deformation was performed at 900 °C and 0.1 s−1, a large number of low-angle subgrain boundaries of 2–5° (>40%) was observed inside the deformed grains (Figure 9a). As the deformation temperature increased to 1150 °C at the same strain rate of 0.1 s−1, the fraction of LAGBs of 2–5° dramatically dropped by ~33.6% with a number of high angle austenitic grain boundaries (~46.2%), implying the occurrence of a pronounced DRX [32]. Consequently, the DRX was accelerated, and the flow stress was greatly reduced due to the decreased density dislocation, which corresponded to Figure 2a and Figure 8b. Having deformed at higher strain rates (e.g., 10 s−1) and 1150 °C, the fraction of high angle austenitic grain boundaries was reduced to ~29.7% with a higher fraction of LAGBs of 2–5° (~37.5%), implying that the DRX process was impeded and that the flow stress increased, owing to the accumulating strain and hardening substructure, which correspond to the flow curves in Figure 2c and Figure 8c.
The present study demonstrates that a combination of Bergstrom and KJMA models, which we proposed herein, could be used to predict the whole flow behaviors of the interphase-precipitated microalloyed steels under various hot deformation conditions, involving DRX. By comparing the characteristic stresses and material parameters over all deformation conditions, especially at the higher strain rates studied, the dependence of hot flow behavior on strain rate and deformation temperature was further clarified. Therefore, the constitutive model may provide a powerful tool for optimizing the hot working processes of high performance Ti-Mo steels with interphase precipitation.

4. Conclusions

The hot flow behaviors of an interphase-precipitated Ti-Mo steel were investigated by conducting a series of hot compression tests at higher strain rates of 0.1~10 s−1 and temperatures of 900~1150 °C on a Gleeble-2000 thermo-mechanical simulator. The main conclusions involved:
(1)
The peak stress as a function of deformation temperature and strain rate was determined as:
ε = 1.69 × 10 16 ( sinh 0 . 009876 σ p ) 5 exp ( 428500 / R T )
(2)
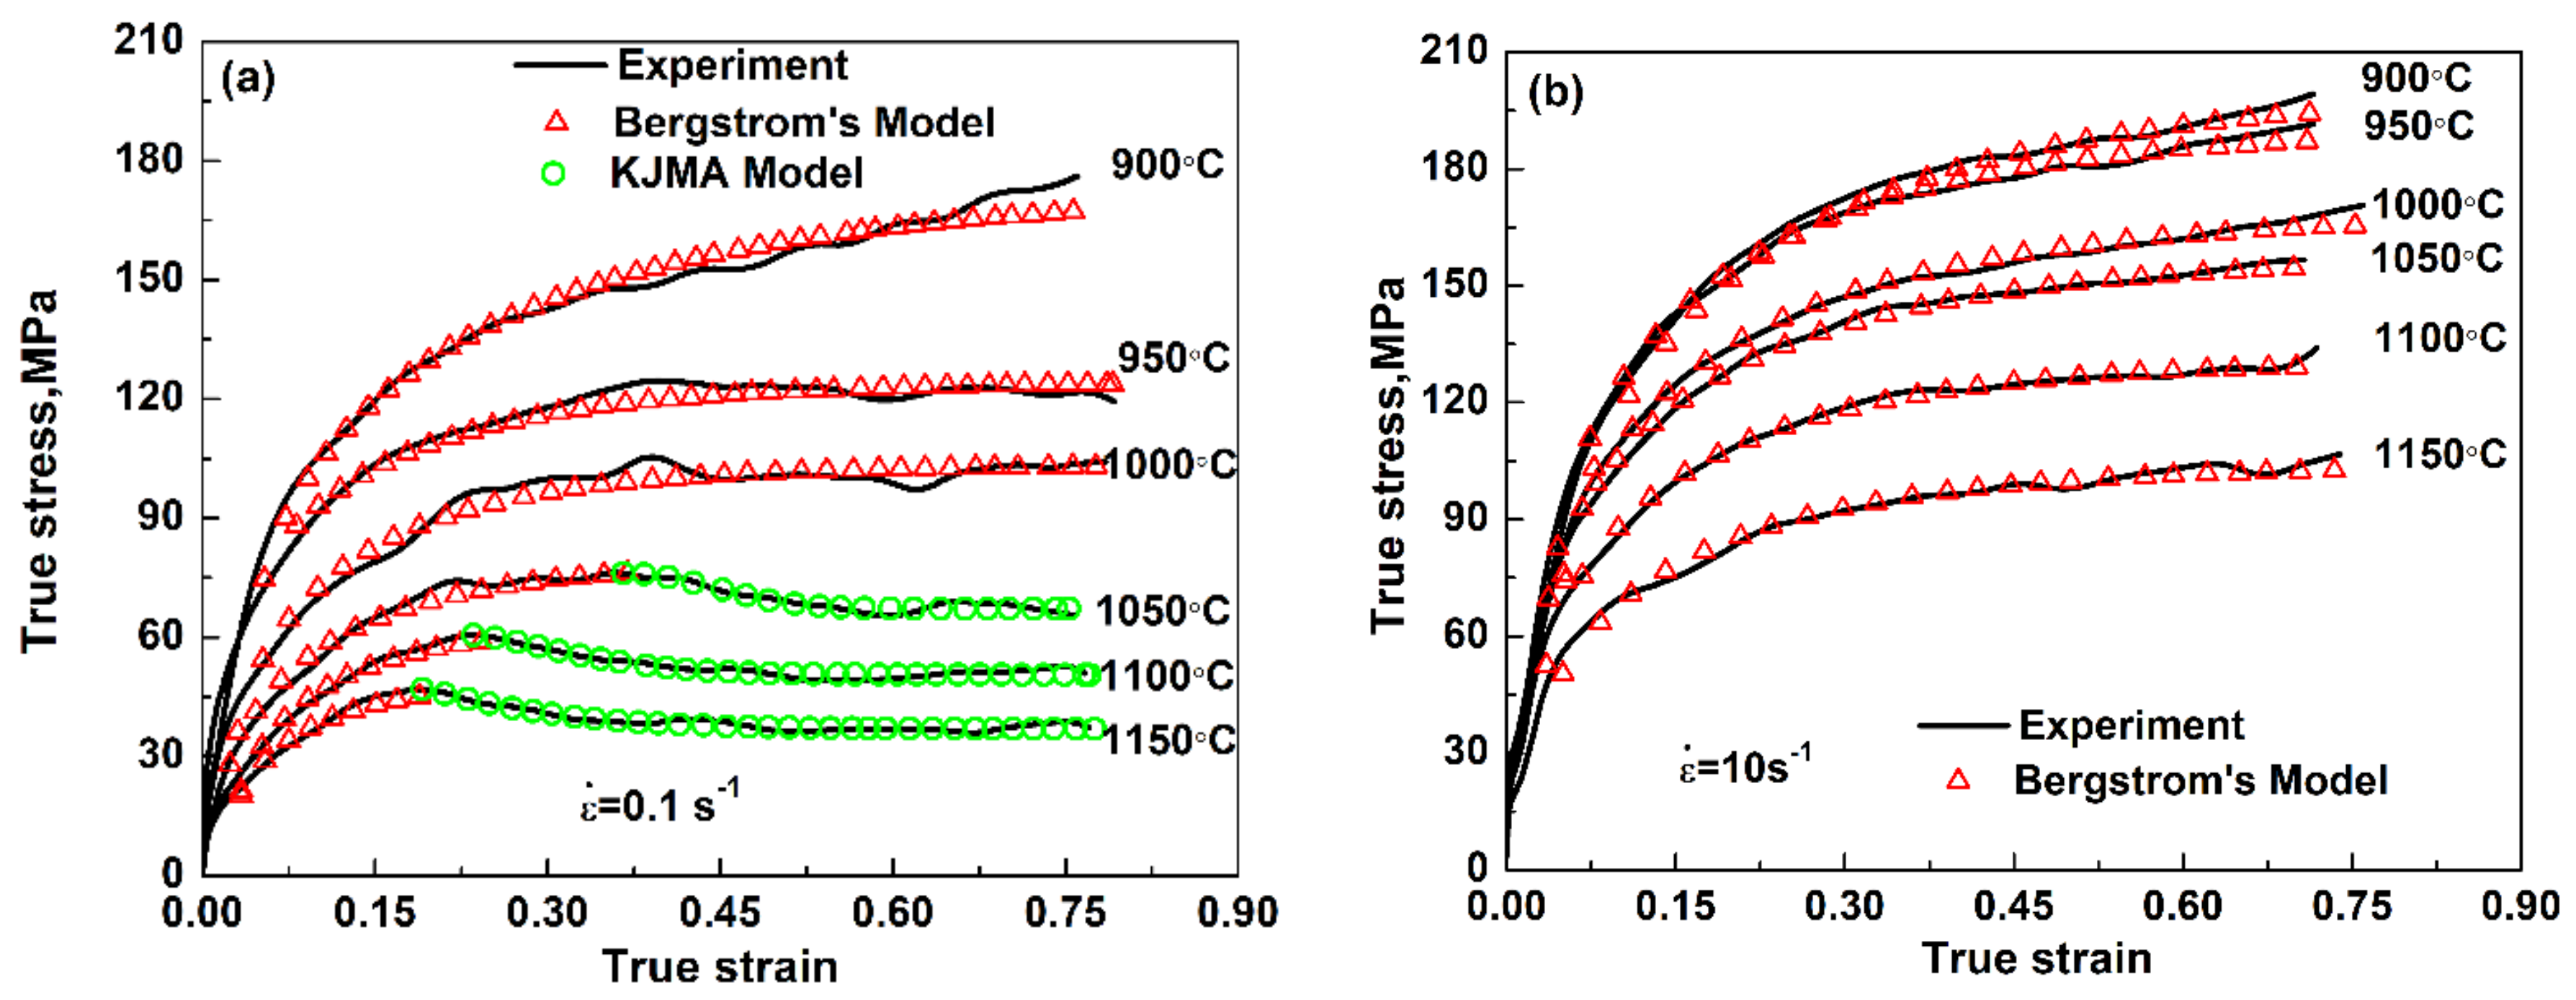
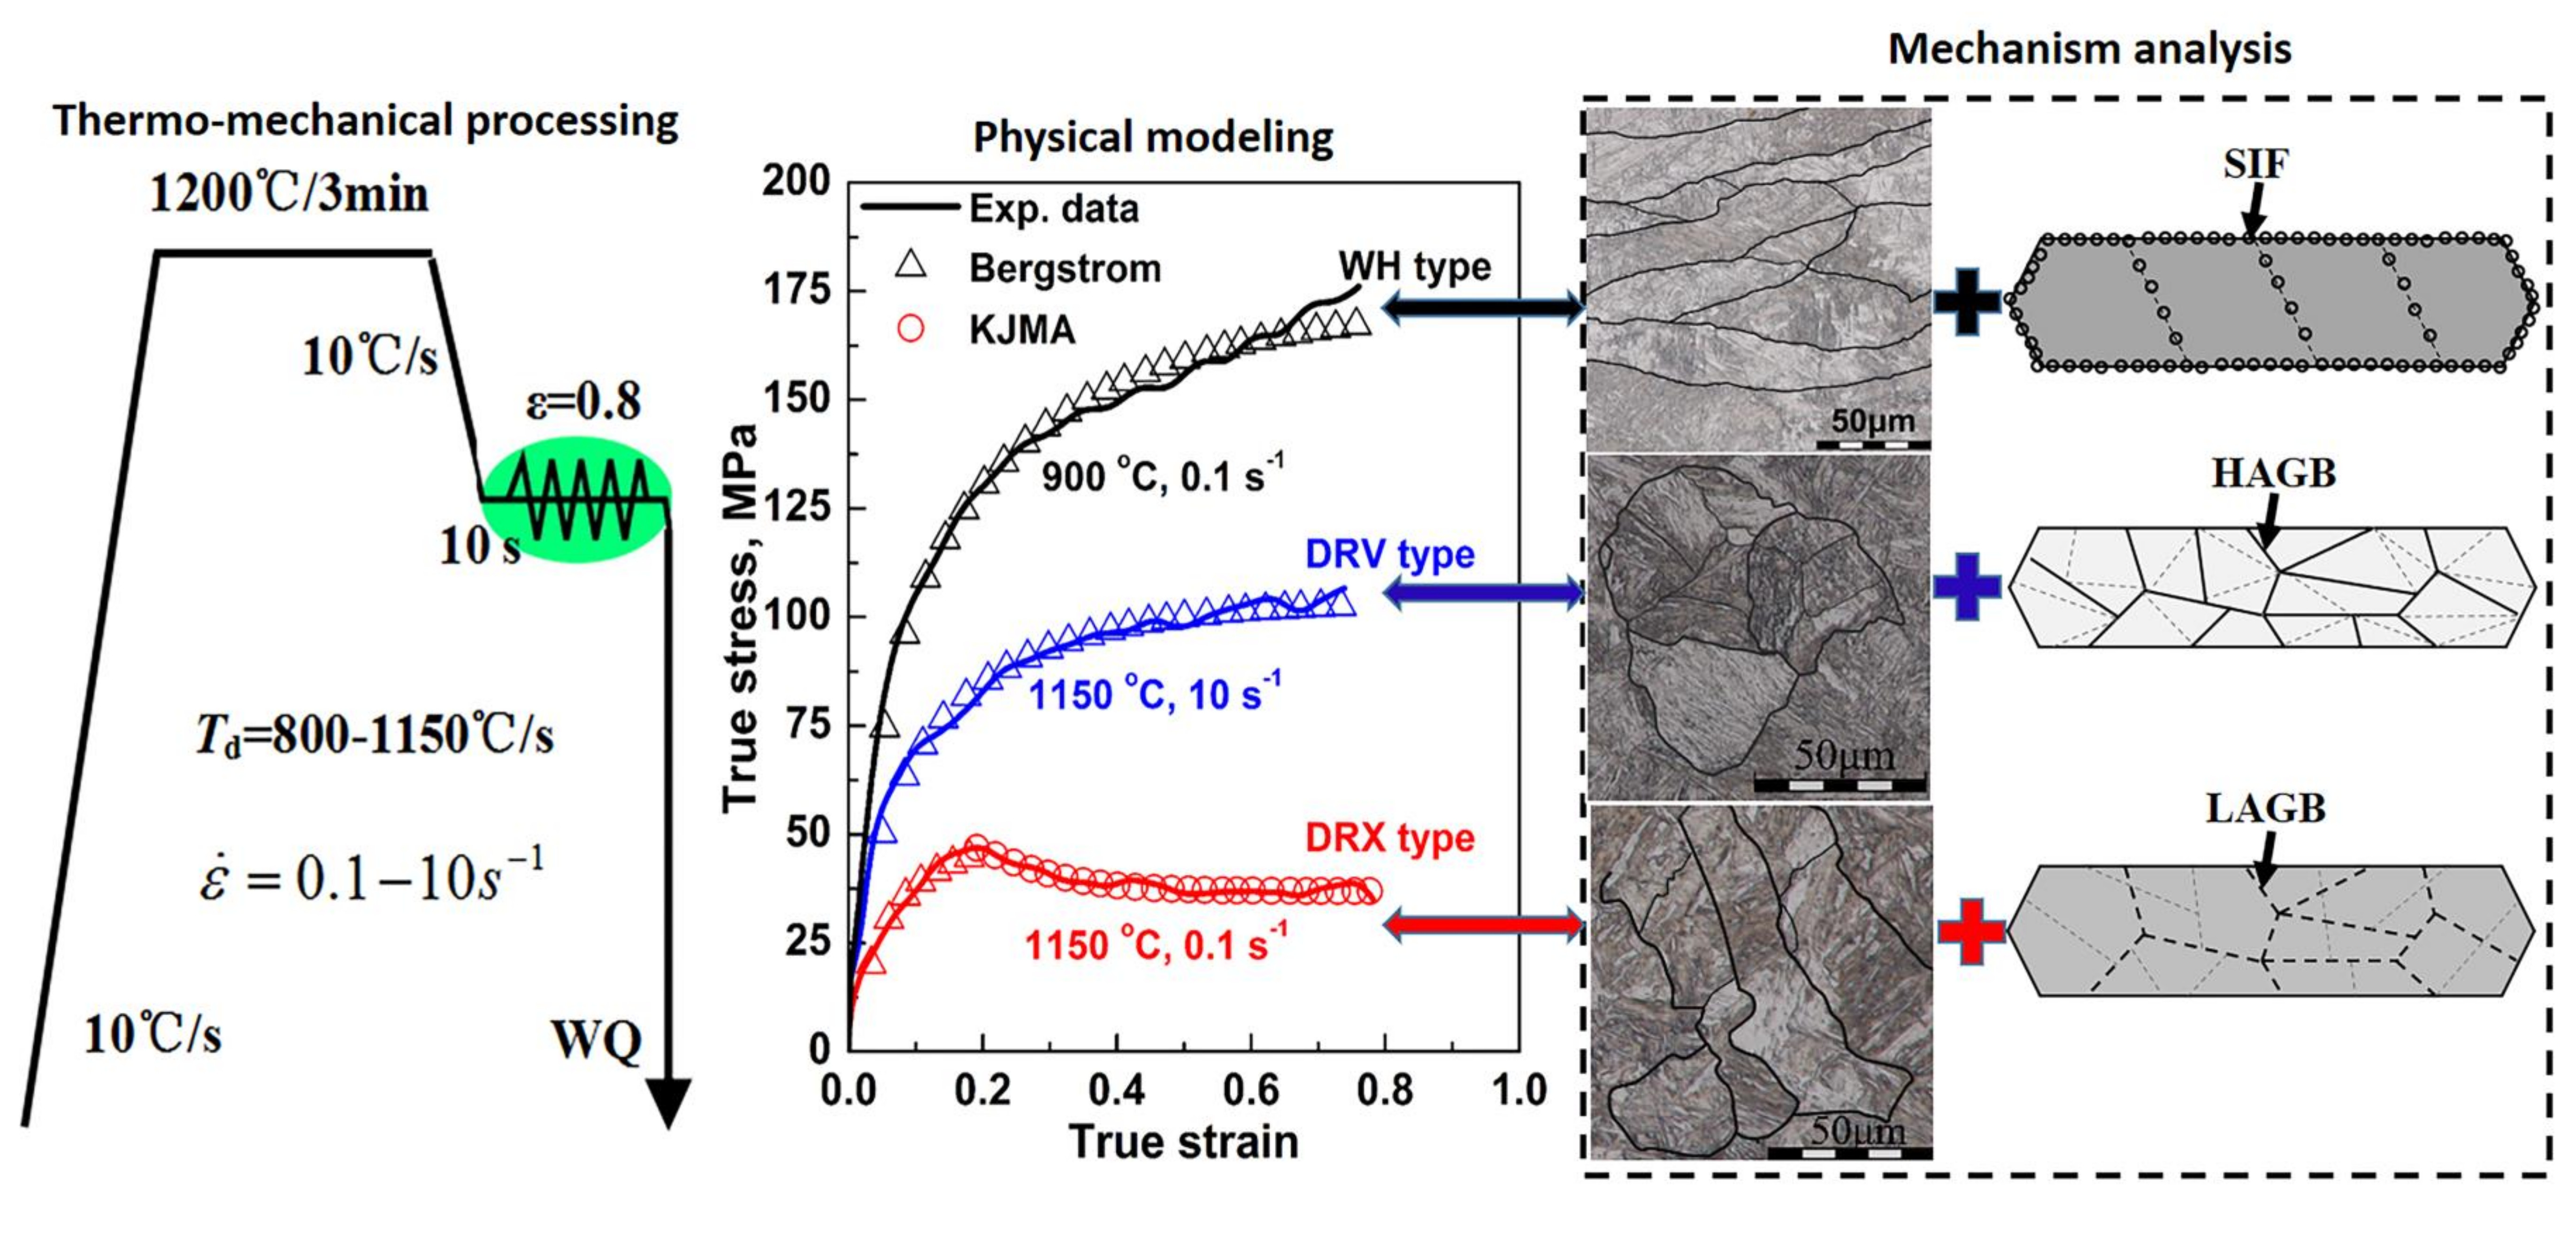
Under conditions where DRV or WH was dominant, the hot flow behavior could be modeled using the Bergstrom equation; once DRX was initiated, the coupling of the Bergstrom and KJMA’s models was capable of predicting the flow behaviors in the whole hot deformation.
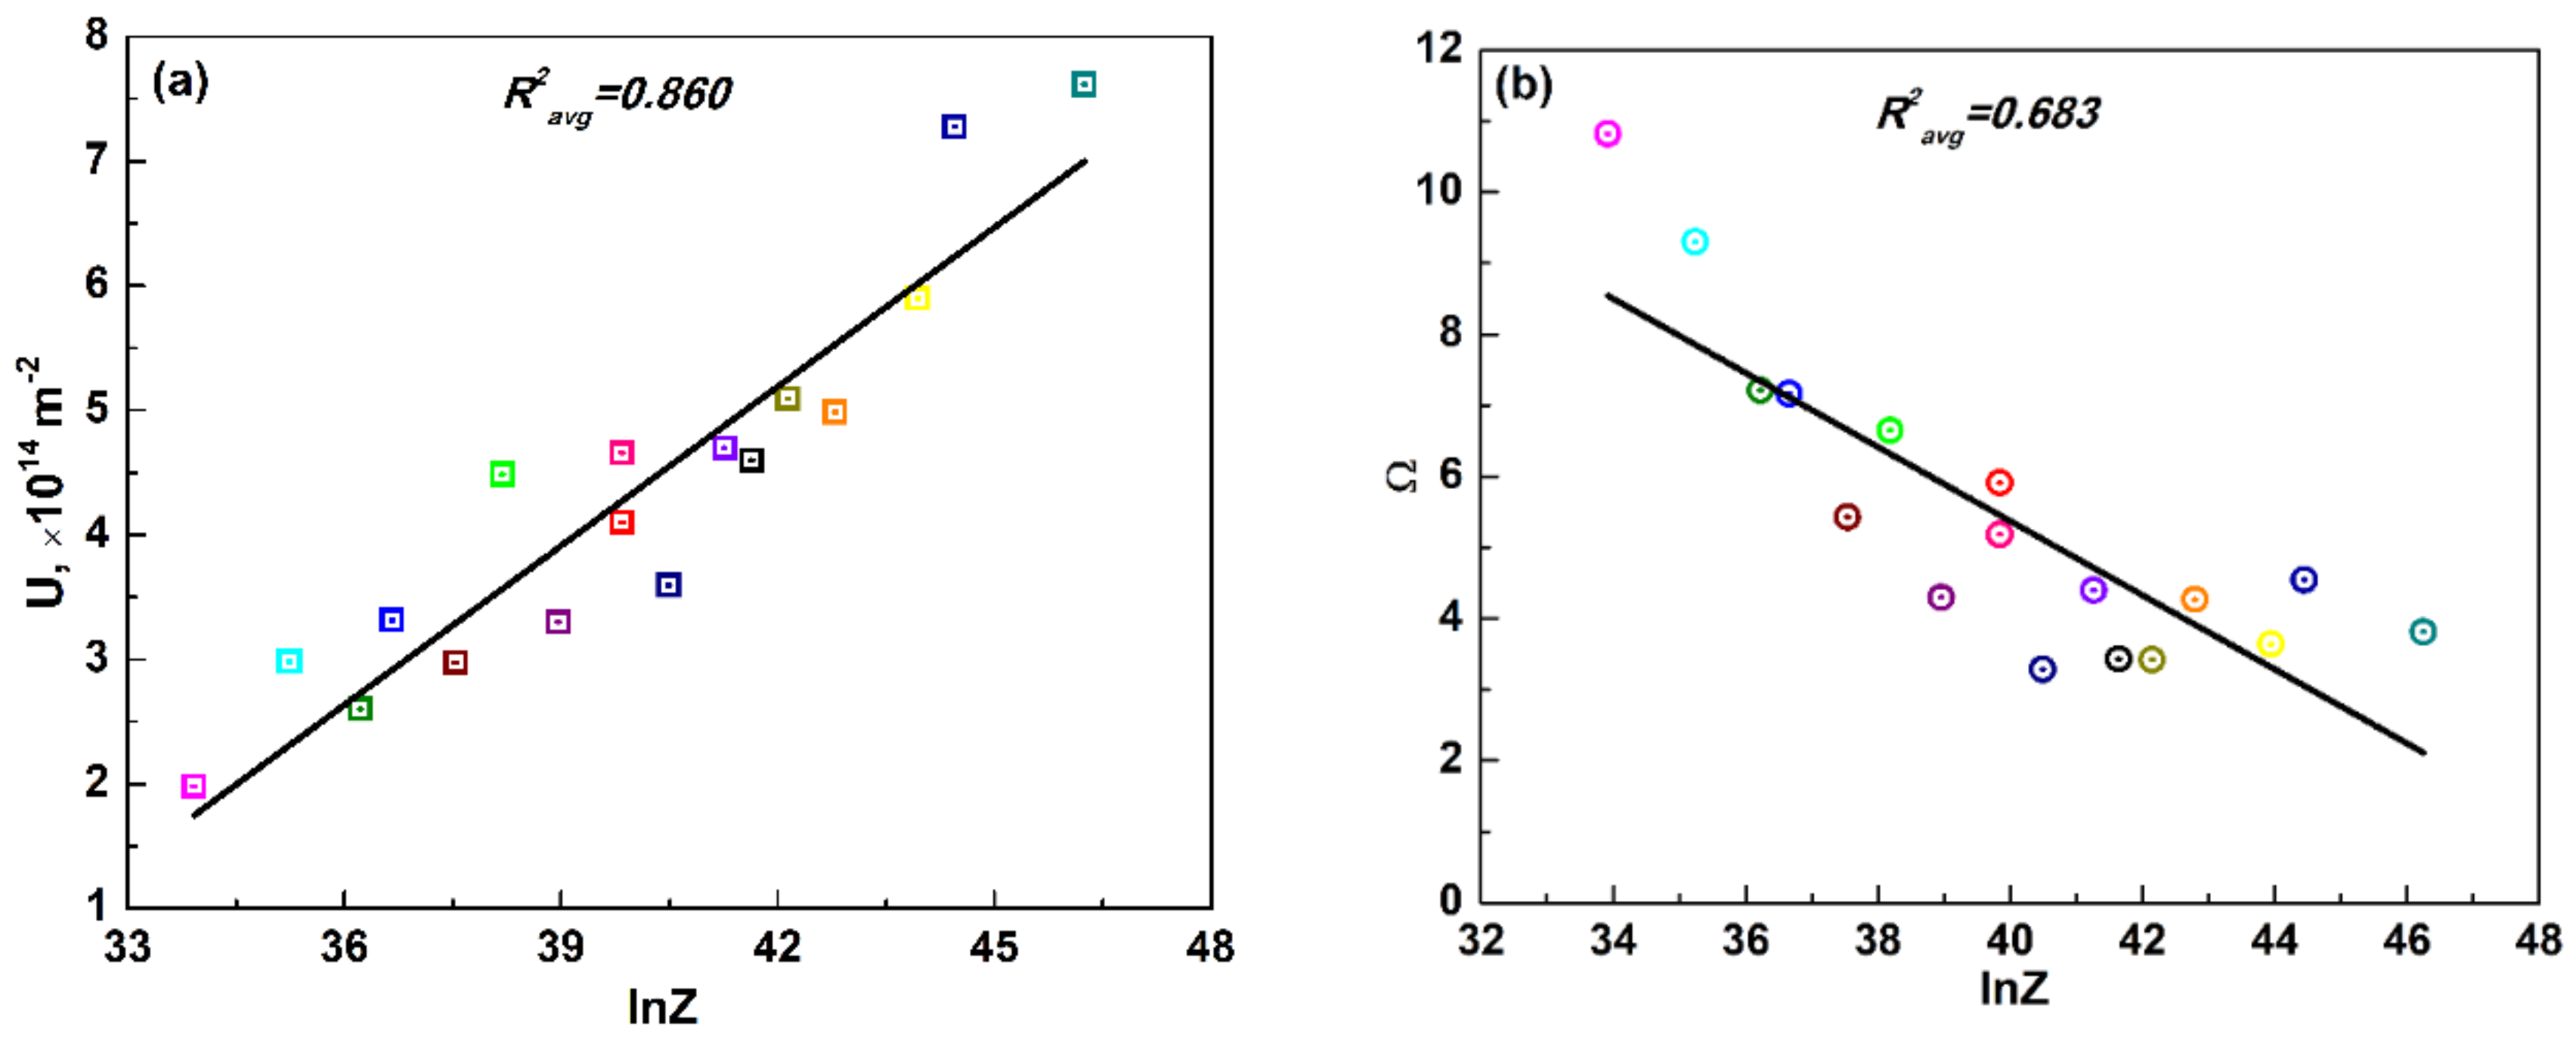
(3)
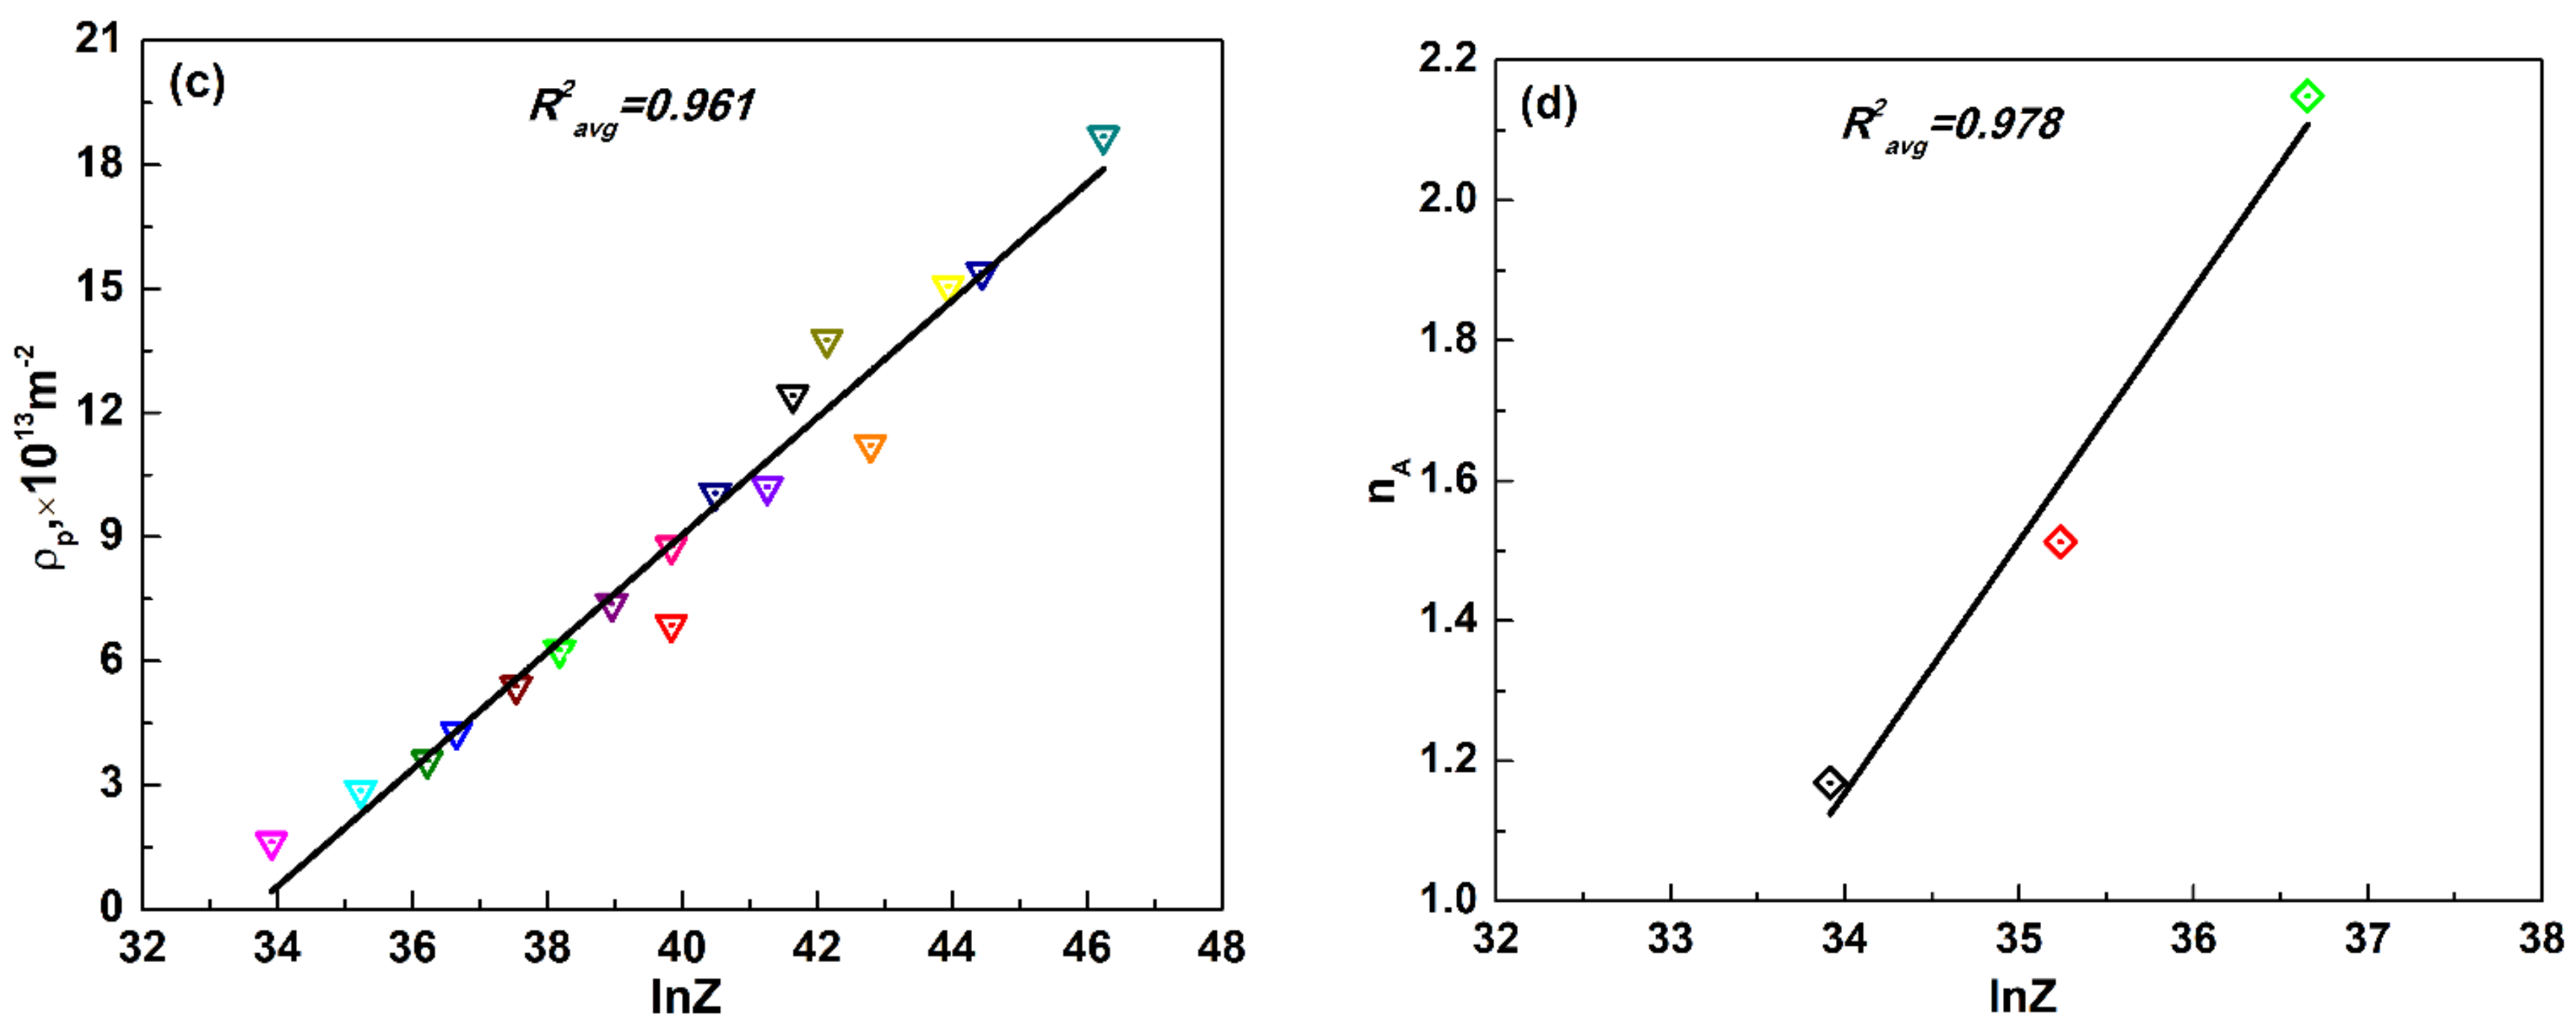
The values of U and ρp exhibited an approximately positive linear relationship with the lnZ parameter, while the Ω dropped with increasing Z value. Meanwhile, the nA value varied between 1.2 and 2.1 with lnZ, indicating the variation in the mechanisms of DRX with deformation conditions.
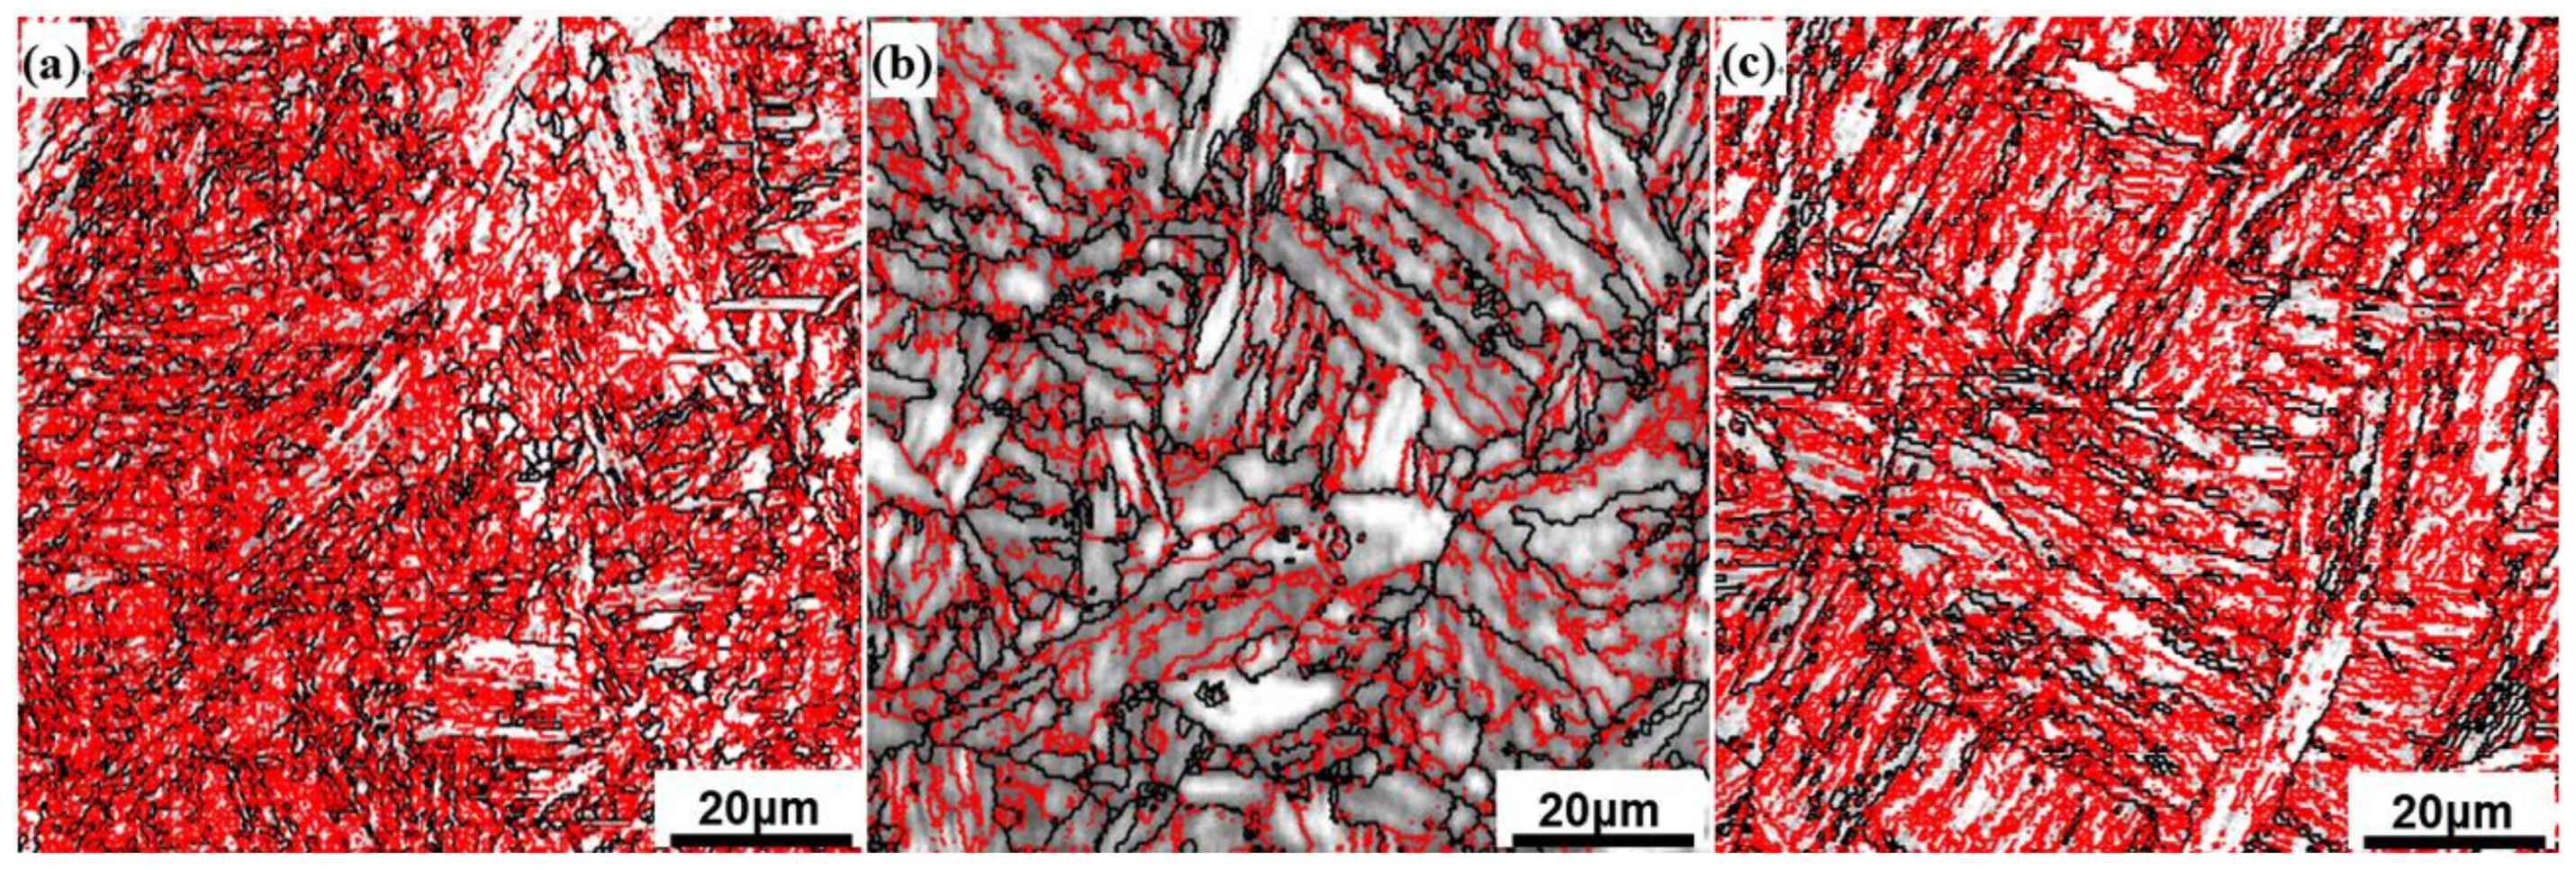
(4)
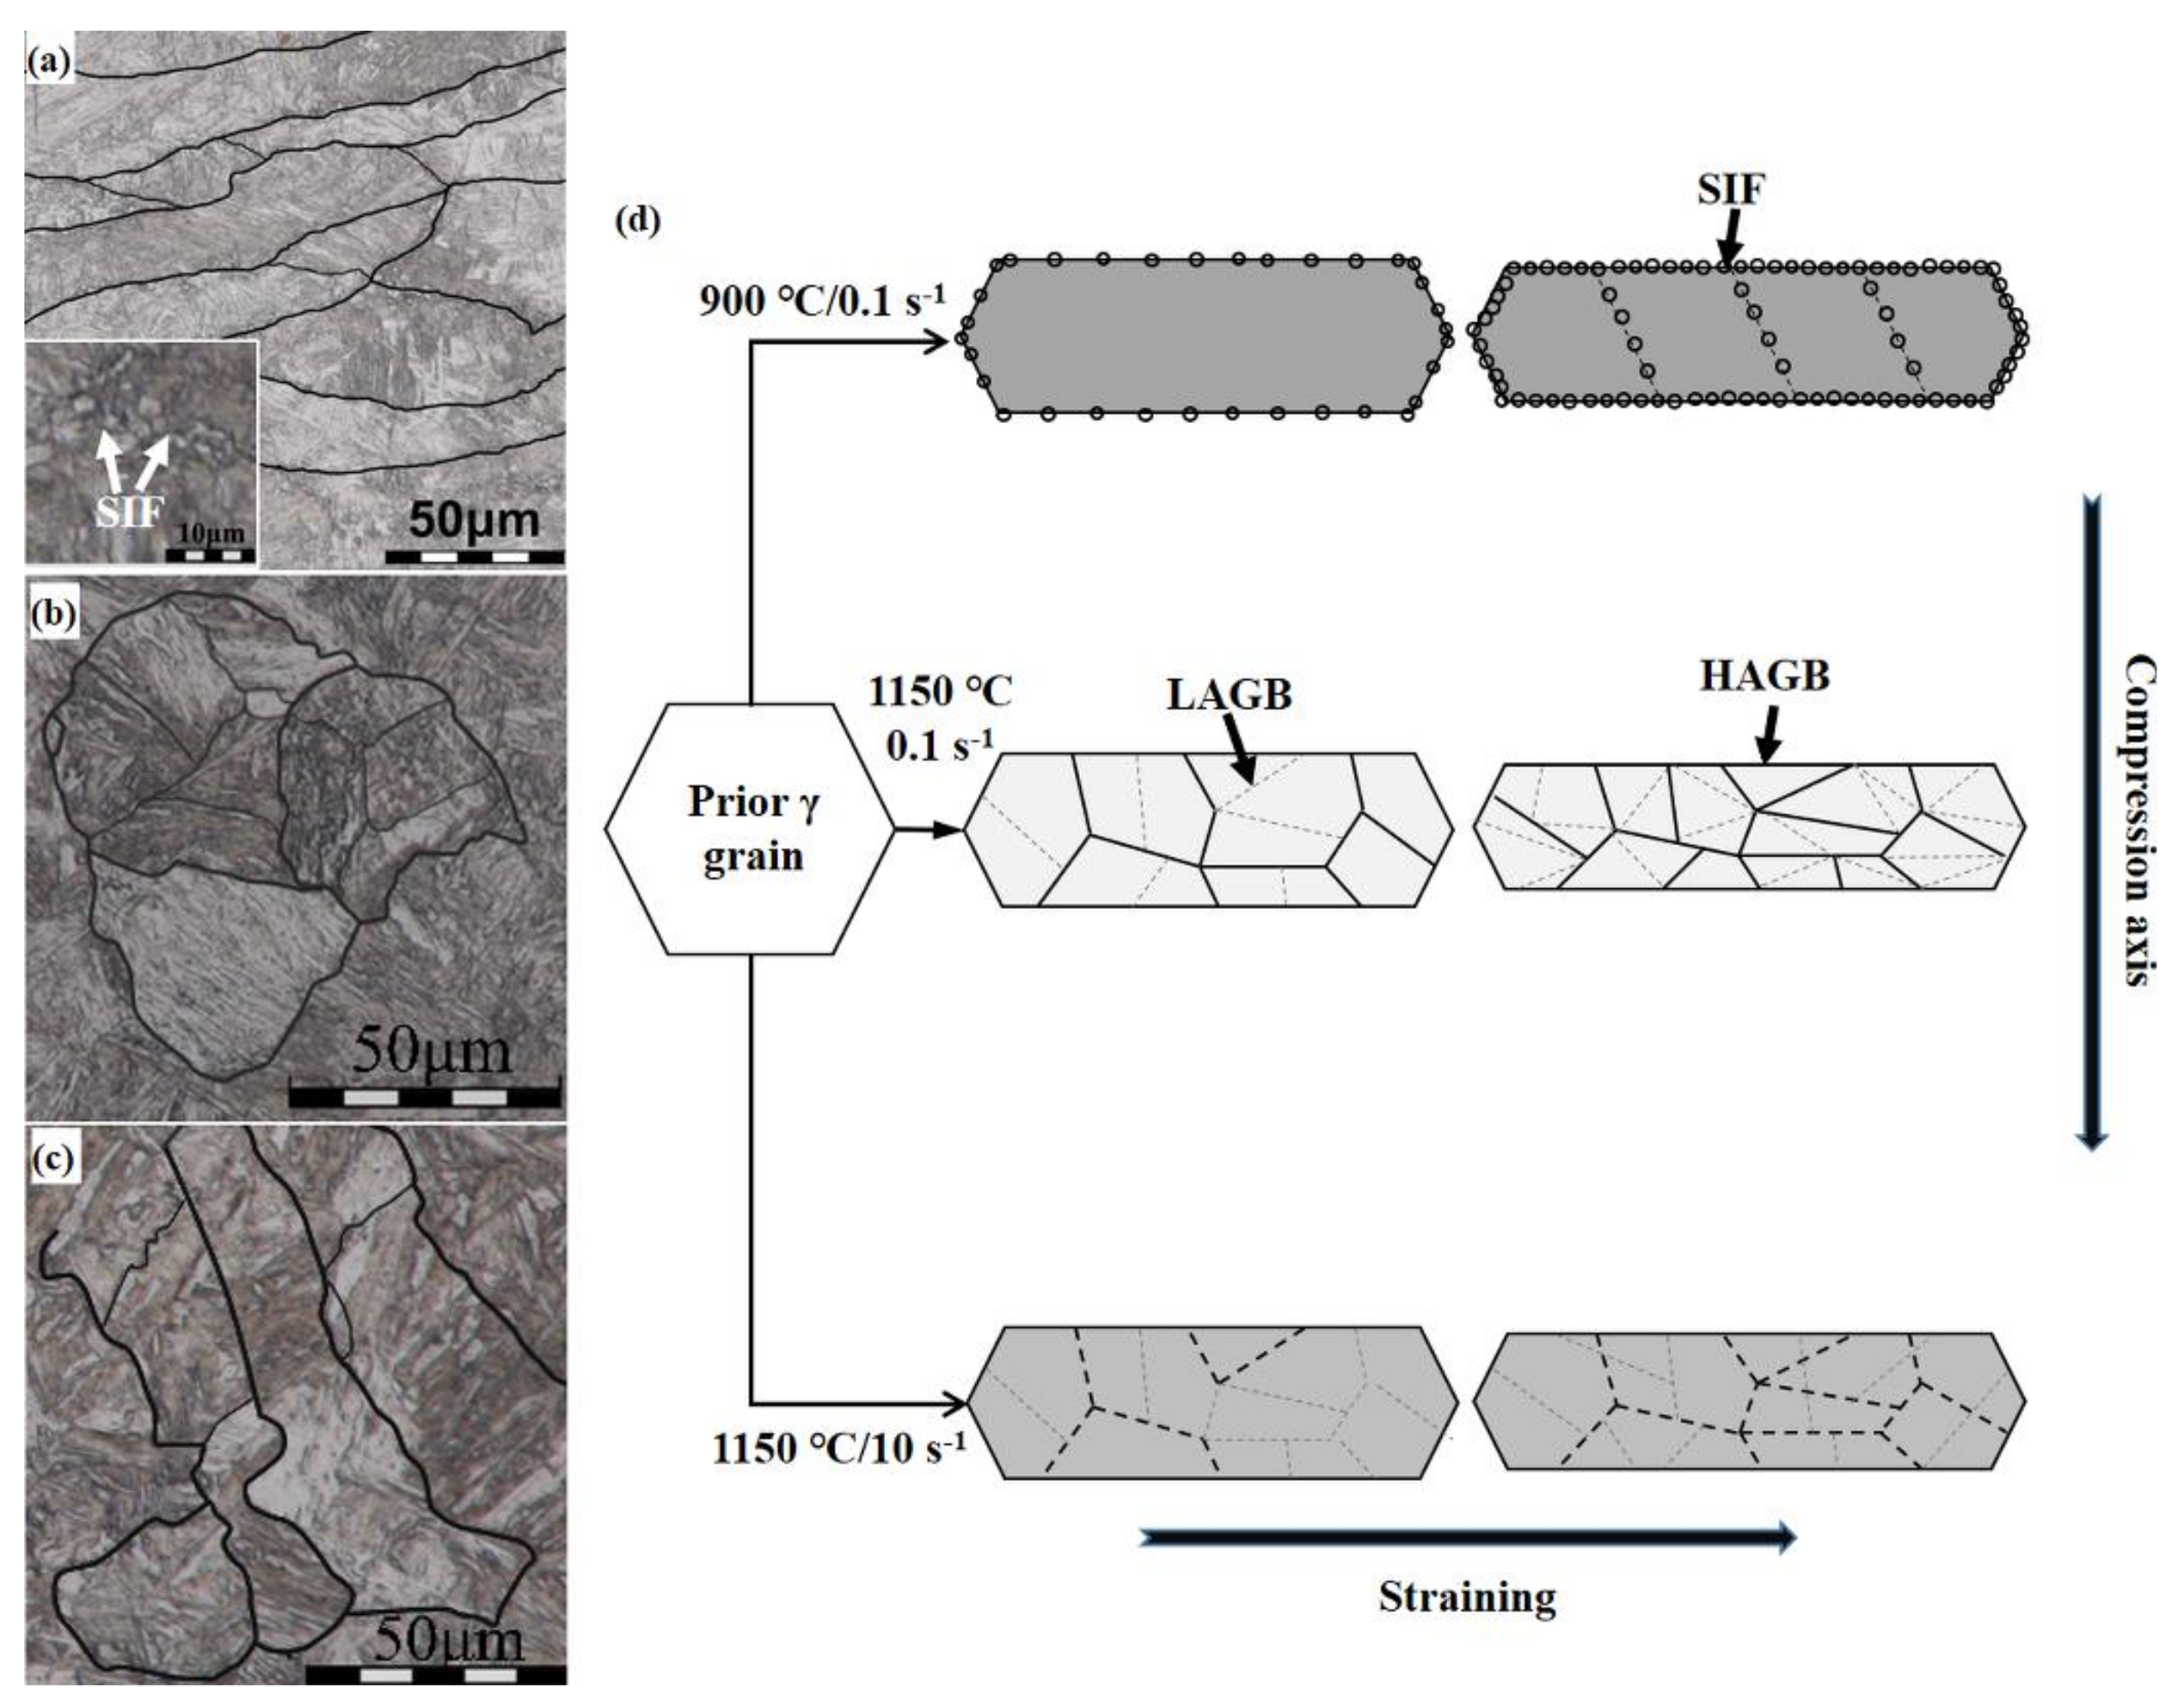
After the microstructure deformed at 900 °C and 0.1 s−1, the severely pancaked prior austenitic grains remained; with increasing deformation temperature above 950 °C and 0.1 s−1, the fully-equiaxed DRX grains formed through rearrangement or annihilation of dislocations. However, as the strain rate increased to 10 s−1 for different deformation temperatures, WH and DRV were dominant, resulting in some deformation bands and substructures in the large pancaked prior austenite grains.
(5)
With increasing the temperature from 900–1150 °C at 0.1 s−1, the fraction of LAGBs of 2–5° dropped by ~33.6%, with greatly increased high angle austenitic grain boundaries (~46.2%) due to a pronounced DRX phenomenon. With increasing strain rate to 10 s−1 at 1150 °C, the fraction of LAGBs of 2–5° increased to ~37.5%, which was associated with inhibition of DRX.

Acknowledgments

The present work was financially supported by the 3rd Key Scientific Research Project for Undergraduates at Northeastern University, China (Grant No. ZD1709), the Fundamental Research Funding of the Central Universities, China (Grant No. N160204001), and National Natural Science Foundation, China (Grant Nos. 51400150 and 51671149).

Author Contributions

Chuanfeng Wu and Peiru Yang performed the physically-based modeling and microstructural characterization. Junhua Su and Xiaopeng Guo designed the experimental procedures and carried out the hot compression tests. Minghui Cai was responsible for the discussion, plotting figures and paper writing.

Conflicts of Interest

The authors declare no conflict of interest.

References

  1. Mukherjee, S.; Timokhina, I.B.; Zhu, C.; Ringer, S.P.; Hodgson, P.D. Three-dimensional atom probe microscopy study of interphase precipitation and nanoclusters in thermomechanically treated titanium–molybdenum steels. Acta Mater. 2013, 61, 2521–2530. [Google Scholar] [CrossRef]
  2. Cai, M.H.; Ding, H.; Lee, Y.K.; Tang, Z.Y.; Zhang, J.S. Effects of Si on Microstructural Evolution and Mechanical Properties of Hot-rolled Ferrite and Bainite Dual-phase Steels. ISIJ Int. 2011, 51, 476–481. [Google Scholar] [CrossRef]
  3. Lee, J.; Lee, S.J.; De Cooman, B.C. Effect of micro-alloying elements on the stretch-flangeability of dual phase steel. Mater. Sci. Eng. A 2012, 536, 231–238. [Google Scholar] [CrossRef]
  4. Kamikawa, N.; Abe, Y.; Miyamoto, G.; Funakawa, Y.; Furuhara, T. Tensile behavior of Ti,Mo-added low carbon steels with interphase precipitation. ISIJ Int. 2014, 54, 212–221. [Google Scholar] [CrossRef]
  5. Rahnama, A.; Clark, S.; Janik, V.; Sridhar, S. A phase-field model investigating the role of elastic strain energy during the growth of closely spaced neighbouring interphase precipitates. Comput. Mater. Sci. 2018, 142, 437–443. [Google Scholar] [CrossRef]
  6. Funakawa, Y.; Shiozaki, T.; Tomita, K.; Yamamoto, T.; Maeda, E. Development of high strength hot-rolled sheet steel consisting of ferrite and nanometer-sized carbides. ISIJ Int. 2004, 44, 1945–1951. [Google Scholar] [CrossRef]
  7. Yen, H.W.; Huang, C.Y.; Yang, J.R. Characterization of interphase-precipitated nanometer-sized carbides in a Ti–Mo-bearing steel. Scr. Mater. 2009, 61, 616–619. [Google Scholar] [CrossRef]
  8. Wang, J.; Hodgson, P.D.; Bikmukhametov, I.; Miller, M.K.; Timokhina, I. Effects of hot-deformation on grain boundary precipitation and segregation in Ti-Mo microalloyed steels. Mater. Des. 2018, 141, 48–56. [Google Scholar] [CrossRef]
  9. Kim, Y.W.; Kim, J.H.; Hong, S.G.; Lee, C.S. Effects of rolling temperature on the microstructure and mechanical properties of Ti–Mo microalloyed hot-rolled high strength steel. Mater. Sci. Eng. A 2014, 605, 244–252. [Google Scholar] [CrossRef]
  10. Yong, W.K.; Hong, S.G.; Huh, Y.H.; Chong, S.L. Role of rolling temperature in the precipitation hardening characteristics of Ti–Mo microalloyed hot-rolled high strength steel. Mater. Sci. Eng. A 2014, 615, 255–261. [Google Scholar] [CrossRef]
  11. Hamada, A.; Khosravifard, A.; Porter, D.; Pentti Karjalainen, L. Physically based modeling and characterization of hot deformation behavior of twinning-induced plasticity steels bearing vanadium and niobium. Mater. Sci. Eng. A 2017, 703, 85–96. [Google Scholar] [CrossRef]
  12. Mirzadeh, H.; Cabrera, J.M.; Najafizadeh, A. Constitutive relationships for hot deformation of austenite. Acta Mater. 2011, 59, 6441–6448. [Google Scholar] [CrossRef]
  13. Feng, H.; Jiang, Z.H.; Li, H.B.; Jiao, W.C.; Li, X.X.; Zhu, H.C.; Zhang, S.C.; Zhang, B.B.; Cai, M.H. Hot deformation behavior and microstructural evolution of high nitrogen martensitic stainless steel 30Cr15Mo1N. Steel Res. Int. 2017, 88, 1700149. [Google Scholar] [CrossRef]
  14. Cram, D.G.; Fang, X.Y.; Zurob, H.S.; Bréchet, Y.J.M.; Hutchinson, C.R. The effect of solute on discontinuous dynamic recrystallization. Acta Mater. 2012, 60, 6390–6404. [Google Scholar] [CrossRef]
  15. Marandi, A.; Zarei-Hanzaki, R.; Zarei-Hanzaki, A.; Abedi, H.R. Dynamic recrystallization behavior of new transformation–twinning induced plasticity steel. Mater. Sci. Eng. A 2014, 607, 397–408. [Google Scholar] [CrossRef]
  16. Zangeneh Najafi, S.; Momeni, A.; Jafarian, H.R.; Ghadar, S. Recrystallization, precipitation and flow behavior of D3 tool steel under hot working condition. Mater. Charact. 2017, 132, 437–447. [Google Scholar] [CrossRef]
  17. Sellars, C.M.; McTegart, W.J. On the mechanism of hot deformation. Acta Metall. 1966, 14, 1136–1138. [Google Scholar] [CrossRef]
  18. McQueen, H.J.; Ryan, N.D. Constitutive analysis in hot working. Mater. Sci. Eng. A 2002, 322, 43–63. [Google Scholar] [CrossRef]
  19. McQueen, H.J.; Yue, S.; Ryan, N.D.; Fry, E. Hot working characteristics of steels in austenitic state. J. Mater. Process. Technol. 1995, 53, 293–310. [Google Scholar] [CrossRef]
  20. Zener, C.; Hollomon, J.H. Effect of strain rate upon plastic flow of steel. J. Appl. Phys. 1944, 15, 22–32. [Google Scholar] [CrossRef]
  21. Bergstrom, Y. A Dislocation Model for the Stress-strain behaviour of polycrystalline a-fe with special emphasis on the variation of the densities of mobile and immobile dislocations. Mater. Sci. Eng. 1969, 5, 193–200. [Google Scholar] [CrossRef]
  22. Bergitrom, Y. The Plastic Deformation of Metals—A dislocation model and its applicability. Rev. Powder Metall. Phys. Ceram. 1983, 2, 79–265. [Google Scholar]
  23. Hamada, A.S.; Khosravifard, A.; Kisko, A.P.; Ahmed, E.; Porter, D.A. High temperature deformation behavior of a stainless steel fiber-reinforced copper matrix composite. Mater. Sci. Eng. A 2016, 669, 469–479. [Google Scholar] [CrossRef]
  24. Jonas, J.J.; Quelennec, X.; Jiang, L.; Martin, É. The Avrami kinetics of dynamic recrystallization. Acta Mater. 2009, 57, 2748–2756. [Google Scholar] [CrossRef]
  25. Zhang, C.; Zhang, L.; Xu, Q.; Xia, Y.; Shen, W. The kinetics and cellular automaton modeling of dynamic recrystallization behavior of a medium carbon Cr-Ni-Mo alloyed steel in hot working process. Mater. Sci. Eng. A 2016, 678, 33–43. [Google Scholar] [CrossRef]
  26. Haghdadi, N.; Martin, D.; Hodgson, P. Physically-based constitutive modelling of hot deformation behavior in a LDX 2101 duplex stainless steel. Mater. Des. 2016, 106, 420–427. [Google Scholar] [CrossRef]
  27. El Wahabi, M.; Cabrera, J.M.; Prado, J.M. Hot working of two AISI 304 steels: A comparative study. Mater. Sci. Eng. A 2003, 343, 116–125. [Google Scholar] [CrossRef]
  28. Dong, J.; Li, C.; Liu, C.; Huang, Y.; Yu, L.; Li, H.; Liu, Y. Hot deformation behavior and microstructural evolution of Nb–V–Ti microalloyed ultra-high strength steel. J. Mater. Res. 2017, 32, 3777–3787. [Google Scholar] [CrossRef]
  29. Qin, F.; Zhu, H.; Wang, Z.; Zhao, X.; He, W.; Chen, H. Dislocation and twinning mechanisms for dynamic recrystallization of as-cast Mn18Cr18N steel. Mater. Sci. Eng. A 2017, 684, 634–644. [Google Scholar] [CrossRef]
  30. Sun, H.; Sun, Y.; Zhang, R.; Wang, M.; Tang, R.; Zhou, Z. Hot deformation behavior and microstructural evolution of a modified 310 austenitic steel. Mater. Des. 2014, 64, 374–380. [Google Scholar] [CrossRef]
  31. Wang, S.; Zhang, M.; Wu, H.; Yang, B. Study on the dynamic recrystallization model and mechanism of nuclear grade 316LN austenitic stainless steel. Mater. Charact. 2016, 118, 92–101. [Google Scholar] [CrossRef]
  32. Parthiban, R.; Ghosh Chowdhury, S.; Harikumar, K.C.; Sankaran, S. Evolution of microstructure and its influence on tensile properties in thermo-mechanically controlled processed (TMCP) quench and partition (Q&P) steel. Mater. Sci. Eng. A 2017, 705, 376–384. [Google Scholar] [CrossRef]
Figure 1. The initial hot rolled microstructure of Ti-Mo steel.
Metals 08 00243 g001
Figure 2. Typical flow curves of Ti-Mo steel obtained under various temperatures in the range of 900–1150 °C and strain rates of (a) 0.1 s−1, (b) 1 s−1 and (c) 10 s−1.
Metals 08 00243 g002
Figure 3. Plots of (a) ln ε ˙ vs. ln σ p and (b) ln ε ˙ vs. σ p at each deformation temperature of 1000–1150 °C for determining material constants, n1 and β.
Metals 08 00243 g003
Figure 4. Plots of (a) ln[sinh( α σ p )] vs. 1000/T, (b) ln ε ˙ vs. ln[sinh( α σ p )] and (c) lnZ vs. ln[sinh( α σ p )] under different experimental conditions for the values of n, S and A.
Metals 08 00243 g004
Figure 5. Comparison of the peak stress model and experiment data for Ti-Mo microalloyed steel at different temperatures of 1000–1150 °C and strain rates of 0.1, 1 and 10 s−1. The average absolute relative error was about 3.69%.
Metals 08 00243 g005
Figure 6. The typical predicted and experimental flow curves of Ti-Mo microalloyed steel at temperatures of 900–1150 °C and different strain rates: (a) ε ˙ = 0.1   s 1 ; (b) ε ˙ = 10   s 1 .
Metals 08 00243 g006
Figure 7. The relationship between typical parameters for physical models and the Z parameter. (a) Hardening parameter, U; (b) softening parameter, Ω ; (c) Avrami’s parameter, nA; (d) peak dislocation density, ρ p .
Metals 08 00243 g007aMetals 08 00243 g007b
Figure 8. Microstructural evolution of a Ti-Mo microalloyed steel during hot compression at different temperatures and strain rates: (a) 900 °C/0.1 s−1, (b) 1150 °C/0.1 s−1 and (c) 1150 °C/10 s−1; as well as the corresponding schematic diagrams (d). LAGBs and HAGBs indicate the low/high angle grain boundaries. The background colors represent the low/high density of dislocations, respectively. SIF, strain-induced ferrite.
Metals 08 00243 g008
Figure 9. Electron backscattered diffraction (EBSD) maps of Ti-Mo microalloyed steel under different deformation conditions: (a) 900 °C/0.1 s−1, (b) 1150 °C/0.1 s−1 and (c) 1150 °C/10 s−1. The red and black solid lines represent the low-angle grain boundaries (LAGBs) of 2–15° and high-angle grain boundaries (HAGBs) of above 15°. The plane of EBSD observation was parallel to the compression axis.
Metals 08 00243 g009
Table 1. A full list of nomenclature.
SymbolsParameters
AMaterial constant ( s 1 )
AAREAverage absolute relative error
kMaterial constant
MDislocation strengthening constant
nStress exponent
nAAvrami’s exponent
QActivation energy for hot deformation ( kJ · mol 1 )
RUniversal gas constant ( J · K 1 · mol 1 )
TAbsolute deformation temperature ( K )
UHardening parameter ( m 2 )
XRecrystallized volume fraction
ZZener–Hollomon parameter ( s 1 )
α Stress multiplier ( MPa 1 )
γ Austenite phase
ε True strain
ε ˙ Strain rate ( s 1 )
μShear modulus ( GPa )
ρDislocation density ( m 2 )
σ True stress ( MPa )
σ 0 Lattice friction stress ( MPa )
σ p Peak stress ( MPa )
σ R e x Steady state stress after dynamic recrystallization ( MPa )
ΩSoftening parameter
Table 2. The fit parameters associated with the peak stress model for Ti-Mo steel.
SampleQ, kJ/molnA, s−1 α , MPa−1
Ti-Mo428.55.001.69 × 10160.009876
Note: Q is the activation energy for hot deformation; n is the stress exponent; A is a material constant; α is the stress multiplier.

