Article

Effects of Prior Microstructure and Heating Rate on the Depth of Increased Hardness in Laser Hardening: Comparison of Computer Simulation and Experimental Results

1
Faculty of Mechanical Engineering, University of Ljubljana, Aškerčeva 6, SI-1000 Ljubljana, Slovenia
2
PRO LABOR d.o.o., SI-3310 Žalec, Slovenia
3
Faculty of Mathematics and Physics, University of Ljubljana, Jadranska ulica 19, SI-1000 Ljubljana, Slovenia
*
Author to whom correspondence should be addressed.
Metals 2018, 8(12), 1016; https://doi.org/10.3390/met8121016
Submission received: 12 October 2018 / Revised: 29 November 2018 / Accepted: 30 November 2018 / Published: 3 December 2018

Abstract

:
The response of the hypo-eutectoid steel to laser hardening, which is measured as the depth of the increased hardness, depends not only on the set of the process parameters but also on the prior microstructure of the workpiece. The multiple preliminary stages of the treatment of the workpiece in the industrial conditions are commonly not completely known, resulting in an unclear prior microstructure of the workpiece. To model the response of the hypo-eutectoid steel, a validated numerical model for laser hardening has been used in the computer simulation of the process for four different cases. The numerical model takes into account the 3D geometry of the workpiece, its prior microstructure, and the effect of the heating rate during the laser hardening process on the kinetics of the phase transformation. The four cases were designed to take into account two different sets of process parameters and two different prior microstructures of the workpiece. The output of the computer simulation was verified experimentally.

Graphical Abstract

1. Introduction

Heat treatment plays an important role in providing the desired properties of steel components in the industrial environment. In general, there are several different heat-treating processes which can change and improve properties of the workpiece, such as strength, toughness, ductility, weldability, hardness, and wear resistance. Normally, heat-treated components are improved to operate under certain conditions; therefore, proper heat treatment and process parameters should be prescribed.
Among new technologies, laser hardening (LH) is particularly enforced in the industrial environment for hardening different materials [1]. The focus of this paper is on the LH of hypo-eutectoid steels. LH is one of the surface heat treatments in which the energy of a laser is used to locally change the properties in the surface domain of the workpiece. The treatment is commonly used as a local surface heat treatment at the end of the manufacturing cycle because it improves the wear resistance and surface hardness.
Two of the first researchers to investigate laser surface heat treatment were Ashby and Easterling [2], who put forward the thermal and kinetic model for LH to predict the structure and hardness of the transformed surface as a function of depth below the heat-treated surface. A comprehensive overview of different analytical and numerical models to predict the kinetics of phase transformation (PT) and corresponding hardness of the workpiece after LH was provided by Bojinović et al. [3].
Two independent parameters (the absorbed laser power on a given area and the interaction time) of laser beam transformation hardening were identified by Meijer and Sprang [4], who showed that these two parameters can be transformed into two functional parameters (the maximum surface temperature and the hardened depth). They also demonstrated that only the maximum surface temperature is needed to optimize the results (hardness, residual stresses, etc.), which can be used directly in adaptive control strategies.
The effects of changing some essential laser heat-treating parameters, such as the maximum surface temperature, the interaction time of the laser beam or the laser beam power, can be expressed as general technological maps, such as in the ASM International Handbook Committee [5] or the papers of Grum [6] or Hyungson and Sangwoo [7]. Grum [6] summarized a wide range of different influences on the process of laser surface hardening and presented the influence of different coatings and prior surface mechanical treatments on the absorptivity of the laser beam power, influence of constant heating rate on austenitization temperature Ac3, influence of laser power and laser speed on depth of surface hardened area and residual stresses.
Probably the most extensive experimental work and corresponding technology processing map for LH of carbon steel was presented by Hyungson and Sangwoo [7]. Their study included graphical maps for determination of optimal process parameters for LH and was based on carbon diffusion time in austenite and cooling time.
Bojinović et al. [3] presented mathematical modelling of the LH process using a high-power diode laser and experimentally validated results of computer simulation (CS) based on the developed model. In the paper, it is shown how a change in heat input influences the kinetics of PT at the same maximum temperature on the surface of the workpiece and that heating rate has to be taken into account when calculating the kinetics of PT and the prediction of the depth of increased hardness.
Although there is a relatively large number of different approaches to determine the process parameters of LH and to foresee their effect on the final state of the workpiece, not many authors have discussed the initial microstructural boundary conditions and their influences on the process of the LH. Yet, microstructural initial boundary conditions in LH due to prior mechanical or heat treatment of a workpiece play an important role in the field of LH.
Cho [8] presented the kinetics of austenite formation during continuous heating of a multiphase steel and investigated the influence of reaustenization kinetics from a pearlite-ferrite structure during continuous heating. He analyzed the effects of heating rates and starting microstructures on the kinetics of austenite formation as a result of the preliminary treatment of the workpiece. In the study, the workpieces were made from highly hardenable steel with a carbon content of 0.16% (no material designation is given in the reference). Their prior microstructure (PM) was either bainite or a combination of α-ferrite (α-Fe) and pearlite. The workpieces with the α-Fe and pearlite microstructure were subjected to three types of preliminary treatment: hot rolling (HR), cold rolling (CR) with a thickness reduction of 20% (20CR), and CR with a thickness reduction of 50% (50CR). The constant heating rates were between 0.3 and 300 °C/s. Cho concluded that as the heating rate increased, so did the austenitization temperatures Ac1 and Ac3, which is commonly known from the atlas handbook of Orlich and Pietrzeniuk [9]. Furthermore, he showed that the austenite kinetics of CR material are less sensitive to heating rates than HR material and that bainite material reveals the fastest transformation rates followed by the 50CR, 20CR, and HR material. In his opinion, the trend is consistent with the austenite formation starting from the dissolved pearlite region followed by the growth of the austenite into the ferrite matrix. Therefore, the workpiece with a prior bainite microstructure, which consists of a fine matrix of α-Fe and Fe3C, can supply abundant austenite nucleation sites and short diffusion distance, resulting in a transformation which follows equilibrium even for high constant heating rates such as 100 °C/s. CR elongates ferrite grains and fragments pearlite lamellae, thus increasing nucleation sites of austenite and thereby showing faster transformation than HR material.
Clarke et al. [10] also presented extensive experimental work on the effects of the PM and the heating rate on the induction hardening of AISI 5150 steel. To assess the effects of the PM and heating rate on the austenitization kinetics, the authors performed induction dilatometry on AISI 5150 steel with ferrite-pearlite and tempered martensite PMs. To simulate industrial processes, the variations in constant heating rates from 0.3 to 300 °C/s were applied, and post-hardening metallography and hardness testing were performed. The results showed that the transformation kinetics for prior ferrite-pearlite microstructures are significantly slower than for prior tempered martensite microstructures. They also published data indicating that the difference in Ac1 and Ac3 temperature for a prior normalized workpiece and a prior quenched and tempered workpiece was around 15 °C for Ac1 and 42 °C for Ac3 at a nominal heating rate of 300 °C/s, which is also congruent with findings presented by Cho [8].
The prior size of grains in the microstructure has a significant effect on the kinetics of austenite formation and consequently on the Ac1 and Ac3 temperatures and therefore on the depth of increased hardness in the LH heat treatment. A smaller prior grain size leads to more potential sites for nucleation and a shorter diffusion distance in comparison with coarser prior grains. Shorter diffusion distance speeds up the austenite formation starting from the dissolved pearlite region, leading to the austenite growth into ferrite matrix, resulting in faster austenitization and homogenization of austenite. A lower driving force is therefore required for the formation of austenite due to the presence of more potential sites for nucleation and shorter diffusion distances, which is reflected in the heat treatment in lower Ac1 and Ac3 temperatures.
The history of the prior heat and mechanical treatment is stored in every workpiece and reflected in its microstructure. The microstructure of the workpiece is reflected in the size and shape of the grains and its homogeneity, micro- and macrohardness and dislocation distribution and the various chemical inclusions in it. The microstructure of the workpiece affects its macroscopic properties. All of this affects the heat treatment process and consequently the final state of the workpiece. As LH mainly constitutes a form of final heat treatment in industrial conditions, the microstructure of the workpiece prior to this stage is often the result of multiple preliminary stages of treatment. It is thus important to understand the effects of individual types of preliminary treatments so that the appropriate technological parameters for the LH process can be determined.
A mathematical model, along with the corresponding numerical implementation, for the LH of hypo-eutectoid steel 50CrV4 was presented by Bojinović et al. [3]. The prediction of the effects of the investigated process parameters obtained by their numerical model was validated experimentally on a workpiece with a simple geometrical shape, which gave the model the required physical credibility. While in the work of Bojinović et al. [3], the influence of different heat input on the kinetics of PT at the same maximum temperature on the surface of the workpiece was analyzed, and the inclusion of the heating rate in the calculation of the kinetics of the PT and prediction of the depth of the increased hardness were done, in this paper, the same numerical model is tested in the CS and analysis of the effects of different PMs and heating rates on the austenite kinetics, and resulting hardness after the LH on the hypo-eutectoid steel 50CrV4 is measured.
The results of the CS were also experimentally verified, and the experimental results were compared to the computed ones. The LH process was performed experimentally with different technological parameters, which were defined so that the temperature field on the surface of the workpieces was comparable. For this purpose, two different energy inputs and two different interaction times between the laser beam and the workpiece were taken into account. To analyze the influence of the prior workpiece microstructure, two different microstructures were taken into account, too. The first microstructure resulted from the preliminary heat treatment using the process of normalization (hereinafter referred to as ‘N-group workpieces’), and the second resulted from quenching and tempering (hereinafter referred to as ‘QT-group workpieces’). To obtain different heat-treating conditions, two cases with different technological parameters were used. Thus, in combination with different PMs, four different cases were considered (e.g., N1, N2, QT1, and QT2), where the effect of the PM of the workpiece and the heating rate on the austenite kinetics and depth of the increased hardness in the workpiece made of steel 50CrV4 was investigated.

2. Mathematical Model

The thermal mathematical model and in particular the mathematical model of the kinetics of the PT were fully described by Bojinović et al. [3]. In the following subsections, the basic equations of the thermal and kinetic model of the LH of hypo-eutectoid steel with a high-power diode laser will be recapitulated.
The first set of coupled equations that define the heat transfer problem comprises differential equation governing the heat conduction in the heat-treated workpiece
ρ c p T t = div ( λ T ) + Q ˙
and associated initial and boundary conditions. Above, T = T(x, y, z, t) is a time-dependent temperature field, t is time and Q ˙ = Q ˙ ( x , y , z , t ) is the rate of the latent heat absorbed or released during the LH per unit volume. In the above equation, the quantities ρ, cp and λ represent the density, specific heat, and thermal conductivity, respectively, of the workpiece material.
The initial temperature field of the workpiece is assumed to be uniform and equal to the surrounding temperature T0, where T(x, y, z, t = 0) = T0.
The heat flux at all workpieces’ surfaces is specified because the boundary conditions of the considered LH process are of the Neumann type. The general definition of total heat flux λ T n through the surface is
λ T n = q h ( T T 0 ) σ ε ( T 4 T 0 4 ) ,
where the three terms on the right side of the equation describe a given external heat source, convection, and radiation. The external heat source q represents the heat flux of the laser beam, while the last two terms in Equation (2) represent the heat loss due to convection (h being the heat transfer coefficient) and heat loss due to radiation (σ is the Stefan-Boltzmann constant and ε is the emissivity of the workpiece’s surface), respectively. The non-zero heat flux distribution q is determined in accordance with the characteristic of the applied laser and prescribed process parameters, which were described in detail by Bojinović et al. [3].
Because the differences in densities of individual constituents of the analyzed material (the material is a combination of ferrite (φF), pearlite (φp), austenite (φA), bainite (φB), and martensite (φM)) are small, the assumption that the mass fractions are equal to the volume fractions φk of individual constituents can be made. Thus, the value of an individual material physical property F at temperature T is determined by taking into account the actual state of the mixture Φ = {φF, φP, φA, φB, φM}, which yields
F ( T , Φ ) = k p ϕ k F k ( T , ϕ k ) ,
where Fk(T, φk) is the value of the physical property appertaining to the constituent k.

2.1. Phase Transformation Model

The assumption that the base steel material is homogeneous at the beginning of the LH process through the workpiece can be made, and the volume fractions of pearlite and ferrite can therefore be determined based on the carbon content. The volume fractions for hypo-eutectoid steels containing less than 0.8 wt % C are calculated using the lever rule method. While this statement is true for the N-type workpiece, we have to consider that the QT-type workpiece is not completely made of ferrite and pearlite. Due to the complexity and lack of mathematical models capable of accurately determining the phase mixture and phase kinetics during the rapid heating of the QT-type workpiece, the mathematical and numerical model from Bojinović et al. [3] has been used and put to the test. Thus, for the QT-type workpiece, the same model was used as for the N-type workpiece in order to simplify the transformation kinetics at rapid heating. It should be emphasized that the PM of the QT-type workpiece is adopted and considered a mixture of ferrite and pearlite (the same as for the N-type workpiece), where the different response of the N- and QT-type workpieces at rapid heating is mainly due to the difference in the TTA diagram as a consequence of the PM of both workpieces. The TTA diagram for both initial types of microstructure is significantly different and essential for the determination of the hardness and the increased depth of the hardness after the LH of the hypo-eutectoid steel. Rather than developing a complex mathematical model of austenitization of the QT-type workpiece for rapid heating, the goal is to calculate the increased depth of the hardness for the QT-type workpiece taking into account the TTA diagram for the QT-type workpiece and comparing it to the experimental results.

2.2. Material Hardness Model

To determine the material hardness, the resulting microstructure at the end of the heating phase is taken into account. The prediction of the hardness Hc is obtained by considering the actual microstructure and the maximum temperature attained at the observed material point during heat treatment. With regard to the prediction, the material points are classified into four distinct temperature intervals: HT1, HT2, HT3, and HT4 (Geijselaers [11]).
The hardness of the material in the first interval HT1 is considered to be the same as the initial average measured hardness of the base material. The maximum temperature in this case is below Ac1.
In the second (HT2) and third (HT3) intervals, the maximum temperature is between Ac1 and Ac3, and the hardness of the material is calculated using the Equation (4), which yields
H c = k ϕ k H k
where φk is the fraction of constituent k, and Hk is its corresponding hardness. The hardness of martensite for intervals HT2 and HT3 in HV can be expressed as
H M = 1667 C a 926 C a 2 ϕ M + 150   ( HV ) ,
where Ca is a nominal amount of carbon in the steel and φM is a volume fraction of martensite (Bailey et al. [12]). The respective hardness of the ferrite fraction for the fractions of ferrite and pearlite that did not undergo the PT was evaluated based on the paper of Skvarenina and Shin [13] and was assumed to be HF = 150 HV for both the N- and QT-type workpieces. The hardness of pearlite was assumed to be HP = 365 HV for the N-type workpiece and HP = 465 HV for the QT-type workpiece. These two values were obtained using the hardness measurements of the initial material. For a constituent that undergoes a PT to austenite during the heating and subsequently during the cooling transforms to ferrite, pearlite, or bainite, the corresponding hardness Hk is calculated according to Li et al. [14]. In the HT2 interval, only pearlite is transformed into austenite with high carbon content, whereas in the HT3 interval, with all the pearlite transformed, ferrite transforms—partially or fully—into austenite with low carbon content.
The complete austenitization and homogenisation of the austenite occurs for the material points belonging to the fourth interval, HT4. Using LH, the peak hardness of the material points in this interval is higher than that achieved using the conventional furnace heat treatment, which is due to the microstructure being a homogeneous austenite. Considering the carbon content in the steel, the respective hardness calculation in HV can be obtained using the equation proposed by De la Cruz et al. [15]
H c = 279.69 + 1024.9 C a   ( HV )

3. Computer Simulation

This section gives a brief overview of the experimentally validated numerical model for the LH of hypo-eutectoid steel, which was described in detail by Bojinović et al. [3]. A CS of the LH of a 100 × 100 × 15 mm cuboid workpiece made of steel 50CrV4 is performed using the aforementioned model, and two sets of process parameters and two PMs of the workpiece material are taken into account.

3.1. Presentation of the Numerical Model

The numerical model, based on the finite element method and built in the program ABAQUS [16], can be applied to only a half of geometric model of the sample because the real LH experiment (Bojinović et al. [3]) already established the symmetrical field distributions. The zero-heat flux λ T n = 0 is imposed on the symmetry plane of the workpiece in the direction normal to the symmetry plane (see Figure 1).
The analyzed cuboid domain is discretised by 760,000 eight-node hexahedral finite elements (FEs), with a denser mesh in the interaction area of the laser beam with the workpiece and in the domain of the expected PT. The characteristic size of the FEs in the fine mesh domain is 0.56 mm × 0.13 mm × 0.10 mm (Figure 1).
At each time increment, the temperature field, the rate of change of the temperature, the microstructure transformation kinetics, the temperature-dependent material properties, and the latent heat released during the PTs are computed.

3.2. Material Properties

The considered steel grade is 50CrV4; its chemical composition is given in Table 1.
The respective material physical properties, density, specific heat, and thermal conductivity (Table 2, Table 3 and Table 4), considered in the simulation computations as temperature- and microstructure-dependent, are taken from Sente Software Ltd. [17]. Values of the latent heat, released during the PT, tabulated in Table 5 are obtained from the paper of Lee and Lee [18] for the martensitic transformation and from the paper of Kang and Im [19] for the ferrite and pearlite transformation.
The isothermal data and Scheil’s additivity rule [20] are the basis of the approach to the microstructure transformation kinetics during continuous heating in all the CSs. The influence of the austenitization temperatures Ac1 and Ac3 on the microstructure transformation kinetics was presented by Bojinović et al. [3]. The study showed very good agreement between the measured and computed results when the heating rate-dependent austenitization temperatures were taken into account. The CS was therefore run using the heating rate dependency of the austenitization temperatures assumption. The values of the austenitization temperatures in the rate-dependent simulations for N- and QT-type workpieces are obtained from Sente Software Ltd. [17] (see Figure 2).
In the CS, the temperature dependence of the heat transfer coefficient between the sample and surrounding air (Equation (7)) is assumed, as proposed by Li et al. [21]
h = { 0.0668 × T ( W / ( m 2 ° C ) ) ,   T 0 < T < 500   ° C | 0.231 × T 82.1 ( W / ( m 2 ° C ) ) ,   T 500   ° C |

3.3. Laser Characterization

The LH experiments are run using the 3-kW high-power diode laser with a wavelength of 800–940 nm and a focal length of 200 mm, considering its heat flux distribution q(x, y) for all performed CSs. The interaction area of the given laser beam with the workpiece is 23 mm × 5 mm. To specify the parameters of the shape of the laser beam intensity distribution, the evaluation performed by Bojinović et al. [22], based on the respective experimental validation of the laser beam intensity distribution, was used. The laser beam intensity distribution is described by the super Gaussian function [23], with parameters m and n being equal to 50. For the used laser type, the heat flux on the interaction area is nearly constant. A detailed mathematical description of the laser energy input into the workpiece was presented by Bojinović et al. [3].

3.4. Simulation Case Studies

In the experimental part of this investigation, the influence of the PM of the workpiece (N and QT) and the heating rate (two different laser heat-treating conditions of the workpiece) on the austenite kinetics and depth of the increased hardness was analyzed. Based on considered experiments, four different cases were considered in CS (N1, N2, QT1, and QT2). Two process parameters are given in Table 6, and the PM was taken into account for the heating rate-dependent austenitization temperatures Ac1 and Ac3 (see Figure 2).
In Table 6, P denotes the laser beam power, vY the laser beam velocity along the Y-axis direction, Eint the specific energy input per unit of length, q the constant heat flux affecting a 23 mm × 5 mm large surface area of the sample beneath the moving laser source, and ttot the total time of the laser travel.

4. Experimental Procedure

Experimental validation of the presented numerical model of the LH was discussed in detail by Bojinović et al. [3]. Performing corresponding measurements of the surface temperature field evolution and the depth of the increased hardness is important for validation of numerically obtained results by CS of the process. In this section, a short description of the experiment is given, followed by a report on the corresponding measurement results.

4.1. Laser Hardening Experiment

In the experiment, 100 mm × 100 mm × 15 mm cuboid samples made of 50CrV4 steel with the chemical composition tabulated in Table 1 were subject to the LH. The samples were cut and milled to actual size from a 15.3 mm × 100.0 mm × 2000.0 mm rectangular cuboid. Half of the samples were normalized in a furnace following the conventional procedure at a temperature of 875 °C, as described in the ASM Handbook [5]. The rest of the samples were quenched and tempered, where the process of austenitization lasted one hour, and then samples were rapidly oil quenched. After quenching, they were reheated to the temperature of 550 °C for one hour and cooled on the air at room temperature following the ASM Handbook [5]. In Table 7, the respective average measured values of the prior hardness before the LH are tabulated.
High heating and cooling rates are possible due to the high hardenability of the used hypo-eutectoid steel, the simple geometric shape of the sample and the suitable mass considering the energy input. To remove any contaminants from the surface, the samples were finely ground prior to the LH. A middle surface of the sample, approximately 80 mm long and 23 mm wide, was symmetrically treated by the 3-kW high-power diode laser, for which detailed characterization was given by Bojinović et al. [3].
For the heat treatment, two different sets of process parameters were considered. The starting position of the laser beam was 10 mm from the edge of the sample. The parameters used are summarized in Table 6 as Cases 1 and 2 and were selected with the aim of attaining a comparable maximum temperature on the sample’s surface.

4.2. Surface Temperature Field Measurements

During heat treatment, the time evolution of the temperature distribution was measured on the sample surface, exposed directly to the laser beam, using an E-MAqS thermal imaging camera (Fraunhofer IWS, Dresden, Germany). Details about the temperature field measurements were presented by Bojinović et al. [3]. Specifying the process parameter values for the two cases (Cases 1 and 2), an identical maximum temperature (1335 °C) was obtained on the sample surface, irrespective of the PM of the sample (N or QT). Based on the measured temperature field on the sample surface, it was deduced that the PM has a small influence on the temperature field evolution.

4.3. Through-Thickness Hardness Measurements

The samples were cut after the heat treatment using a water jet, first along the YZ symmetry plane, and afterwards each half into four pieces. In accordance with the ASTM E3-11 standard, further microstructure analysis and hardness measurements were performed on the obtained samples. A Zwick ZHU Z2.5 (HV0.5) hardness tester (Zwick GmbH, Ulm, Germany) was used to measure the hardness, and the microstructure analysis was performed using the Olympus GX 51 microscope (Olympus Corp., Tokyo, Japan). The hardness was measured on the cross-section in the YZ symmetry plane with the measurements performed at distances of 18.5, 35.0, 60.0, and 80.0 mm from the edge of the sample in the Y-axis direction and considering a stepping increment of 0.1 mm in the opposite direction of the Z-axis (Figure 3).
The FE characteristic size of 0.1 mm in the FE mesh of the PT domain was used to evaluate the appropriate stepping increment, which enabled comparison of the computed depth of the increased hardness with the measured hardness. The selected size of the increments was indirectly proven to be adequate by Bojinović et al. [3], who observed the microstructure using the microscope pictures. Results of the Jominy test obtained from Sente Software Ltd. [17] were used to determine the increased hardness that resulted from the formation of the martensite microstructure. The test results consisted of all material points, where hardness above 550 HV was obtained. In all four cases, an almost discreet jump in the hardness was observed (Figure 4), leading to the following characteristic findings. Firstly, regardless of the samples’ PM, the depth of the increased hardness was larger in Case 1 than in Case 2, which may be attributed exclusively to the difference of the applied process parameter values. Secondly, the PM had evident influence on the depth of the increased hardness, which was confirmed by considering the hardening results obtained by exposing the QT and N samples to the same heating/cooling process. In each of the two considered cases, Cases 1 and 2, the depth of the increased hardness manifested in the QT samples (ZmaxQT) was larger than that of the N samples (ZmaxN), which is clearly due to the difference in the PM.
The actual difference between the compared depths of the increased hardness, computed as
Δ Z max m = Z max QT Z max N ,
is presented in Table 8 for all considered cases. Comparison of the depth of the increased hardness values at Y = 18.5 mm with values at three other positions (Y = 35.0, 60.0, 80.0 mm) shows that N samples need more time to reach a steady state than QT samples. This difference is edge-affected.

5. Comparison of the Results of Computer Simulation and Measurements

For the purpose of verification of the numerical model, CSs of the heat treatment process, taking into account two different prior microstructures of the steel under two different sets of technological parameters, were run (four different analyzed cases: N1, N2, QT1 and QT2). The prior microstructure (N, QT) has a negligible impact on the density, specific heat and thermal conductivity, but it does have an important impact on the austenitization temperatures Ac1 and Ac3.
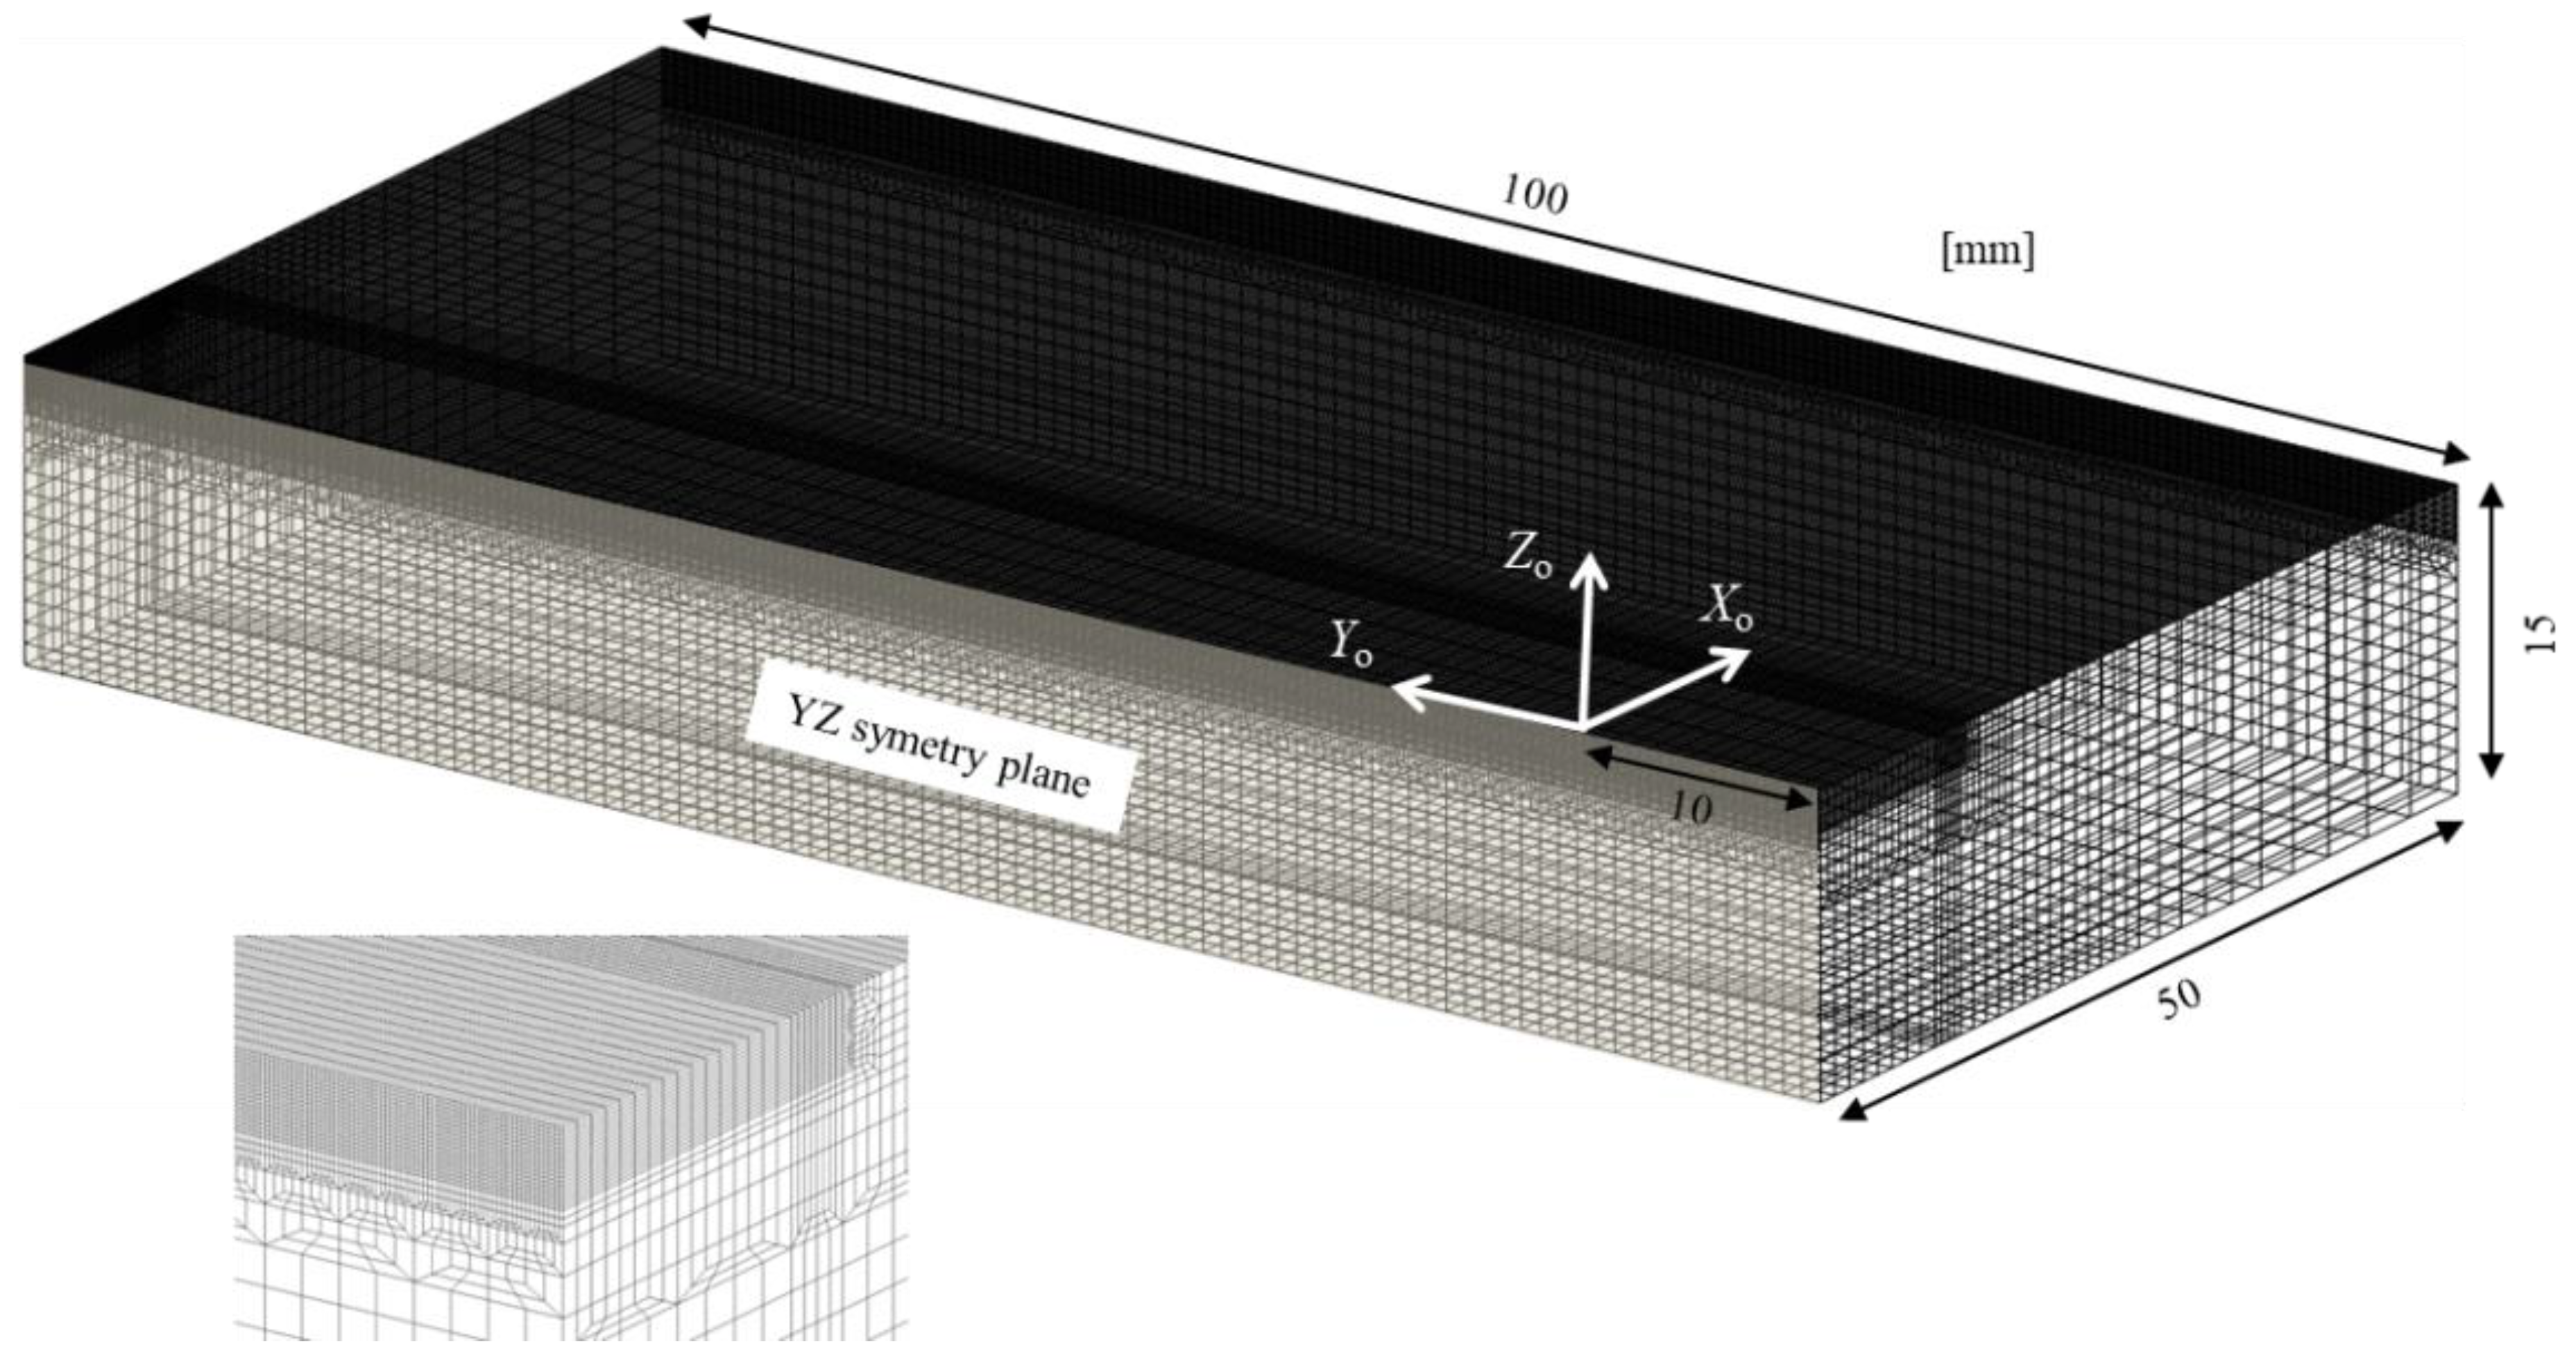
In order to understand the resulting hardness through the thickness of the sample, the evolution of the PT for a particular material point was observed. The resulting hardness is a function of both the PM and applied process parameters. The same material point was selected in all four cases and was chosen to be positioned at 1.1 mm under the heat-affected surface of the workpiece and at the cross-section with Y = 60 mm. 
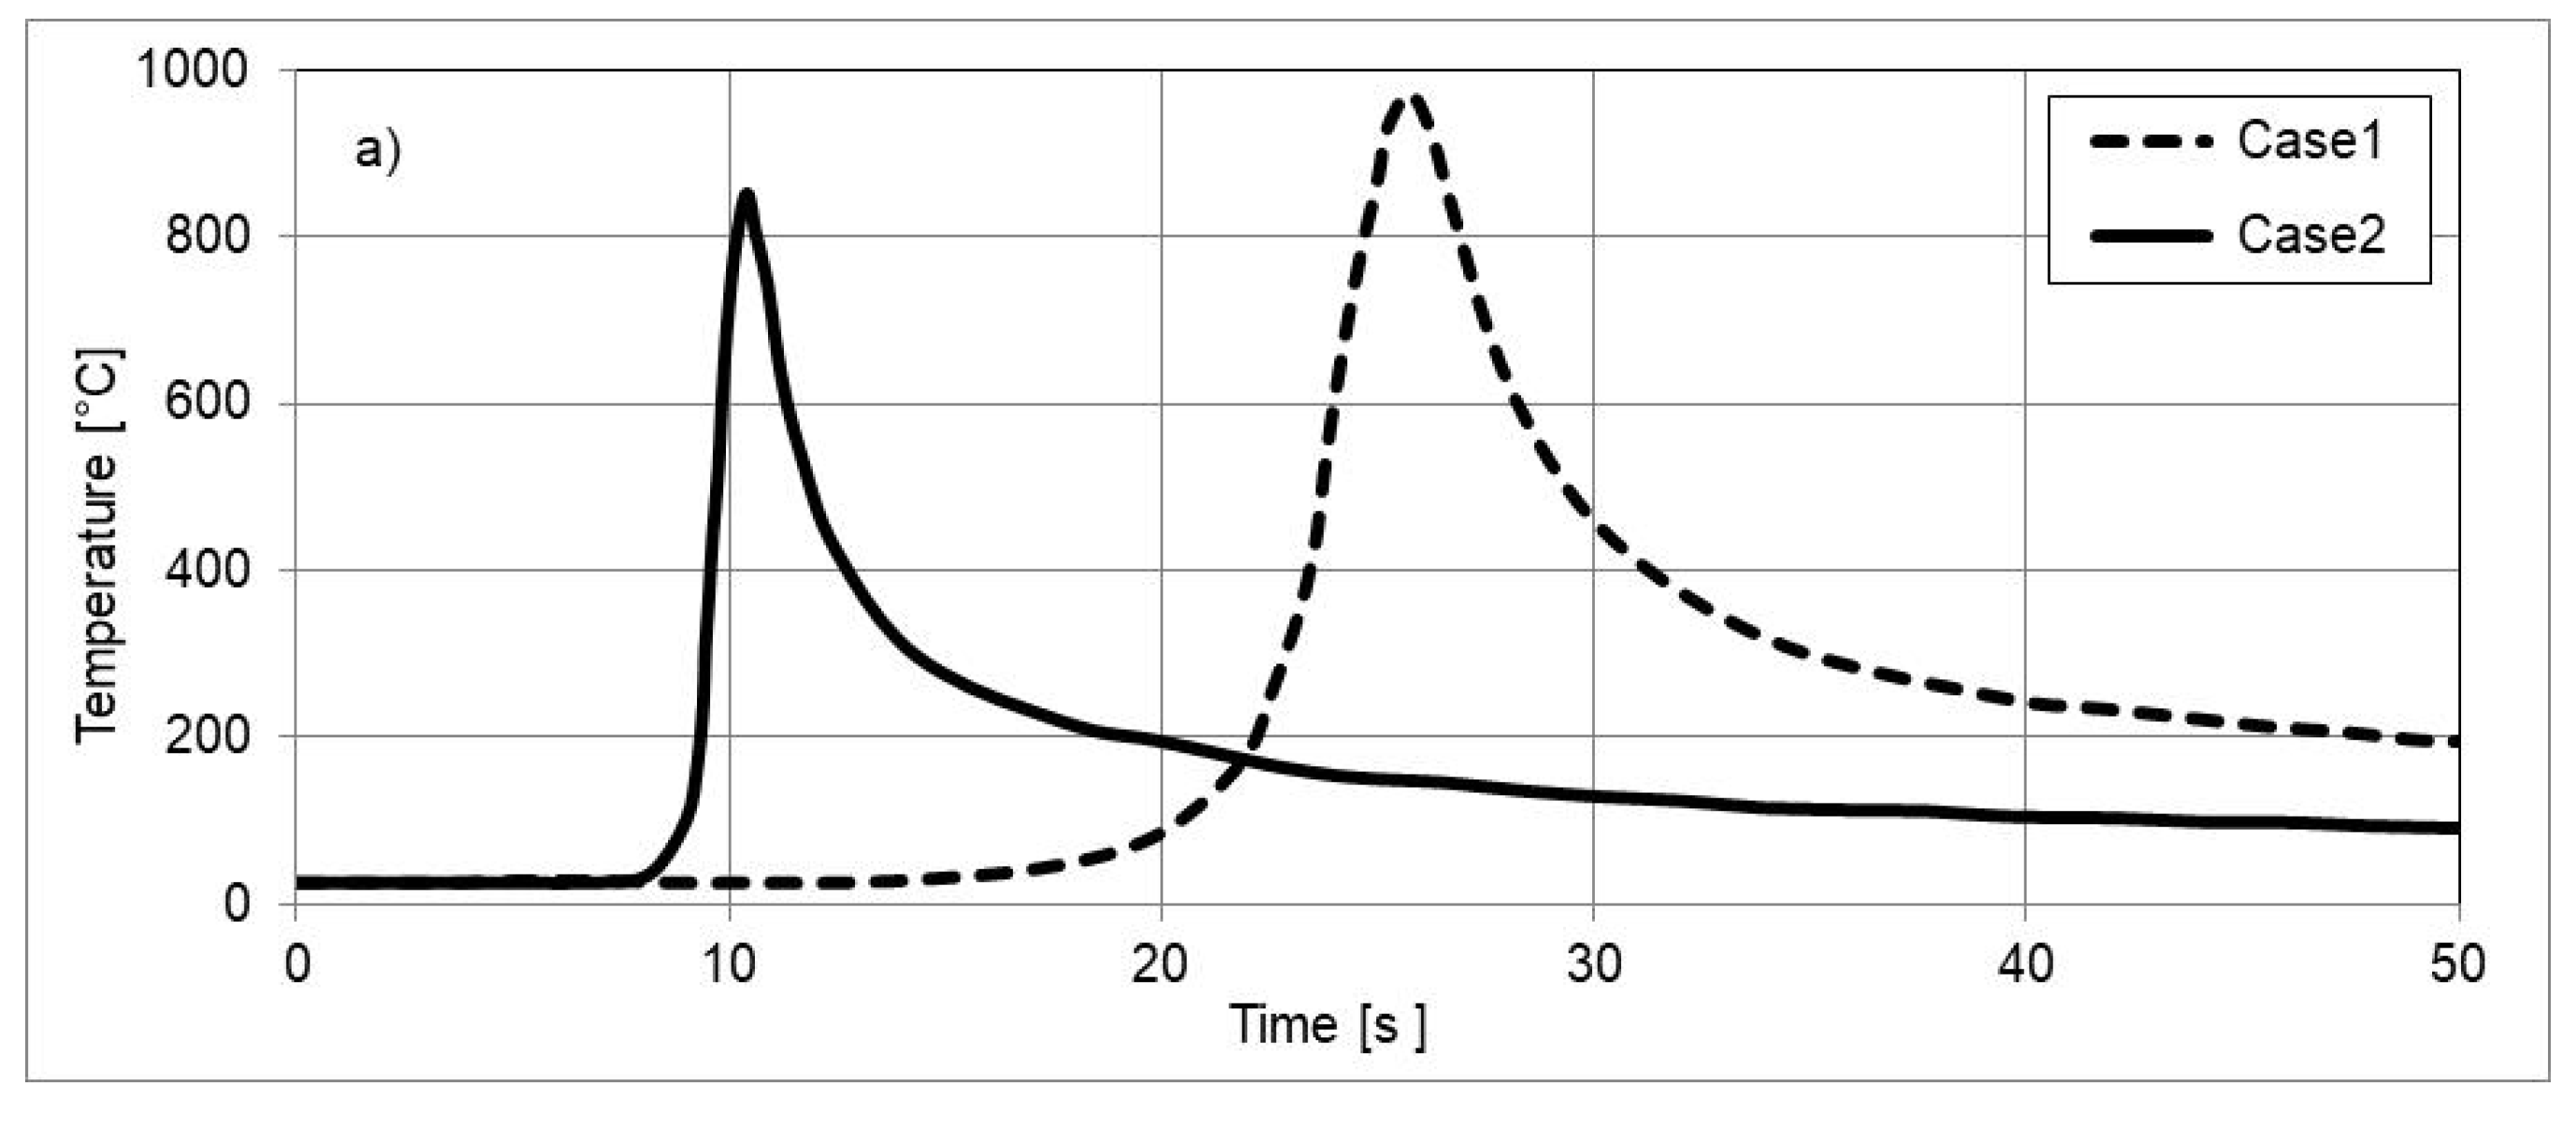
Figure 5 displays the evolution of temperature and its change rate only for PM N because the evolution for PM QT varies by less than 1 °C. When comparing Case 1 and Case 2, a higher maximum temperature can be observed in Case 1 at the selected point (Figure 5). The temperature was found to be 970 °C in Case 1 and 855 °C in Case 2, which could be explained as a consequence of different heat inputs due to different process parameters for the two cases (see Table 6). The opposite is true for the temperature change rate, which is larger in Case 2 than in Case 1 (see the time evolution of the temperature change rate in Figure 5b).
The temperature dependency of the respective volume fractions of emerging austenite (ϕA) and disappearing pearlite (ϕP) and ferrite (ϕF) can be demonstrated using the PT evolutions shown in Figure 6. Based on the results shown in Figure 6, we can conclude that complete austenitization has occurred in the transformation for both prior microstructures (N1 and QT1) in Case 1, while in Case 2, complete austenitization has occurred only in the transformation of the PM QT (QT2), and the austenitization of the PM N (N2) is only partial. In Case 2, the initial temperature for austenite formation Ac1 is lower for PM QT compared to PM N, which is the reason for complete austenitization in the case of PM QT, even though the rate of temperature change is the same for both PMs. According to the simulation, Ac1 is 752 °C for PM QT and 792 °C for PM N (Table 9). A shift of the start of ferrite transformation into austenite to lower temperatures for PM QT with respect to PM N is also evident. In Case 1, the temperature shift is 60 °C, while in Case 2, it is 65 °C (Figure 6). Another reason for only partial austenitization of PM N in Case 2 (N2) is different heating conditions (i.e., lower maximum temperature and higher temperature change rate compared to Case 1, see Figure 5) as a consequence of greater laser beam power and laser beam velocity.
A comparison of the computed maximum depths of the increased hardness Zmaxc with the corresponding measured values Zmaxm is shown in Table 10. The computed values, which are the result of the formation of the martensite microstructure, were computed using Equation (4). Upon considering the tabulated values, it follows that the computed values are close to the measured values for all four cases. This proves the robustness of the numerical model and the suitability of the mathematical model, developed by Bojinović et al. [3], for the calculation of the kinetics of the PTs and the associated increased hardness domain. The accordance between the computation and measurements is pronounced when the microscopic picture of the microstructure is compared with the respective FE representation of the martensite area in the 58.2 mm ≤ Y ≤ 61.8 mm, 0.0 mm ≤ Z ≤ −3.6 mm domain of the symmetry plane in Figure 7.

6. Conclusions

As demonstrated in the presented research, the preliminary heat treatment of the samples is of high importance, considering that the steel samples used in the presented experiments had identical chemical composition. Preliminary heat treatment also affects the final state of the sample, even when the sample is laser heat treated using the same set of technological parameters. It is important to measure the hardness on the surface of the workpiece prior to the technological preparation of LH to determine the possible preliminary heat treatments. Under the same process parameter values, the influence of the PM on the depth of the increased hardness is evident, and it is larger for the QT samples than for the N samples.
Based on experimentally validated numerical model, developed by Bojinović et al. [3], the CS of the LH process for two different energy inputs, taking into account two different PMs of the workpiece, was performed. The difference between two PMs (N or QT) was considered in the numerical model by the temperature rate-dependent austenitization temperatures Ac1 and Ac3. Difference in the austenitization temperatures influences the computed kinetics of the PT and the depth of the increased hardness. The results obtained by the developed numerical model show good agreement between the calculated and corresponding measured depth of the increased hardness. The agreement indicates that the presented numerical model is also useful in cases with incomplete information on the prior heat treatment processes. The showcased CS results also demonstrate the importance of the PMs on the kinetics of austenite formation, alongside the laser input energies. A higher austenitization temperature Ac1 for N samples was observed for the material point under the heat-affected surface when the temperature change rate was higher, as is clearly shown in Case 2. The austenitization temperature Ac1 is lower than the one of N samples for both cases of QT samples and is almost the same regardless of the case. The temperature at which the transformation of ferrite into austenite started was lower in the case of the PM of QT samples, resulting in transformation occurring at 60 °C lower for Case 1 and 65 °C lower for Case 2, compared to the PM of N samples. The analysis of the CS results showed that the same maximum temperature calculated at the surface point at Y = 60 mm is not a sufficient indicator of the depth of the increased hardness. The influence of the PM of the workpiece on the depth of the increased hardness is evident in all the performed experiments and has to be taken into account because the velocity of the laser beam is not the only independent parameter of the modelled process. In the case of PM QT, the depth of the increased hardness was 0.2 mm larger than for PM N, regardless of the LH process parameter values. The increase of 0.2 mm in the depth of the increased hardness presents an increase close to 20% in the case of PM QT compared to PM N.
The PM of the workpiece with unknown preliminary heat treatment operations could be estimated by measuring the surface hardness. The depth of the increased hardness after the LH could be obtained by CS of the treatment process, taking into account the heating rate-dependent austenitization temperatures, but the hardness values in the domain close to the workpiece surface cannot be computed uniquely. From the measured hardness values in the domain close to the workpiece surface, presented in Figure 4, almost constant increased hardness values are observed until a discreet jump. Based on this knowledge, hardness values in the domain close to the workpiece surface could be estimated by measuring the surface hardness after the LH.

Author Contributions

Conceptualization, N.M. and B.Š.; Methodology, N.M.; Software, N.M. and M.B.; Validation, M.B. and P.K.; Investigation, M.B. and P.K.; Writing-Original Draft Preparation, N.M.; Writing-Review & Editing, B.Š.; Supervision, B.Š.

Funding

This research was funded by Javna Agencija za Raziskovalno Dejavnost RS (P2-0263).

Conflicts of Interest

The authors declare no conflict of interest.

Abbreviations

CScomputer simulation
FEfinite element
LHlaser hardening
PMprior microstructure
PTphase transformation
QTquenched and tempered
Nnormalised
TTAtime temperature austentization

References

  1. Campanelli, S.L.; Angelastro, A.; Poda, P.; Daurelio, G. Fiber laser surface remelting of a nickel-based superalloy by an integrated rectangular laser spot. Opt. Lasers Eng. 2018, 111, 42–49. [Google Scholar] [CrossRef]
  2. Ashby, M.F.; Easterling, K.E. The transformation hardening of steel surfaces by laser beams-I. Hypo-eutectoid steels. Acta Metall. 1984, 32, 1935–1948. [Google Scholar] [CrossRef]
  3. Bojinović, M.; Mole, N.; Štok, B. A computer simulation study of the effects of temperature change rate on austenite kinetics in laser hardening. Surf. Coat. Technol. 2015, 273, 60–76. [Google Scholar] [CrossRef]
  4. Meijer, J.; Sprang, I. Optimization of laser beam transformation hardening by one single parameter. CIRP Ann. Manuf. Technol. 1991, 40, 183–186. [Google Scholar] [CrossRef]
  5. ASM International Handbook Committee. ASM Handbook Volume 04-Heat Treating; ASM International: Geauga County, OH, USA, 1991. [Google Scholar]
  6. Grum, J. Modeling of Laser Surface Hardening. In Handbook of Thermal Process Modeling of Steels; Taylor & Francis Group: Abingdon, UK, 2009; pp. 499–626. [Google Scholar]
  7. Hyungson, K.; Sangwoo, S. Process map for laser heat treatment of carbon steels. Opt. Laser Technol. 2012, 44, 2106–2114. [Google Scholar]
  8. Cho, Y.B. The Kinetics of Austenite Formation during Continuous Heating of a Multi-Phase Steel. Master’s Thesis, The University of British Columbia, Vancouver, BC, Canada, 19 May 2000. [Google Scholar]
  9. Orlich, J.; Pietrzeniuk, H.J. Atlas zur Wärmebehandlung der Stähle; Verlag Stahleisen MBH: Köln, Germany, 1976. [Google Scholar]
  10. Clarke, K.D.; Vantyne, C.J.; Vigil, C.J.; Hackenberg, R.E. Induction hardening 5150 steel: Effects of initial microstructure and heating rate. J. Mater. Eng. Perform. 2011, 20, 161–168. [Google Scholar] [CrossRef]
  11. Geijselaers, H.J.M. Numerical Simulation of Stresses due to Solid State Transformations. Ph.D. thesis, The University of Twente, Enschede, The Netherlands, 17 October 2003. [Google Scholar]
  12. Bailey, N.S.; Tan, W.; Shin, Y.C. Predictive modeling and experimental results for residual stresses in laser hardening of AISI 4140 steel by a high power diode laser. Surf. Coat. Technol. 2009, 203, 2003–2012. [Google Scholar] [CrossRef]
  13. Skvarenina, S.; Shin, Y.C. Predictive modeling and experimental results for laser hardening of AISI 1536 steel with complex geometric features by a high power diode laser. Surf. Coat. Technol. 2006, 201, 2256–2269. [Google Scholar] [CrossRef]
  14. Li, C.; Wang, Y.; Zhang, Z.; Han, B.; Han, T. Influence of overlapping ratio on hardness and residual stress distributions in multi-track laser surface melting roller steel. Opt. Lasers Eng. 2010, 48, 1224–1230. [Google Scholar] [CrossRef]
  15. De la Cruz, P.; Odén, M.; Ericsson, T. Effect of laser hardening on the fatigue strength and fracture of a B-Mn steel. Int. J. Fatigue 1998, 20, 389–398. [Google Scholar] [CrossRef]
  16. Hibbit, H.D.; Karlsson, B.I.; Sorensen, E.P. ABAQUS/Standard 6.12 User’s Manual; Daussault Systemes Simulia Corp.: Providence, RI, USA, 2012. [Google Scholar]
  17. JmatPro 6.1; Sente Software Ltd.: Guilford, UK, 2011.
  18. Lee, S.J.; Lee, Y.K. Latent heat of martensitic transformation in a medium-carbon low-alloy steel. Scr. Mater. 2009, 60, 1016–1019. [Google Scholar] [CrossRef]
  19. Kang, S.H.; Im, Y.T. Thermo-elasto-plastic finite element analysis of quenching process of carbon steel. J. Mater. Process. Technol. 2007, 192, 381–390. [Google Scholar] [CrossRef]
  20. Scheil, E. Anlaufzeit der Austenitumwandlung. Arch Eisenhuttenwes 1935, 12, 564–567. [Google Scholar] [CrossRef]
  21. Li, C.; Wang, Y.; Zhan, H.; Han, T.; Han, B.; Zhao, W. Three-dimensional finite element analysis of temperatures and stresses in wide-band laser surface melting processing. Mater. Des. 2010, 31, 3366–3373. [Google Scholar] [CrossRef]
  22. Bojinović, M.; Mole, N.; Artiček, U.; Štok, B. Influence of Power Intensity Distribution of a High Power Diode Laser on the Temperature Field. In Proceedings of the 9th International Conference on Industrial Tools and Material Processing Technologies ICIT & MPT, Ljubljana, Slovenia, 9–11 April 2014. [Google Scholar]
  23. Menzel, R. Photonics: Linear and Nonlinear Interactions of Laser Light and Matter, 2nd ed.; Springer: Berlin/Heidelberg, Germany, 2007. [Google Scholar]
Figure 1. FE mesh of the analyzed domain.
Metals 08 01016 g001
Figure 2. Rate-dependent temperatures and PM-dependent Ac1, Ac3, and Ach for N- and QT-type workpieces (Sente Software Ltd. [13]).
Metals 08 01016 g002
Figure 3. Sample cross-section in YZ symmetry plane with marked hardness measurement positions.
Metals 08 01016 g003
Figure 4. Comparison of measured hardness values vs. depth on the YZ symmetry plane for four different analyzed cases at Y: (a) 18.5 mm; (b) 35.0 mm; (c) 60.0 mm; and (d) 80.0 mm.
Metals 08 01016 g004
Figure 5. For Case 1 and Case 2 at the cross-section location Y = 60.0 mm and Z = −1.1 mm presented evolution for PM N of: (a) temperature; (b) temperature change rate.
Metals 08 01016 g005aMetals 08 01016 g005b
Figure 6. Temperature-dependent respective volume fraction evolutions of the emerging austenite (ϕA) and the disappearing pearlite (ϕP) and ferrite (ϕF): (a) Case 1 (N1, QT1); (b) Case 2 (N2, QT2).
Metals 08 01016 g006
Figure 7. Comparison of martensite area in the real sample and as determined by computer simulation. (a) Experiment; (b) Simulation. Left panel: Case 1, right panel: Case 2.
Metals 08 01016 g007
Table 1. Chemical composition of 50CrV4 steel.
ElementCSiMnCrMoNiVPS
wt %0.5000.3100.9300.9300.0400.1500.1200.0130.005
Table 2. Martensite physical properties.
T (°C)ρ (kg/m3)cp (J/(kg·K))λ (W/(m·K))
25777648034.4
50777048735.4
100775450536.5
150774152637.4
200772654037.9
270769356438.1
Table 3. Austenite physical properties.
T (°C)ρ (kg/m3)cp (J/(kg·K))λ (W/(m·K))
25804846517.1
100800248918.1
200794050719.2
300788452620.6
500777855622.9
700766858625.4
900756961627.8
1100744965430.2
Table 4. Ferrite and pearlite physical properties.
T (°C)ρ (kg/m3)cp (J/(kg·K))λ (W/(m·K))
25782548042.6
100780351142.7
200777555541.7
300774059140.2
500766971435.5
700763398531.2
7407579108030.3
750757061730.1
900752163627.8
Table 5. Latent heat released during PT.
PTΔH (J/m3)
Ferrite → Austenite595 × 106
Perlite → Austenite526 × 106
Austenite → Martensite640 × 106
Table 6. Process parameters for Case 1 and Case 2.
CaseP (W)vY (mm/s)Eint (J/mm)q (W/mm2)ttot (s)
1150027501340
2220054401916
Table 7. Prior surface hardness of N and QT samples.
SamplePrior HardnessPrior Microstructure
N283 HV0.5F + P
QT347 HV0.5F + P + B
Table 8. Difference between measured maximum depths of the increased hardness for QT and N samples using two different sets of technological parameters (Cases 1 and 2).
ΔZmaxm (mm)
Y (mm)Case 1Case 2
18.50.40.1
30.00.20.1
60.00.20.2
80.00.30.2
Table 9. Heating rate-dependent computed austenitization temperatures Ac1 and Ac3 under the quasi steady state assumption.
CaseCase 1Case 2
Preliminary Heat Treatment (°C)NQTNQT
Ac1775751792752
Ac3900802923840
Table 10. Measured (Zmaxm) and computed (Zmaxc) maximum depths of the increased hardness for four cases.
Case Case 1Case 2
Preliminary Heat Treatment NQTNQT
Y (mm)ZmaxmZmaxcZmaxmZmaxcZmaxmZmaxcZmaxmZmaxc
18.51.01.11.41.31.01.01.11.1
35.01.51.51.71.71.11.11.21.3
60.01.51.51.71.71.11.11.31.3
80.01.51.61.81.81.11.11.31.3

