Thermo-Mechanical Modelling of Wire-Arc Additive Manufacturing (WAAM) of Semi-Finished Products


Abstract
1. Introduction
2. FE Model
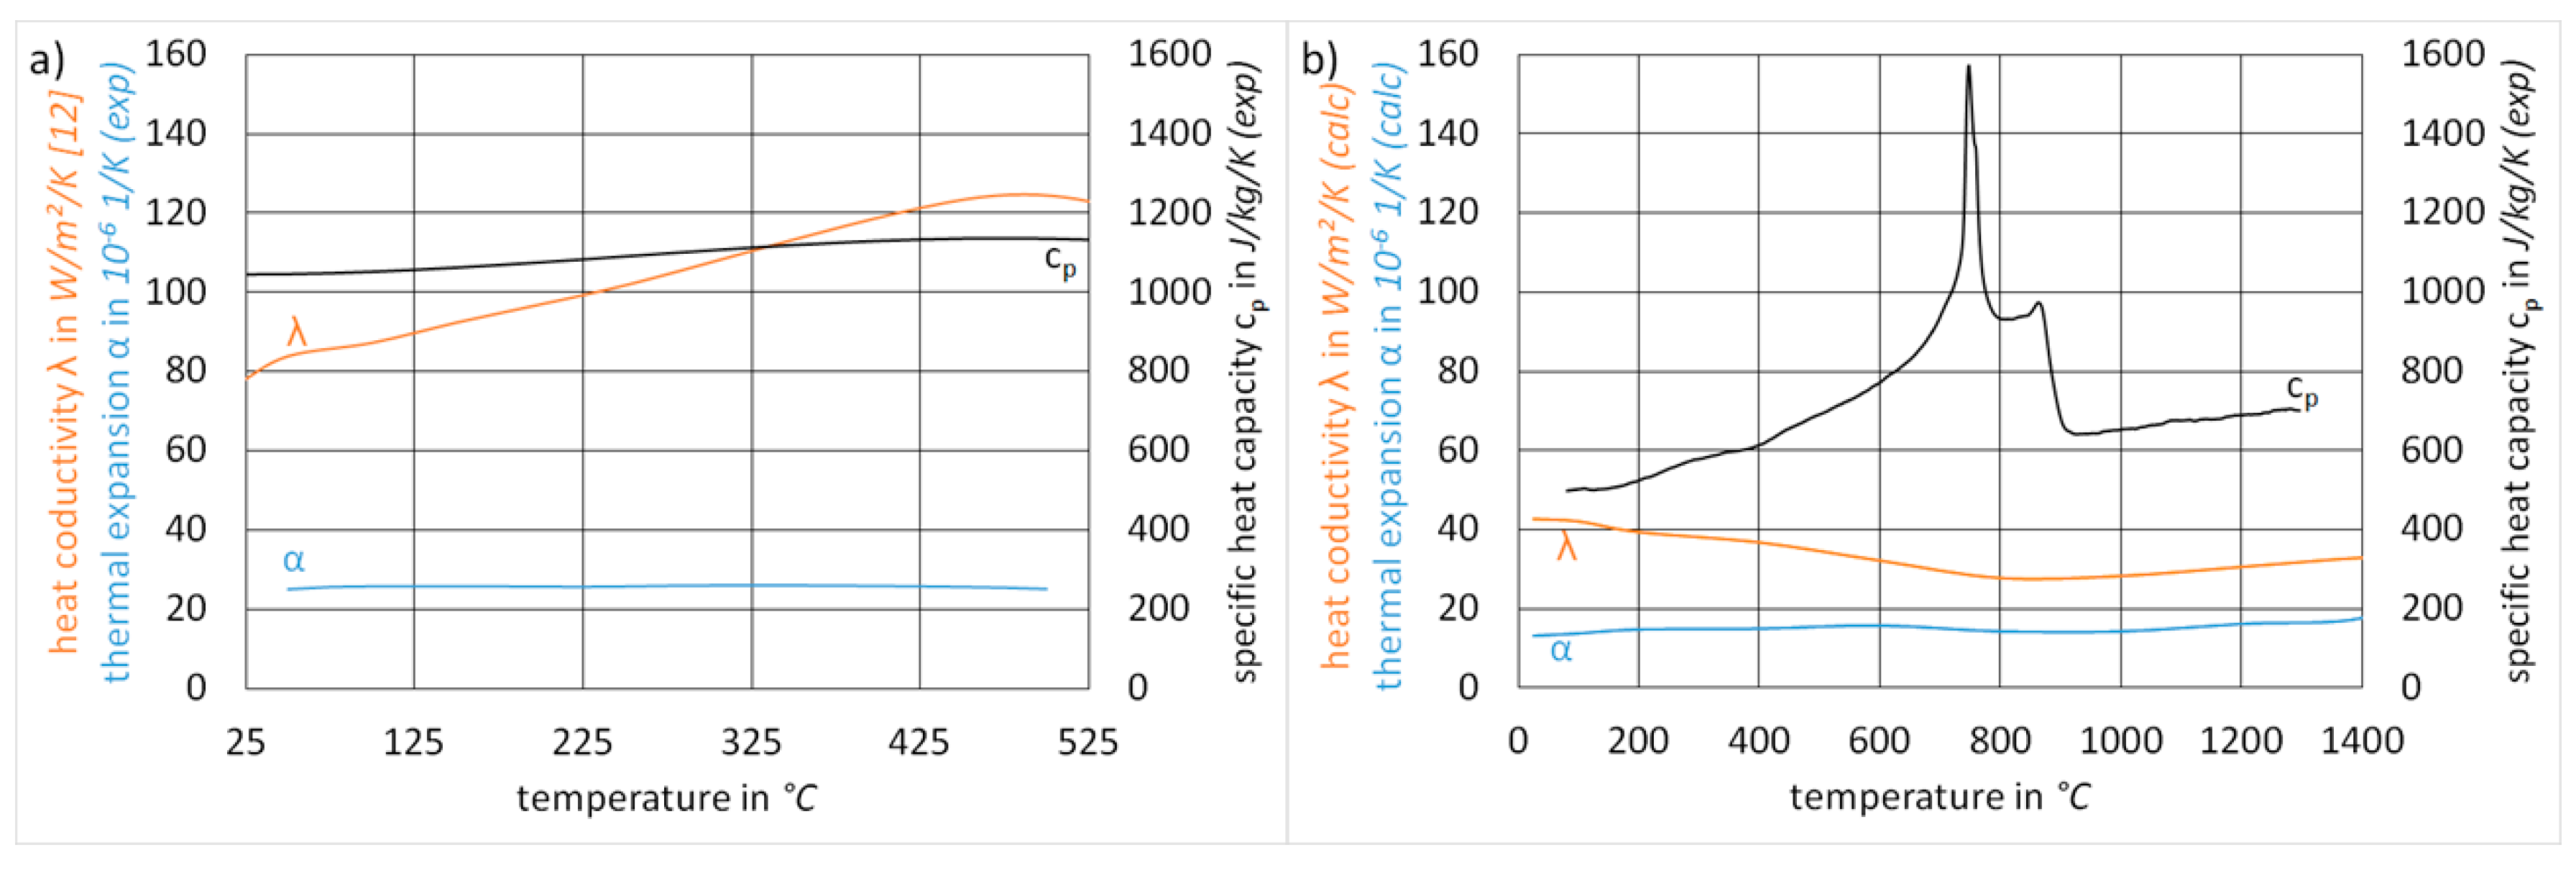
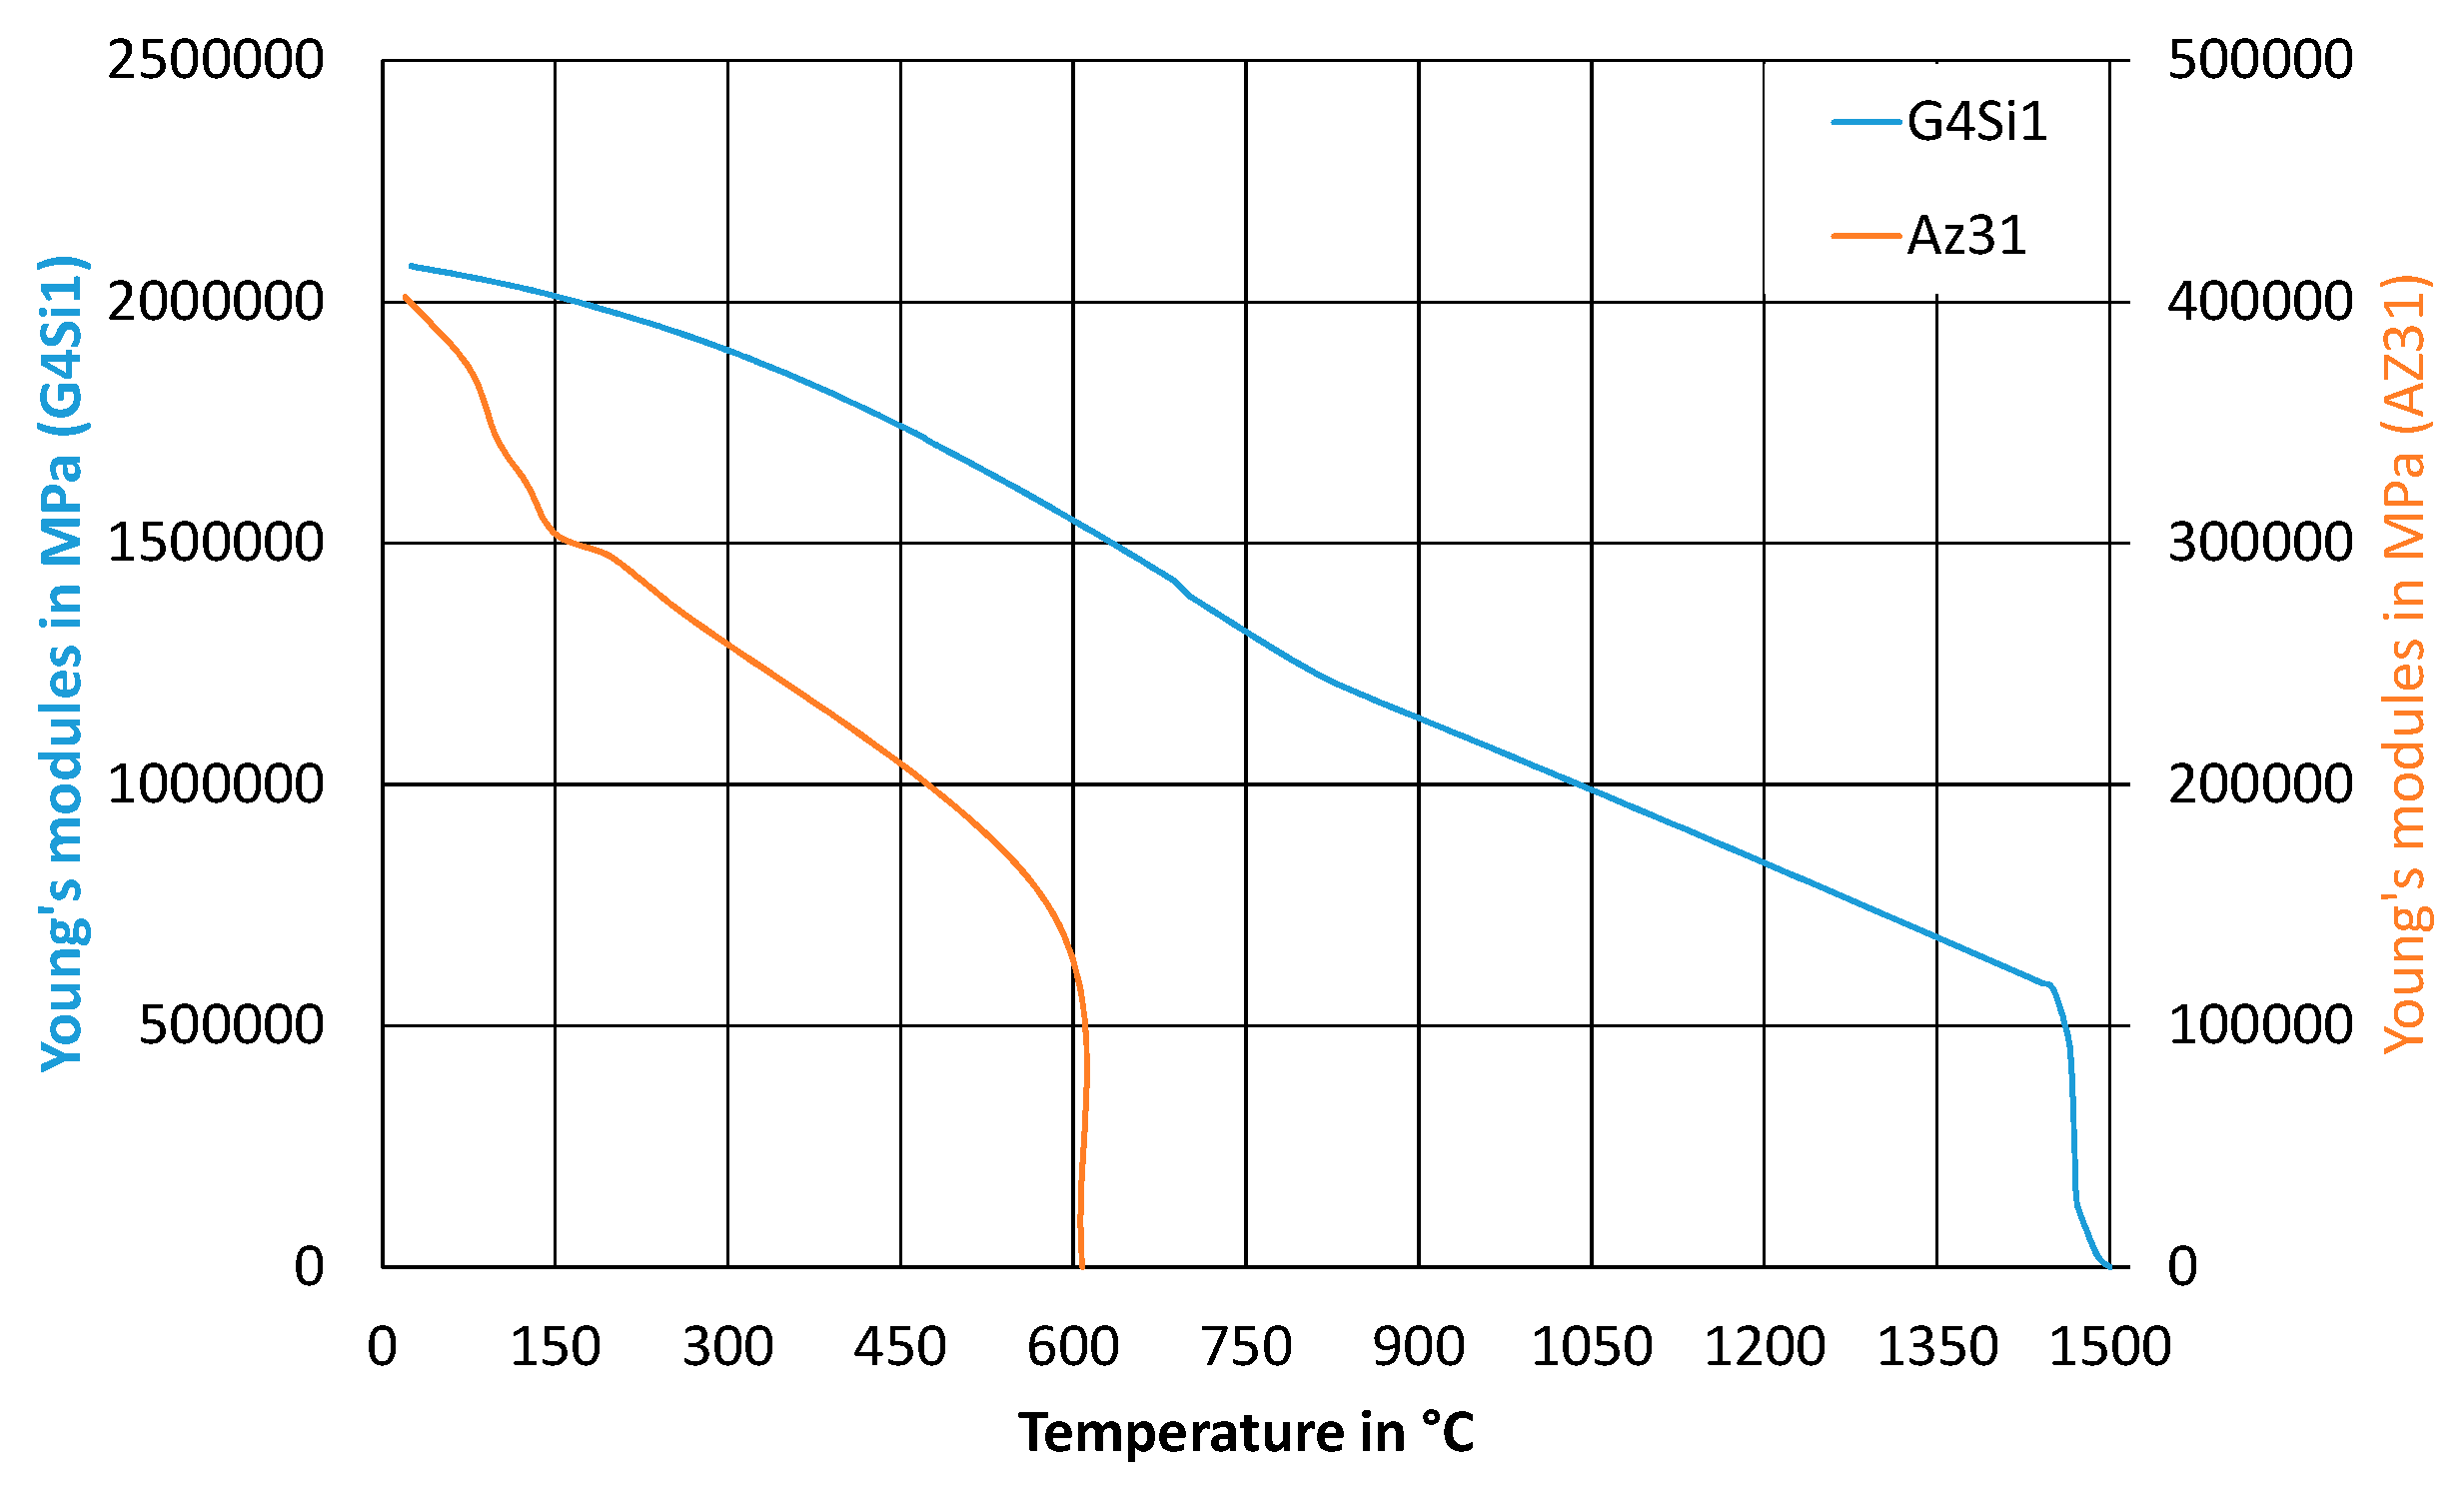
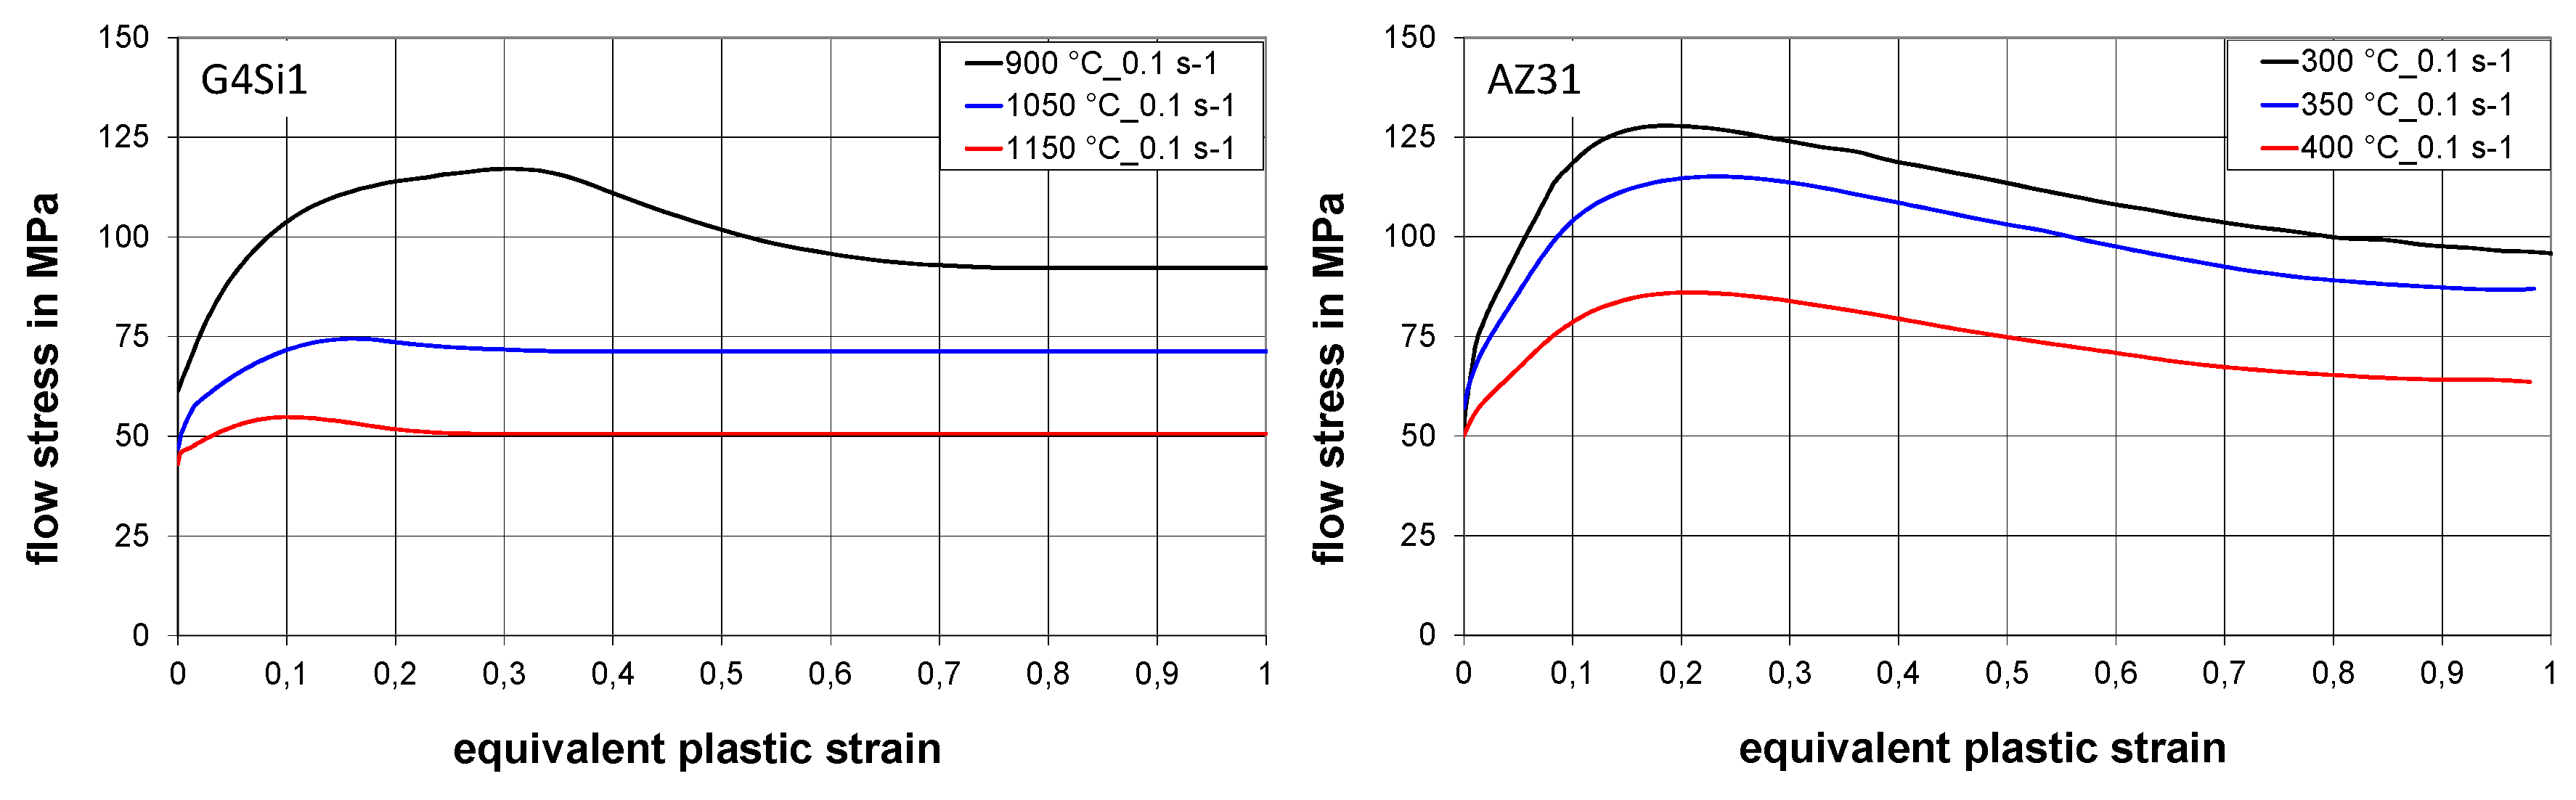
2.1. Material Data
2.2. Boundary Conditions
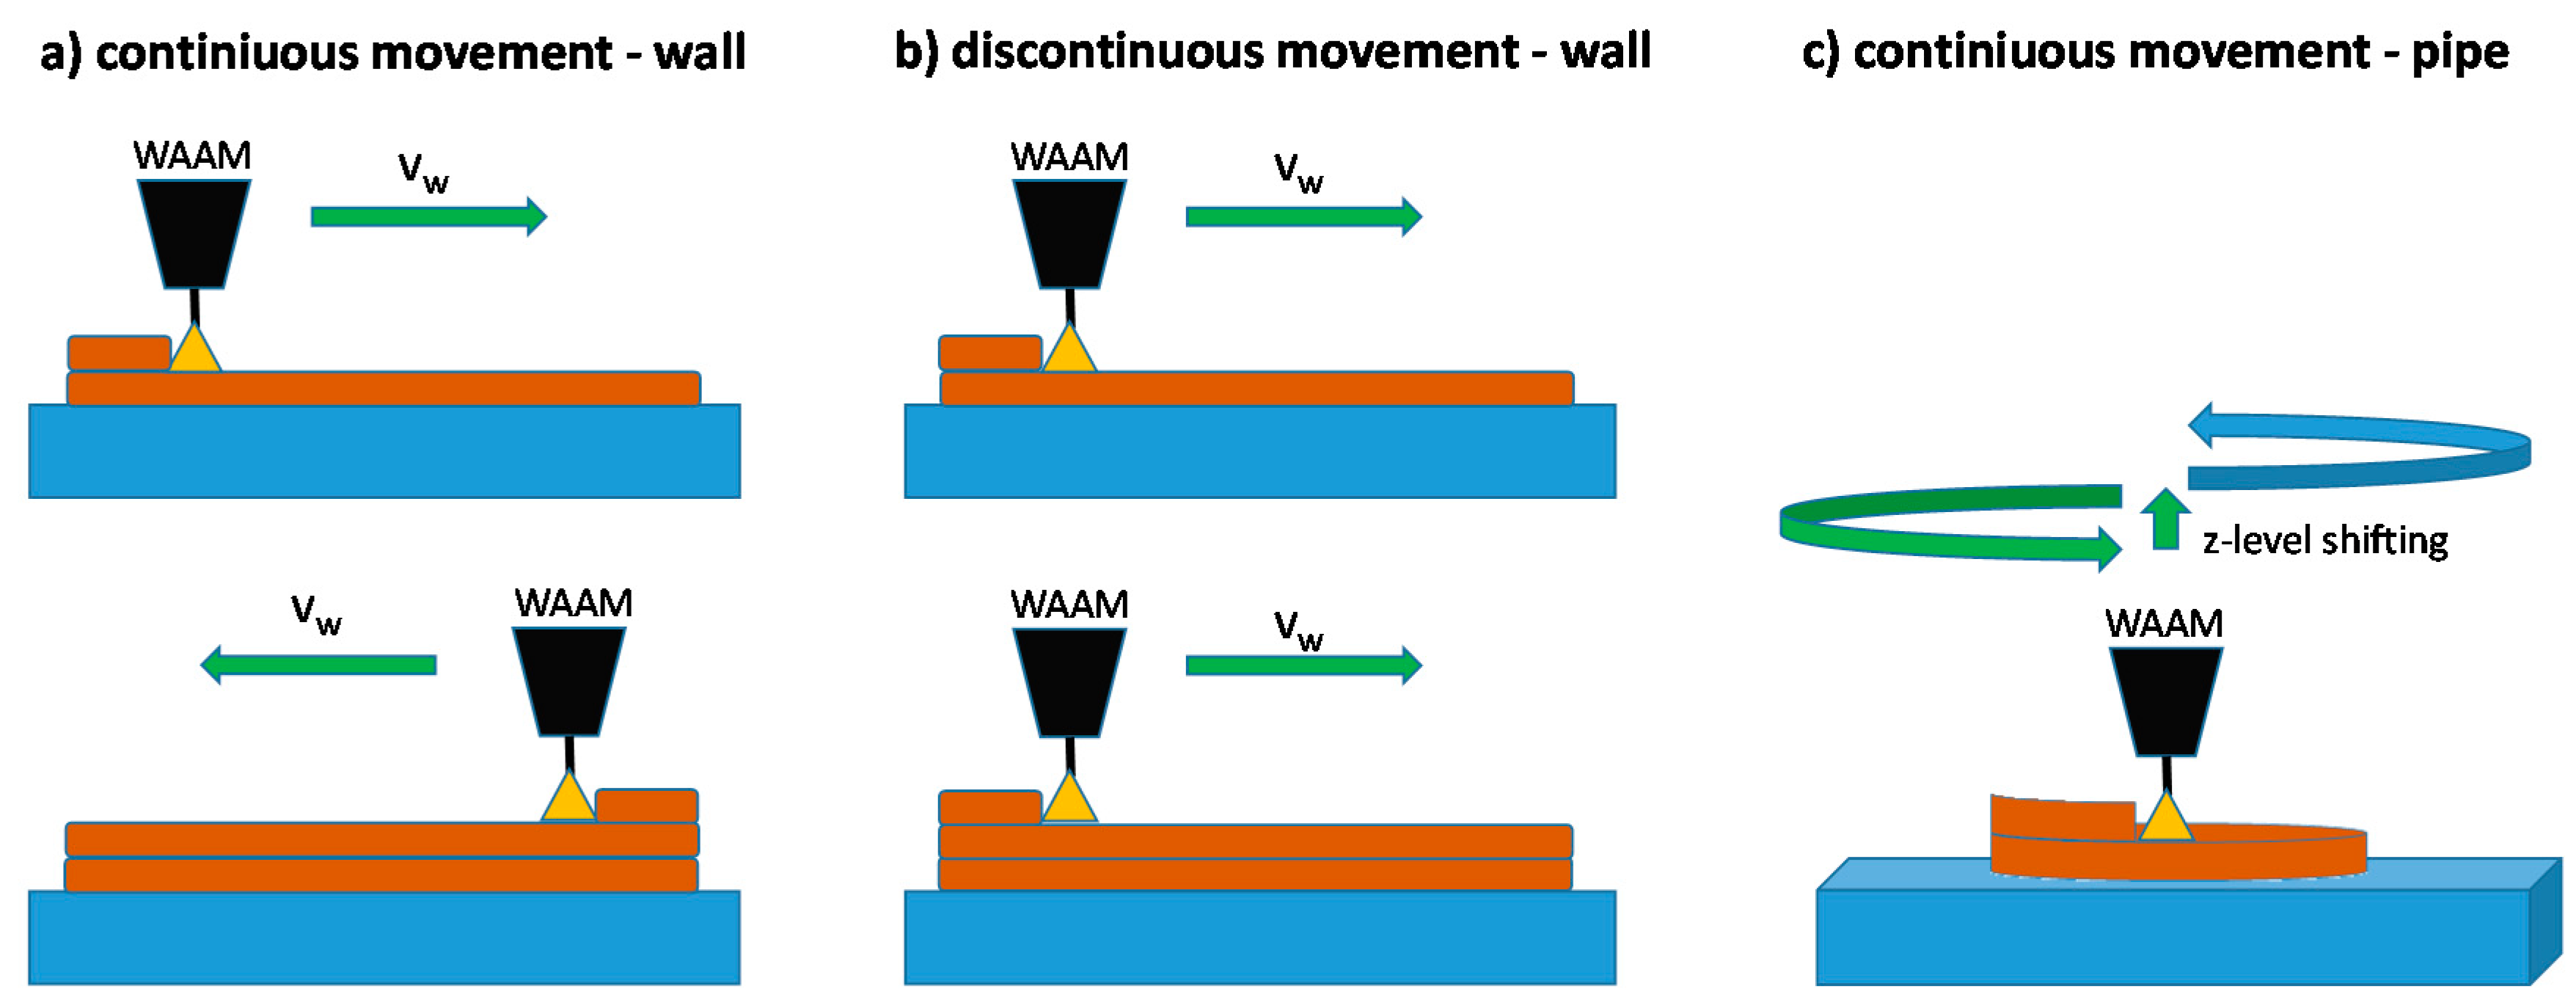
3. Experimental Setup
- G4Si1 (1.5130) steel with a diameter of 1.2 mm; shielding gas 15 L/min (82% Ar and 18% CO2)
- AZ31 magnesium alloy with a diameter of 1.2 mm; shielding gas 15 L/min pure argon.
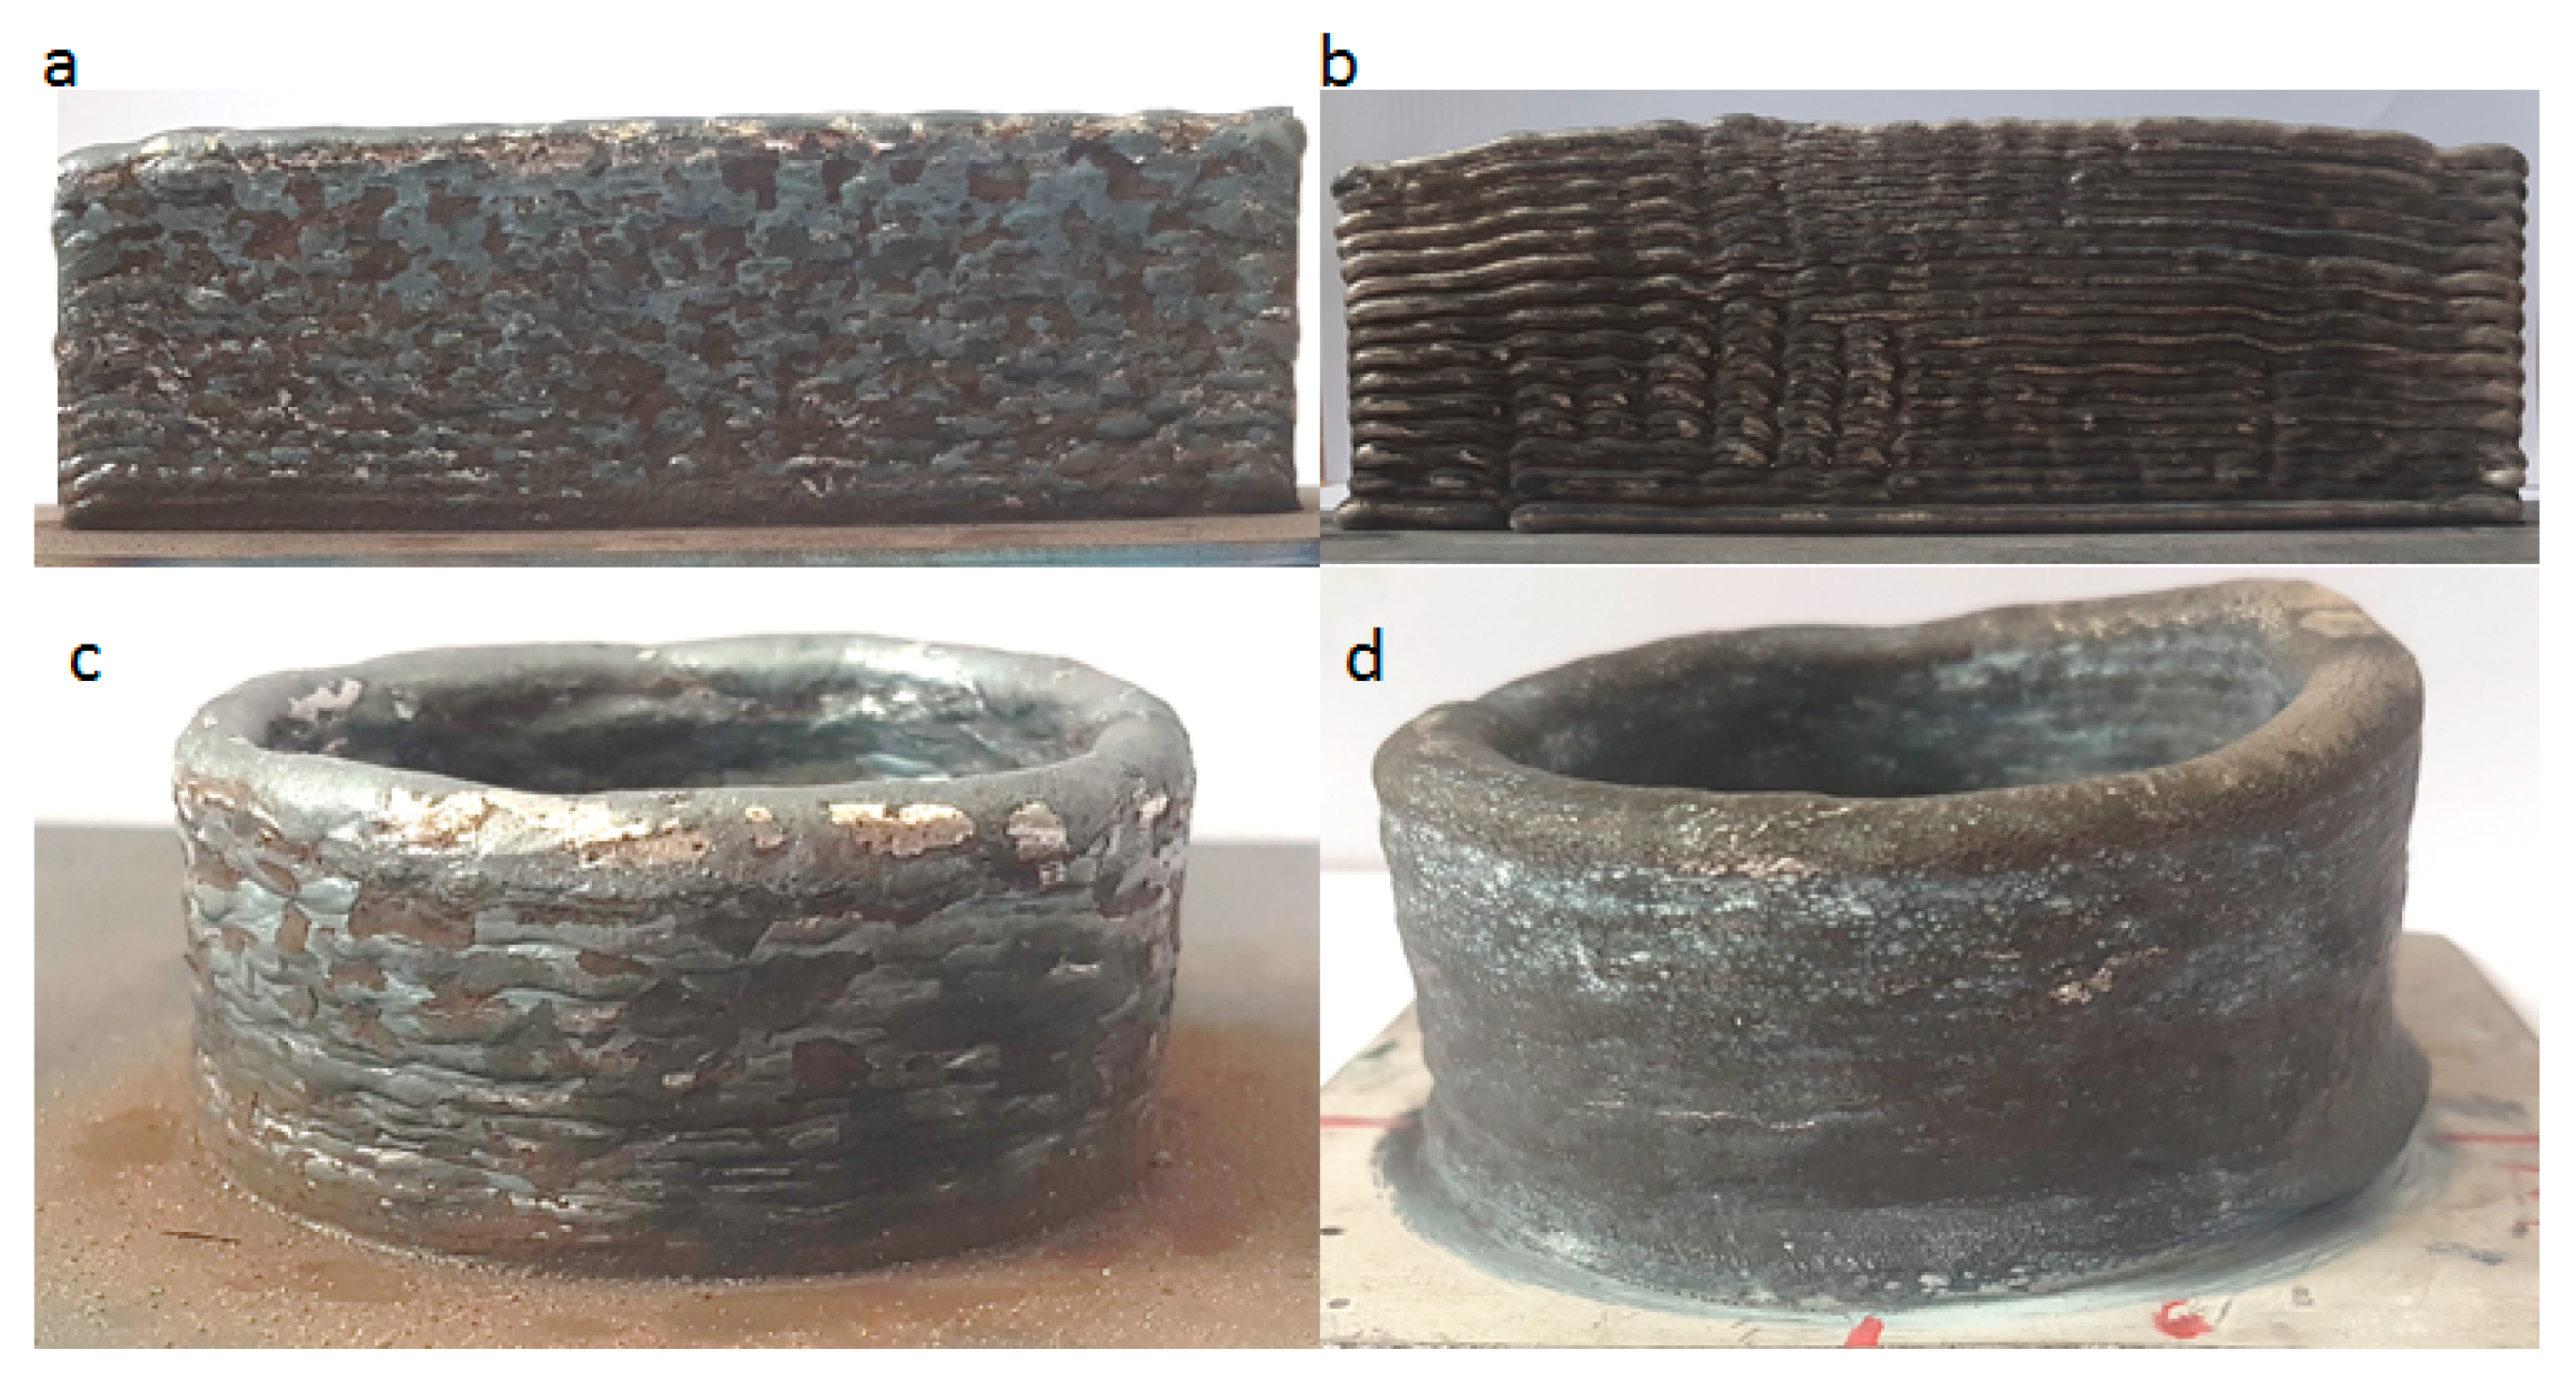
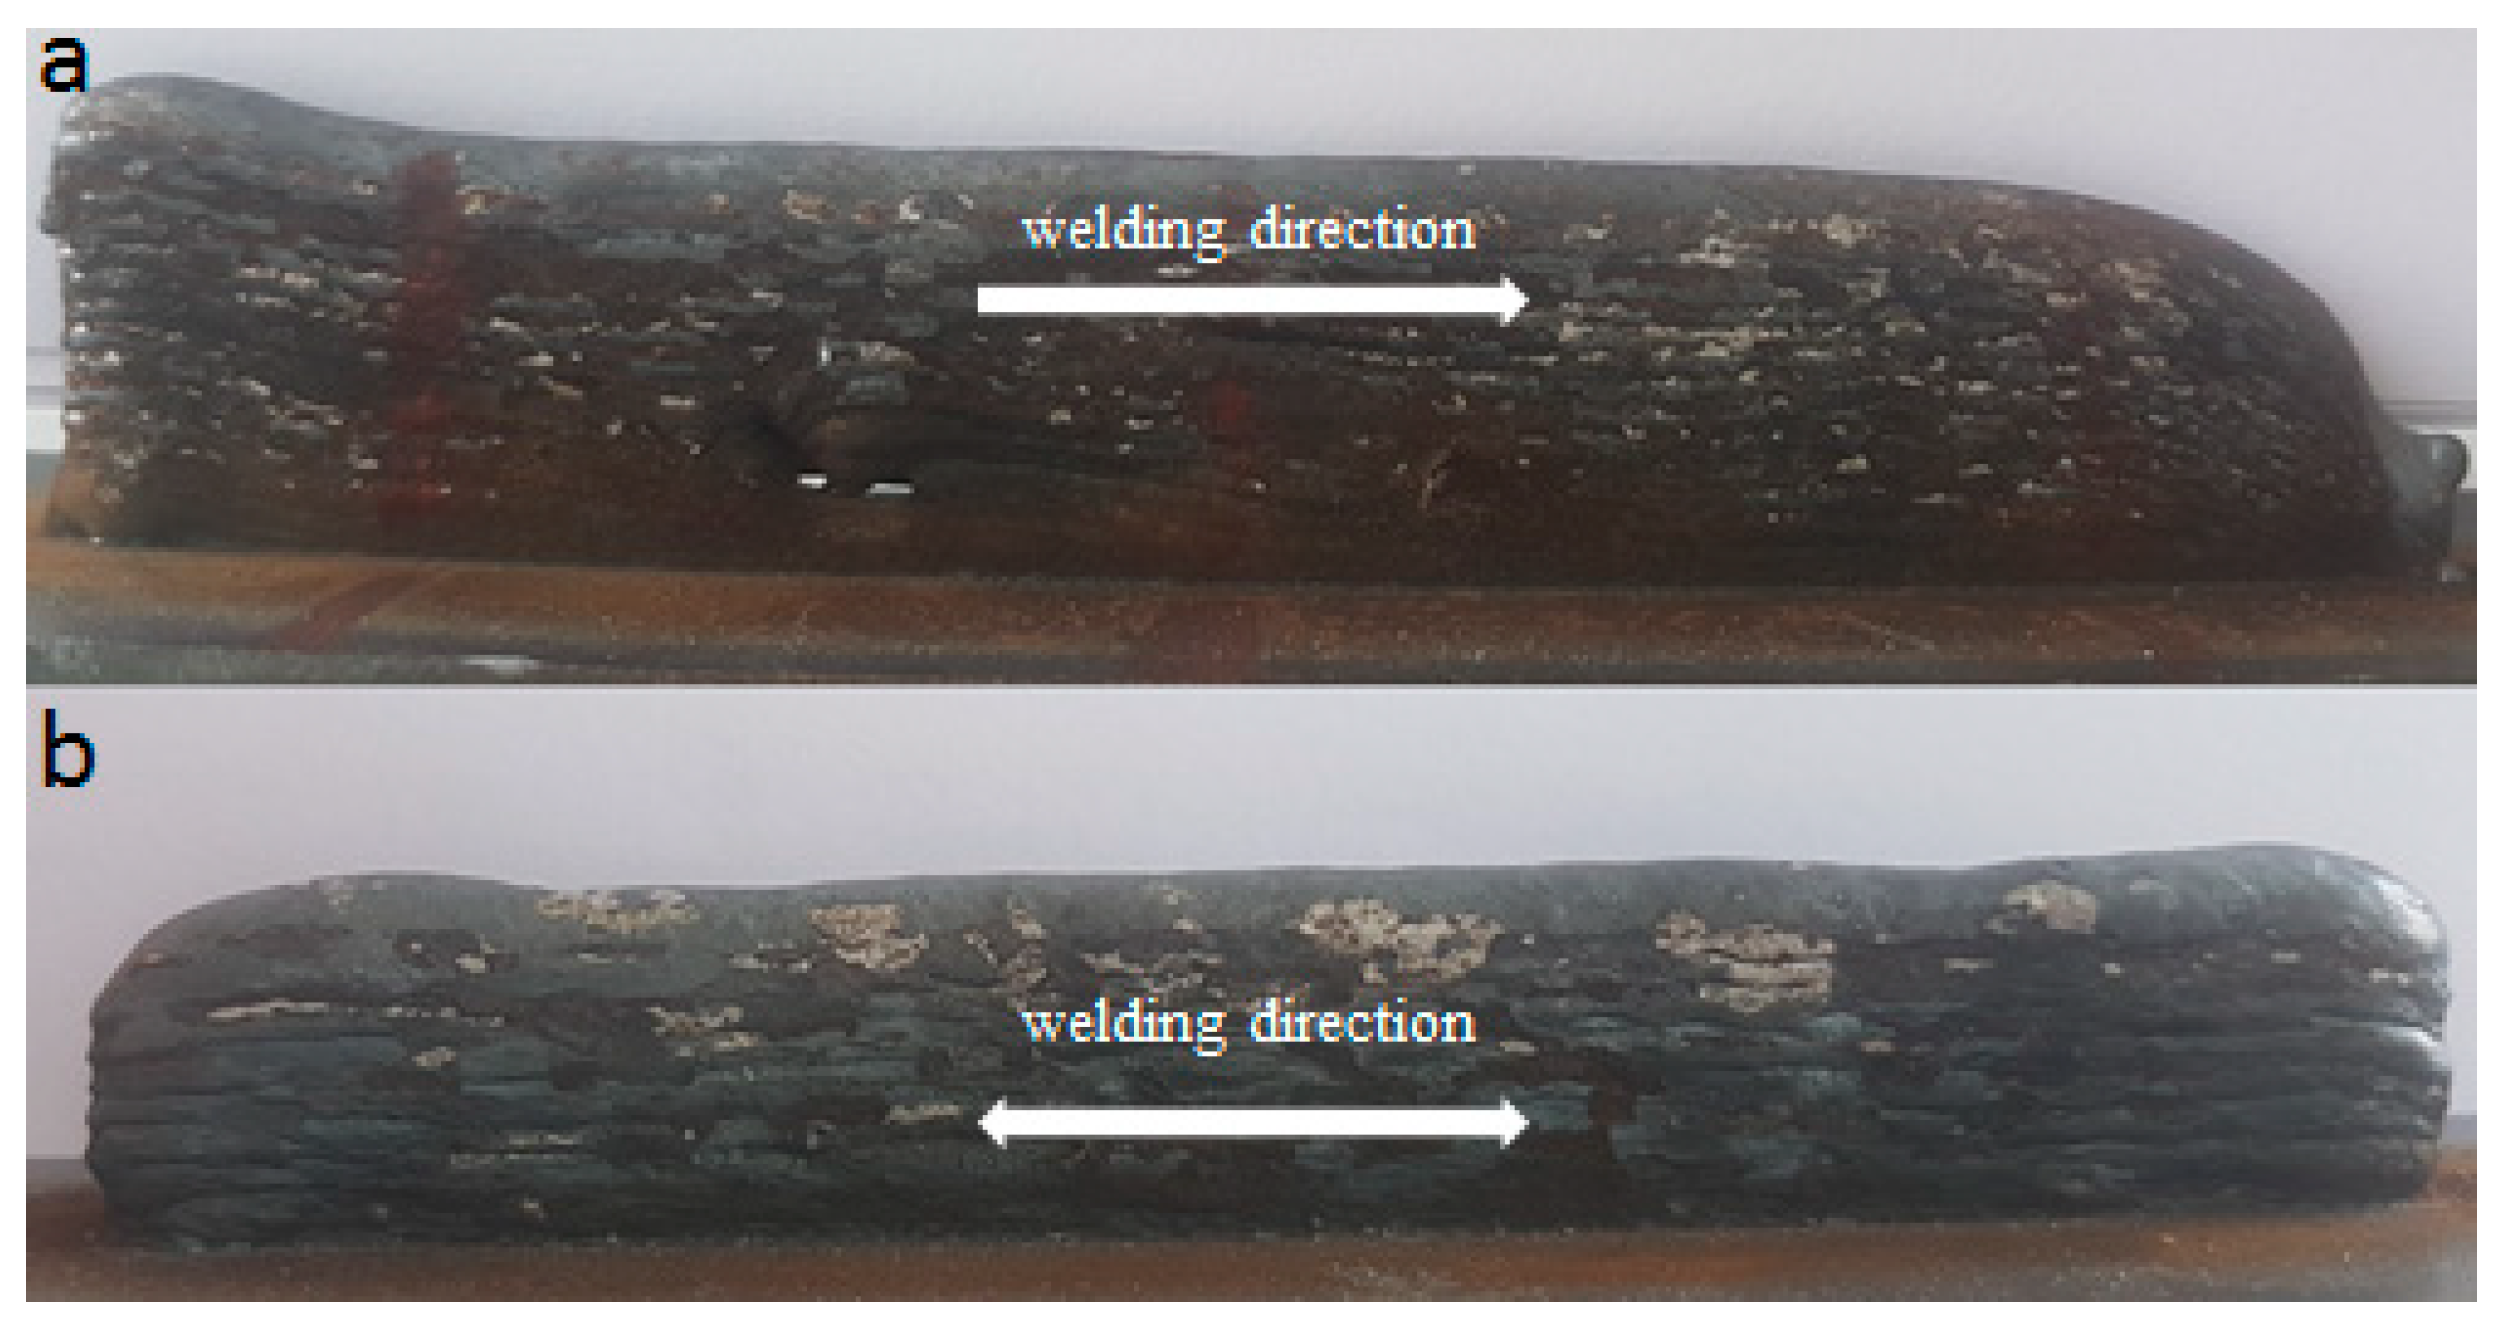
- 200-mm-long walls with minimum of 20 layers, produced by a continuous process from both sides or by discontinuous welding from one side.
- Pipes with 20 layers and a diameter of 60 mm, produced by continuous process by a combination of circles, where the z-level shift was done immediately after completing the circle below.
- G4Si1 with vwire = 2.5 m/min and current I = 90–110 A, voltage U = 11.5–13 V;
- G4Si1 with vwire = 5.0 m/min and current I = 135–165 A, voltage U = 13–14.5 V;
- AZ31 with vwire = 2.5 m/min and current I = 35–40 A, voltage U = 9–11 V;
- AZ31 with vwire = 5.0 m/min and current I = 45–55 A, voltage U = 11–12 V;
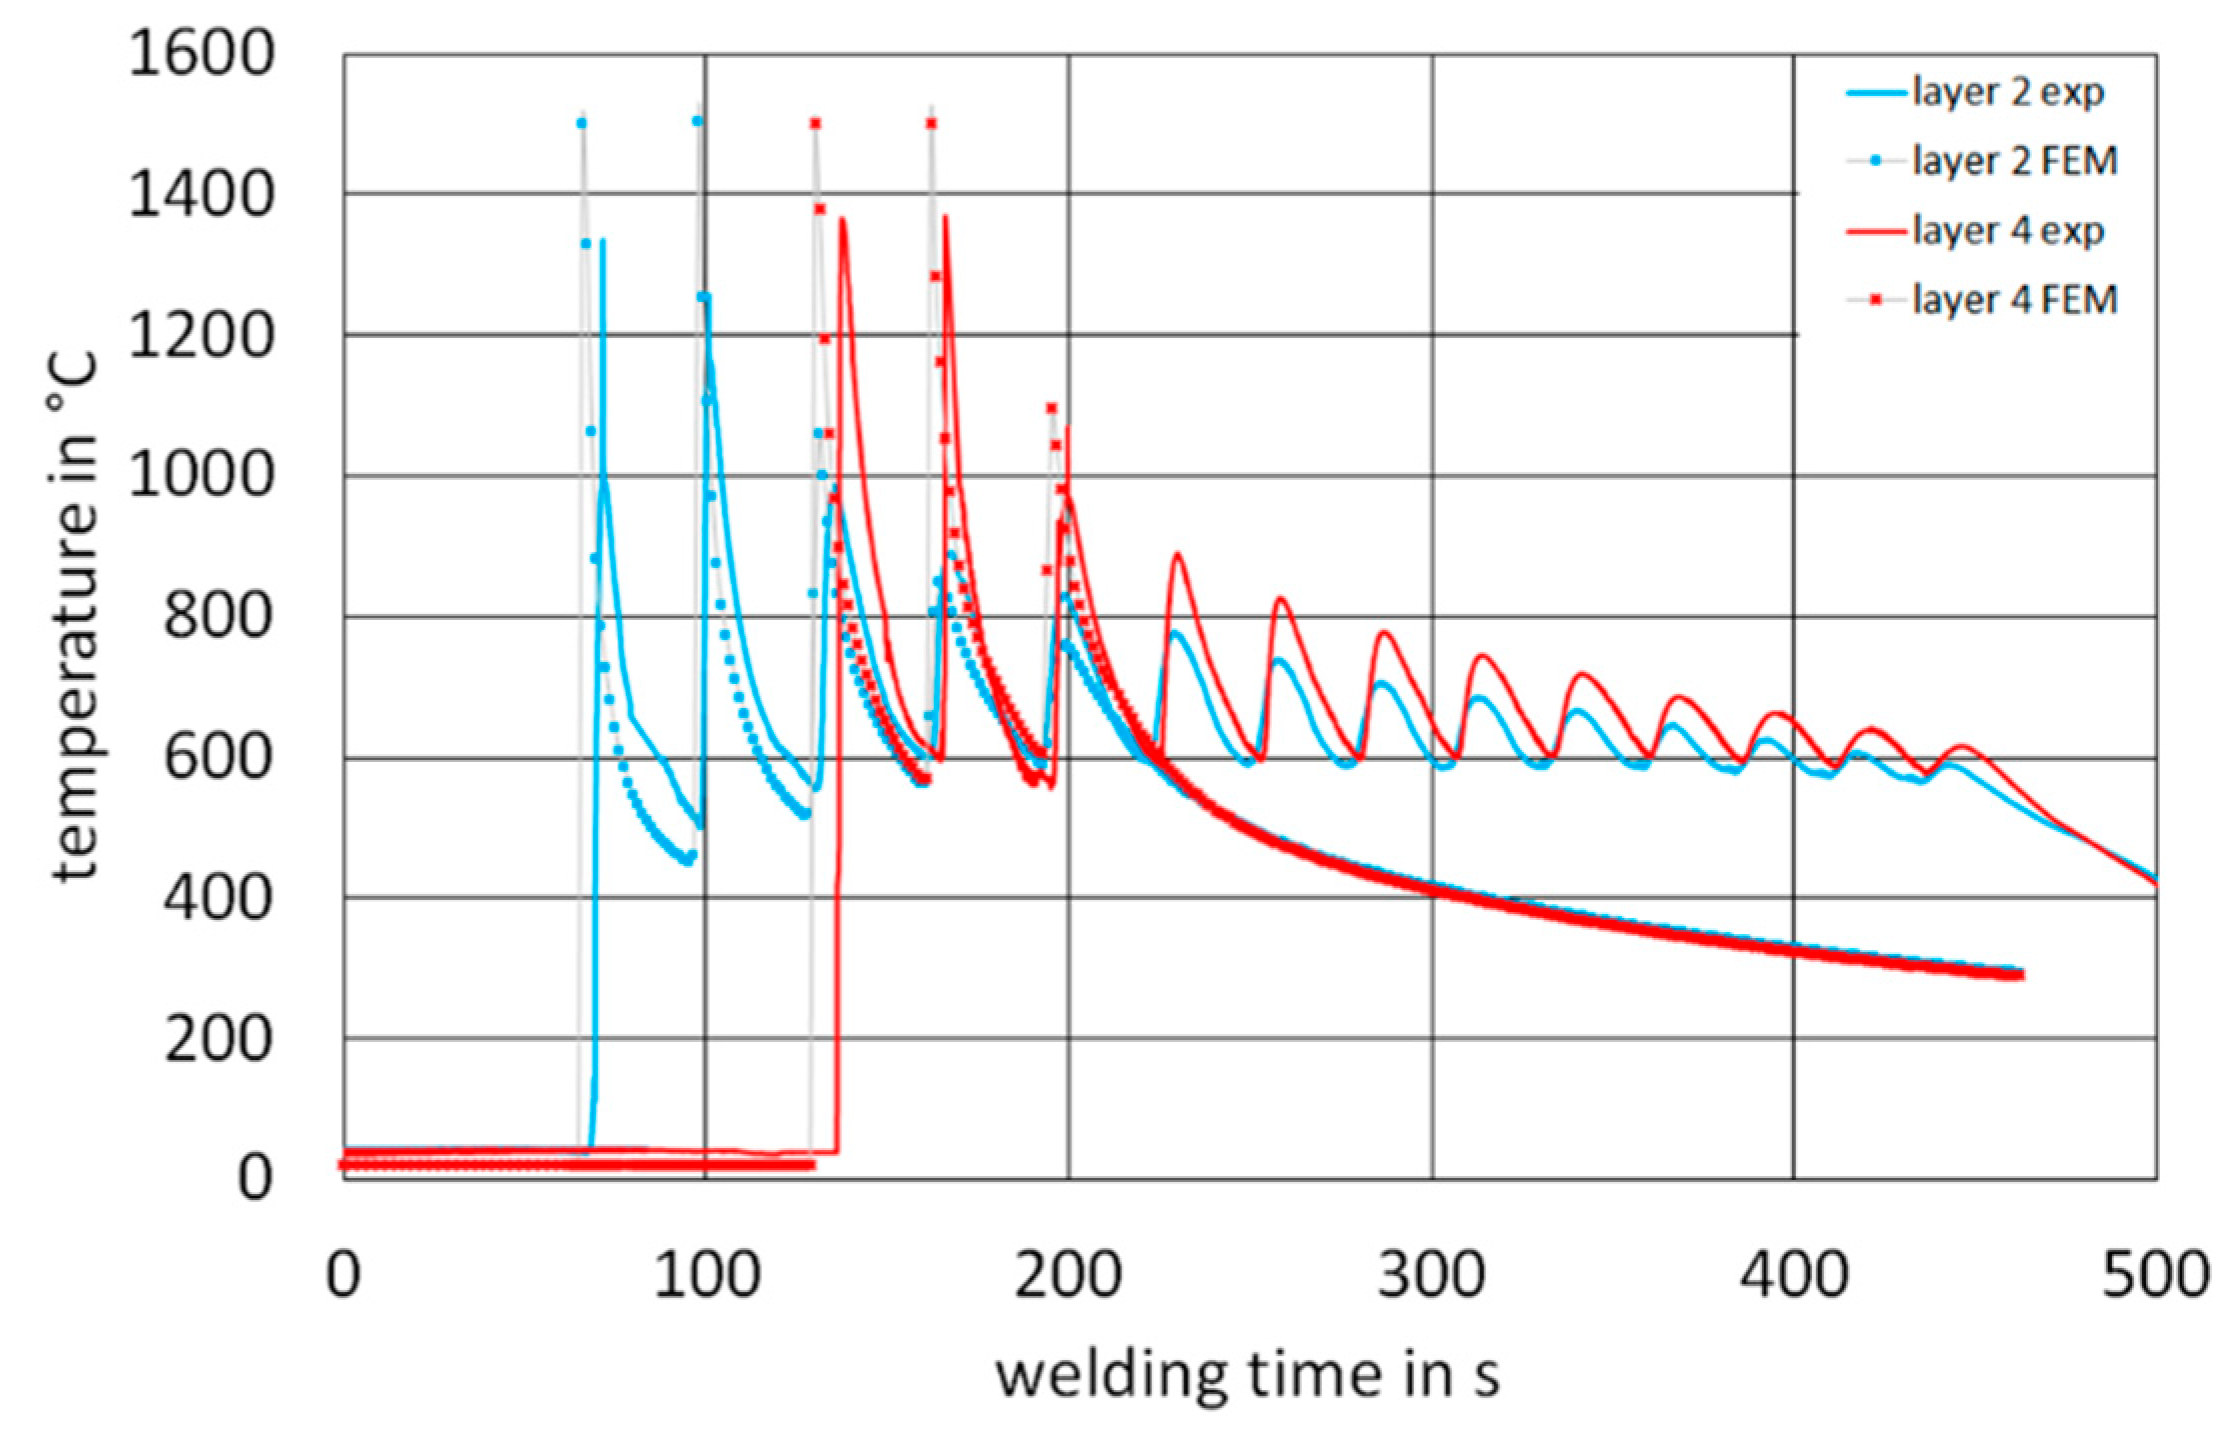
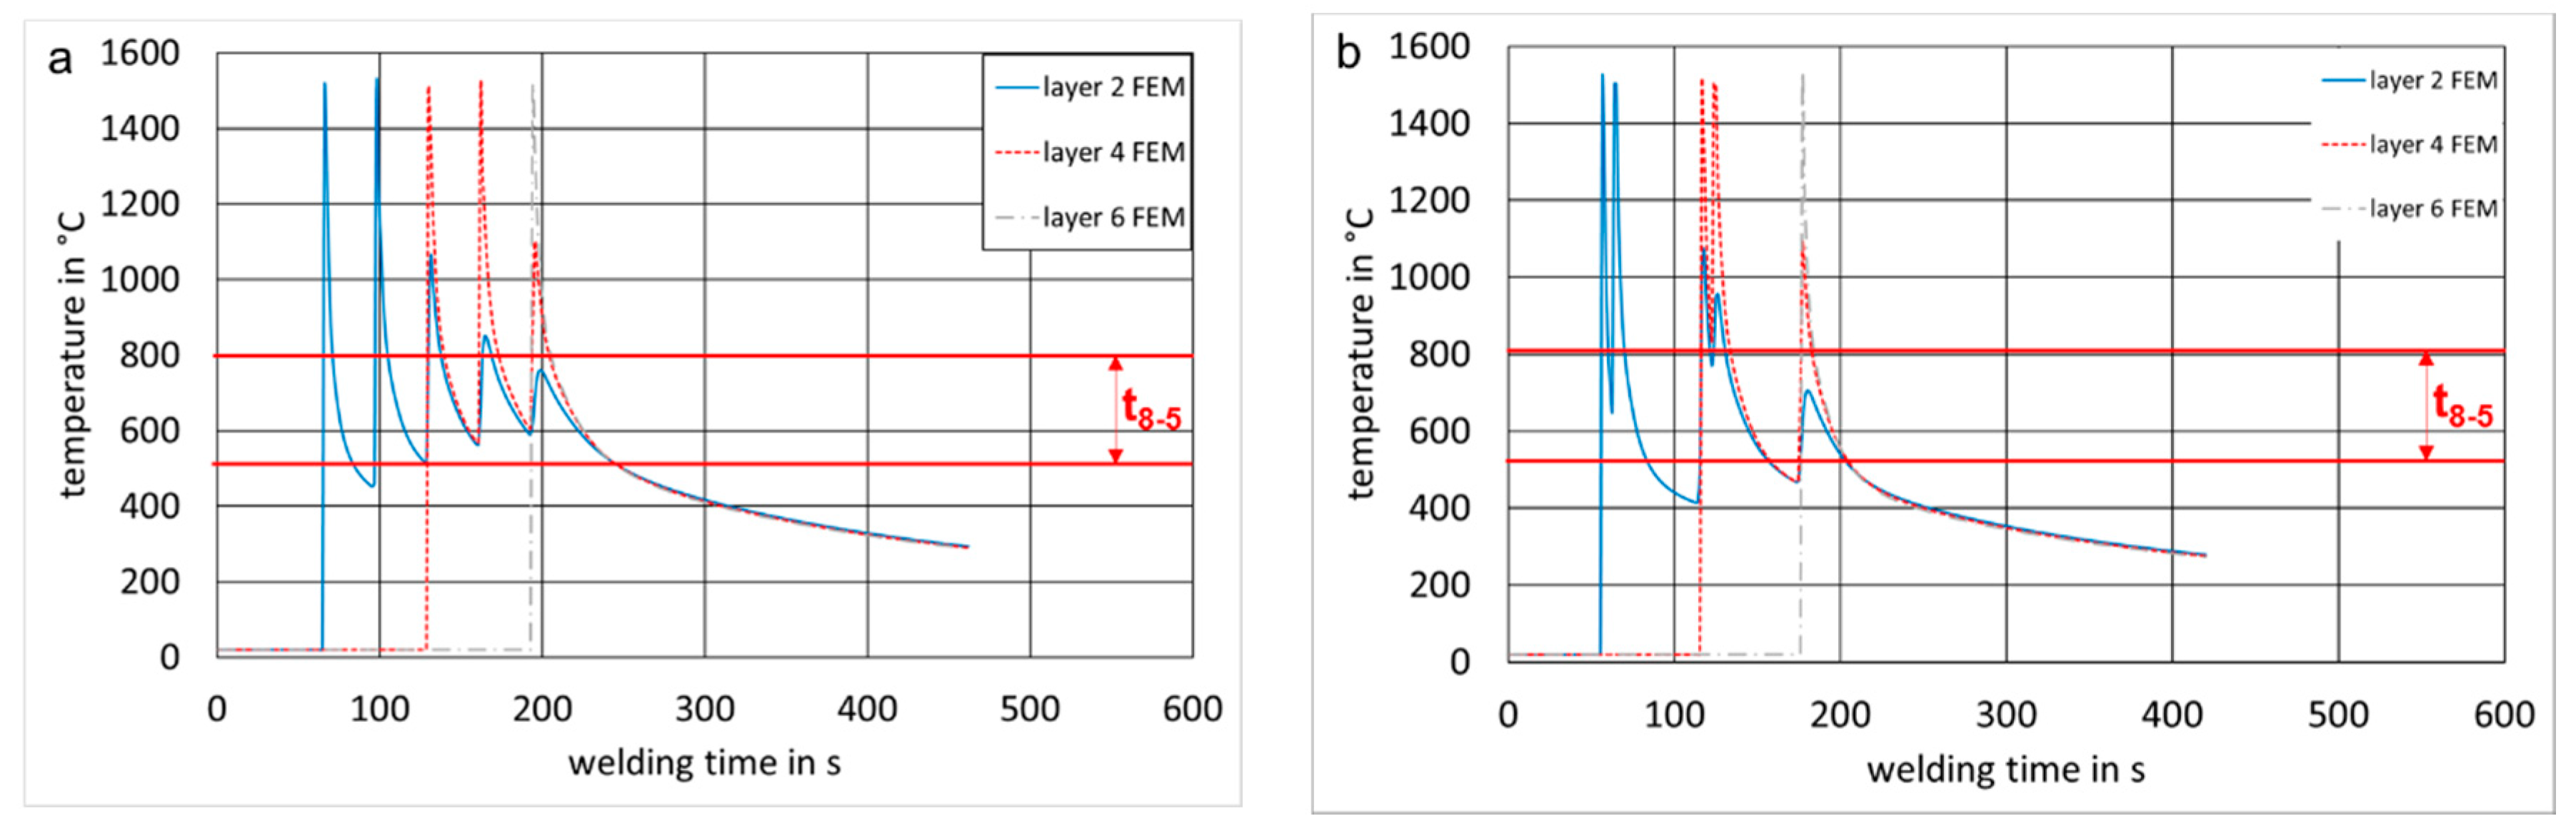
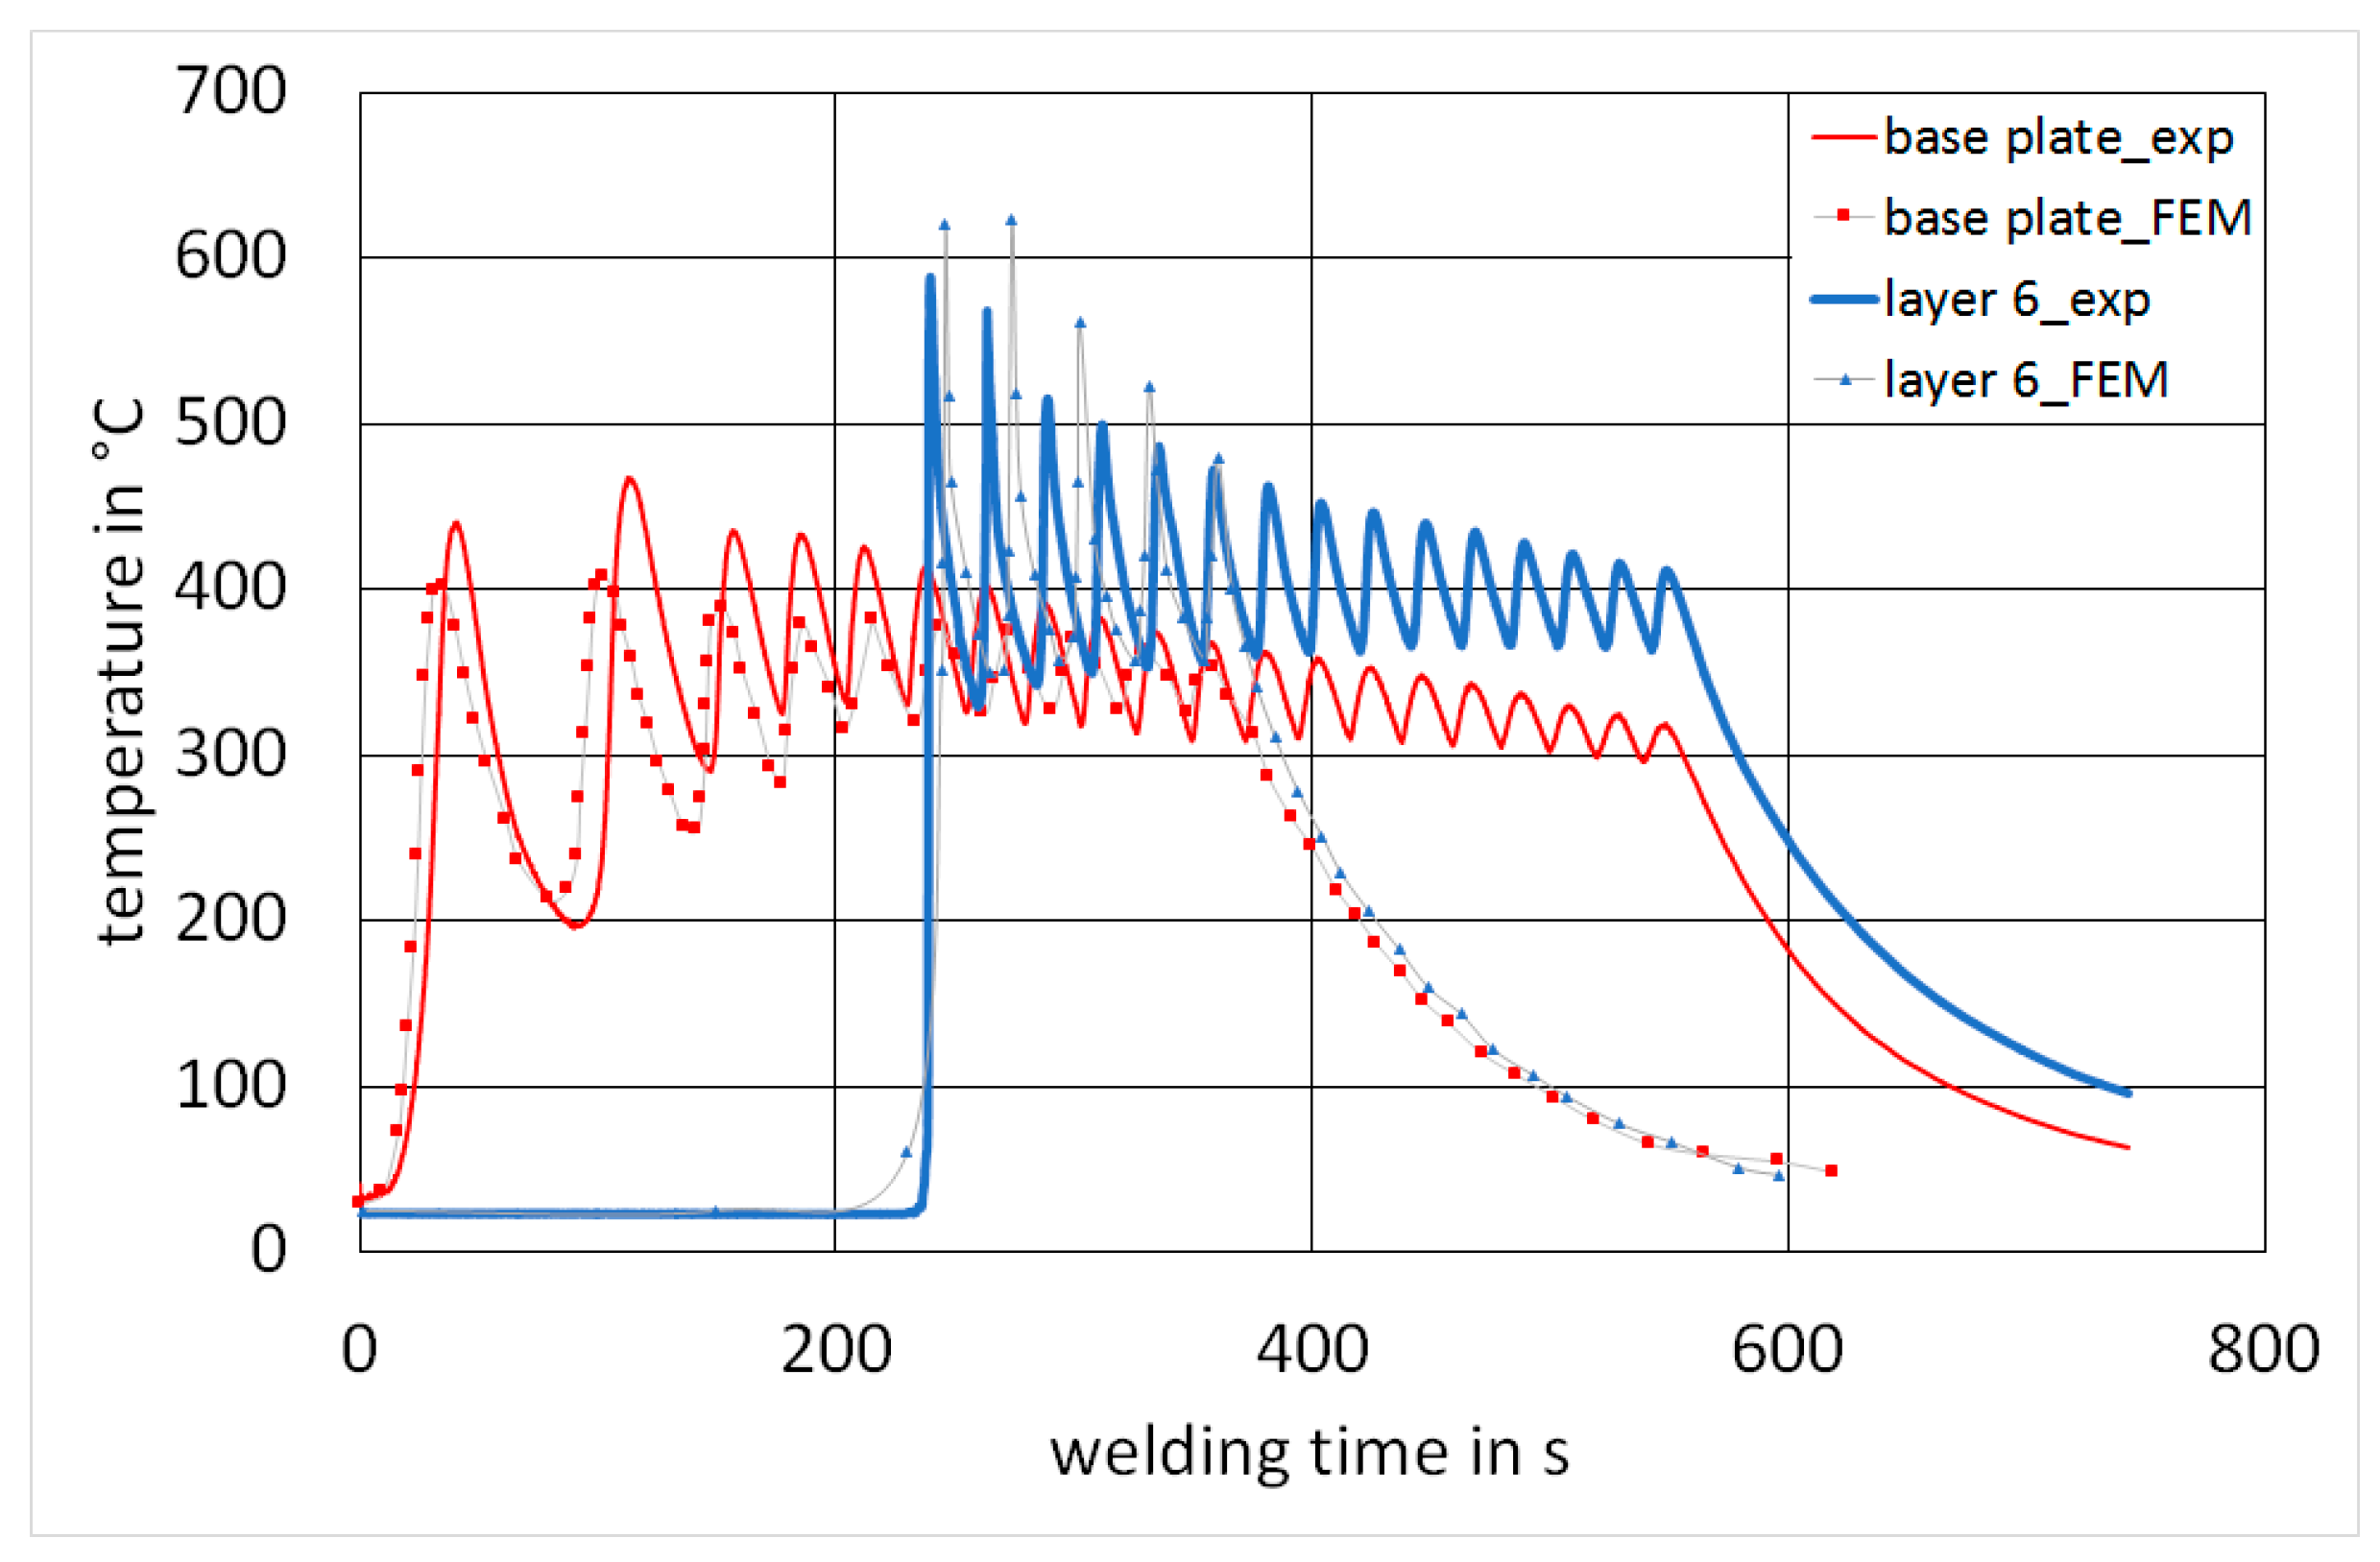
4. Simulation and Experiments for WAAM
5. Conclusions
Author Contributions
Funding
Acknowledgments
Conflicts of Interest
References
- Gebhardt, A. Additive Fertigungsverfahren: Additive Manufacturing und 3D-Drucken für Prototyping-Tooling-Produktion; Carl Hanser Verlag: Munich, Germany, 2016; ISBN 978-3-446-44401-0. [Google Scholar]
- EN ISO 17926-2:2015. Additive Manufacturing. General principles. Part 2: Overview of Process Categories and Feedstock; International Organization for Standardization: Geneva, Switzerland, 2015. [Google Scholar]
- Ogino, Y.; Asia, S.; Hirata, Y. Numerical simulation of WAAM process by a GMAW weld pool model. Weld. World 2018, 62, 393–401. [Google Scholar] [CrossRef]
- Frazier, W. Metal additive manufacturing: A review. J. Mater. Eng. Perform. 2014, 23, 1917–1928. [Google Scholar] [CrossRef]
- Ding, J.; Pan, Z.; Cuiuri, D.; Li, H. Thermo-mechanical analysis of wire and arc additive layer manufacturing process on large multi-layer parts. Comput. Mater. Sci. 2011, 50, 3315–3322. [Google Scholar] [CrossRef]
- Brandl, E.; Baufeld, B.; Leyens, C.; Gault, R. Additive manufactured Ti-6Al-4V using welding wire—Comparison of laser and arc beam deposition and evaluation with respect to aerospace material specifications. Physic. Procedia 2010, 5, 595–606. [Google Scholar] [CrossRef]
- Derekar, K.S. A review of wire arc additive manufacturing and advances in wire arc additive manufacturing of aluminium. Mater. Sci. Technol. 2018, 34, 895–916. [Google Scholar] [CrossRef]
- Kazanas, P.; Deherkar, P.; Almeida, P.; Lockett, H.; Williams, S. Fabrication of geometrical features using wire and arc additive manufacture. Proc. Inst. Mech. Eng. Part B J. Eng. Manuf. 2012, 226, 1042–1051. [Google Scholar] [CrossRef]
- Schmidt, M.; Merklein, M.; Bourell, D.; Dimitrov, D.; Hausotte, T.; Wegener, K.; Overmeyer, L.; Vollertsen, F.; Levy, G.-N. Laser based additive manufacturing in industry and academia. CIRP Ann. Manuf. Technol. 2017, 66, 561–583. [Google Scholar] [CrossRef]
- Szost, B.A.; Terzi, S.; Martina, F.; Boisselier, D.; Prytuliak, A.; Pirling, T.; Hofmann, M.; Jarvis, D.J. A comparative study of additive manufacturing techniques: Residual stress and microstructural analysis of CLAD and WAAM printed Ti-6Al-4V components. Mater. Des. 2016, 89, 559–567. [Google Scholar] [CrossRef]
- Bock, F.E.; Froend, M.; Herrnring, J.; Enz, J.; Kashaev, N.; Klusemann, B. Thermal analysis of laser additive manufacturing of aluminium alloys: Experiment and simulation. AIP Conf. Proc. 2018, 1960, 140004. [Google Scholar] [CrossRef]
- Tran, H.-S.; Tchuindjang, J.T.; Paydas, H.; Mertens, A.; Jardin, R.T.; Duchêne, L.; Carrus, R.; Lecomte-Beckers, J.; Habraken, A.M. 3D thermal finite element analysis of laser cladding processed Ti-6Al-4V part with microstructural correlations. Mater. Des. 2017, 128, 130–142. [Google Scholar] [CrossRef]
- Ferro, P.; Berto, F.; James, N.M. Asymptotic residual stress distribution induced by multipass welding processes. Int. J. Fatigue 2017, 101, 421–429. [Google Scholar] [CrossRef]
- Graf, M.; Pradjadhiana, K.P.; Haelsig, A.; Manurung, Y.H.P.; Awiszus, B. Numerical simulation of metallic wire arc additive manufacturing (WAAM). AIP Conf. Proc. 2018, 1960, 140010. [Google Scholar] [CrossRef]
- Schwenk, C. FE-Simulation des Schweißverzugs Laserstrahlgeschweißter Dünner Bleche, Dissertation; Fraunhofer IWM: Freiburg im Breisgau, Germany, 2001. [Google Scholar]
- Denlinger, E.R. Thermo-Mechanical Model Development and Experimental Validation for Metallic Parts in Additive Manufacturing. Ph.D. Thesis, The Pennsylvania State University, State College, PA, USA, 2015. [Google Scholar]
- Miehe, A. Numerical Investigation of Horizontal Twin-Roll Casting of the Magnesium Alloy AZ31. Ph.D. Thesis, Technische Universität Bergakademie, Freiberg, Germany, 2014. [Google Scholar]
- Dieckmann, U. Calculation of steeldata using JMatPro. COMAT Recent Trends Struct. Mater. 2012, 21, 11. [Google Scholar]
- Montevecchi, F.; Venturini, G.; Scippa, A.; Campatelli, G. Finite element modelling of wired-arc additive manufacturing process. Procedia CIRP 2016, 55, 109–114. [Google Scholar] [CrossRef]
- Hoefer, K.; Haelsig, A.; Mayr, P. Arc-based additive manufacturing of steel components—Comparison of wire- and powder-based variants. Weld. World 2017, 62, 243–247. [Google Scholar] [CrossRef]
- Meyer, T. Ein Beitrag zur Auslegung temperierter Tiefziehwerkzeuge für die Umformung von Magnesiumfeinblechen. Ph.D. Thesis, Technische Universität Bergakademie, Freiberg, Germany, 1975. [Google Scholar]
- Goldak, J.; Chakravarti, A.; Bibby, M. A new finite element model for welding heat source. Metall. Trans. B 1984, 15, 299–305. [Google Scholar] [CrossRef]


| Parameter | Symbol | Unit | G4Si1 | AZ31 | |
|---|---|---|---|---|---|
| Wire feed | vwire | m/min | 2.5 | 5 | 5 |
| Welding speed | vwelding | cm/min | 40 | 40 | 40 |
| Half width | a | mm | 2 | 3 | 3 |
| Depth | b | mm | 2 | 3 | 3 |
| Front length | cf | mm | 2 | 2 | 2 |
| Rear length | cr | mm | 3 | 3 | 6 |
© 2018 by the authors. Licensee MDPI, Basel, Switzerland. This article is an open access article distributed under the terms and conditions of the Creative Commons Attribution (CC BY) license (http://creativecommons.org/licenses/by/4.0/).
Share and Cite
Graf, M.; Hälsig, A.; Höfer, K.; Awiszus, B.; Mayr, P. Thermo-Mechanical Modelling of Wire-Arc Additive Manufacturing (WAAM) of Semi-Finished Products. Metals 2018, 8, 1009. https://doi.org/10.3390/met8121009
Graf M, Hälsig A, Höfer K, Awiszus B, Mayr P. Thermo-Mechanical Modelling of Wire-Arc Additive Manufacturing (WAAM) of Semi-Finished Products. Metals. 2018; 8(12):1009. https://doi.org/10.3390/met8121009
Chicago/Turabian StyleGraf, Marcel, Andre Hälsig, Kevin Höfer, Birgit Awiszus, and Peter Mayr. 2018. "Thermo-Mechanical Modelling of Wire-Arc Additive Manufacturing (WAAM) of Semi-Finished Products" Metals 8, no. 12: 1009. https://doi.org/10.3390/met8121009
APA StyleGraf, M., Hälsig, A., Höfer, K., Awiszus, B., & Mayr, P. (2018). Thermo-Mechanical Modelling of Wire-Arc Additive Manufacturing (WAAM) of Semi-Finished Products. Metals, 8(12), 1009. https://doi.org/10.3390/met8121009