Article

Effects of Heterogeneous Microstructures on the Strain Hardening Behaviors of Ferrite-Martensite Dual Phase Steel

Department of Engineering Mechanics and Innovation Center for Advanced Ship and Deep-Sea Exploration, School of Naval Architecture, Ocean and Civil Engineering, Shanghai Jiao Tong University, Shanghai 200240, China
*
Authors to whom correspondence should be addressed.
Metals 2018, 8(10), 824; https://doi.org/10.3390/met8100824
Submission received: 17 September 2018 / Revised: 2 October 2018 / Accepted: 11 October 2018 / Published: 13 October 2018

Abstract

:
The complex strain hardening behaviors of dual phase (DP) steel are subjected to the heterogeneous microstructures. The current work aims to predict the strain hardening behaviors of ferrite-martensite DP steel, focusing on the effects of heterogeneous microstructure on mechanical properties. The flow stress of material was calculated based on the dislocation-based work-hardening model with considering the multi-boundaries hardening. The ferrite-martensite phase boundary percent and grain shape factor were selected as the heterogeneous feature parameters, which were introduced into the new proposed model. The theoretical calculated stress-strain responses were verified with experimental results using the tensile test. The model with the boundary strengthening consideration has more accurate results. The parameter effects of ferrite-ferrite boundary (FFB) spacing, ferrite-martensite boundary (FMB) percent, and grain shape factor on the flow stress-strain curve were researched.

1. Introduction

Dual phase (DP) steels have been great development due to the good mechanical performance that could meet the requirements for the increased formability and weight reduction in automotive industry simultaneously [1]. Ferrite-martensite DP steels is one of the most important DP steel [1,2]. Ferrite-martensite DP steels exhibit a superior combination of good strength and ductility [2], which is characterized by a microstructure consisting of hard martensite islands embedded in a relatively soft ferrite matrix. The macro mechanical behaviors of DP steels are relied on the features of micro phases directly. The ever-increasing demands for industrial manufacture in DP steel have inspired further studies on its mechanical properties considering the non-uniform microstructures.
Recently, tremendous efforts of previous reports were placed on exploring the heterogenous microstructure characteristics of DP steel, including the grain size [3,4] and grain morphology of each phase [5]. The effects of volume fraction and grain morphology (size, shape, distribution) of martensite on the macroscopic stress-strain curves have been revealed [5,6,7,8,9,10]. Moreover, the evolution of plastic local deformation and strain distribution of DP steel has been researched considering the microstructure features [11,12,13,14]. In addition, the effects of the microstructures, ferrite content, and test temperature on the mechanical properties (i.e., tensile properties, fatigue behaviors, and crack propagation properties) of austenitic-ferrite duplex stainless steel were researched as well [15,16,17,18,19,20,21,22].
The strain-hardening models based on the dislocation pile-ups were used to explain the hardening behaviors of DP steels. The overall dislocations were composed of geometrically necessary dislocations (GNDs) and statistically stored dislocations (SSDs). The GNDs were generated to maintain the deformation compatibility, which was related to the shape changing of crystal [23,24,25]. The SSDs were randomly trapped and generated result in the work hardening of each single phase [25,26]. The SSD density has been treated as dynamic annihilation and the SSDs models of individual phases in DP steels have been proposed [11,25,26]. In 1970, Ashby studied the deformation and work-hardening mechanics of dual-phase materials based on the both dislocation densities [27]. The GNDs models were developed to describe the indentation size effect for crystalline materials [28,29,30]. However, the conventional models with grain shape effects on the hardening behaviors are scarcely reported.
To understand the micro-mechanical behavior better, there existed some models divided the microstructures into several regions with different mechanical properties. The ferrite matrix was divided into two regions considering with the boundaries hardening to predict the material flow stress [31]. The stress of ferrite phase, ferrite-martensite boundary (FMB) layer and martensite phase have been defined to predict the overall stress-strain curve considering the GNDs effects [32]. The intermediate layer with GND density has been inserted between the matrix and the particles to study the mechanical properties [33,34]. The properties of the region between ferrite and martensite phases has been studied by setting up an independent region between ferrite and martensite with different phase boundary layers [34,35].
The microstructure characteristics and stress-strain models have been studied to explain the strain-hardening behaviors. However, the hardening model of DP steel considering with the grain morphology parameters including grain shape factor, martensite grain-boundary coverage ratio, and boundaries strengthening have rarely been reported. Moreover, the GNDs effects on the FMB region under uniaxial deformation are scarce as well. Therefore, further studies about the strain hardening model of DP steels taking grain morphology and boundary hardening into account under uniaxial tension are still necessary.
In this paper, a combined strain-hardening model based on dislocation evolution was established to analyze the strain-hardening behaviors of DP steel. The microstructures of DP steel were divided to different regions which have their own stress-strain curves. The grain shape factor and relative boundary percent as the microstructural parameters were added to this predict model. The dislocation-based model was verified by uniaxial test of DP600 steel. The strain hardening behaviors were calculated to evaluate the strain hardening mechanism of DP steel. The effects of boundaries strengthening and microstructural parameters on the work hardening behaviors of DP steel were investigated.

2. Theory Model

The heterogeneous of microstructures and mechanical properties result in a complexity of the strain-hardening behaviors of DP steel. To predict the mechanical behaviors better, the FMB coverage ratio and grain shape factor are selected as the microstructural parameters and added into this hardening model. In addition, the strengthening contribution of DP steel consist of the SSD and GND densities.
The microstructures were divided into five different regions: ferrite and martensite interior regions, ferrite-ferrite boundary (FFB) layer, ferrite-martensite boundary (FMB) layer, and martensite-martensite boundary (MMB) region. The schematic of different regions and phase boundary layers is shown in Figure 1. A modeled Kock-Mecking model with the grain morphology consideration was built to analyze the hardening behaviors of internal regions of ferrite and martensite phase. For a single-phase boundary (FFB/MMB) region, the grain boundary dislocations (GBDs) hardening model has been introduced for the contribution of back stress. The strength of FMB region was calculated by an evolution law for the GNDs that was calculated by a modified cell model.
The ever-increasing demands for strength and ductility in DP steels have inspired increasing research on strain hardening mechanism [36,37]. In this paper, the strain hardening mechanism were reflected based on the dislocation evolution including SSDs and GNDs. Because of the GNDs mainly accumulate along the common boundaries of both phases, the intermediate boundary layers with their own stress-strain curves were proposed to explain the strain-hardening behaviors of material precisely by Kadkhodapour and Joshi [34,35]. The flow stress of DP steel is affected by the component regions, which have different flow curves. The flow stress-strain curve of DP steel is developed by a presumption of the deformation-energy conservation between the material and individual phases [38].
σ = σ 0 + f i B i σ i  
here: σ0 and σ are the yield strength and the flow stress of multi-phase steels; fi, Bi, and σi are the volume fraction, strain coefficient, and plastic stress of i-th phase, respectively.

2.1. Hardening Behaviors of Grain Internal Region

Assumption the deformation in single grain interior is uniform and the hardening response of grain internal region is caused only by SSDs. The SSDs evolve with ongoing plastic deformation of each phase. The evolution law of the SSD density is treated as a competition result between accumulation and annihilation with a shear strain for dislocation glide. It is assumed by Kock-Mecking [23] and Perlade [39], which can be described as
d ρ S i d ε = M Q i [ 1 b i ( g i d i + K i ρ S i ) F i ρ S i ]  
where the subscript i denotes different phases of ferrite and martensite; ρ S i is the SSD density stored in grain internal region; bi is Burgers vector and ε is the corresponding overall plastic strain of DP steel.
The dislocation storage is 1 b i ( g i d i + K i ρ S i ) , which depends on the grain size di, material parameter gi, and storage constant Ki. F i ρ S i is the SSD annihilation term. The recovery parameter Fi is a constant which is relied on temperature and strain-rate [14].
The strain of individual phases and material overall strain have a nonlinear relationship as shown in Equation (3) [11]. This relation has been widely applied in dual phase material to reveal the strain character between phases and material [11,26,37,40].
ε i = ε B i  
B i = exp ( a i 1 + a i 2 ε )  
Q i = ( 1 + a i 2 ε ) B i  
where a i 1 and a i 2 are the material parameter; the values of Bi and Qi are changing with the overall strain.
The relationship between plastic flow stress of different phases and intrinsic SSD density is assumed to obey the Taylor relationship expression, which can be described as
σ n i = M τ = α M μ i b i ρ s i  
where σ n i and μi are the flow stress of grain interior and shear module of individual phases. M, τ, and α are Taylor factor, shear stress, and material parameter, respectively.

2.2. Single-Phase Boundary Hardening

Assumption the stress in the vicinity of single-phase (ferrite-ferrite/martensite-martensite) grain boundary is the result of interior SSD strengthening combined with its grain boundary strengthening. Dislocations accumulate randomly along the grain boundaries result in the net back stress increased until to reaching a critical value. Then the dislocations pass through the single-phase boundary and the density decreases. The stress in the boundary region is influenced by the grain boundary stored dislocations and the SSDs. The single-phase boundary strengthening change law mainly attribute to the boundary dislocation screening effect [41].
The averaged GBD density is deduced from the grain boundary surface density and the surface density of grain boundary per unit volume, which can be described as [42]
ρ GBD 1 λ d i
where ρ GBD is the GBD density; di is grain size of different phases and 1 λ is the GBD line length per surface area of the grain boundary.
The single-phase grain boundary hardening is caused by GBDs as the additional stress in whole grain. The stress in whole grain are calculated based on the model in [41,42], which can be described as
σ i i = M μ i b 2 π λ ( 1 ( 1 w d i ) λ * λ )  
where σ i i , M’, w, and λ* are the additional average stress in the whole grain size, generalized Taylor factor, the width of dislocation arrangement, and the minimal GBD spacing value, respectively.
When the grain size is on the order of the width of dislocation arrangement w, the additional average stress in grain can be described as
σ i i = M μ i b 2 π λ  
The additional stress in corresponding whole grain is shown in Equation (8). The additional stress in the grain boundary region can be calculated by the area percent of the grain boundary region to the area of whole grain. The stress in the boundary effect region can be described as
σ GBD = d i 2 w c i i S i σ i i  
where c i i is the single-phase grain boundary coverage ratio; Si is the grain shape parameter of individual phases.
Grain shape parameter Si is applied to describe the grain shape as shown in Equation (11). The shape coefficient represents the complexity of the grain shape and is independent of the grain size. In the case of circular grain, the grain shape parameter is equal 1.0. The more irregular grain shape has the larger grain shape parameter. It is defined as
S i = ( perimeter ) 2 4 π area  

2.3. Ferrite-Martensite Phase Boundary Hardening

The FMB dislocation array was calculated by using a modified cell model based on the model of particle reinforced metal-matrix composites in [40]. While in this paper, we consider the martensite particle has plastic deformation during the uniaxial deformation process.
A DP steel cell is obtained from DP steel directly with a martensite spherical particle at the center to ensure the cell have same martensite volume fraction with DP steel as shown in Figure 2. Thus, the relationships can be described as
f m = 4 3 π ( r d ) 3 = 4 3 π ( r R ) 3  
d = π R  
where r is the radius of martensite particle; R is the radius of horizontal cross-sectional of cylindrical cell; d is the height of cylindrical cell; and fm is the martensite volume fraction.
Because of the deformation incompatibility and the strength characteristics between different phases, GNDs emerge along the FMB in ferrite phase. The martensite particle is treated as undergoing the uniform deformation and no GNDs array generate in martensite phase. The ferrite particle has larger strain than martensite, which deforms earlier than martensite at initial period of deformation [11]. In order to calculate the GND density, we assume that there are four other cells, which have the same outline with the DP steel cell before the deformation [43]. The cell A is a pure ferrite cell and the cell B is ferrite-rigid cell, in which the rigid particle replaces the martensite particle of DP steel cell. The cell C is a pure martensite cell and the cell D consist of martensite matrix and a rigid particle. Cell A and cell B have the same strain, the outlines of the two cells are identical while the deformation fields inside are different. The different deformation field is filled by the GNDs array in cell B, thus the GNDs of ferrite can be calculated. The GNDs of martensite in cell D can be calculated in the same way. The mismatch of deformation between ferrite and martensite along the particle boundary is shown in Figure 3. Thus, the GNDs array in DP steel is equal to of the GNDs in cell B minus the GNDs in cell D.
To simplify the calculation of GNDs array during uniaxial tensile deformation, some assumptions were formulated to convert this problem into an indentation problem based on Duan’s study [40,43]. We assume the indentation deformation just enough make the tensile ellipse back to a circle. Figure 4 shows a schematic of the indentation deformation that is converted from the tensile deformation. The indentation area is equal to the mismatch of deformation between the ferrite and martensite phases boundary as shown in Figure 3.
Based on the principle of the material volume invariably during the deformation, the radius of the indentation area can be derived as
a f = r sin θ fc  
where the subscript f denotes ferrite phase, a f and θ fc are shown in Figure 4.
Similarly, the volume of the spherical martensite particle is equal to the volume of the ellipsoid after the tensile test. The following expression exists
sin θ fc = [ ( 1 + ε f ) 2 1 ] ( 1 + ε f ) 3 1  
where ε f is strain of ferrite phase, θ fc , r f and c f are shown in Figure 4.
Based on the model of [40,43] and the geometrical relationship in Figure 4, the contact area at ri is a ring element area that stored the array of GNDs. The slope of the indenter profile is obtained from Equation (14).
d c f d r f = ε f r f r 2 r f 2  
As shown in Figure 4, we assume that the dislocation loops as spaced equally along the surface of the indentation, then the slope can be described as
b s = d c f d r f  
where S is the space between single slip steps on the indentation surface.
The increment of the dislocation loops in the deformation area is
d λ f = 2 π r f d r f s  
which after integration is
λ f = 0 a f 2 π r f s d r f  
For the virtual cell D, the GNDs array can be calculated as the same way. The GNDs array Δλ of DP steel cell that are filled into the incompatible deformation can be described as
Δ λ = λ f λ m = π r 2 ε f θ f sin θ f 1 ( sin θ f ) 2 ) b π r 2 ε m θ m sin θ m 1 ( sin θ m ) 2 ) b  
The cell model for GNDs arrays in DP steel depends on the martensite grain size but is independent of the ferrite grain size form Equation (20). This conclusion agrees with Ramazani’s result that the GND region depends on the martensite particle size [44]. The distribution of GND layer is correlated with the martensite grain size from experimental and numerical simulations by Ramazani [44]. The thickness of the GND layer is approximately 25% of the martensite island sizes thus it be concluded as
l GND = 0.5 r  
where l GND is the thickness of the GND layer and r is the martensite particle size.
This result is applied to calculate the area of GND effect zone around with martensite particle. Half of the GND region volume V can be defined as
V = 2 3 π ( ( r + 0.5 l GND ) 3 r 3 ) = 61 96 π r 3  
The average GND density in the region influenced by GNDs in the cell model can be concluded as
ρ G = Δ λ V  
Combined with the Equations (20)–(23), the additional stress in FMB interface layer is calculated. Due to the uniform deformation of martensite phase, there is no GND density in martensite phase and the stress of GND effect region in ferrite phase can be described as
σ GND = M τ = α M μ f b f ρ S f + ρ G  
If the GND effect region is larger than the adjacent ferrite size, the ferrite interior stress and the FFB stress can be neglected.

2.4. Stress of Individual Phases
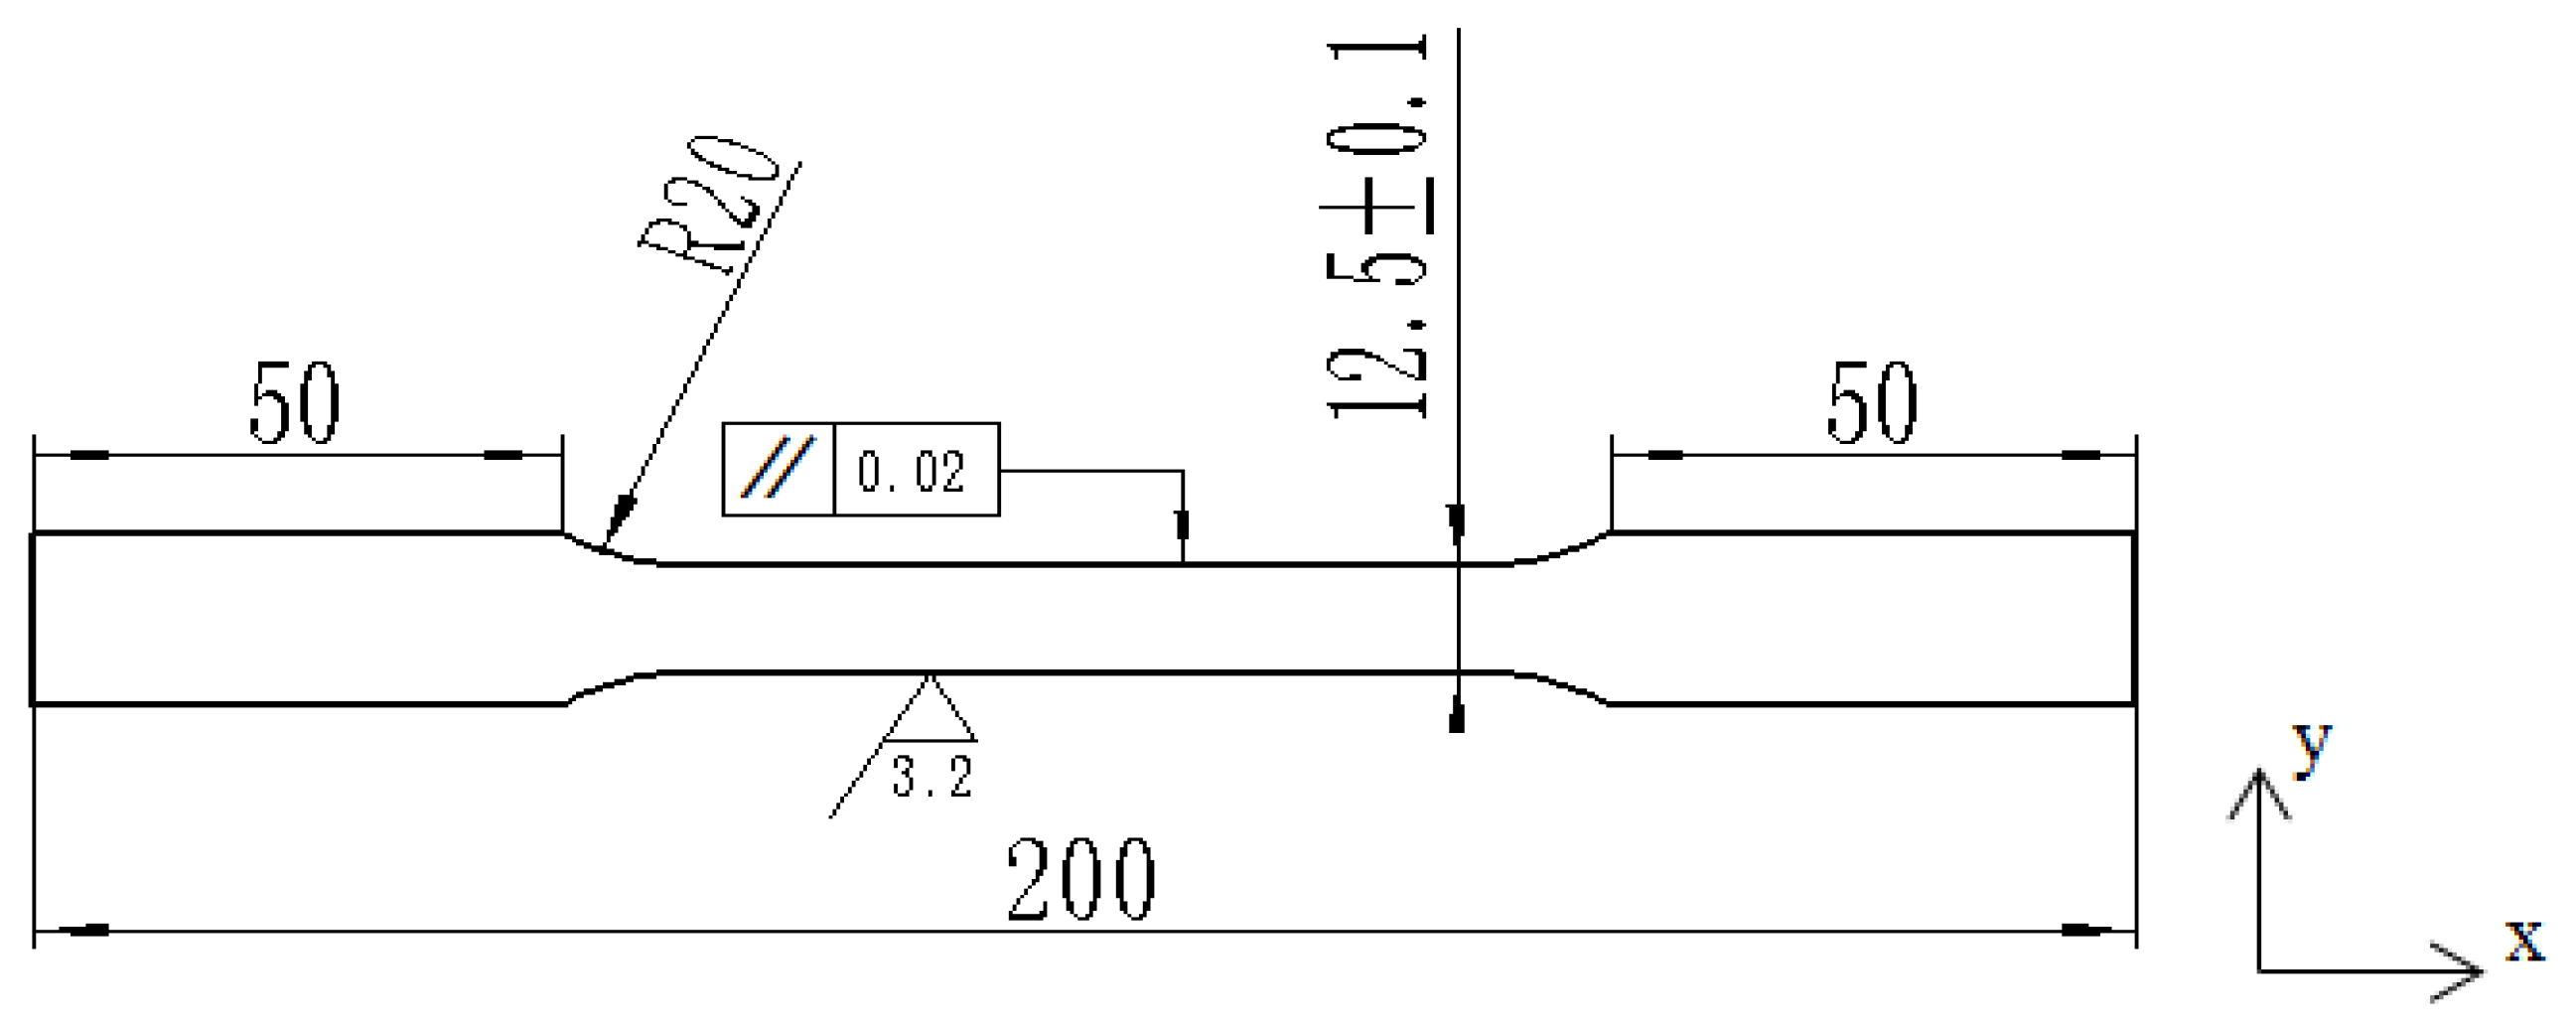
The microstructures of the DP steel were captured by an optical microscope (Shanghai Wanheng Precision Instruments Co., Ltd., Shanghai, China) during the tensile experiment. To predict the stress of the individual phases precisely, grain diameter di, grain shape parameter Si, and martensite relative grain-boundary coverage ratio c FM are added to the dislocation-based model. The martensite relative grain-boundary percentage c FM is the ratio of FMB length to the corresponding total ferrite boundary length. The sketch of relative grain-boundary coverage is shown in Figure 5.
The GNDs effect region areas of j-th martensite particle can be described as
S GND j = 0.25 d m j π d f h j  
where S GND j is the GNDs effect region areas of j-th martensite particle, h j is the proportion of j-th FMB length to total ferrite boundary length.
The plastic stress of ferrite phase σf with different grain size is composed by the ferrite interior region stress, FFB stress and FMB stress.
σ f = σ nf + c FF σ ff + j = 1 k d m j h j d f ( σ GND j σ nf c FF σ ff )  
here: σ GND j is the GNDs effect layer stress of j-th martensite particle, k is the total number of martensite particles that connect with the ferrite particle. The sum of h j has a relationship with the martensite grain-boundary coverage, which have following relationship
c FM = j = 1 k h j  
c FM + c FF = 1  
The martensite stress is caused by SSDs and GBDs that corresponding to the martensite interior stress and the MMB region stress. The martensite stress can be expressed as
σ m = σ nm + c MM σ mm  
where c MM is the proportion of MMB length to the overall martensite grain boundary.

3. Experiment

DP600 is a typical multi-phase high strength steels and was applied to validate the proposed theoretical model in this paper. The geometry of the DP600 specimen is shown in Figure 6 and the thickness is 0.9 mm. The uniaxial tensile testing was performed using MTS universal test systems. Three specimens were tested and the macro-mechanical properties of the DP600 steel were obtained as shown in Table 1. The chemical composition of the DP600 steel was determined by inductive coupled plasma emission spectrometer (ICP) (Thermo Scientific, iCAP6300, Waltham, MA, USA). Three samples were tested to reduce the random errors and the results are shown in Table 2.
To establish the microstructure characteristics of material, the specimen was polished mechanically and corroded by using 4% NITAL for 5–10 s. Before the tensile experiment, a metallographic figure of specimen was marked by using some discrete points to facilitate the selection of point interpolation method (PIM). The PIM is a meshless method based on the interpolating function with delta property [11,26,45,46]. A high-resolution CCD camera (Shanghai Wanheng Precision Instruments Co., Ltd., Shanghai, China) was positioned above the center of the sample to capture the microstructure during the testing process. Both sides of the sample had fixtures attached, which can move at the same speed in opposite directions. A uniaxial in situ tensile test was performed at 0.01 mm/s at room-temperature. Images of the specimen deformation field were captured as the strain increased.
The martensite volume fraction was obtained based on the phase area percentage from the photomicrographs. Different phases were distinguished by using a proper threshold value of grayscale in the pictures. The threshold value in these photomicrographs was mainly from 80 to 150, which is determined by the image brightness and contrast. The area of the grain was calculated using metallographic analysis software HN-2000JX (Kunshan Huanair Precision Instrument Co. Ltd., Shanghai, China). Average grain sizes of ferrite and martensite phases were estimated using the ASTM standard. The length of grain boundary was obtained by using the spline curve calculation. The grain shape parameter and grain-boundary coverage were obtained based on the length of grain boundary and grain area. The strain of individual phases was calculated using the point interpolation method (PIM) to understand the strain behaviors of the material better. Feature points along the boundary of the individual phases were selected to compute the deformation field [11,46].
Nanoindentation tests were performed to reflect the hardness of individual regions by using AIS 3000 nanoindentation instrument. The radius of spherical indenter is 1 µm. All the indentation points have the same depth and the maximum indentation depth is 0.45 µm. The typical multiple loading–unloading curves were used based on [47,48,49].

4. Results

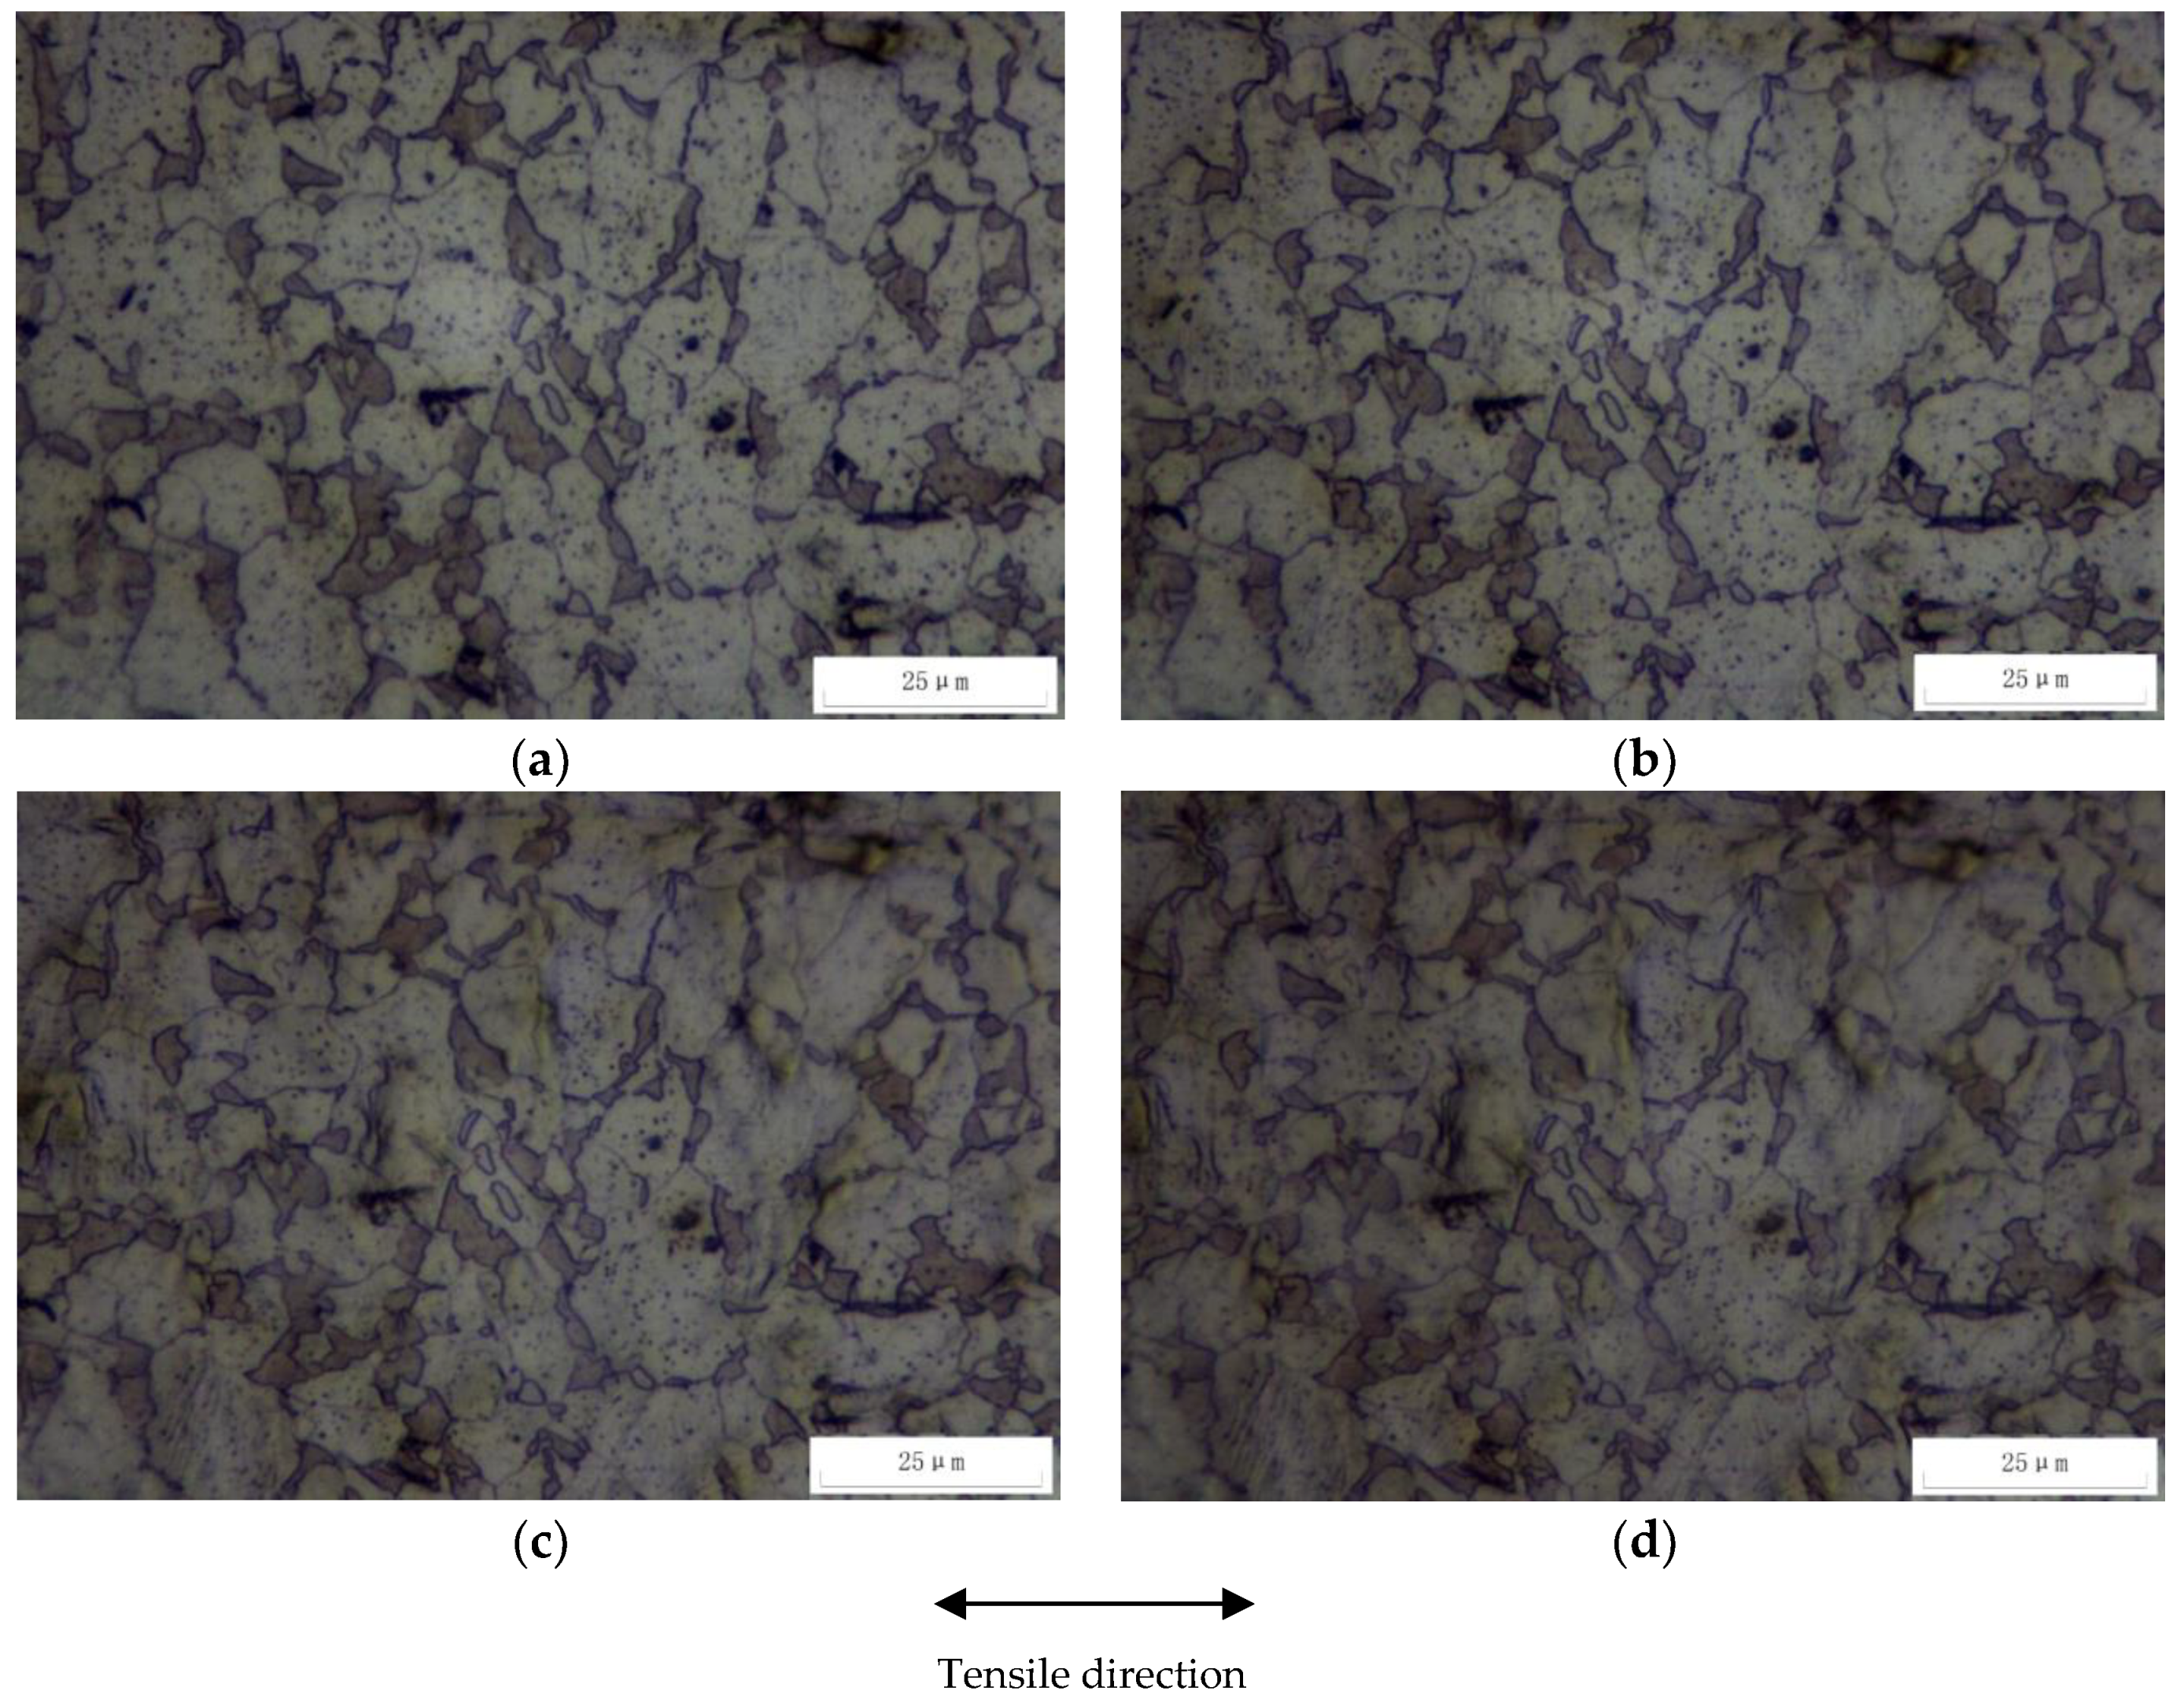
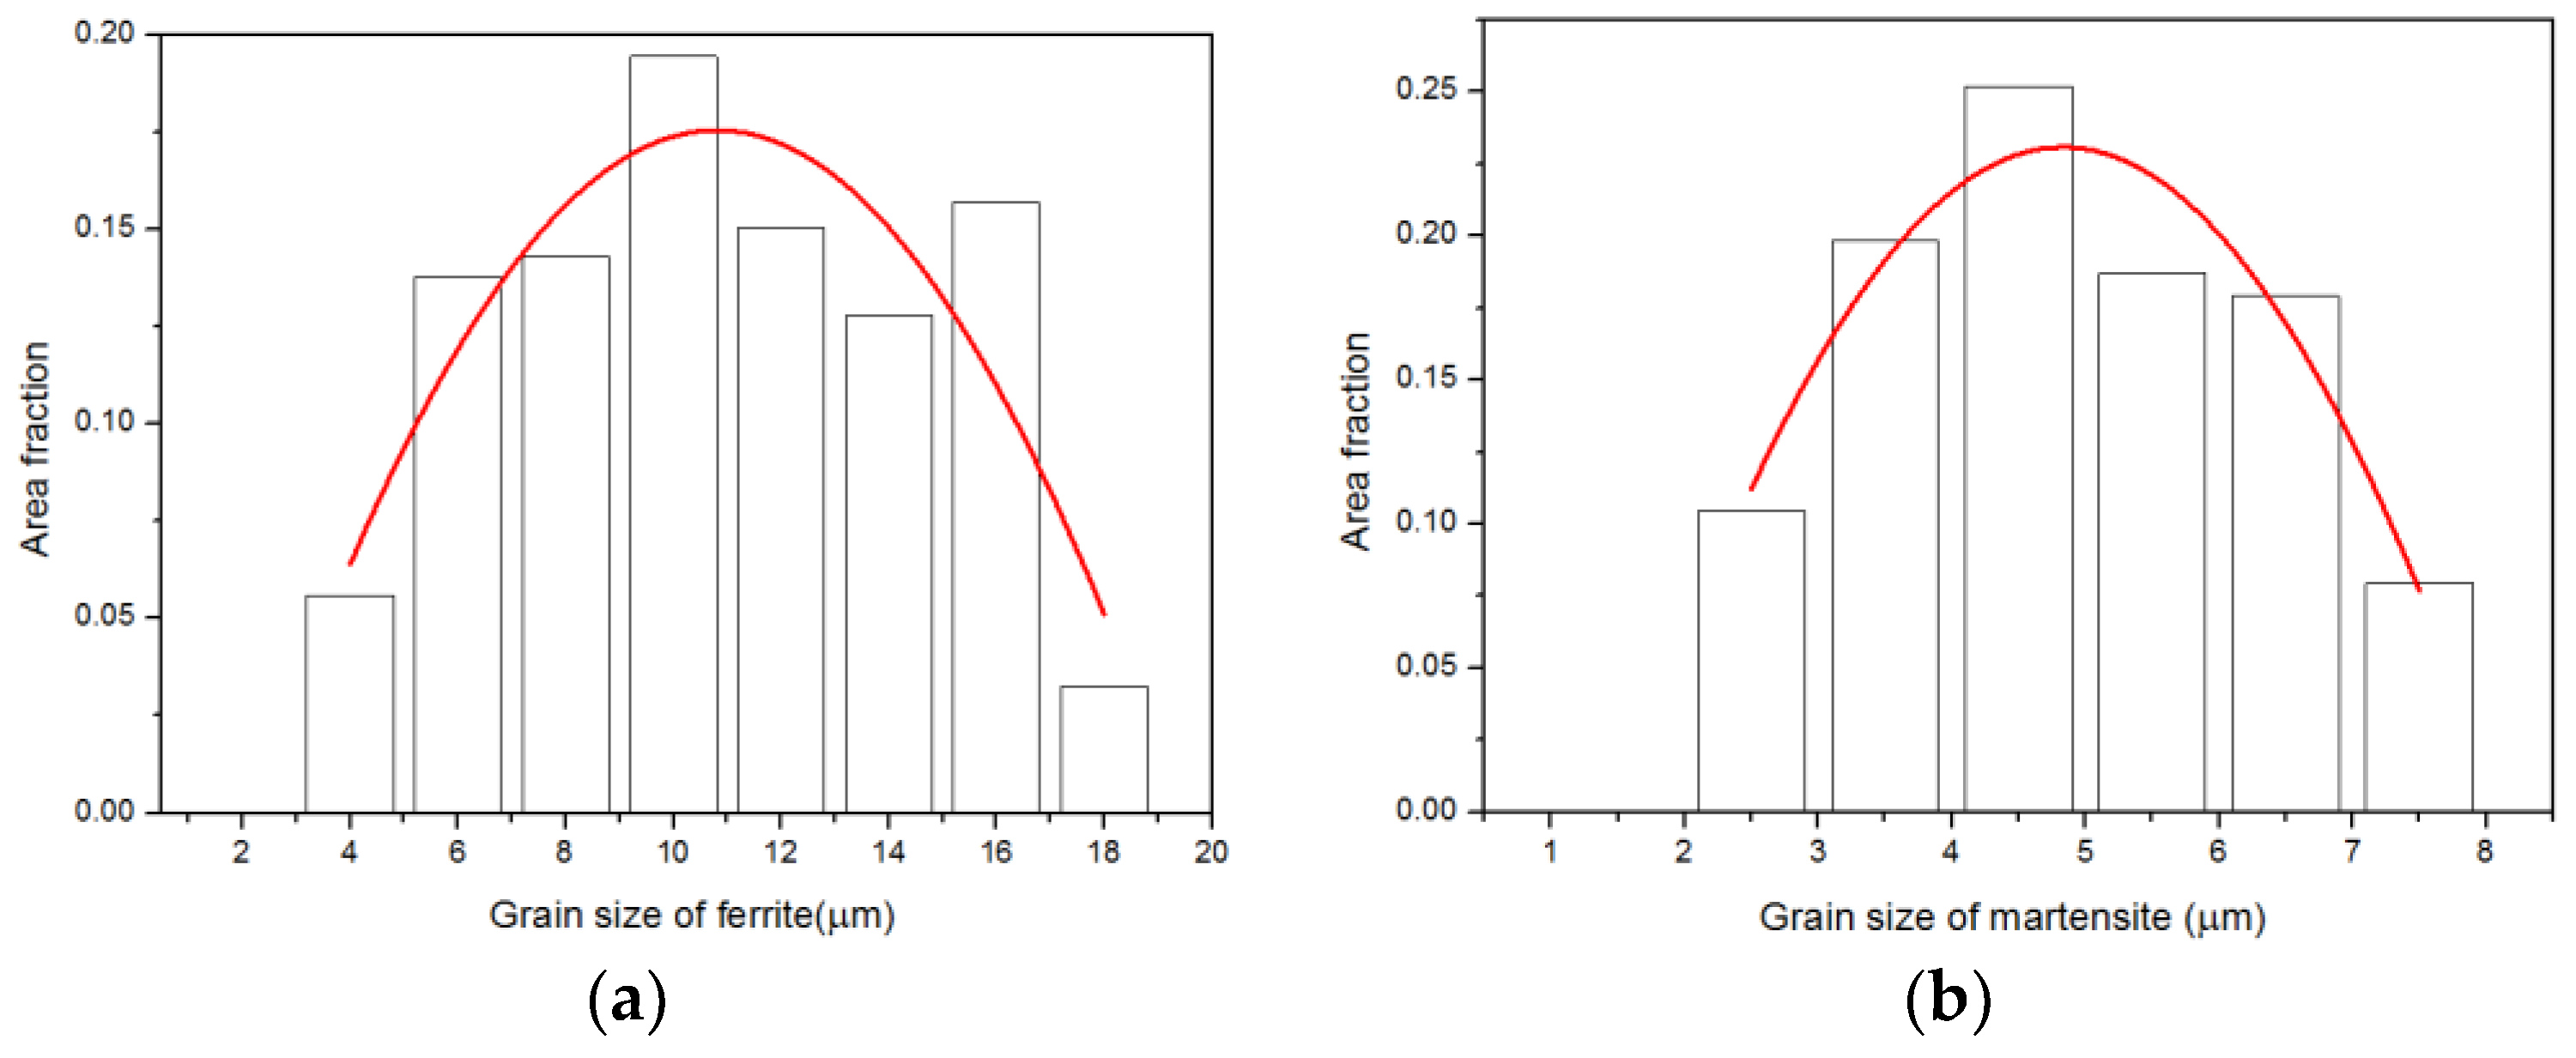
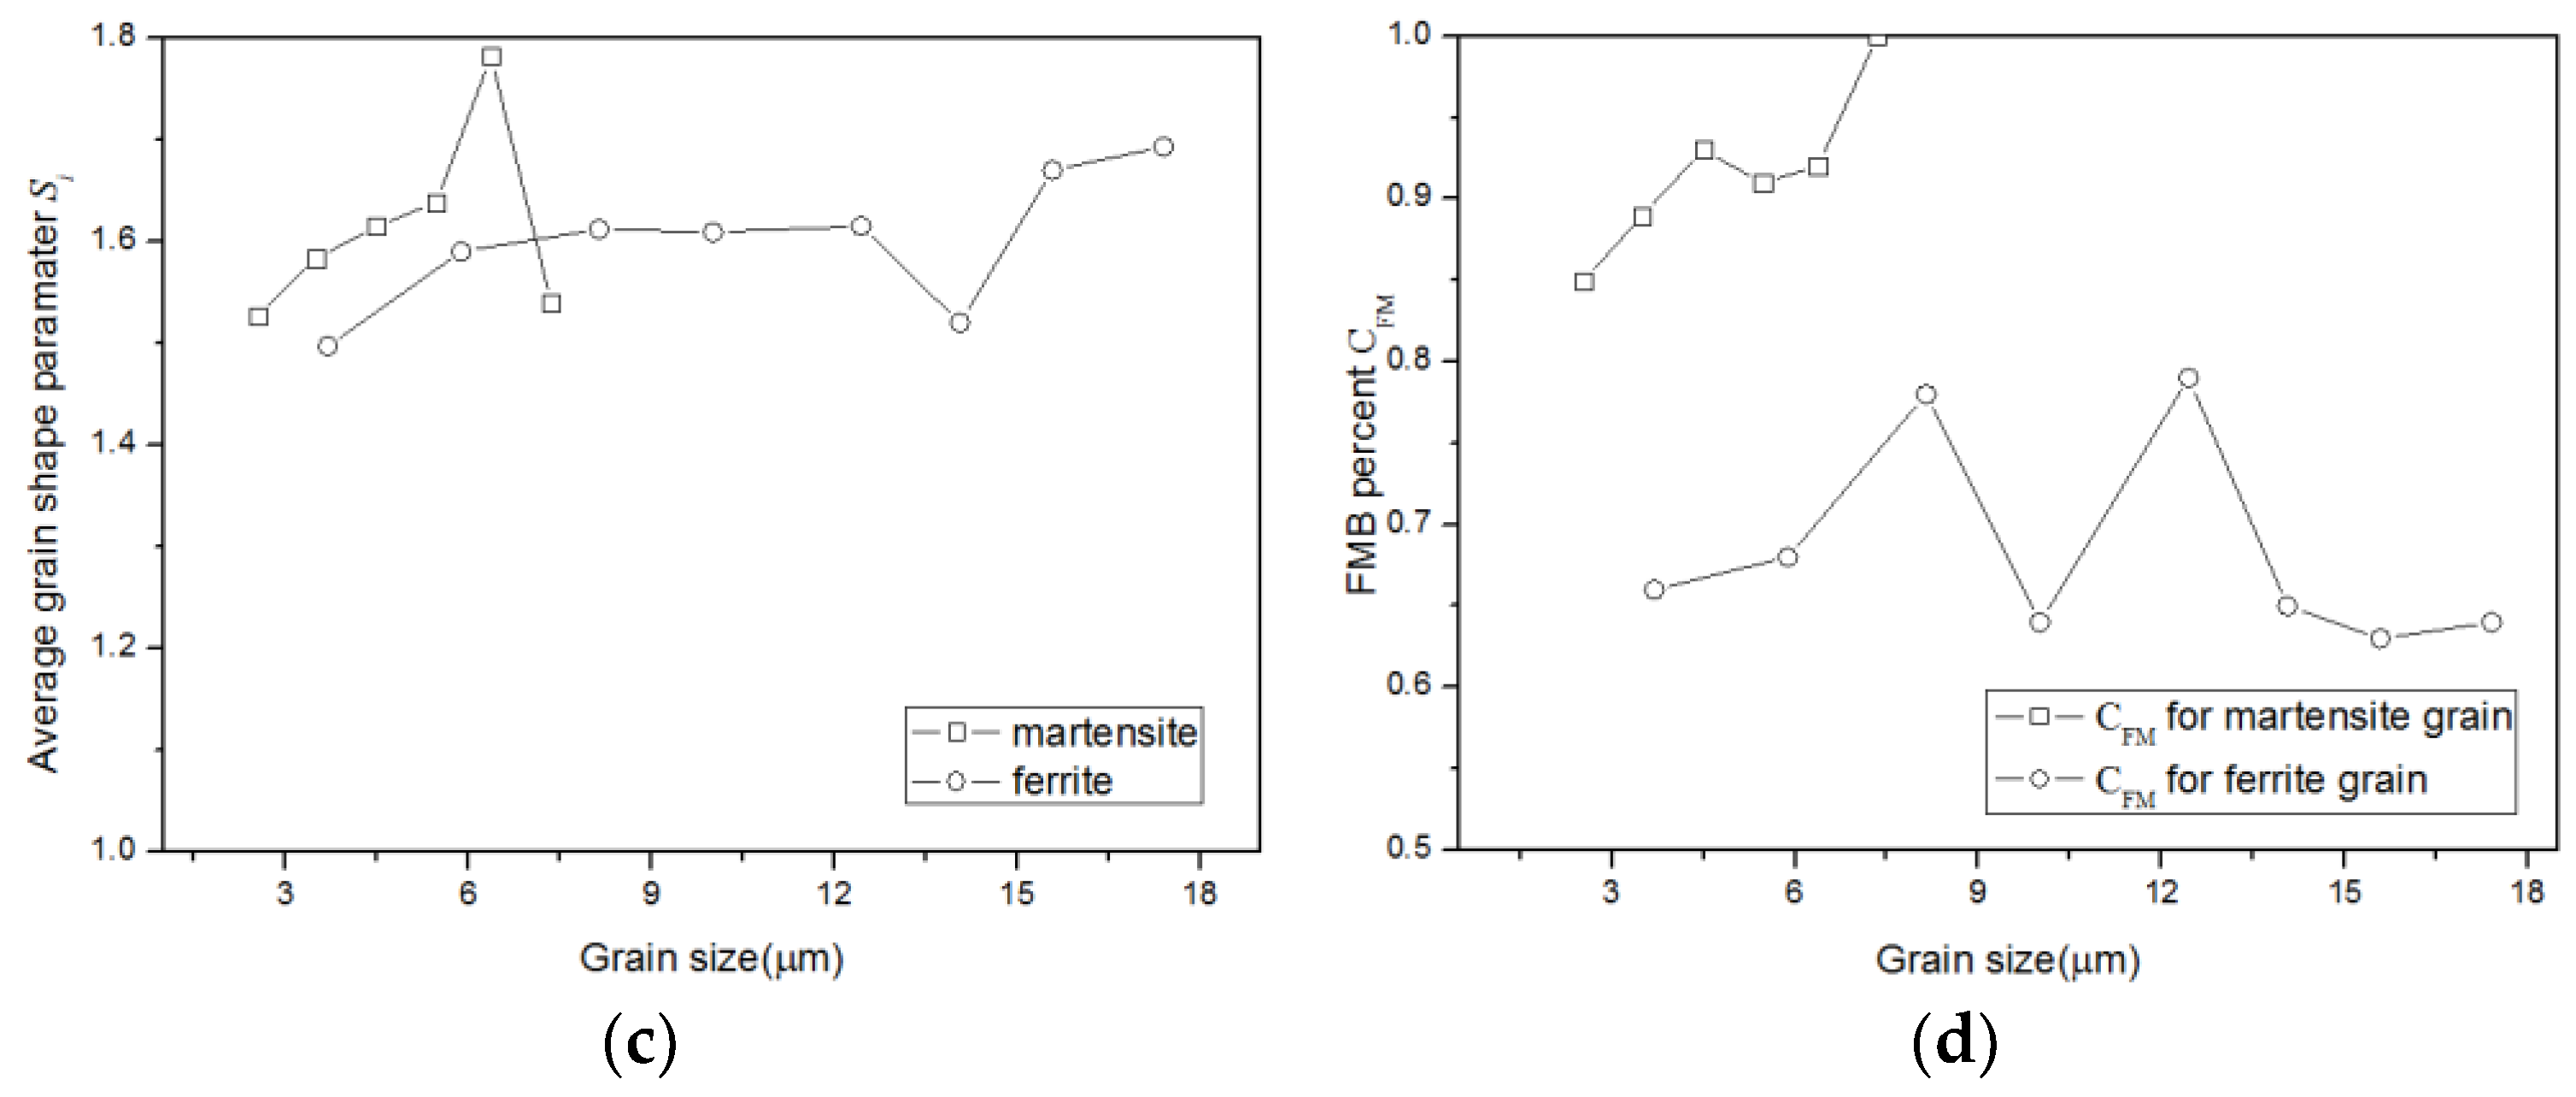
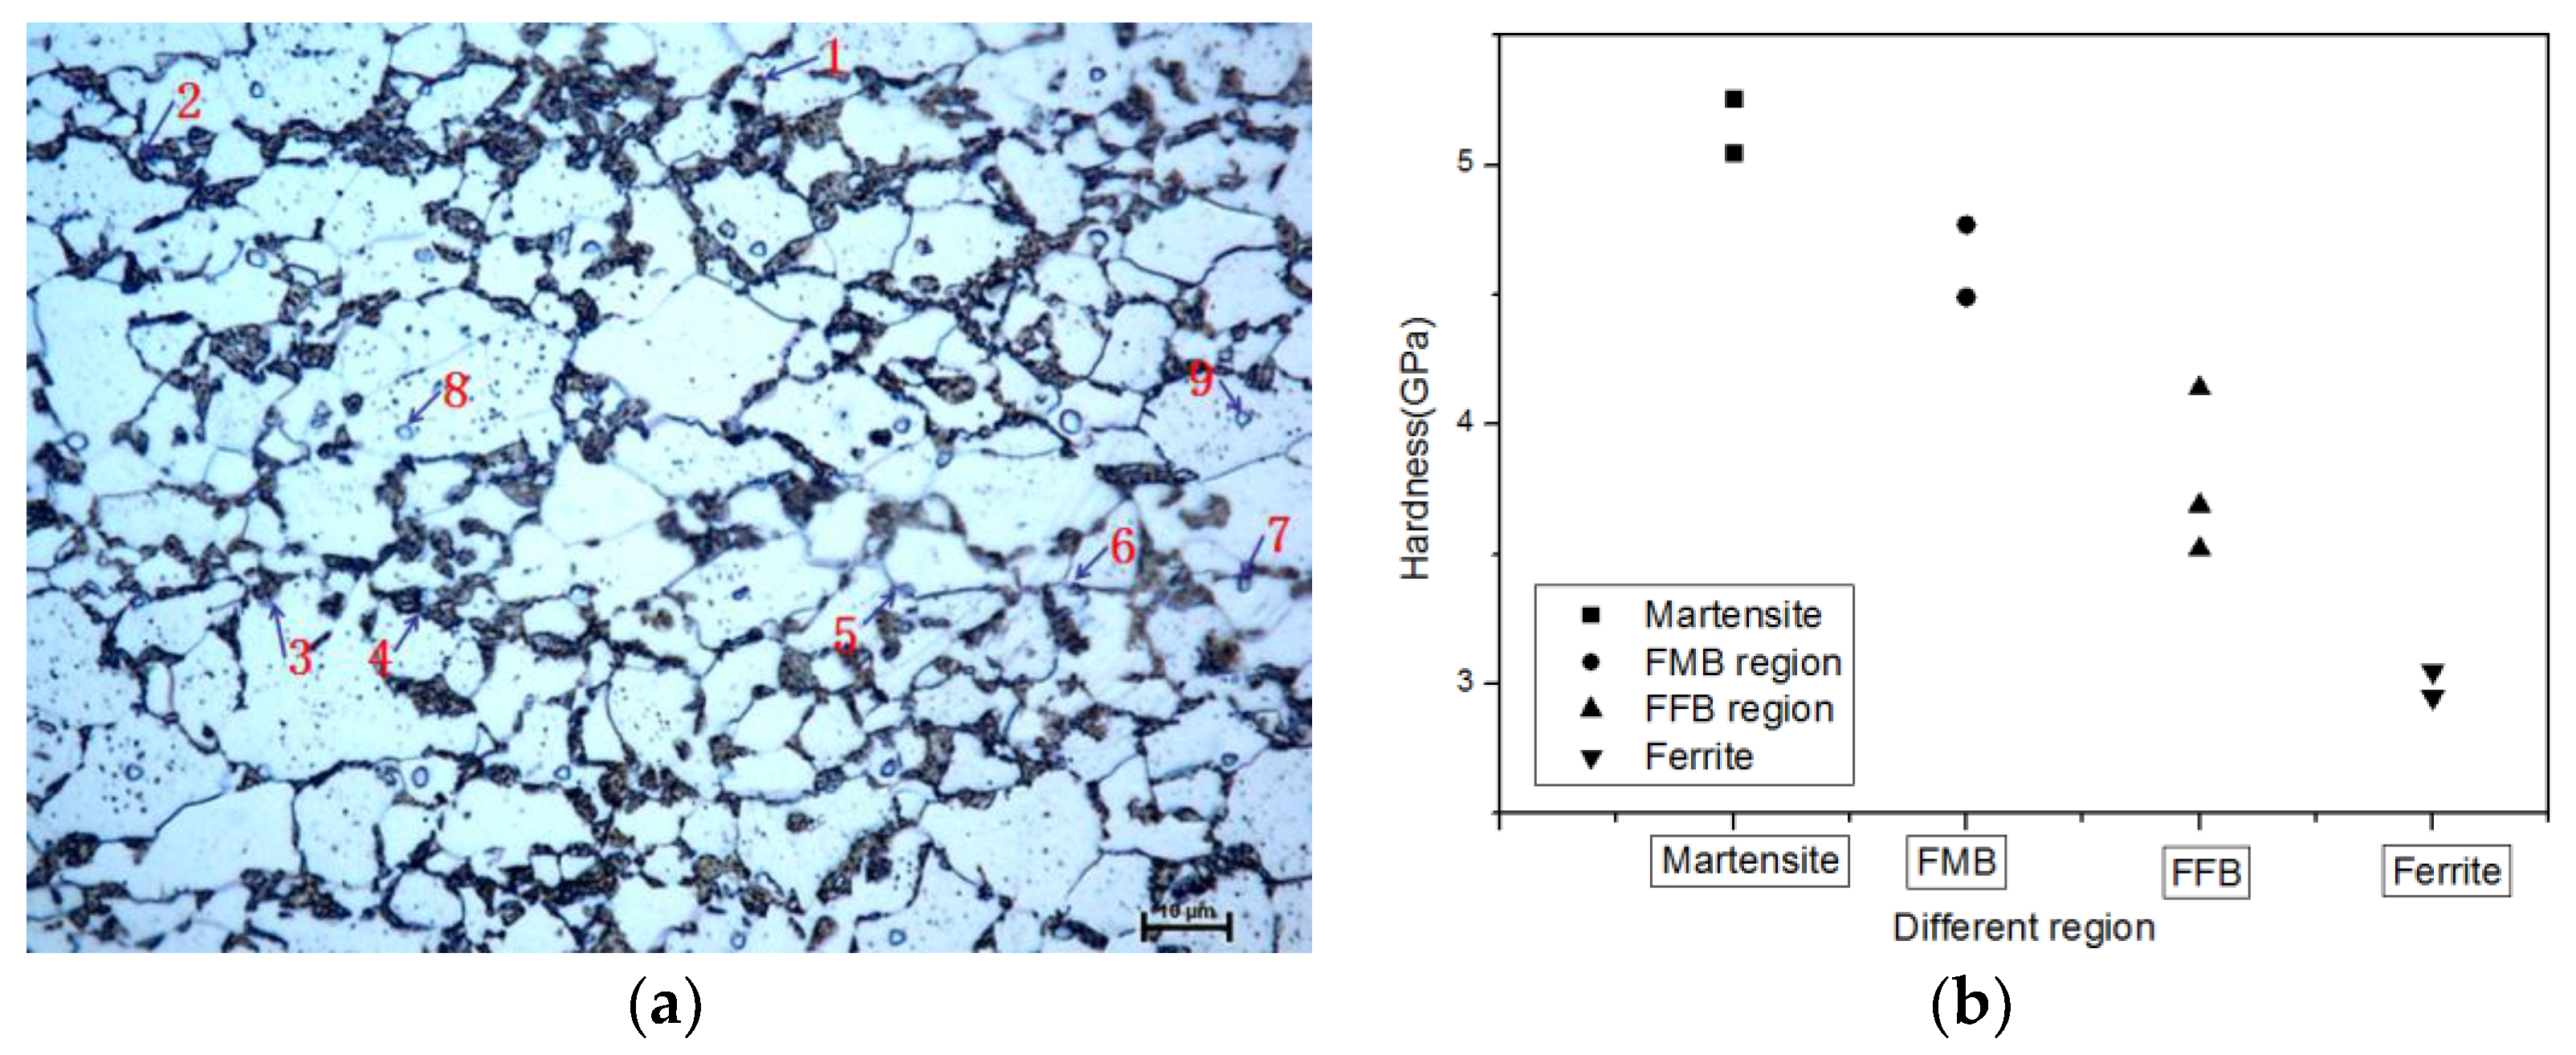
4.1. Microstructural Characteristics of DP600 Steel

Metallographic figures of the sample are shown in Figure 7 with different strain value. The ferrite grain size has obvious changed, especially along the stretching direction. The two-dimensional deformation field was obtained by using the PIM calculation. The strain of individual phases and material overall strain are calculated by the relational expressions of Equations (3) and (4). The fitting parameters a i 1 , a i 2 are obtained by experimental study and the average value are shown in Table 3.
The grain size distribution of individual phases was counted based on the metallographic analysis and shown in Figure 8. The grain size distribution is a unimodal curve. The grain shape factor of individual phases was calculated, which is mainly between 1.5 and 1.7. Taken the influence of grain volume into account, the volume-weight average grain shape coefficients of both phases were calculated by the Equation (30). The FMB percent for ferrite phase is mainly between 0.65 to 0.8, while the FMB parameter for martensite phase is 0.85–0.99. It can be deduced that the martensite phase almost be enclosed by ferrite phase totally and MMB only take a tiny percentage for martensite particle.
S i ¯ = f i S i ,
where the S i ¯ is the average grain shape factor of each phase; f i is the area fraction of different grain size as shown in Figure 8a,b; Si is the grain shape coefficient as shown in Figure 8c.

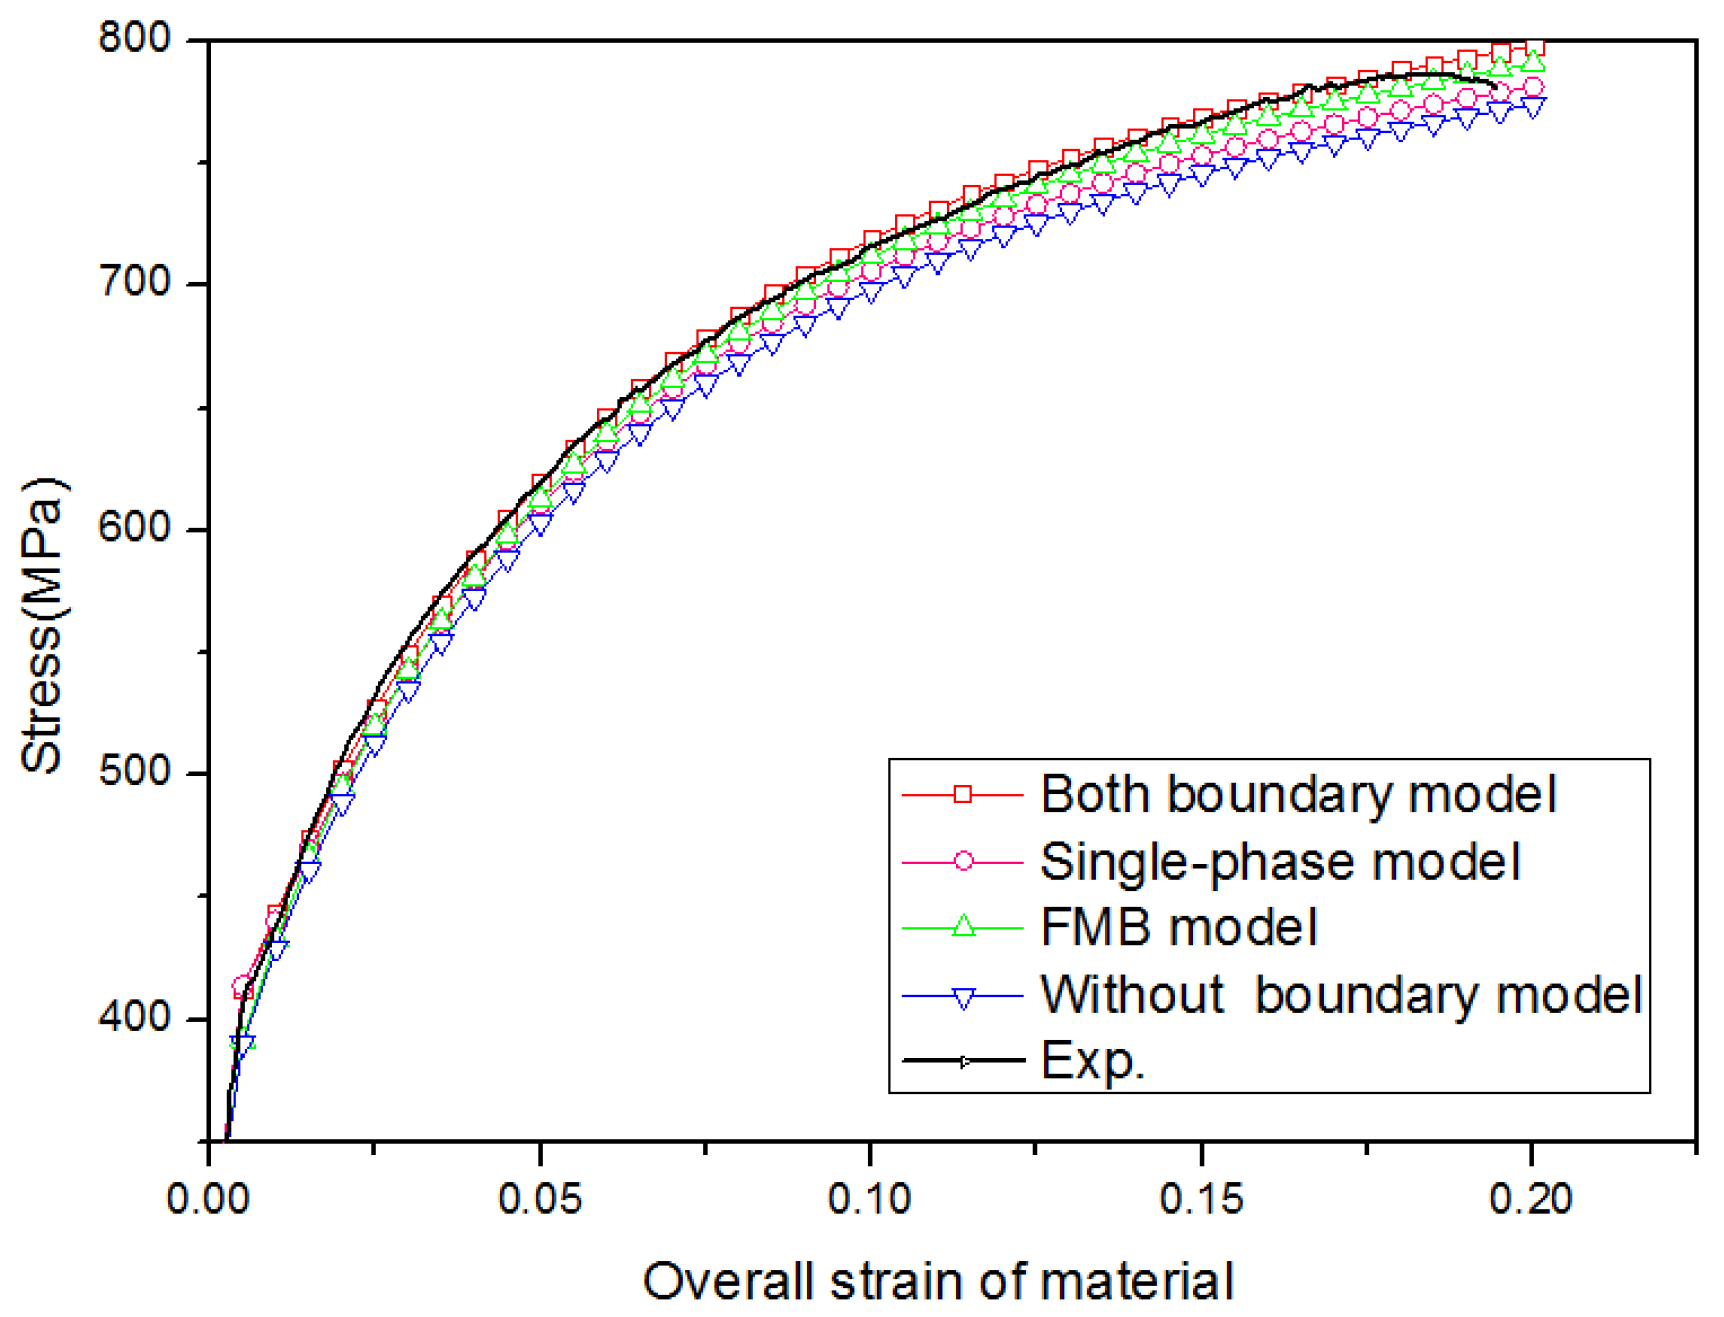
4.2. Theory Modeling Verification

In this paper, four theory models based on the microscopic features were established. They were the both boundary hardening model, the single-phase boundary hardening model, the FMB hardening model and the model without considering boundary hardening, respectively. Both boundary hardening models considered the single-phase boundary hardening and the FMB phase boundary hardening effects. In the single-phase boundary hardening model, the FFB hardening and the MMB region hardening were taken into account simultaneously. The FMB model took the FMB hardening effects into account merely. The parameters of the models are given in Table 3 and Table 4 with the values identified for the DP600 steel sheet. The parameters were measured directly form experiment or extracted from the literature.
The flow stress-strain curves of the different models were calculated and are shown in Figure 9. The plastic stress of the single-phase hardening model is larger than the stress of FMB hardening model at initial deformation stage, while the stress of single-phase hardening model became small with the increasing strain. This is due to plastic deformation starts in FFB interface region earlier than the FMB interface region. In addition, the stress in the FMB interface region is larger than the FFB interface region in large strain. The proposed model with both boundary effects can predict the experimental stress-strain respond more precisely than those models without considering the both boundary effects.
The SSD density and GND densities of ferrite with different grain sizes were computed and is shown in Figure 10. The dislocation densities increase with an increasing strain, whereas the rate is reduced. This result is consistent with the observation of [11,40]. The SSD density of ferrite appears the saturated phenomenon during the plastic deformation. The finer grain size has a lager dislocation density, and this effect on dislocation density is increased with a decreasing grain size. The rate of increase in GND density slows down with the progress of plastic deformation. The change law of dislocation densities is a nonlinear relationship with the grain size. The GND density is dependent on the martensite grain size, which has the same order of magnitude as in [3,43].
The stress change laws of both phases with different models are shown in Figure 11. The ferrite stress of single-phase model is larger than the stress of FMB model at small strain, while it has an opposite result at large strain. This is due to ferrite phase occurred plastic deformation in the early stage and the dislocations stored at grain boundaries, which act as an effective barrier, resulting in the ferrite stress of single-phase model increased. The GBDs accumulate and saturate along the ferrite grain boundaries then pass through the FFB. With the GBD density decrease to a certain value, the FFB hardening stress goes to a stable value in large strain. The plastic deformation appears in the vicinity FMB relatively later and then the dislocation density is larger than the value in FFB region gradually. The stress of FMB model is larger than the single-phase model at large strain. It explains the stress changing law of single-phase model and FMB model. The martensite stress of the both boundary model and the single-phase model are same. The FMB model and the model without boundary effects have the same martensite stress as shown in Figure 11b. The martensite stress of all the models have hardly difference, because the MMB in martensite boundary only takes a very small proportion. In large plastic deformation, the stress decrease in the order: MMB region, martensite interior region, FMB region, FFB region, and ferrite interior region.
Based on the nano indentation experiment, some indentation points and the corresponding hardness value are shown in Figure 12. The hardness value of martensite interior region, FMB region, FFB region and the ferrite interior region decrease gradually. Hardness values of different regions rely on their respective carbon contents and dislocation densities [50]. For the ferrite phase, the different regions usually have the varies carbon contents, and the carbon content in boundary region is higher than the inner region. Thus, the large hardness value location in region ferrite corresponds to a high dislocation densities and large stress. This is in line with the assumption and conclusion of the proposed multi-regions model. The nanoindentation tests verified the reasonability of the proposed model.

4.3. Effect of Boundary Characteristics on the Hardening Behaviors

The effects of FFB characteristics on the ferrite stress have been performed with the proposed both boundary model. The parameters of the Table 3 and Table 4 in order to reflect the effects of minimal GBD spacing, FMB percent for ferrite grain and ferrite grain shape on material stress. The different parameters have remarkable effects on calculated results.
The true stress-strain curves of DP steel with a varying value of minimal GBD spacing from 0.02 to 0.035 based on the both boundary model is shown in Figure 13a. The minimal GBD spacing parameter is the mean spacing parallel to the grain boundary separating two GBDs in the limit [42]. The GBD spacing affects the stress in the early stage of deformation, while the effect is diminished at large strain. In initial deformation, the lager flow stress is generated with smaller GBD spacing. This is due to higher dislocation pile-ups at grain boundary in smaller GBD spacing to accommodate the local stress. Figure 13b,c provides the effects of FMB percent on the flow stress-strain curve in different strain stage. Compared with the high FMB percent model, the lower FMB percent model has higher stress in the early stage and lower in larger strain. This changing law is related to the stress in the FFB and FMB regions. The stress of FFB region is larger than the FMB region in small strain and less than the FMB region at large strain. The FMB percent plays a significant role on the yield strength and tensile strength, which is line with the results [41,51]. Based on the role of grain boundaries as an effective barrier to the movement of dislocations, the yield hardening and ultimate strength can be explained by the pile-up of dislocations at grain boundaries [41,51].
The effect of ferrite grain shape coefficient on the additional stress of FFB region is shown in Figure 13d. The additional stress increases until to a limit value and then decreases to a stable value gradually. This is due to grain boundaries are treated as obstacles for dislocations up to reaching a critical stress, then the new dislocations pass through the boundary [42]. The small grain shape parameter Sf has a large additional stress. This is due to smaller grain shape parameter Sf has a relatively shorter grain boundary for the same diameter grains. The short grain boundary leads to the dislocations accumulation more concentration and yields higher dislocation density, which results in a larger additional stress in the FFB region.

5. Conclusions

A mixed model based on the dislocation theory was developed to predict the strain-hardening behaviors of DP steel under uniaxial tension. Based on the heterogeneous micro characteristic, the microstructures of DP steel were divided into martensite interior region, MMB region, FMB region, FFB region, and internal ferrite region. The grain shape factor, relative FMB percent were introduced to the predict model. The research yielded the following major findings.
(1)
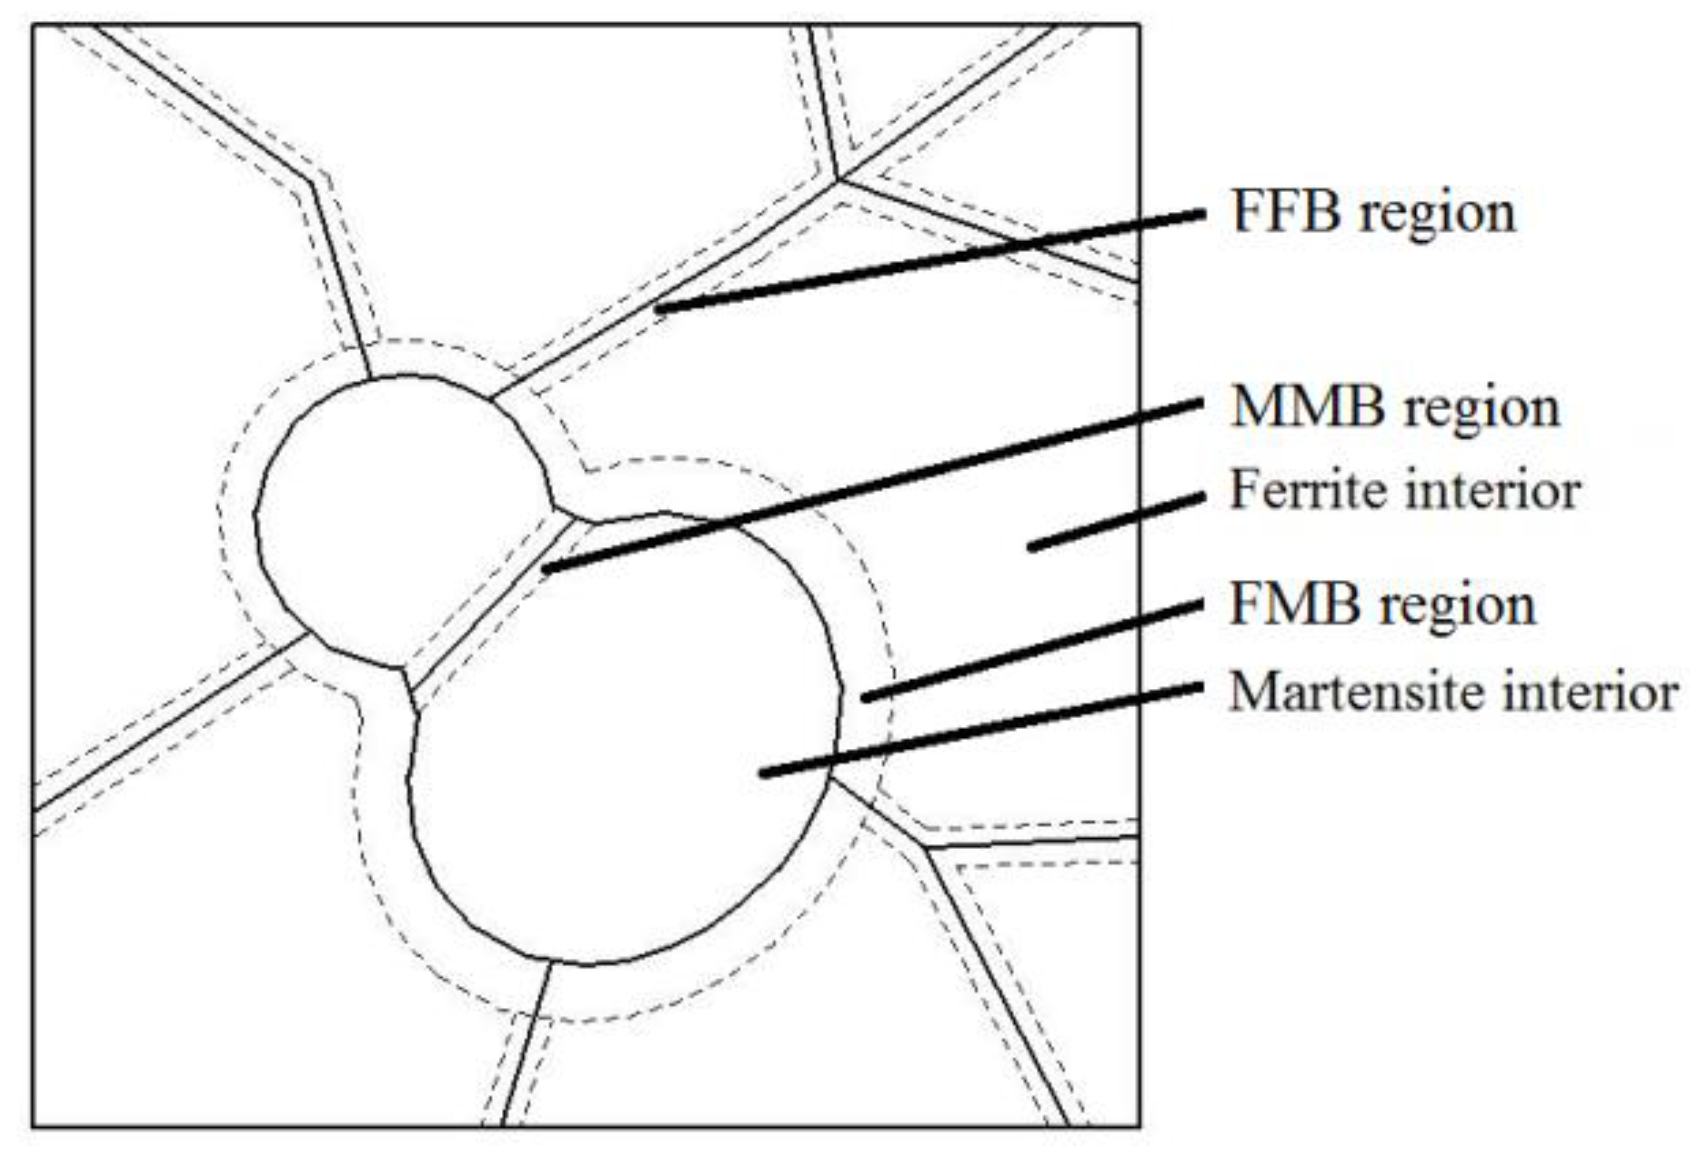
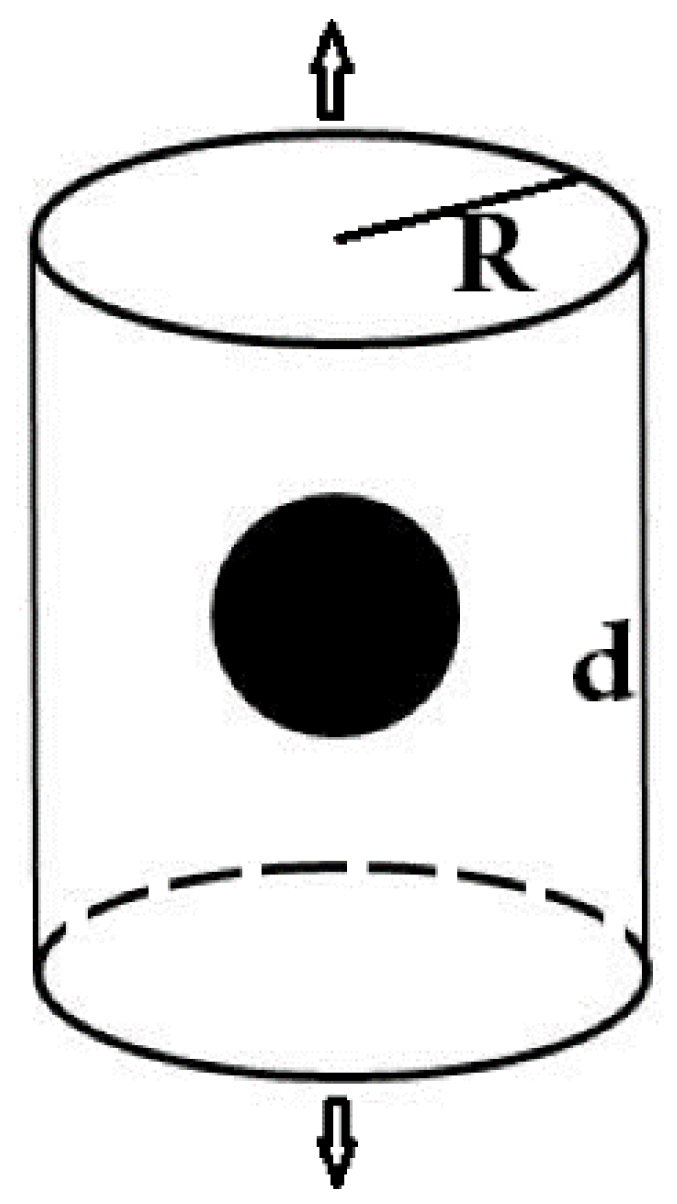
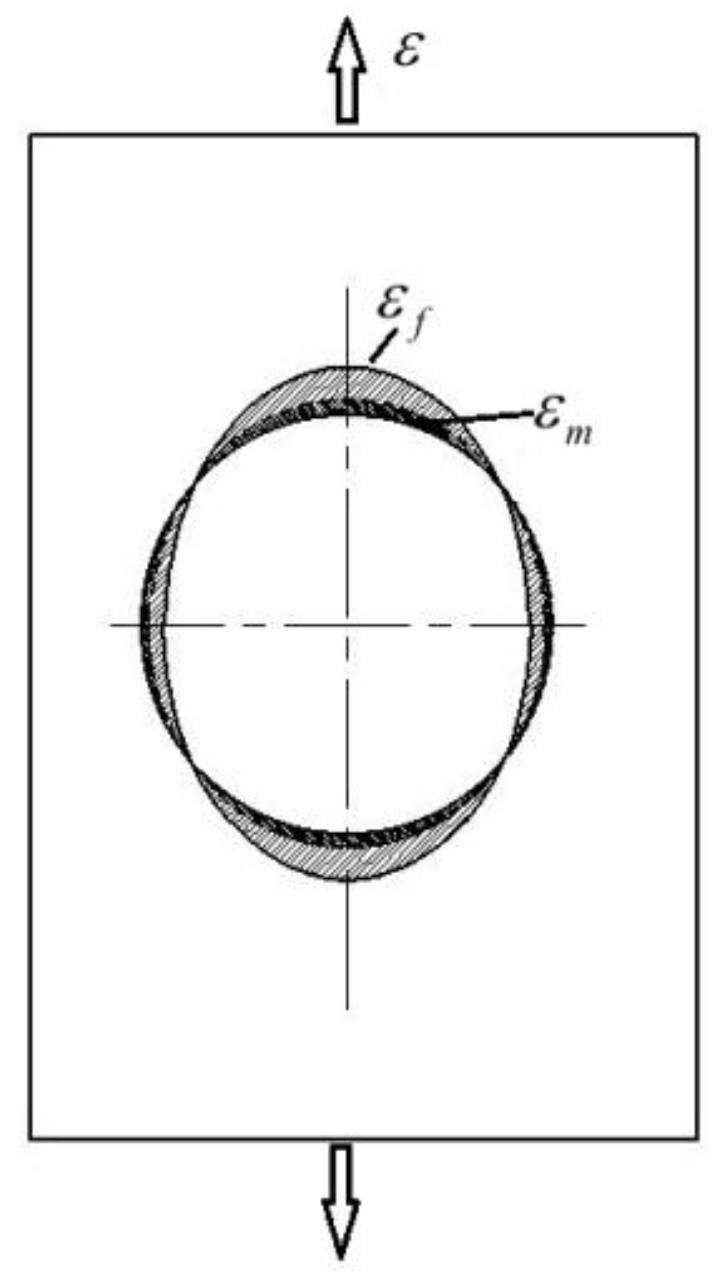
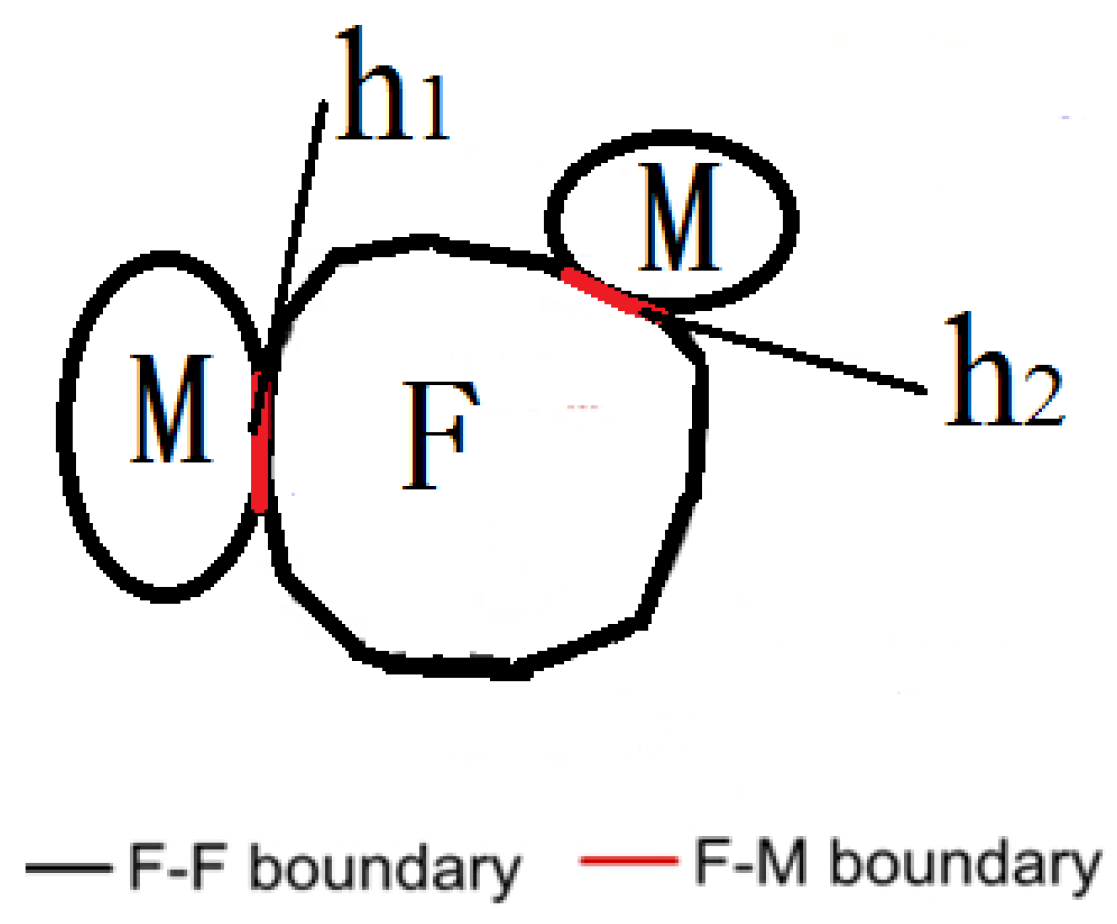
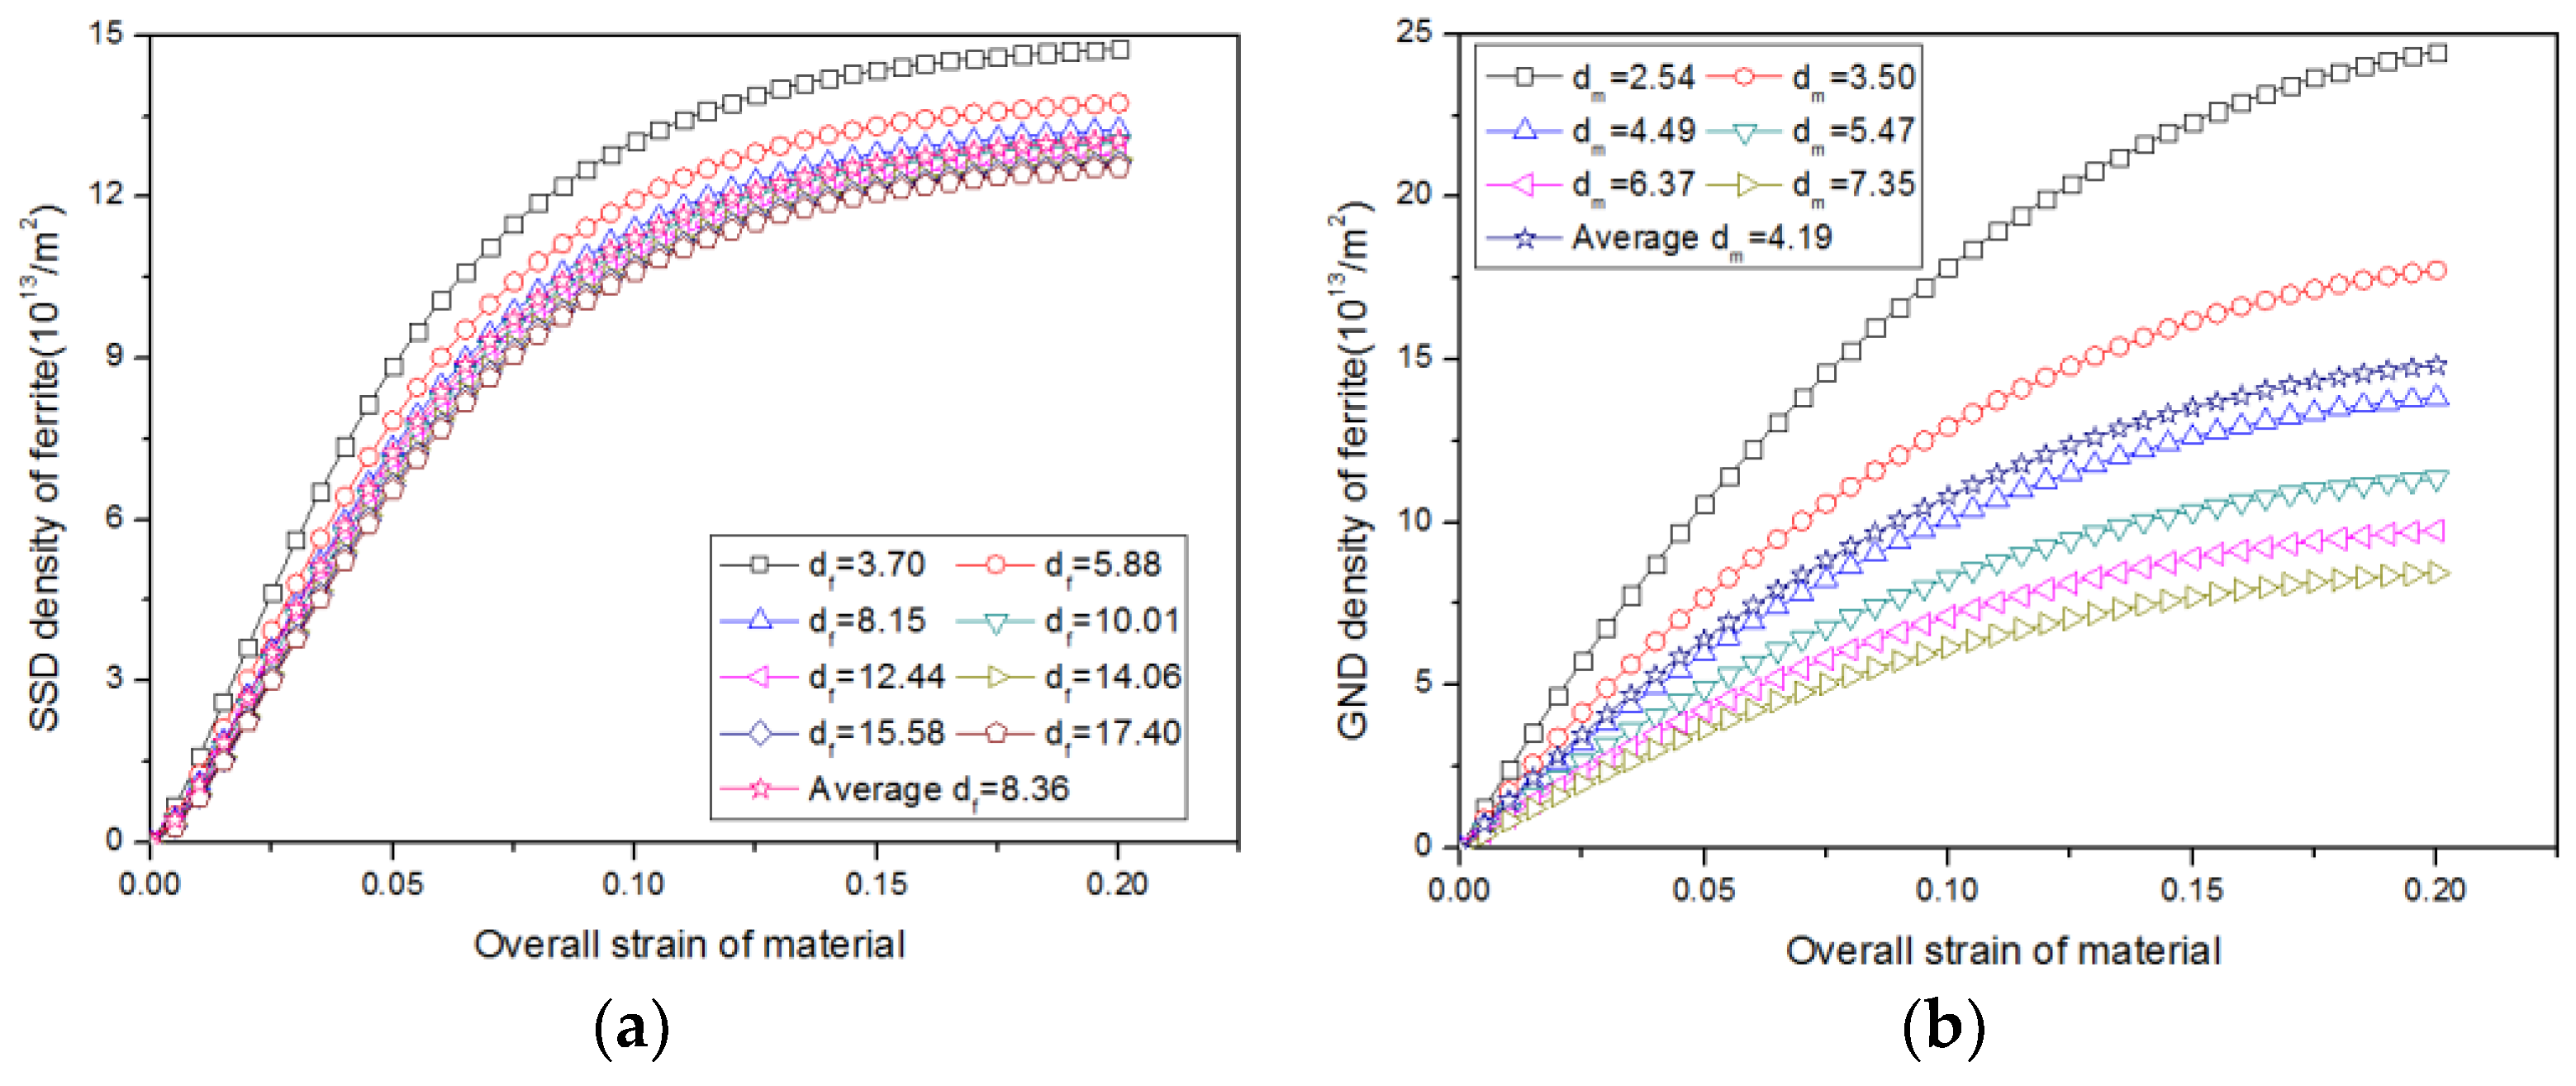
The microstructures of DP steel were divided into five different regions which have their own hardening behaviors based on the dislocation theory. The hardening behaviors of internal region of martensite and ferrite particles only considered the SSD density. The single-phase boundary (FFB/MMB) regions were treated as combine both the effects of SSD and GBD hardening. The FMB regions were affected by the SSD and the GND densities. The GNDs were obtained by a cell model, which converted the uniaxial tension to indentation deformation to simplify the calculation. The both boundaries hardening model has a better agreement with the experimental results. The reasonability and accuracy of the multi-hardening region theoretical model were verified by uniaxial tension test and nanoindentation test.
(2)
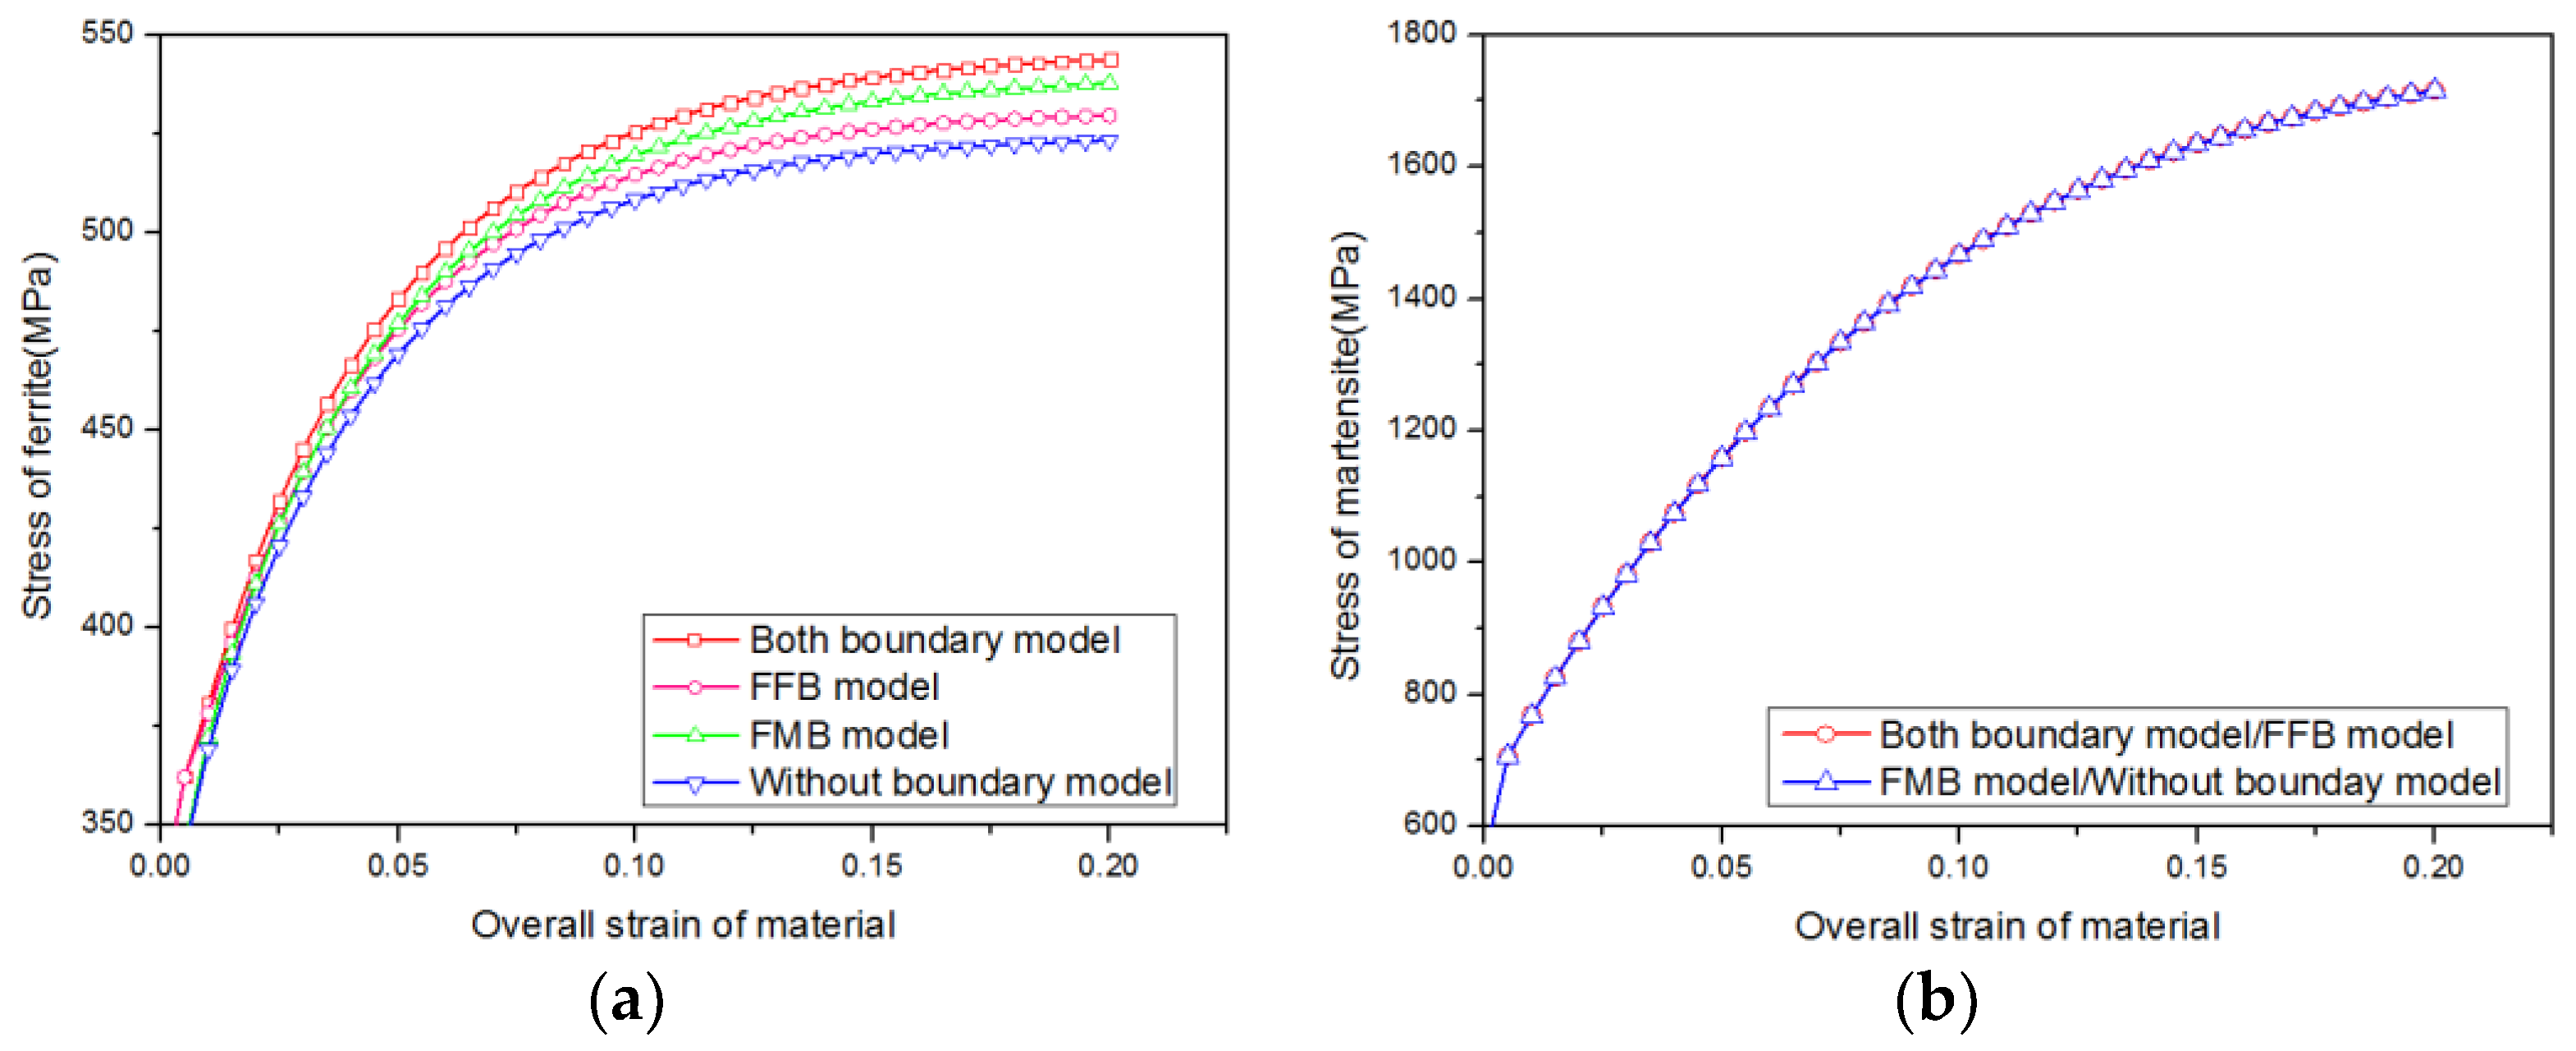
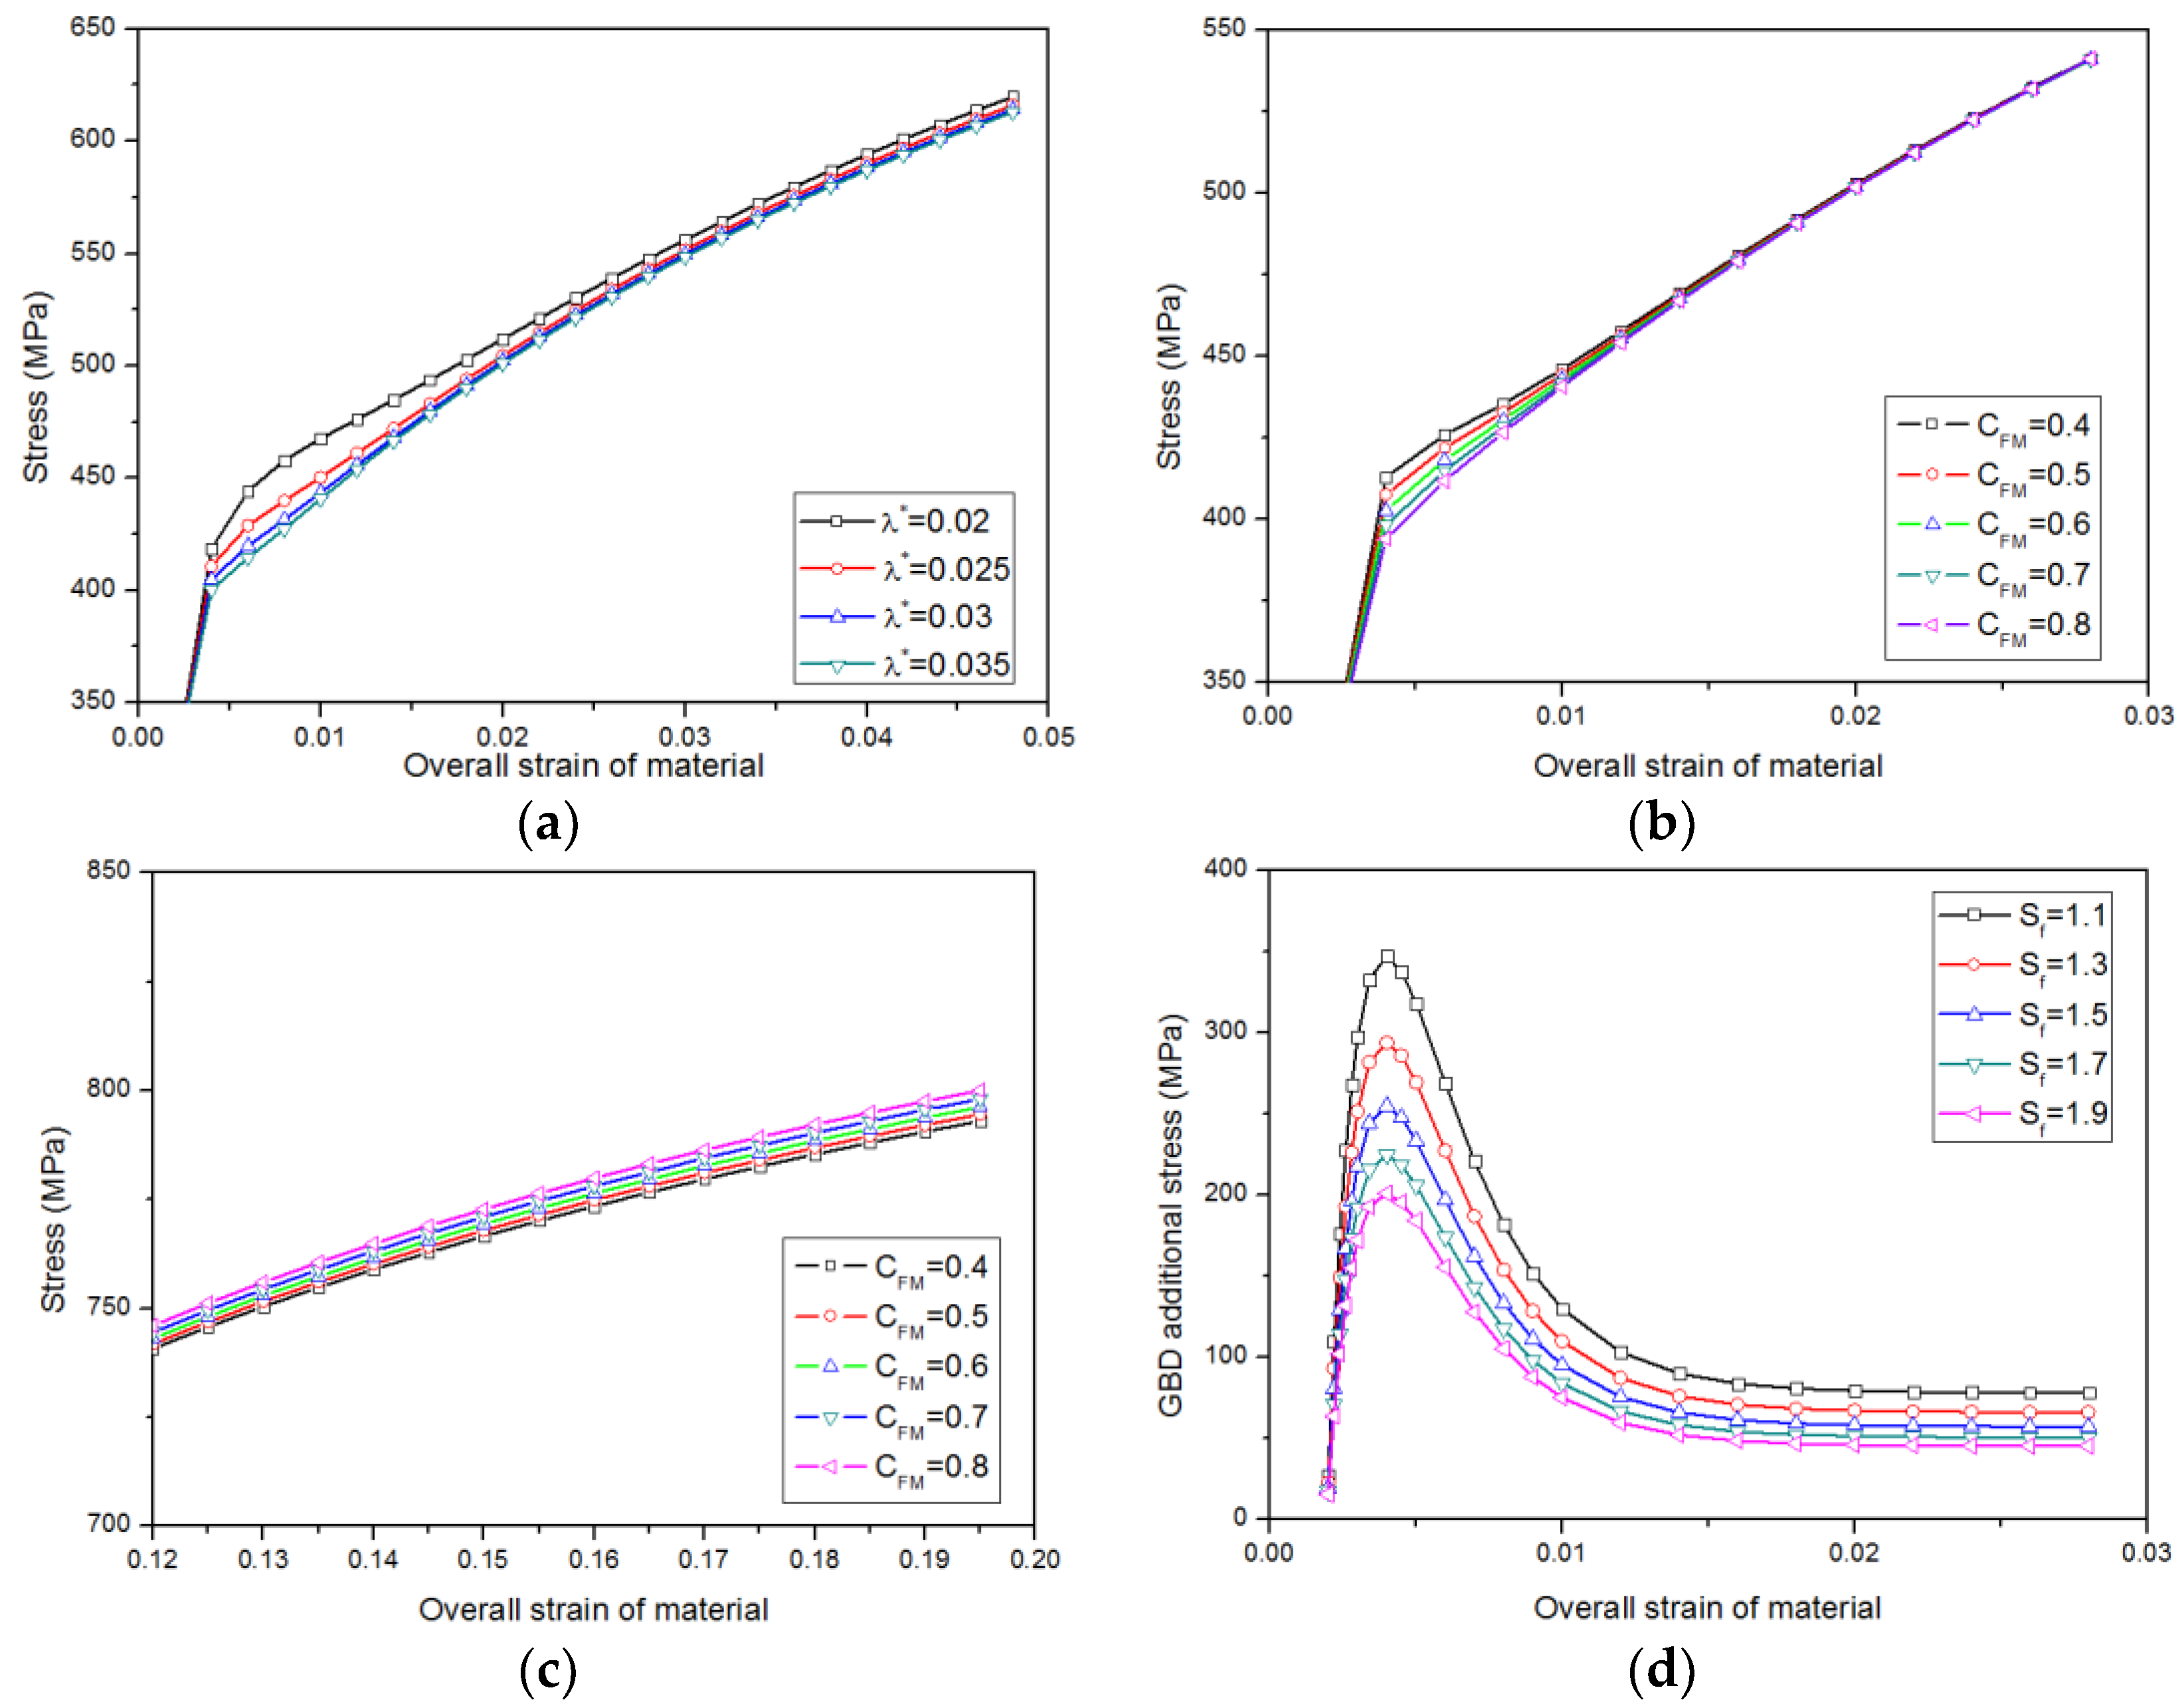
The grain shape parameter and common FMB percent have both effects on the stress of DP steel. The effect of FFB on stress is larger than the FMB in small strain, while it has an opposite result under larger strain condition. The proposed model with high FFB percent has a larger stress in small strain and a smaller stress in larger strain. The grain shape parameter not only affects the stress of grain boundary regions, but it also affects the stress distribution and strain localization.

Author Contributions

Methodology, C.R. and W.D.; Software, C.R.; Validation, W.Z.; Investigation, W.D. and Y.X.; Data Curation, Y.X.; Writing—Original Draft Preparation, C.R.; Writing—Review & Editing, W.D. and C.R.; Project Administration, W.Z.

Funding

This research received no external funding.

Acknowledgments

Thanks to the assistance in nanoindentation test by Ruibin Gou in Anhui Science and Technology University.

Conflicts of Interest

The authors declare no conflict of interest.

References

  1. Anderson, D.; Butcher, C.; Pathak, N.; Worswick, M.J. Failure parameter identification and validation for a dual-phase 780 steel sheet. Int. J. Solids Struct. 2017, 124, 89–107. [Google Scholar] [CrossRef]
  2. Chung, K.H.; Lee, W.; Kim, J.H.; Kim, C.; Park, S.H.; Kwon, D.; Chung, K. Characterization of mechanical properties by indentation tests and FE analysis—validation by application to a weld zone of DP590 steel. Int. J. Solids Struct. 2009, 46, 344–363. [Google Scholar] [CrossRef]
  3. Calcagnotto, M.; Ponge, D.; Demir, E.; Raabe, D. Orientation gradients and geometrically necessary dislocations in ultrafine grained dual-phase steels studied by 2D and 3D EBSD. Mater. Sci. Eng. A 2010, 527, 2738–2746. [Google Scholar] [CrossRef]
  4. Calcagnotto, M.; Ponge, D.; Raabe, D. Effect of grain refinement to 1μm on strength and toughness of dual-phase steels. Mater. Sci. Eng. A 2010, 527, 7832–7840. [Google Scholar] [CrossRef]
  5. Jiang, Z.H.; Guan, Z.Z.; Lian, L. The relationship between ductility and material parameters for dual-phase steel. J. Mater. Sci. 1993, 28, 1814–1818. [Google Scholar] [CrossRef]
  6. Abid, N.H.; Abu Al-Rub, R.K.; Palazotto, A.N. Micromechanical finite element analysis of the effects of martensite morphology on the overall mechanical behavior of dual phase steel. Int. J. Solids Struct. 2017, 104, 8–24. [Google Scholar] [CrossRef]
  7. Al-Abbasi, F.M.; Nemes, J.A. Micromechanical modeling of dual phase steels. Int. J. Mech. Sci. 2003, 451, 1449–1465. [Google Scholar] [CrossRef]
  8. Al-Abbasi, F.M.; Nemes, J.A. Micromechanical modeling of the effect of particle size difference in dual phase steels. Int. J. Solids Struct. 2003, 40, 3379–3391. [Google Scholar] [CrossRef]
  9. Bag, A.; Ray, K.K.; Dwarakadasa, E.S. Influence of Martensite Content and Morphology on Tensile and Impact Properties of High-Martensite Dual-Phase Steels. Metall. Mater. Trans. A 1999, 30A, 1193–1202. [Google Scholar] [CrossRef]
  10. Son, Y.I.; Lee, Y.K.; Park, K.-T.; Lee, C.S.; Shin, D.H. Ultrafine grained ferrite–martensite dual phase steels fabricated via equal channel angular pressing: Microstructure and tensile properties. Acta Mater. 2005, 53, 3125–3134. [Google Scholar] [CrossRef]
  11. Huang, T.T.; Gou, R.B.; Dan, W.J.; Zhang, W.G. Strain-hardening behaviors of dual phase steels with microstructure features. Mater. Sci. Eng. A 2016, 672, 88–97. [Google Scholar] [CrossRef]
  12. Sirinakorn, T.; Wongwises, S.; Uthaisangsuk, V. A study of local deformation and damage of dual phase steel. Mater. Des. 2014, 64, 729–742. [Google Scholar] [CrossRef]
  13. Lai, Q.; Brassart, L.; Bouaziz, O.; Gouné, M.; Verdier, M.; Parry, G.; Perlade, A.; Bréchet, Y.; Pardoen, T. Influence of martensite volume fraction and hardness on the plastic behavior of dual-phase steels: Experiments and micromechanical modeling. Int. J. Plast. 2016, 80, 187–203. [Google Scholar] [CrossRef]
  14. Rieger, F.; Wenk, M.; Schuster, S.; Böhlke, T. Mechanism based mean-field modeling of the work-hardening behavior of dual-phase steels. Mater. Sci. Eng. A 2017, 682, 126–138. [Google Scholar] [CrossRef]
  15. Guery, A.; Hild, F.; Latourte, F.; Roux, S. Slip activities in polycrystals determined by coupling DIC measurements with crystal plasticity calculations. Int. J. Plast. 2016, 81, 249–266. [Google Scholar] [CrossRef] [Green Version]
  16. Haghdadi, N.; Cizek, P.; Beladi, H.; Hodgson, P.D. Dynamic Restoration Processes in a 23Cr-6Ni-3Mo Duplex Stainless Steel: Effect of Austenite Morphology and Interface Characteristics. Metall. Mater. Trans. A 2017, 48A, 4803–4820. [Google Scholar] [CrossRef]
  17. Haghdadi, N.; Cizek, P.; Beladi, H.; Hodgson, P.D. A novel high-strain-rate ferrite dynamic softening mechanism facilitated by the interphase in the austenite/ferrite microstructure. Acta Mater. 2017, 126, 44–57. [Google Scholar] [CrossRef]
  18. Li, S.; Wang, Y.; Wang, X. Effects of ferrite content on the mechanical properties of thermal aged duplex stainless steels. Mater. Sci. Eng. A 2015, 625, 186–193. [Google Scholar] [CrossRef]
  19. Hättestrand, M.; Larsson, P.; Chai, G.; Nilsson, J.-O.; Odqvist, J. Study of decomposition of ferrite in a duplex stainless steel cold worked and aged at 450–500 °C. Mater. Sci. Eng. A 2009, 499, 489–492. [Google Scholar] [CrossRef]
  20. Krupp, U.; Alvarez-Armas, I. Short fatigue crack propagation during low-cycle, high cycle and very-high-cycle fatigue of duplex steel—An unified approach. Inter. J. Fatigue 2014, 65, 78–85. [Google Scholar] [CrossRef]
  21. Polák, J.; Zezulka, P. Short crack growth and fatigue life in austenitic-ferritic duplex stainless steel. Fatigue Fract. Eng. Mater. Struct. 2005, 28, 923–935. [Google Scholar] [CrossRef]
  22. De Finis, R.; Palumbo, D.; da Silva, M.M.; Galietti, U. Is the temperature plateau of a self-heating test a robust parameter to investigate the fatigue limit of steels with thermography? Fatigue Fract. Eng. Mater. Struct. 2017, 41, 917–934. [Google Scholar] [CrossRef]
  23. UF Kocks, H.M. Physics and phenomenology of strain hardening: the FCC case. Prog. Mater. Sci. 2003, 48, 171–273. [Google Scholar] [CrossRef]
  24. Abu Al-Rub, R.K.; Ettehad, M.; Palazotto, A.N. Microstructural modeling of dual phase steel using a higher-order gradient plasticity–damage model. Int. J. Solids Struct. 2015, 58, 178–189. [Google Scholar] [CrossRef]
  25. Gu, C.F.; Tóth, L.S.; Beausir, B. Modeling of large strain hardening during grain refinement. Scr. Mater. 2012, 66, 250–253. [Google Scholar] [CrossRef]
  26. Dan, W.J.; Huang, T.T.; Zhang, W.G. A Multi-Phase Model for High Strength Steels. Int. J. Appl. Mech. 2015, 7. [Google Scholar] [CrossRef]
  27. Ashby, M.F. The deformation of plastically non-homogeneous materials. Philos. Mag. 1970, 21, 399–424. [Google Scholar] [CrossRef]
  28. Nix, W.D.; Gao, H. Indentation size effects in crystalline materials A law for strain gradient plasticity. J. Mech. Phys. Solids 1998, 46, 411–425. [Google Scholar] [CrossRef]
  29. Gao, H.J.; Huang, Y.G. Geometrically necessary dislocation and size dependent plasticity. Scr. Mater. 2003, 48, 113–118. [Google Scholar] [CrossRef]
  30. Jiang, Z.H.; Guan, Z.Z.; Lian, J.S. Effects of microstructural variables on the deformation behaviour of dual-phase steel. Mater. Sci. Eng. A 1995, 190, 55–64. [Google Scholar] [CrossRef]
  31. Sodjit, S.; Uthaisangsuk, V. Microstructure based prediction of strain hardening behavior of dual phase steels. Mater. Des. 2012, 41, 370–379. [Google Scholar] [CrossRef]
  32. Taupin, V.; Berbenni, S.; Fressengeas, C.; Bouaziz, O. On particle size effects: An internal length mean field approach using field dislocation mechanics. Acta Mater. 2010, 58, 5532–5544. [Google Scholar] [CrossRef]
  33. Zhuang, X.; Ma, S.; Zhao, Z. Effect of particle size, fraction and carbide banding on deformation and damage behavior of ferrite–cementite steel under tensile/shear loads. Model. Simul. Mater. Sci. Eng. 2016, 25. [Google Scholar] [CrossRef]
  34. Kadkhodapour, J.; Schmauder, S.; Raabe, D.; Ziaei-Rad, S.; Weber, U.; Calcagnotto, M. Experimental and numerical study on geometrically necessary dislocations and non-homogeneous mechanical properties of the ferrite phase in dual phase steels. Acta Mater. 2011, 59, 4387–4394. [Google Scholar] [CrossRef]
  35. Suh, Y.S.; Joshi, S.P.; Ramesh, K.T. An enhanced continuum model for size-dependent strengthening and failure of particle-reinforced composites. Acta Mater. 2009, 57, 5848–5861. [Google Scholar] [CrossRef]
  36. Sung, J.H.; Kim, J.H.; Wagoner, R.H. A plastic constitutive equation incorporating strain, strain-rate, and temperature. Int. J. Plast. 2010, 26, 1746–1771. [Google Scholar] [CrossRef]
  37. Dan, W.J.; Lin, Z.Q.; Li, S.H.; Zhang, W.G. Study on the mixture strain hardening of multi-phase steels. Mater. Sci. Eng. A 2012, 552, 1–8. [Google Scholar] [CrossRef]
  38. Perlade, A.; Bouaziz, O.; Furnémont, Q. A physically based model for TRIP-aided carbon steels behavior. Mater. Sci. Eng. A 2003, 356, 145–152. [Google Scholar] [CrossRef]
  39. Sinclair, C.W.; Poole, W.J.; Bréchet, Y. A model for the grain size dependent work hardening of copper. Scr. Mater. 2006, 55, 739–742. [Google Scholar] [CrossRef]
  40. Ren, C.; Dan, W.J.; Xu, Y.S.; Zhang, W.G. Strain-Hardening Model of Dual-Phase Steel With Geometrically Necessary Dislocations. J. Eng. Mater. Technol. 2018, 140. [Google Scholar] [CrossRef]
  41. Delincé, M.; Bréchet, Y.; Embury, J.D.; Geers, M.G.D.; Jacques, P.J.; Pardoen, T. Structure–property optimization of ultrafine-grained dual-phase steels using a microstructure-based strain hardening model. Acta Mater. 2007, 55, 2337–2350. [Google Scholar] [CrossRef]
  42. Duan, D.M.; Wu, N.Q.; Zhao, M.; Slaughter, W.S.; Mao, S.X. Effect of strain gradients and heterogeneity on flow strength of particle reinforced metal-matrix composites. J. Eng. Mater. Technol.-Trans. ASME 2002, 124, 167–173. [Google Scholar] [CrossRef]
  43. Ramazani, A.; Mukherjee, K.; Schwedt, A.; Goravanchi, P.; Prahl, U.; Bleck, W. Quantification of the effect of transformation-induced geometrically necessary dislocations on the flow-curve modelling of dual-phase steels. Int. J. Plast. 2013, 43, 128–152. [Google Scholar] [CrossRef]
  44. Kundu, A.; Field, D.P. Influence of plastic deformation heterogeneity on development of geometrically necessary dislocation density in dual phase steel. Mater. Sci. Eng. A 2016, 667, 435–443. [Google Scholar] [CrossRef]
  45. Liu, G.-R.; Gu, Y.T. A point interpolation method for two-dimensional solids. Int. J. Numer. Methods Eng. 2001, 50, 937–951. [Google Scholar] [CrossRef]
  46. Ren, C.; Dan, W.J.; Huang, T.T.; Zhang, W.G. Quantification analysis of the heterogeneity of microstructure of dual phase steel. Procedia Eng. 2017, 207, 2083–2088. [Google Scholar] [CrossRef]
  47. Gou, R.B.; Dan, W.J.; Zhang, W.G.; Yu, M. Research on flow behaviors of the constituent grains in ferrite–martensite dual phase steels based on nanoindentation measurements. Mater. Res. Express 2017, 4. [Google Scholar] [CrossRef]
  48. Cheng, G.; Choi, K.S.; Hu, X.; Sun, X. Determining individual phase properties in a multi-phase Q&P steel using multi-scale indentation tests. Mater. Sci. Eng. A 2016, 652, 384–395. [Google Scholar]
  49. Lian, J.; Garay, J.E.; Wang, J. Grain size and grain boundary effects on the mechanical behavior of fully stabilized zirconia investigated by nanoindentation. Scr. Mater. 2007, 56, 1095–1098. [Google Scholar] [CrossRef]
  50. Ji, D.; Zhang, M.; Zhu, D.; Luo, S.; Li, L. Influence of microstructure and pre-straining on the bake hardening response for ferrite-martensite dual-phase steels of different grades. Mater. Sci. Eng. A 2017, 708, 129–141. [Google Scholar] [CrossRef]
  51. Massart, T.J.; Pardoen, T. Strain gradient plasticity analysis of the grain-size-dependent strength and ductility of polycrystals with evolving grain boundary confinemen. Acta Mater. 2010, 58, 5768–5781. [Google Scholar] [CrossRef]
Figure 1. Schematic of the microstructure.
Metals 08 00824 g001
Figure 2. The DP steel cell.
Metals 08 00824 g002
Figure 3. Mismatch of deformation along the particle boundary.
Metals 08 00824 g003
Figure 4. Schematic of indentation deformation, (a) the GNDs array in ferrite matrix, (b) the local amplification at ri of (a).
Metals 08 00824 g004
Figure 5. Relative grain-boundary coverage.
Metals 08 00824 g005
Figure 6. Dimensions of DP600 sample for in situ tensile test (mm).
Metals 08 00824 g006
Figure 7. The metallographic figure of sample 3 with different overall strain during in situ tensile test, (a) ε = 0.026, (b) ε = 0.072, (c) ε = 0.126, and (d) ε = 0.157.
Metals 08 00824 g007
Figure 8. Distribution of the grain characteristic, (a) grain size of ferrite, (b) grain size of martensite, (c) average grain shape parameter Si, and (d) FMB percent CFM.
Metals 08 00824 g008aMetals 08 00824 g008b
Figure 9. True stress-strain curves of material.
Metals 08 00824 g009
Figure 10. Dislocation density: (a) SSD density, (b) GND density.
Metals 08 00824 g010
Figure 11. The stress of individual phases: (a) ferrite, (b) martensite.
Metals 08 00824 g011
Figure 12. The hardness of individual regions: (a) indentation points of different regions, (b) hardness of different regions.
Metals 08 00824 g012
Figure 13. Effects of the minimal GBD spacing effect, FMB percent and ferrite grain shape effect on true stress-strain of DP steel: (a) minimal GBD spacing, (b) FMB percent effect in small strain, (c) FMB percent effect in large strain, (d) ferrite grain shape.
Metals 08 00824 g013
Table 1. Mechanical properties of DP600 steel.
MaterialYM (GPa)YS (MPa)UTS (MPa)TE (%)
DP60020036867519.9
YM: Young’s modulus, YS: yield strength, UTS: ultimate tensile strength, TE: tensile elongation.
Table 2. Chemical composition (wt %) of DP600.
ElementCMnSiPCrMoNbNCu
Content (%)0.061.200.10.040.60.0050.0010.0060.006
Table 3. Parameters of DP600 steel.
Parametersfi d i ¯   ( μ m ) S i ¯ μi (GPa)KiFigi ρ i 0 biFitting Parameters
a i 1   a i 2  
Ferrite0.778.361.6078.50.0279.780.131 × 10−92.5 × 10−100.457−0.184
Martensite0.234.191.62720.19613.780.131 × 10−102.5 × 10⁻¹⁰−0.6111.547
Table 4. Parameters for the hardening model of DP600 steel [11,42].
Parametersλ* (µm) M M   M c F M   αw (µm)
Value0.020.43.00.680.330.5

