Article

Formation Procedure of Reaction Phases in Al Hot Dipping Process of Steel

1
Pos Ceramics, Pusan 48059, Korea
2
Department of Materials Science and Engineering, Pusan National University (PNU), Pusan 46241, Korea
*
Author to whom correspondence should be addressed.
Metals 2018, 8(10), 820; https://doi.org/10.3390/met8100820
Submission received: 25 September 2018 / Revised: 8 October 2018 / Accepted: 8 October 2018 / Published: 12 October 2018

Abstract

:
This study investigated the nucleation and growth mechanism of reaction layers and phases of hot-dipped boron steel in pure Al at 690 °C for 0–120 s. In the case of a dipping time of 30 s, reaction nuclei of width 10–15 μm and height 10 μm were formed on the steel surface in the flow direction of the liquid Al. This reaction layer was formed as a mixture of θ (Fe4Al13) phase of several nm to 2 μm, θ and η (Fe2Al5) of several nm, a columnar η region, and a β (FeAl) region of 500 nm thickness at the steel interface. At the grain boundaries of ferrite, in contact with the η phase, κ (Fe3AlC) was formed. Using the calculated Fe-Al phase diagram, it was determined that when Fe was dissolved in liquid Al from the steel above 2.5 at% (0.6 wt%), the θ phase was formed. Although most of the θ phases continuously grew toward the liquid phase, the θ phase in contact with the steel was transformed into the η phase with minimal differences in composition due to the inter-diffusion of Al and Fe. It was therefore concluded that the η phase formed at the interface became a growth nucleus and grew in a columnar form toward the steel.

1. Introduction

Boron steel, which has 5 ppm contents to give about GPa level tensile strength, has been widely used for ultra-high-strength steel (UHSS) for automobiles. However, it is difficult to plastically deform due to the high mechanical properties. The hot-stamping process was applied to provide formability. During the hot-stamping process, a high pressure was loaded at an elevated temperature to deform the substrate and eventually it was rapidly quenched [1,2,3,4]. In order to prevent the oxidation of the steel during the hot-stamping process, an Al-Si coating should be prepared on the surface of the steel. Aluminized steels exhibit higher oxidation resistance than that of Zn-coated steels, such that aluminizing processes via hot dipping in Al or Al alloys are widely used for producing Al-coated steel [1,2,3,4]. In the hot dipping process, the coating layer formed on the surface of the steel is composed of an Al alloy solidification layer and a reaction layer. Additionally, in the process of brazing steels, with an aluminum filler metal, the reaction layer is formed at the interface. Several studies on the reaction layer formed by the reaction of the pure liquid Al with steel (Fe) have already been conducted, in most of which the reaction layer is mainly formed from the θ (FeAl3) and η (Fe2Al5) phases. The reported θ phase existed on the liquid Al side, with a thickness much thinner than that of the η phase [5,6,7,8,9,10,11,12,13,14,15,16,17,18,19,20,21,22,23,24]. There have been many studies focusing on the morphology and growth mechanism of the η phase in particular, rather than the θ phase.
The η phase grows toward the solid steel in the form of columnar grains and is known to be tongue- or sawtooth-shaped at the η phase/steel interface [7,8,9,10,11,12,13,14,15,16]. The mechanism of this morphology is due to the high vacancy concentration in the c-axis of the crystal structure (orthorhombic, oC24) of the η phase that causes Al to rapidly diffuse in the (001) direction [7,8,9,10,11,12,13,14,15,16]. It is also reported that the growth of the η phase obeys a parabolic rate law via the diffusion process [6,7,8,9,10,11,12,13,14,15,16].
However, the formation mechanism and growth kinetics of the θ phase are unclear. Bouche [8] reported that the growth of FeAl3 obeys a parabolic law, while Bouayard [11] stated that the growth proceeded linearly. Studies of the formation mechanism of the θ phase have proposed a reaction layer-forming mechanism including a solidification layer [7,8]. In particular, the formation mechanism of the θ phase in the initial reaction layer has not been investigated.
In the actual hot dipping process, the dipping time lasts only a few seconds; therefore, understanding the early nucleation of the reaction layer in the hot dipping process is more important than the study of the growth mechanism and growth kinetics. Although much research on the growth process of the phase in the reaction layer has been proposed, the study on the nucleation process of the reaction layer has not been widely investigated. Pasche [21] reported that the nucleation of the reaction layer was initiated in the liquid Al from real-time observations with time-resolved X-ray microtomography. However, because the data lacked sufficient detail, a definite nucleation mechanism was not suggested.
Therefore, it is necessary to investigate the type, size, and distribution of phases several microns in size and the reaction relationships between phases in the layer at the beginning of the process.
In this study, the nucleation reaction layer with a fine size (width 20 μm and height 1520 μm) at the initial stage of the steel dipping process was investigated in terms of type, size, distribution, and location to identify the nucleation mechanism and the growth process of the reaction layer and reaction phase on the surface.

2. Materials and Methods

1.2 mm boron steel (SABC1470 grade) was used in this study and its chemical composition was Fe–0.23C–0.24Si–1.19Mn–0.002B (wt%). High-purity 99.99 wt% Al was used for the coating. Coating specimens were cut to 40 × 120 mm size, exposed to acid of 40 mL H2SO4 + 200 mL CH3OH solution for 300 s, and washed with ethyl alcohol. Hot-dip experiments were carried out over varying amounts of time (10–120 s) at 690 °C in a laboratory-made induction melting furnace without the use of any conventional fluxing on the steel substrate. The bath temperature was monitored using a thermocouple inserted into the molten Al bath. After hot dip coating, the samples were cooled in air. The dipping temperature of 690 °C was selected to account for the A1 point (703 °C) of the steel and the Al melting point (690 °C). CH4OH (50 mL) + 2 mL HNO3 solution was used to etch the steel part, and the Al coating layer was etched in a 100 mL distilled water + 1 g NaOH solution.
The cross-sectional microstructure of the specimens was observed via optical microscopy (OM) with the Olympus (Tokyo, Japan) BX51M and field-emission scanning electron microscope (FE-SEM) with the Carl Zeiss (Oberkochen, Germany) SUPRA 45. The oxide layer formed on the steel surface was identified using X-ray diffraction (XRD) using a Rigaku (Tokyo, Japan) Ultima IV with 1°/min scanning speed. EDAX (Mahwah, NJ, USA) equipment was used to perform energy dispersive spectroscopy (EDS) in order to identify the elemental distribution in the coating layer.
In order to analyze the chemical composition distribution, the JEOL (Tokyo, Japan) JXA-8530F was used to perform field-emission electron probe microanalysis (FE–EPMA) and analyze the area with a 10 kV voltage, 100 nA current, and step sizes of 0.1–0.5 mm in a non-etching state. To analyze the phase of the reaction layer, specimens were deflected using the FEI (Hillsboro, OR, USA) Scios focused ion beam (FIB), and their chemical compositions and diffraction patterns were then obtained using the FEI (Hillsboro, OR, USA) TALOS F200X field-emission transmission electron microscope (FE-TEM). The EDAX (Mahwah, NJ, USA) Hikari electron backscatter diffraction (EBSD) camera was used to observe the phase distribution and crystal orientation of the reaction layer during the formation and growth, and the Media Cybernetics (Rockville, MD, USA) Image-Plus Pro image analysis program was used to obtain parameters such as the thickness and length of each phase. The nucleation and growth of intermetallic compounds were investigated by analyzing the phase diagrams obtained from the Thermo-Calc. software ver. 6.0 (Solna, Sweden).

3. Results and Discussion

3.1. Nucleation of Reaction Layer

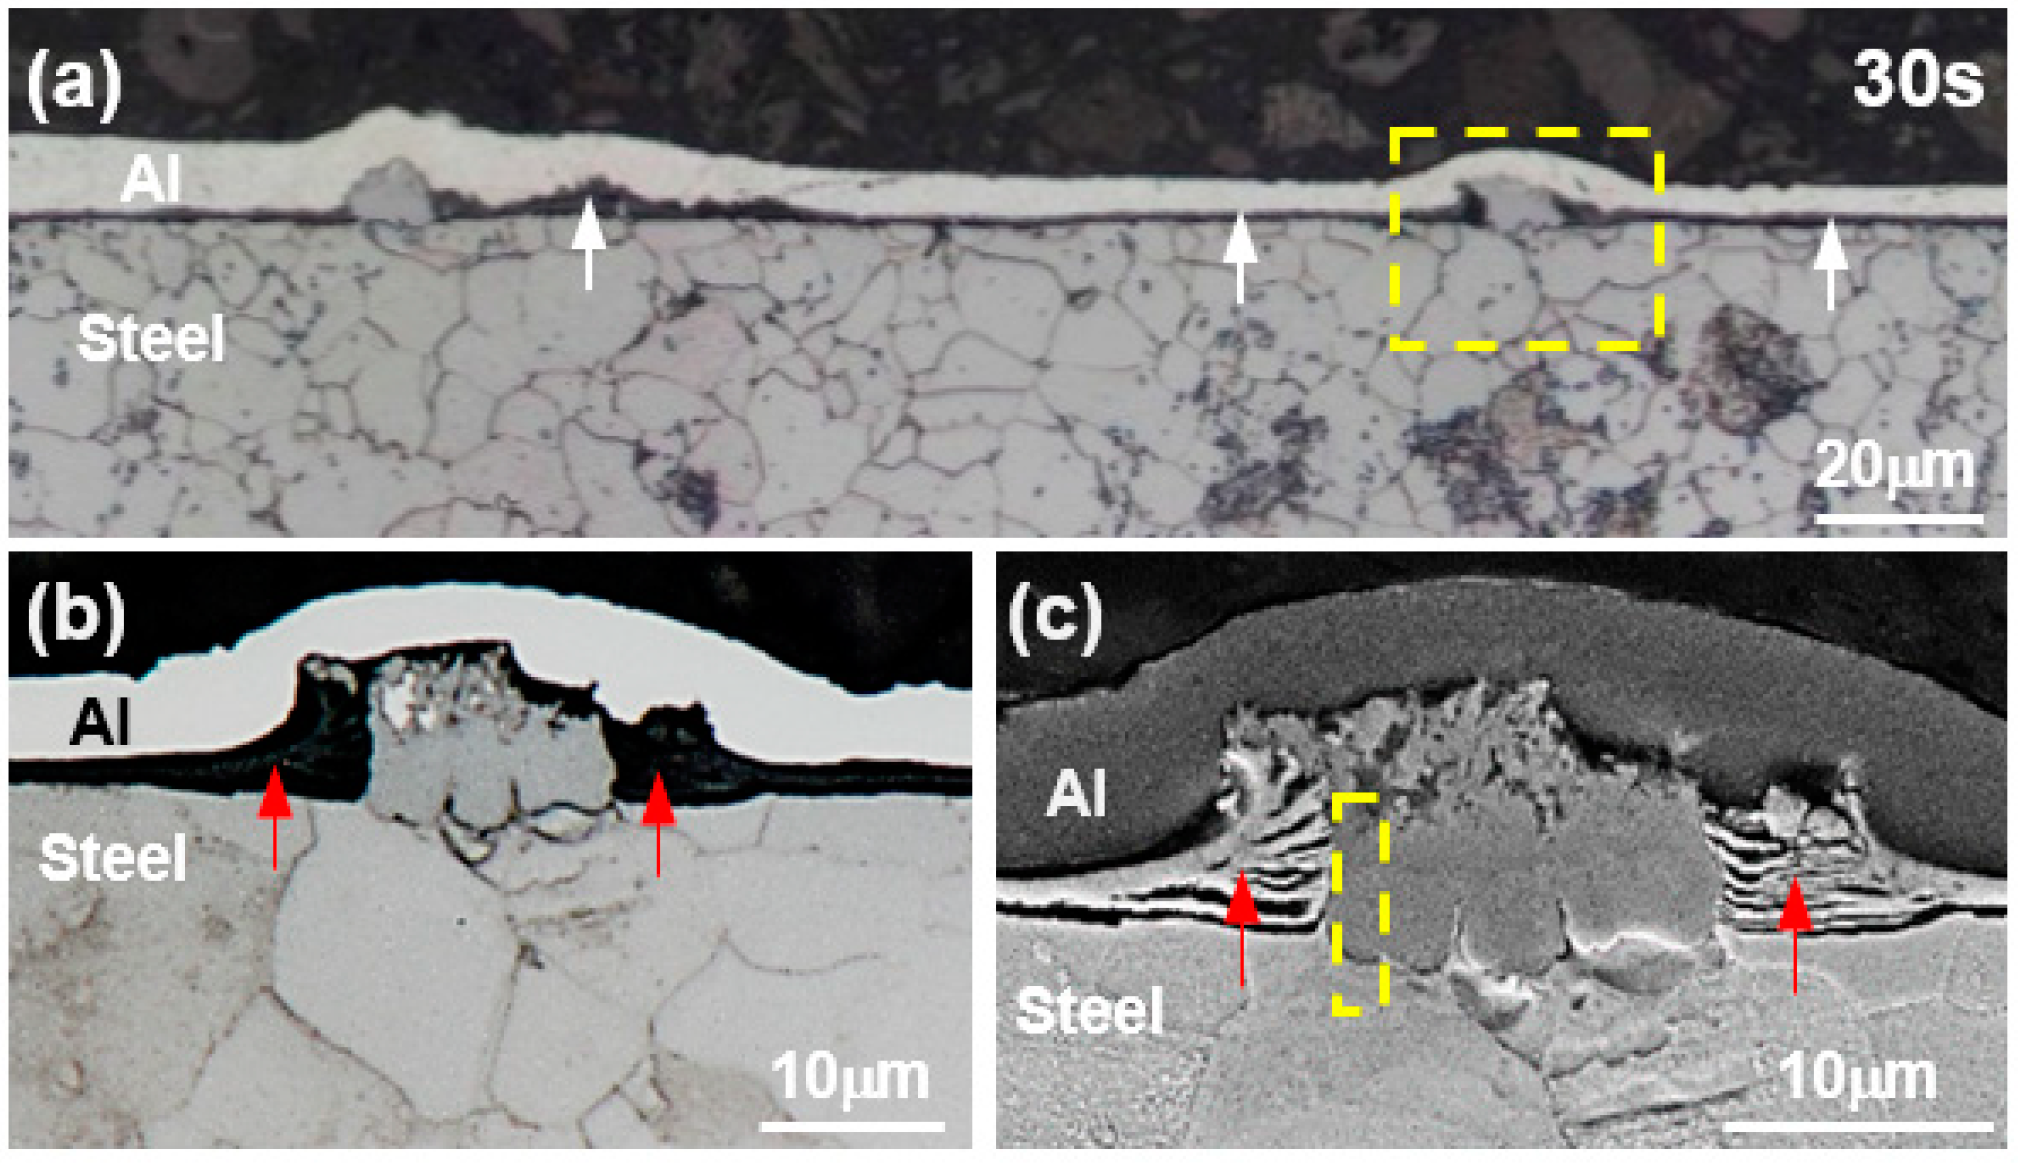
Figure 1a shows a cross-sectional optical microstructure of the specimen hot-dipped for 30 s at 690 °C. Figure 1b,c shows the optical microstructure and SEM microstructure of the area marked as dotted rectangular area. However, when the hot dipping time was maintained at 30 s or less, no reaction layer was formed.
When hot-dipped for 30 s, as shown in Figure 1a, a black stripe layer, which is identified with an arrow, formed at the interface between the Al and steel, and a fine reaction layer (width 10–15 μm, height 10 μm) was sporadically formed in this layer. In order to identify the black stripe layer and the reaction phase, we attempted to analyze the reaction layer region marked as dotted rectangular area in Figure 1a with FE-EPMA. 
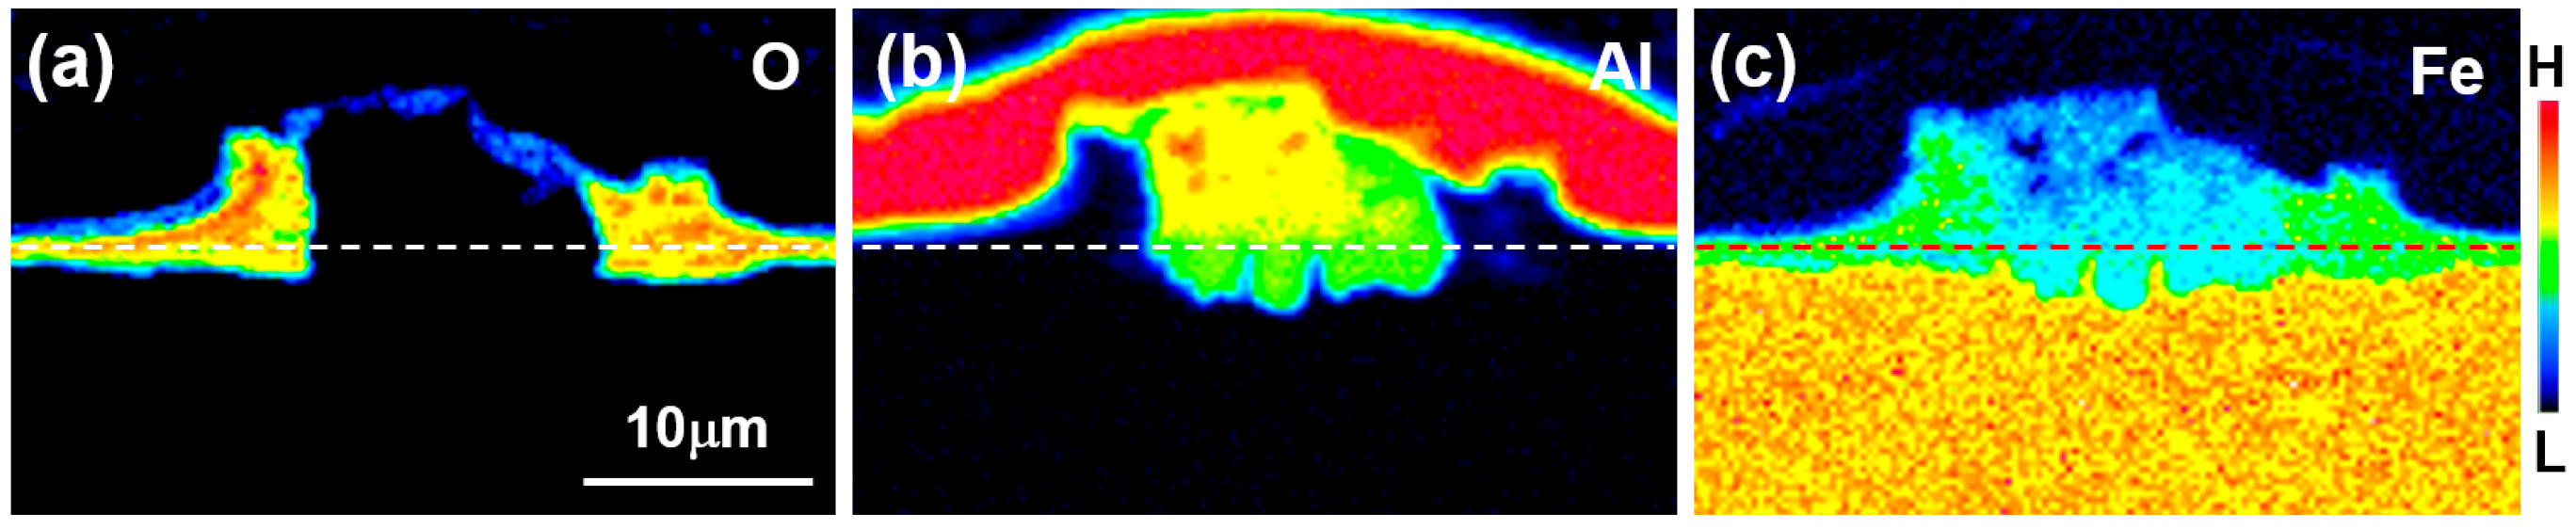
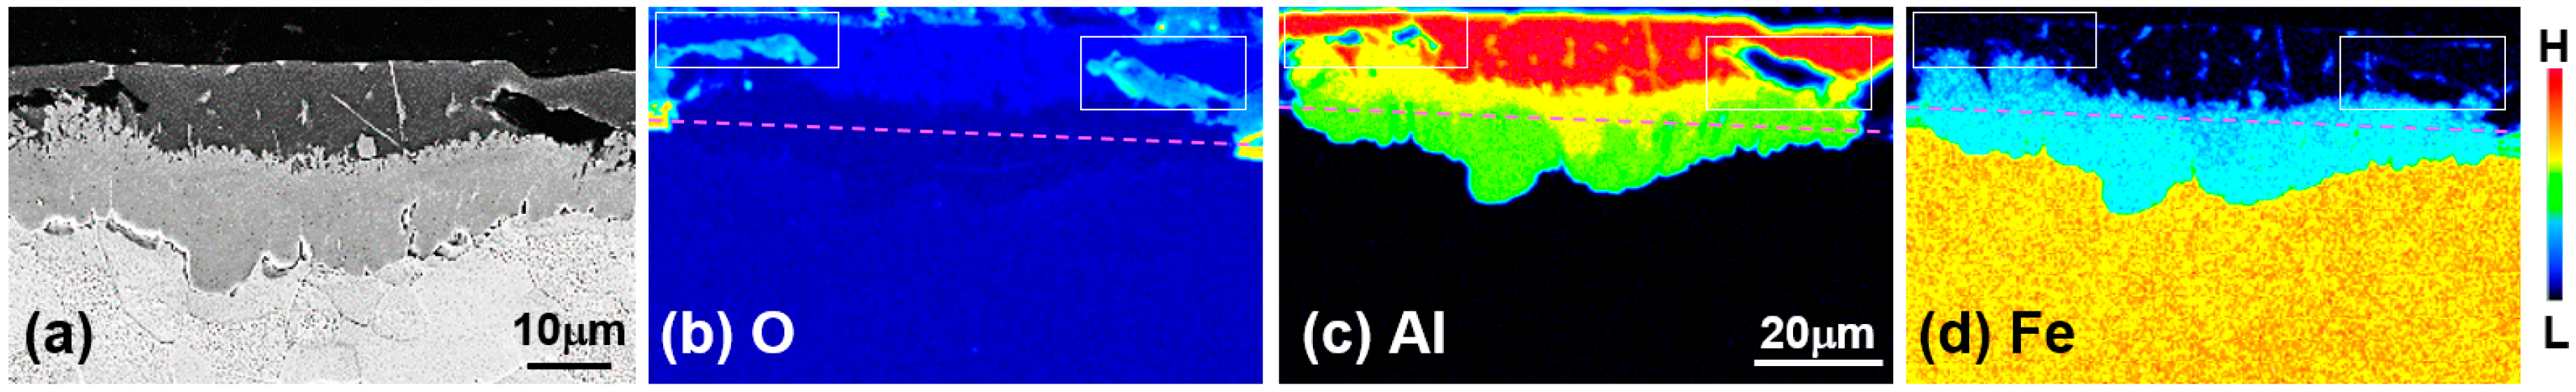
Figure 2 shows the results of the area’s FE-EPMA of O, Al, and Fe as the main component of the steel. The area where O was detected corresponds to the black stripe layer (↑) and the black stripe layer above the reaction layer at the Al/steel interface in Figure 1b. The black zone adjacent to the reactive layer and the layer at the Al/steel boundary corresponds to the area where Fe was detected. From these results, the black stripe layer is considered to be an Fe-based oxide layer. In the region where no O was detected, a reaction layer formed in which Al, a dipping composition, and Fe, a main component of steel, were mixed. From the shape of the oxide layer around the reaction layer and the EPMA result in Figure 2c, it can be deduced that when the oxide film reacts with the Al liquid phase and peels off in multiple layers, the liquid phase flows into the oxide film and the reaction layer forms on the surface of the steel.
In the EPMA results of Figure 2, the dotted line at the interface where Fe and O are present but Al does not represent the original surface of the unoxidized steel. Therefore, it can be concluded that the reaction layer was formed on the liquid phase side and the inner side of the steel with respect to the steel surface and grew longer toward the liquid phase. The Al concentration was also lower in the steel-reactive layer (green) than in the hot-dipped layer (yellow). The fact that the reactive layer was formed on the surface of the steel indicates that the constituent elements of the steel dissolved into the liquid phase to form a new solid phase nucleus.
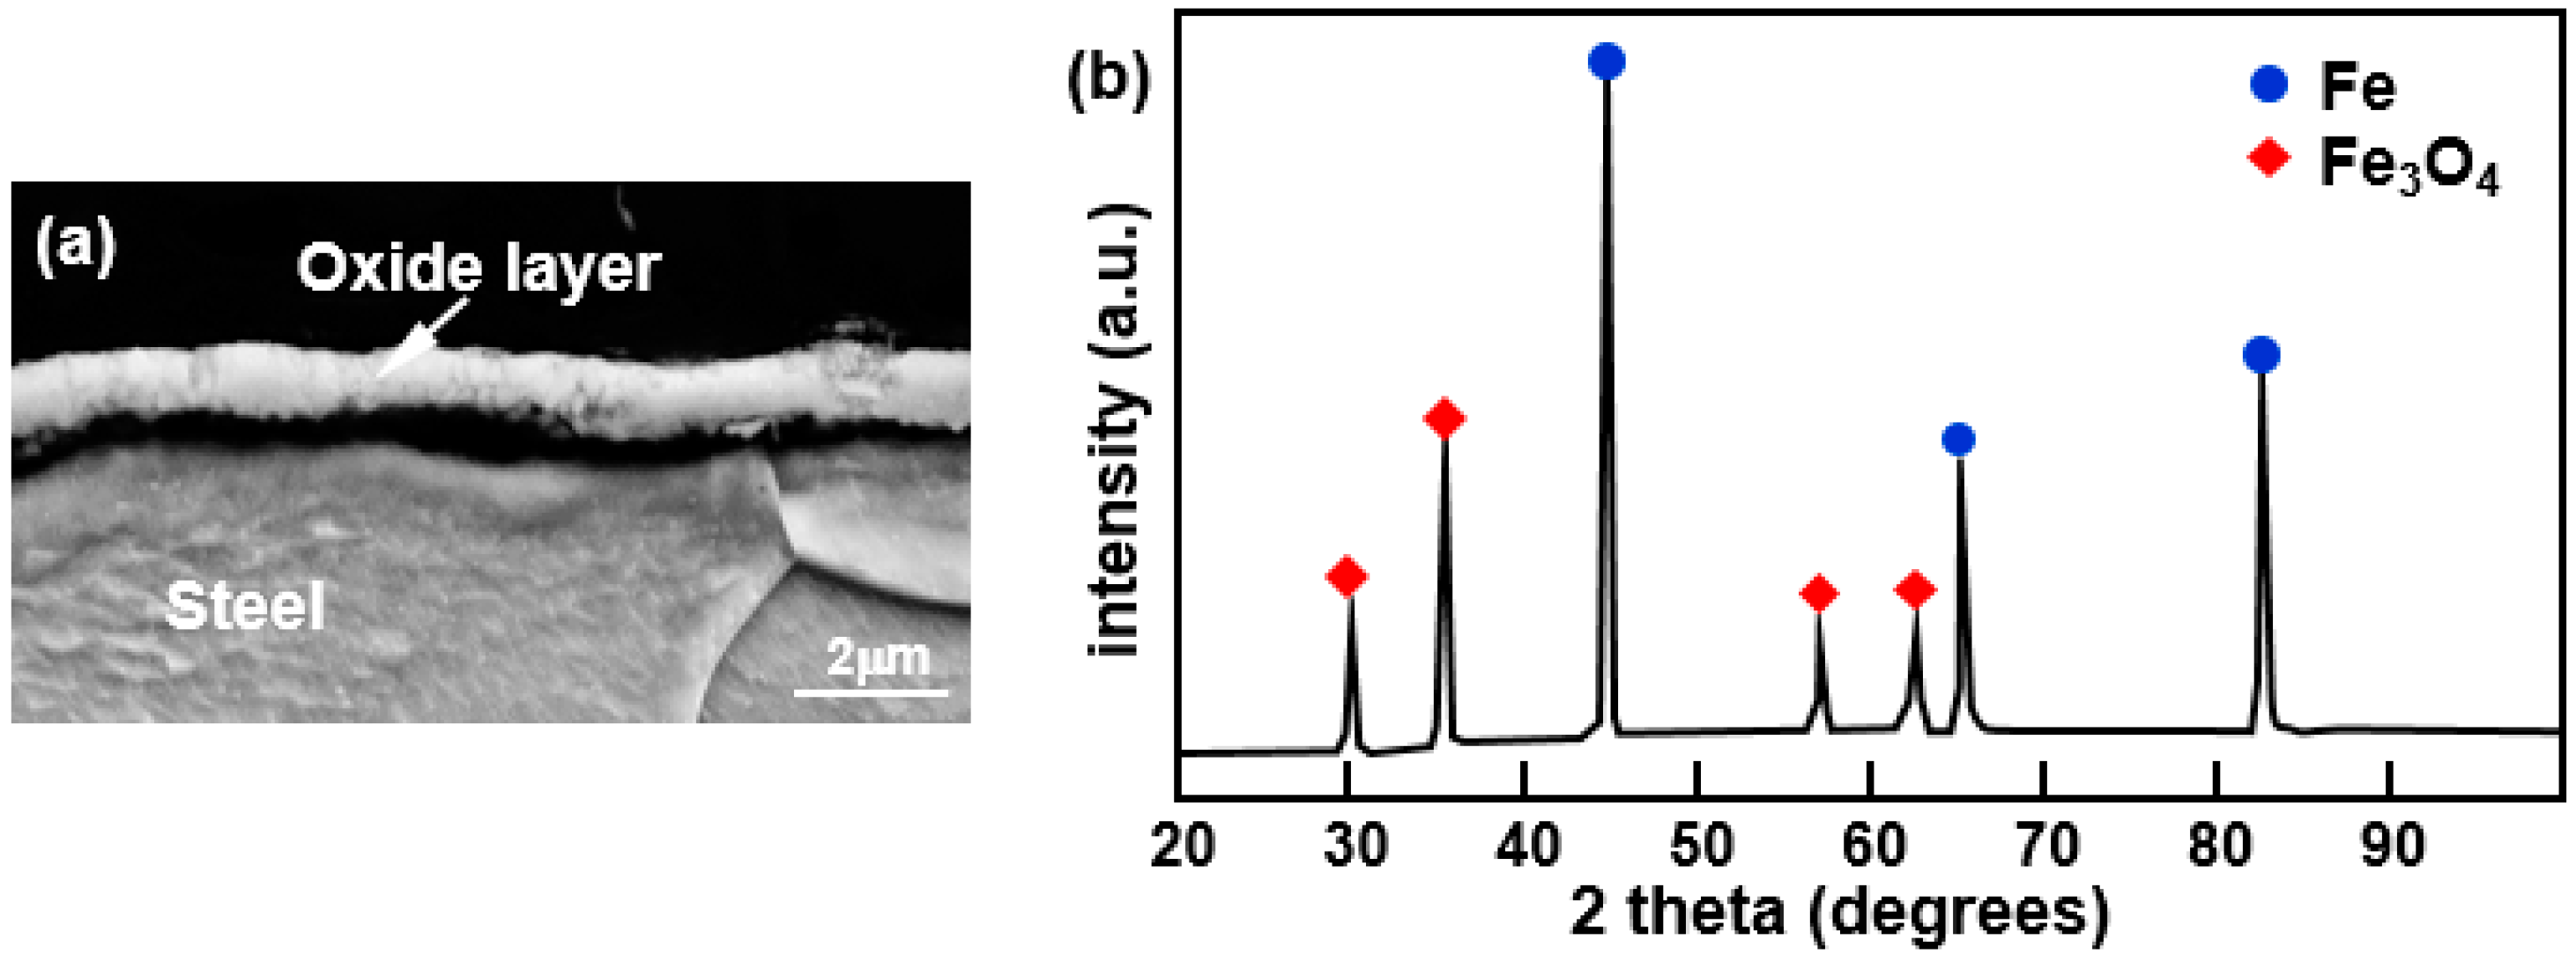
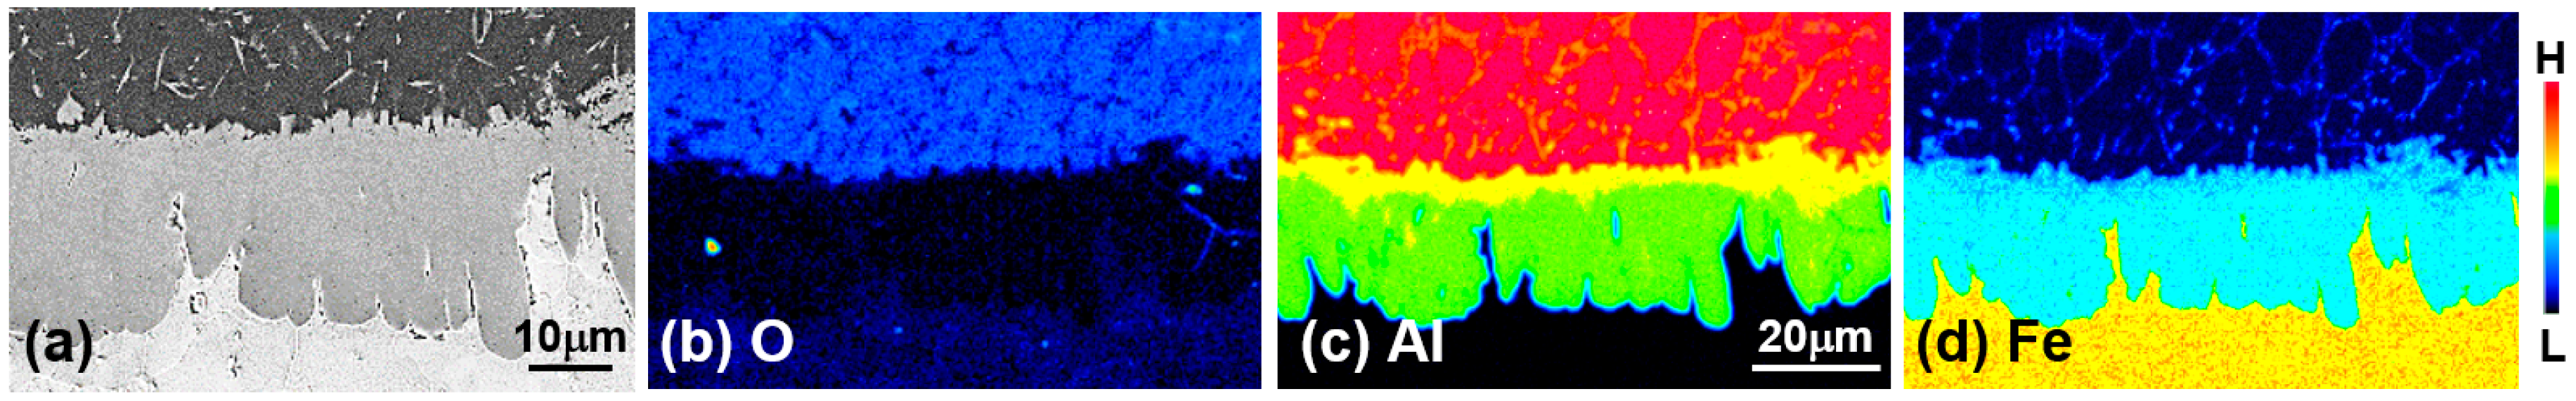
Figure 3a shows the cross-sectional microstructure of the oxide layer observed by SEM by selecting a region of the hot-dipped specimen where there was no reactive layer present on the surface. Figure 3b is the result from XRD analysis of the surface. From this, it was confirmed that the oxide layer is composed of Fe3O4, which is the most thermodynamically stable Fe-based oxide at temperatures below the hot dipping temperature. In contrast, when the boron steel was heated in an electric furnace maintained at 690 °C in the air for 10 s, no oxide layer was observed. From these results, it is presumed that Fe3O4 was formed by the reaction of the steel surface with oxygen in the Al melt.
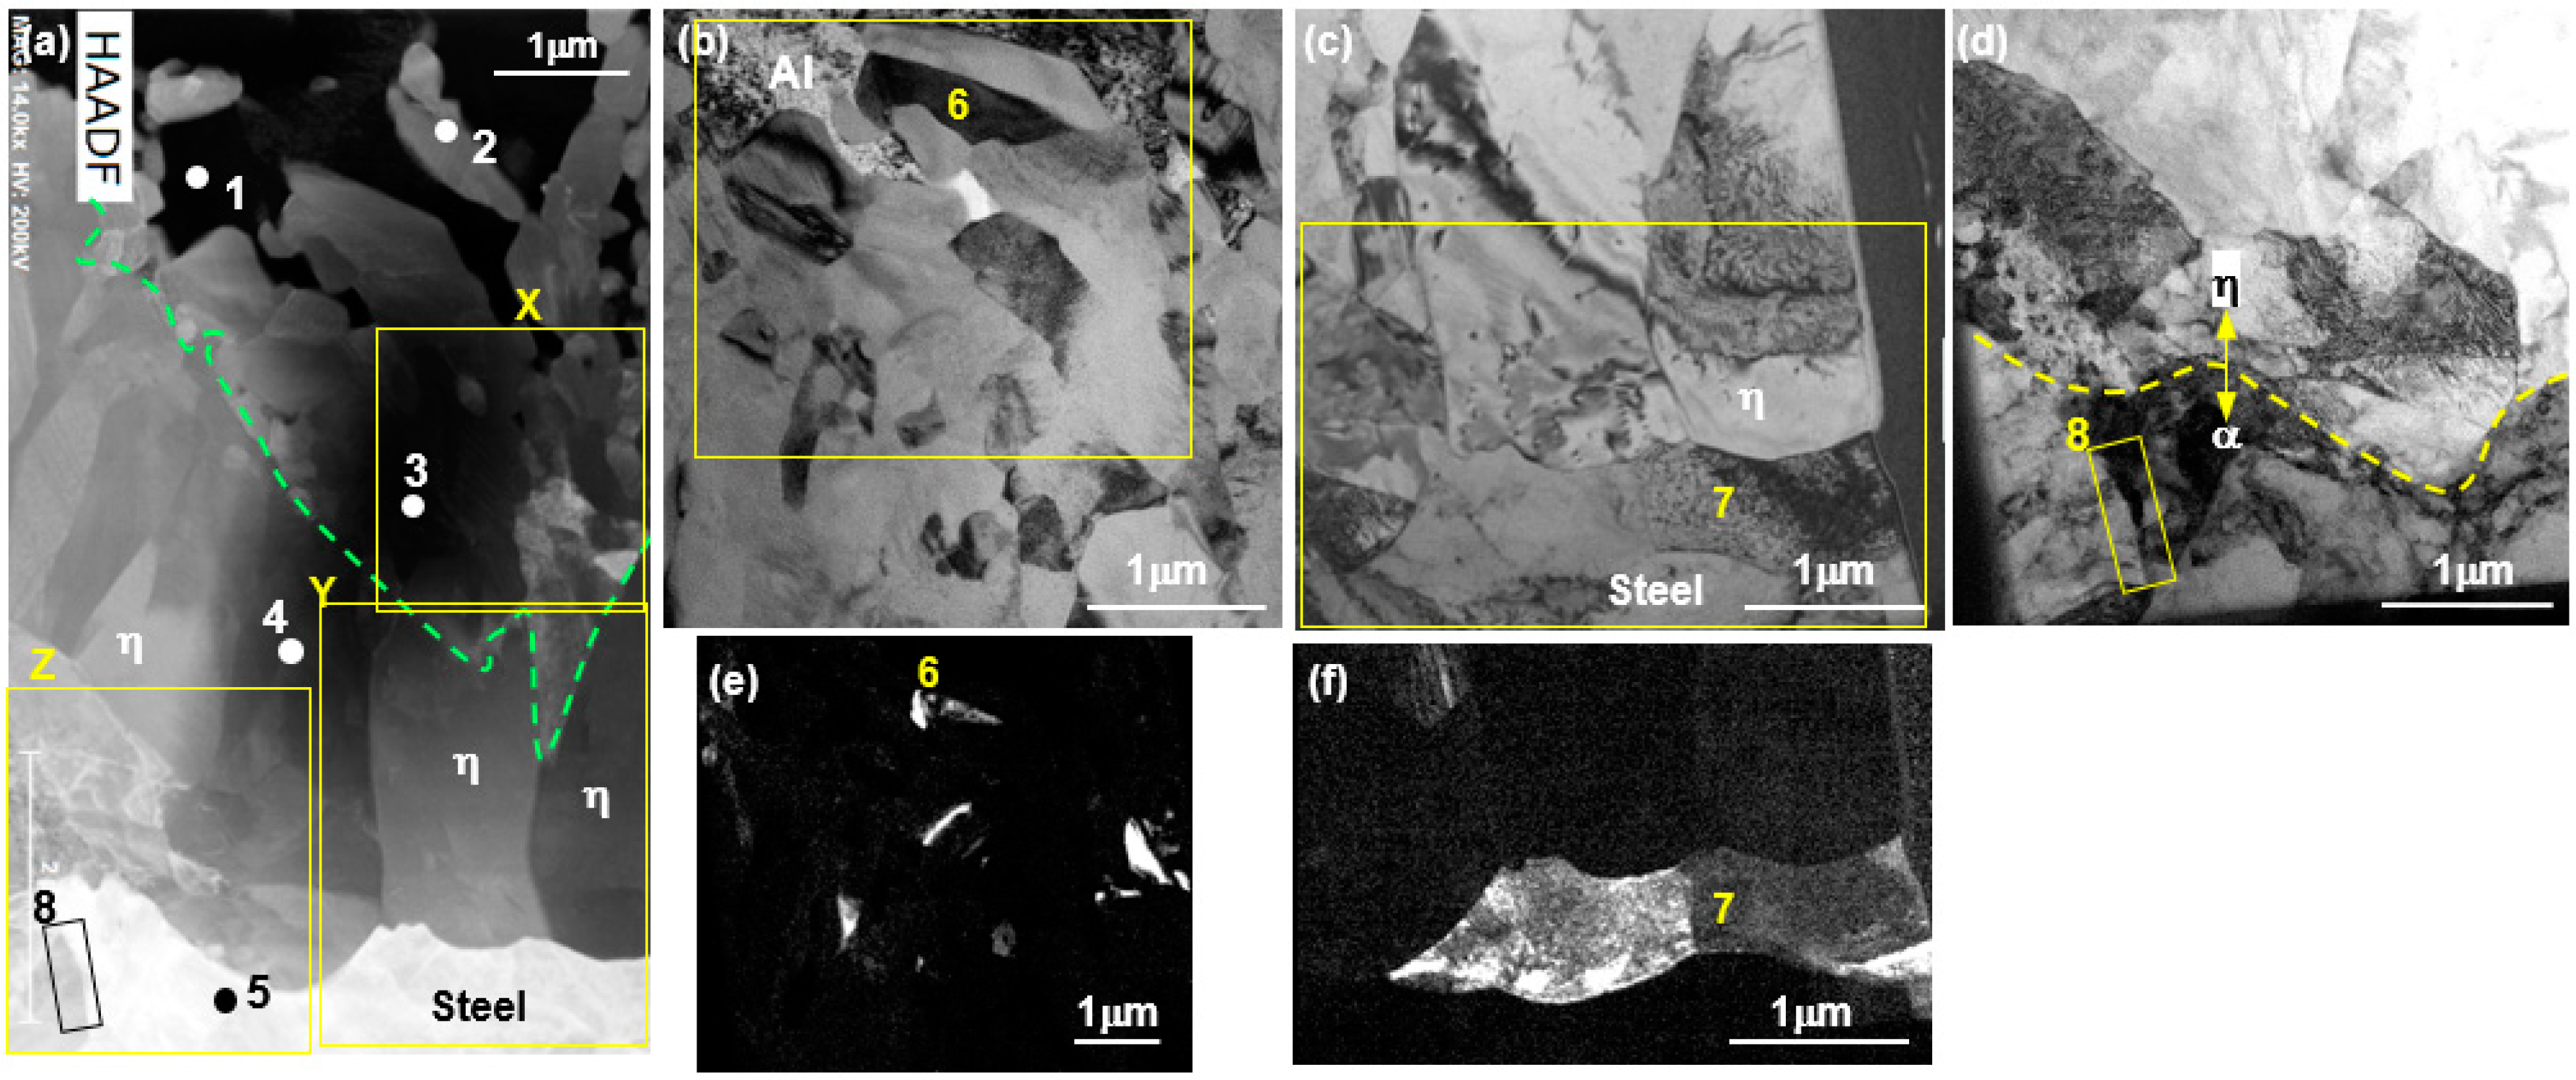
In order to investigate the phase in the nucleated reaction layer in the specimen hot-dipped for 30 s, the TEM was used with an FIB in the area marked as a dotted rectangular area in Figure 1c and observed by STEM.
Figure 4a shows the TEM high-angle annular dark-field imaged (HAADF) microstructure and Figure 4b–d shows the enlarged bright-field image X-Z (yellow rectangular) in Figure 4a. Figure 4e,f shows dark-field images of Figure 4b,c, respectively. Figure 5 shows the diffraction pattern and the result of analysis of the pattern indicated by the labels 1–8 in the figure. Table 1 shows the result of the EDS point analysis of the phase labelled 1–5 in Figure 4a.
From the results of the chemical composition analysis of the phases 1–5 (shown in Table 1) and the diffraction pattern analysis, phases 1 and 5 were composed of Al (main hot dipping component) and α-ferrite (base metal). From the results of the analysis of the diffraction pattern from each phase, phases 2 and 3 were found to be Fe4Al13 (θ phase, monoclinic) and phase 4 was identified as Fe2Al5 (η phase, orthorhombic).
Figure 4b,e shows the bright-field image and dark-field image, respectively, in order to observe in detail the distribution of the phases in the area labelled X in the HAADF image shown in Figure 4a. Figure 5f shows that the phase indicated by diffraction pattern 6 in the dark-field image is composed of Fe2Al5 (η phase). This means that phases such as 6, which appear black in Figure 4b, are phases that appear white in Figure 4e. It can, therefore, be seen that the η phase of size 1 μm or less is dispersed in the Fe4Al13 (θ) phase in the X region.
Figure 4 c,f shows the bright-field image and dark-field image of the areas labelled Y in Figure 2a where the phase of the Al concentration was lower than that of Fe2Al5 at the Fe2Al5/steel interface. Figure 5g shows the result of the diffraction pattern analysis of phase 7 in Figure 4f. This was found to be a FeAl (α2 or β, cubic) phase. These features are characterized by a high dislocation density and lateral growth, in contrast to the Fe2Al5 (η) phase.
Figure 4d shows the enlarged bright-field image of the η phase/steel interface Z region in Figure 2a, Figure 5h shows the diffraction pattern analysis result of the phase labelled 8 in Figure 4f. From these results, it can be seen that the nanoscale κ (Fe3AlC, cubic) phase was formed along the grain boundaries. In addition, α-ferrite grains near the interface exhibit fine dimensionality and were characterized by a high dislocation density.
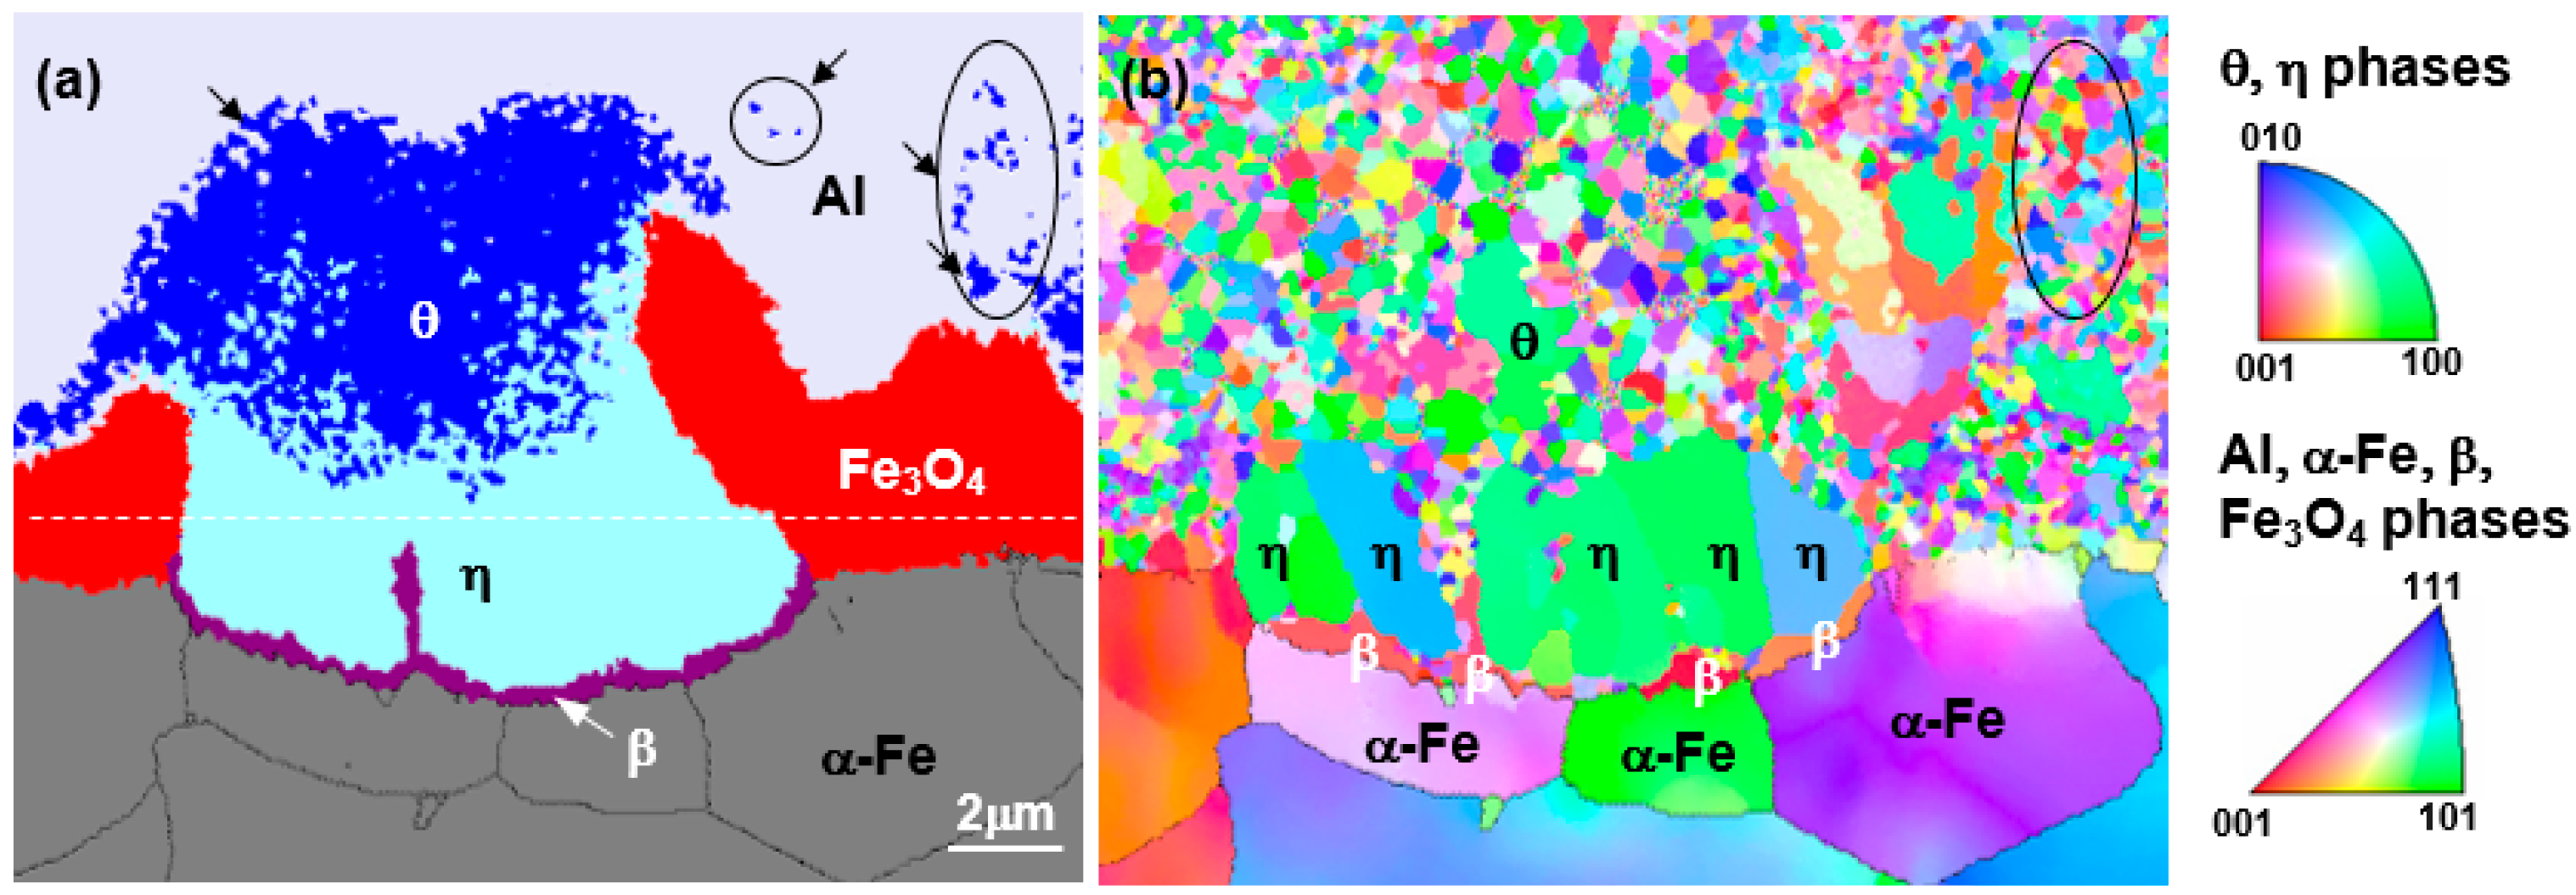
Figure 6 shows the result of electron back-scatter diffraction EBSD analysis of the reaction layer (hot-dipped for 30 s) in Figure 2, where (a) is the phase map and (b) is the inverse pole figure (IPF).
In the phase map results, the reaction layer features a θ layer on the liquid side and a η layer on the steel side, similar to the TEM observation and a β layer was observed at the η/steel (α) interface. The area where the θ phases exist can be classified into three areas: the area where the θ phase exists in the Al liquid phase (→), the region consisting of the θ phase only, and the region in which θ and η phases are mixed near the θ/η interface. This detail cannot be found in the TEM microstructure that enables observation of only the fine regions.
From the IPF image in Figure 6b, the θ grains present in the liquid phase were mostly several hundred nanometers in diameter. Although some grains of the θ phase-only region were 1–2 μm in diameter, most of the grains were smaller than 500 nm. The θ grains in the mixed-phase region consisted mostly of those several hundreds of nanometers in diameter. However, it can be seen that the η phase grows specifically in the <100> crystal orientation to a length of several micrometers in all but the mixed-phase region. At the η phase/steel interface, band-shaped grains perpendicular to the growth direction of η were observed. As these crystal grains differ from the η phase and steel in terms of crystal orientation, they were concluded not to be η-phase and ferrite. From these observations, it was decided that these grains were β (FeAl), labelled 7 in Figure 4c and 7 in Figure 4f. Meanwhile, the κ (Fe3AlC) phase present in the ferrite grain boundary in Figure 4d is too fine to be described as nanoscale and is not seen in EBSD.
From the above observations and analysis results, in the nucleated reaction layer there appears to be a θ phase region featuring a grain size between several hundred nm to 2 μm near the liquid phase, a mixed region of θ and η phases, a η phase region growing longest toward the steel, a band-type β (FeAl) region of thickness 500 nm at the η phase/steel interface. In addition, κ (Fe3AlC) was formed at the grain boundary of the base material in contact with the reaction layer.

3.2. Growth of Reaction Layer

Figure 7 is an optical micrograph of a specimen hot-dipped at 690 °C for 40–120 s, where the white line represents the original surface of the base metal. In the case of a dipping time of 40 s, nucleation occurred sporadically and formed a reaction layer. As the dipping time increased, the reaction layers coalesced with each other and grew in the surface direction. When the dipping time exceeded 90 s, the reaction layer that was formed completely covered the surface of the steel and a small measure of growth was observed in the base metal.
Figure 8 shows the BSE image (a) and the area’s EPMA results (b–d) of the area marked yellow dotted rectangular in Figure 7b. Comparing the concentrations of O, Fe, and Al in the area marked yellow rectangular, associated with the oxide film, the region with high O concentration corresponds to Al with respect to Fe and the distribution of O on the line corresponds well with the distribution of Al concentration. This indicates that the Fe3O4 oxide film initially formed on the surface of the steel and gradually reduced to Al2O3 and moved into the hot dipping liquid. As is already known, the reduction reaction of oxides occurs naturally because the free energy of Al2O3 at the dipping temperature is lower than that of Fe3O4 [25]. However, when the Al and Fe concentration distributions in the reaction layer are compared, that of the hot-dipped layer is higher than that of the steel-reactive layer formed on the base metal side. These results are similar to the concentration distribution of the nucleated reaction layer in Figure 2.
Figure 9 shows the BSE image (a) and the area’s EPMA results (b–d) of the yellow dotted rectangular area in Figure 7e. This result is similar to the concentration distribution of the reaction layer (Figure 2 and Figure 8) hot-dipped for 30 s and 50 s. Figure 10 shows the phase map (a), IPF (b), and enlarged IPF (c) denoted as red rectangular in (a) that was obtained by EBSD analysis of a specimen hot-dipped in pure Al melt for 120 s. The solidification layer consists of Al and the θ phase (○), whereas the reaction layer is divided into four regions as follows. The θ phase region in contact with the liquid phase, consisting of a θ grain (↙) grown to several μm in the liquid phase and a fine phase of 1 μm or less. As shown in Figure 10c, there is also a region positioned just below the θ phase mixed with the θ-and-η phase of 1 μm or less in size. The η phase region grows along a certain crystal orientation toward the base material (over an average of 20 μm), while the β phase region of 1 μm or less exists along the η phase/steel interface. The κ (Fe3AlC) phase is considered to have not appeared in the EBSD observations because it is too fine in size and because the crystal structure is the same as that of ferrite.

3.3. Formation Mechanism of the Reaction Layer and Phases

As can be seen in Figure 2, Figure 6 and Figure 8, the initially formed nucleated reaction layer was thickest toward the liquid Al region and was thin inside the steel region. The nucleation of the reaction layer was initialized in the liquid phase side, which caused the Fe in the steel to flow into the liquid Al. 
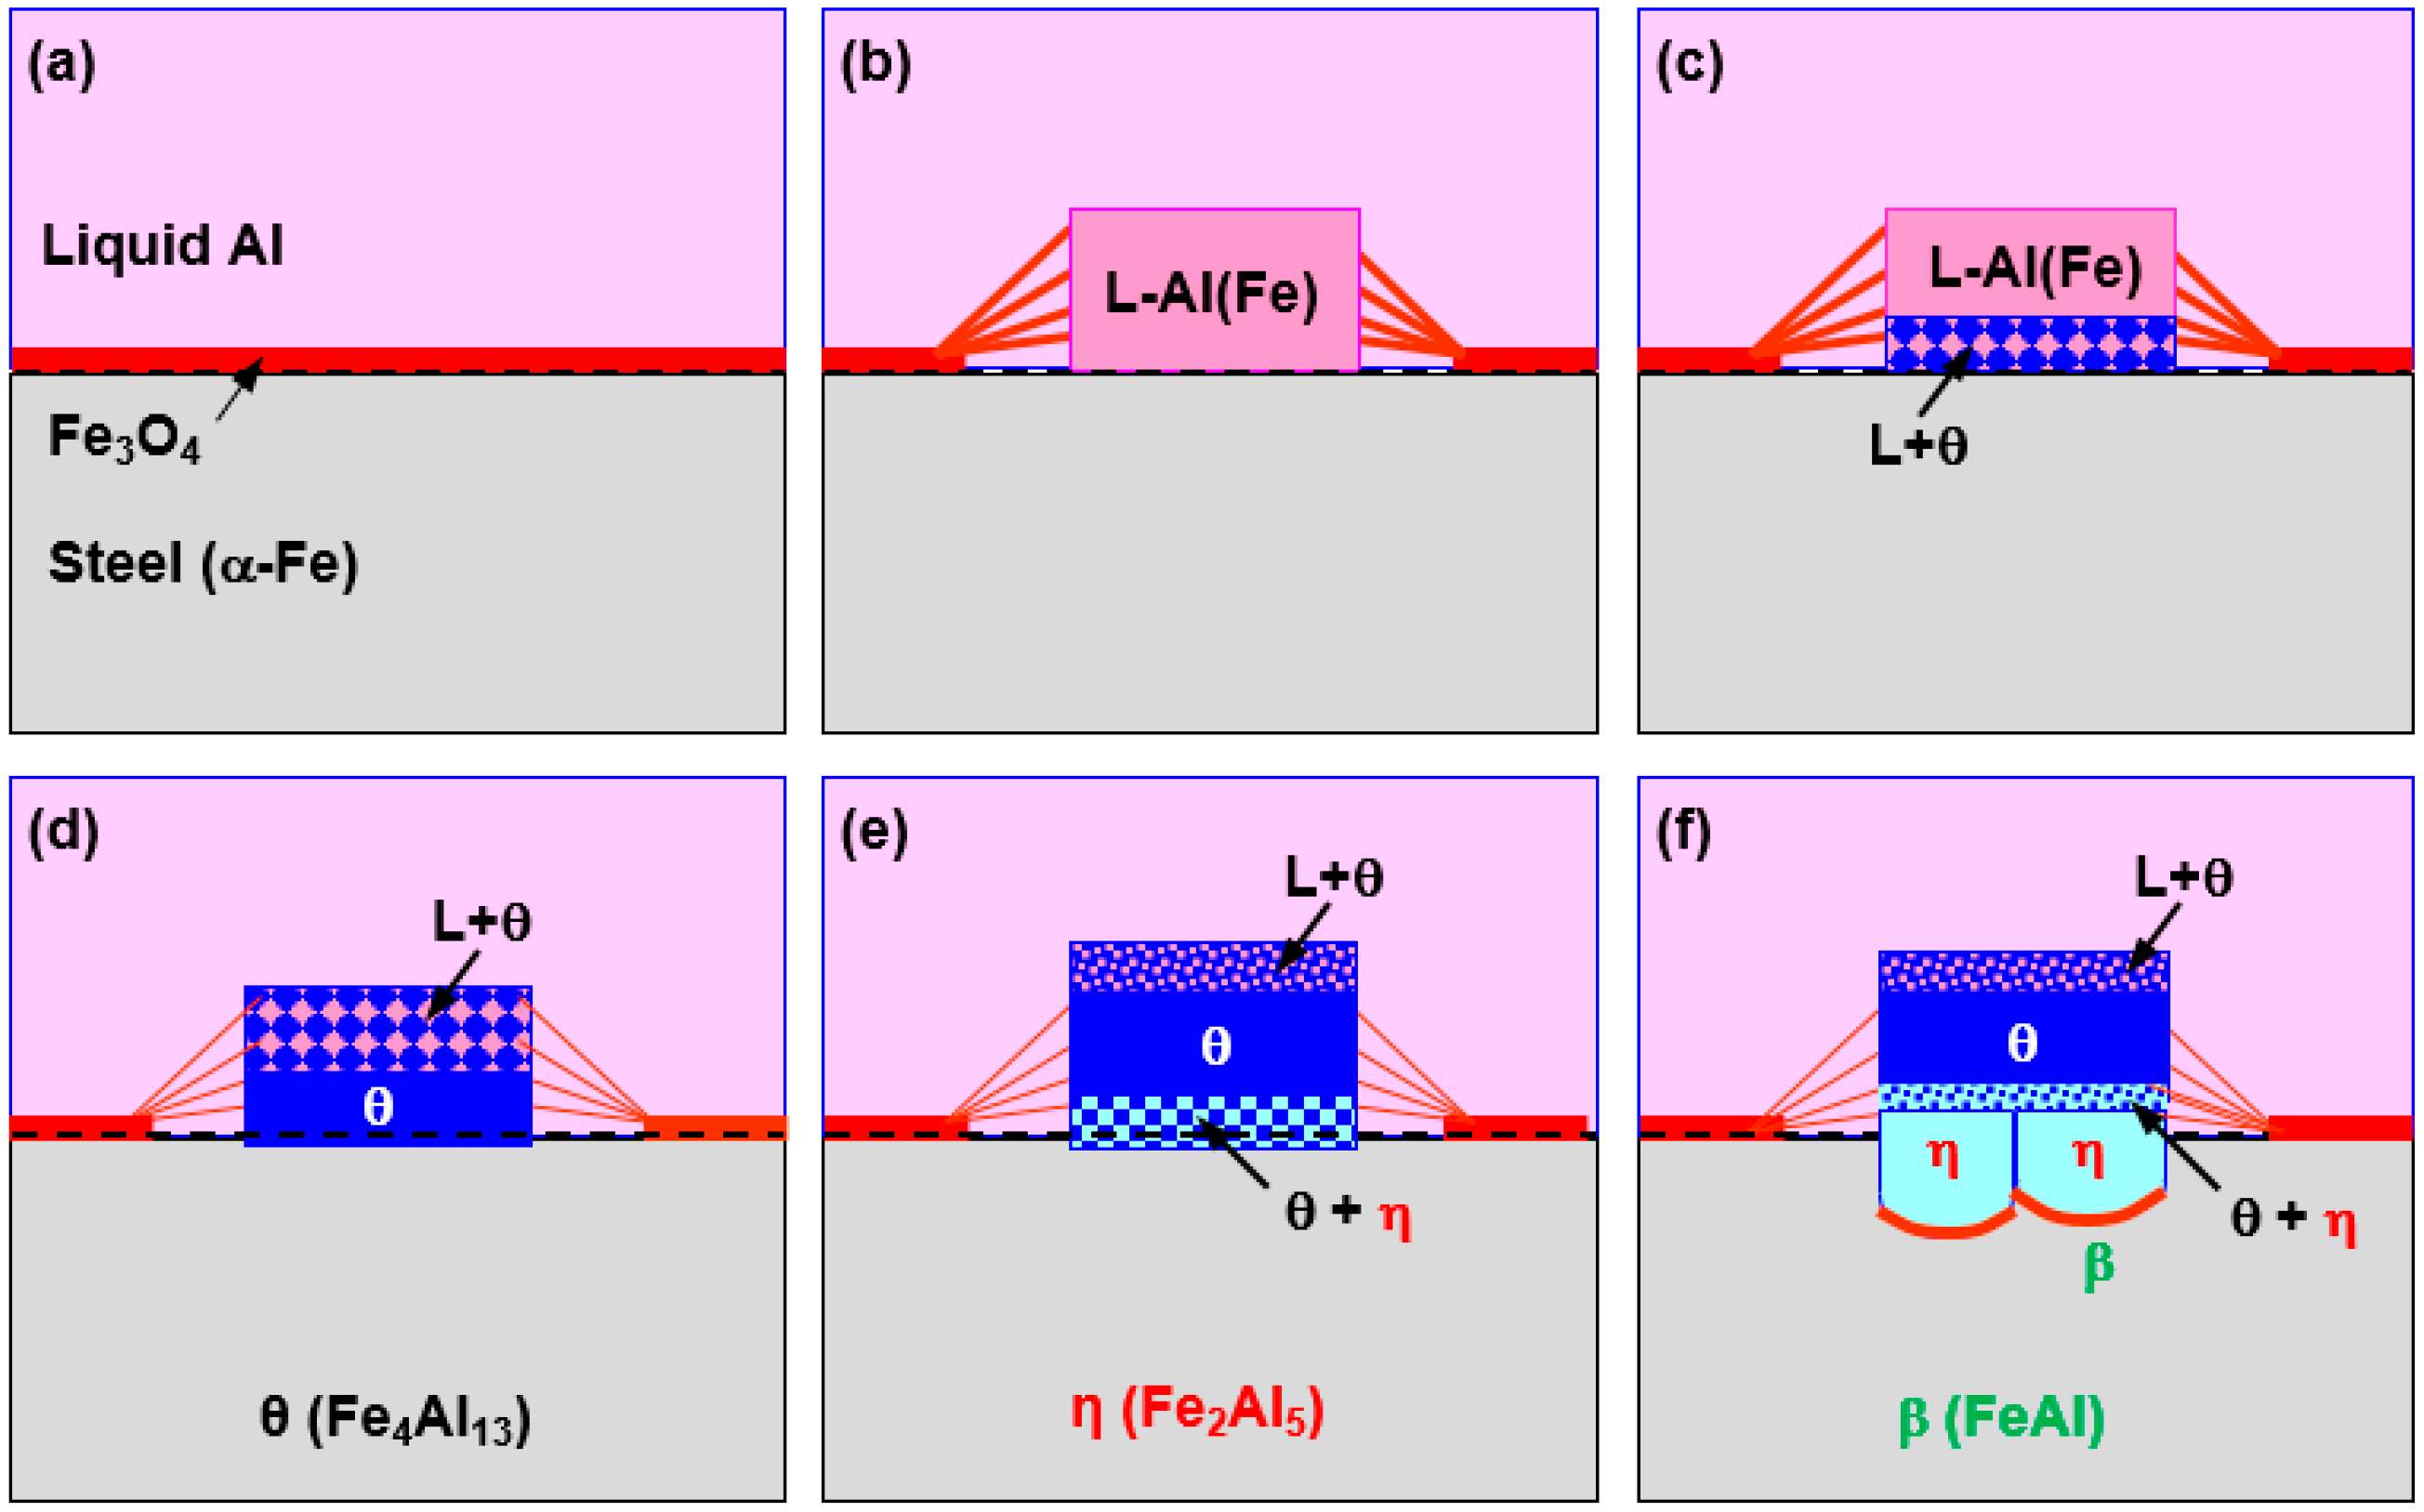
Figure 11 is a schematic diagram displaying the nucleation and formation process of the reaction layer and the reaction phase. Although the reaction layer consists of θ (Fe4Al13 or FeAl3) and η (Fe2Al5) phases, the θ phase formed first, later followed by the η phase. Figure 11a–d represents the formation process of the θ phase and Figure 11e,f depicts that of the η phase.
An Fe3O4 oxide film formed on the surface of the steel while the steel was immersed in the liquid Al. The oxide film was destroyed as it was replaced with Al2O3 through the reaction with liquid Al and the reaction of liquid Al with the steel. Figure 11b The path of Fe into the liquid phase is thought to occur by two mechanisms; one is the dissolution-diffusion of Fe from the surface of the steel, and the other is the generation of Fe by the reduction reaction between the Fe3O4 oxide film and the liquid Al.
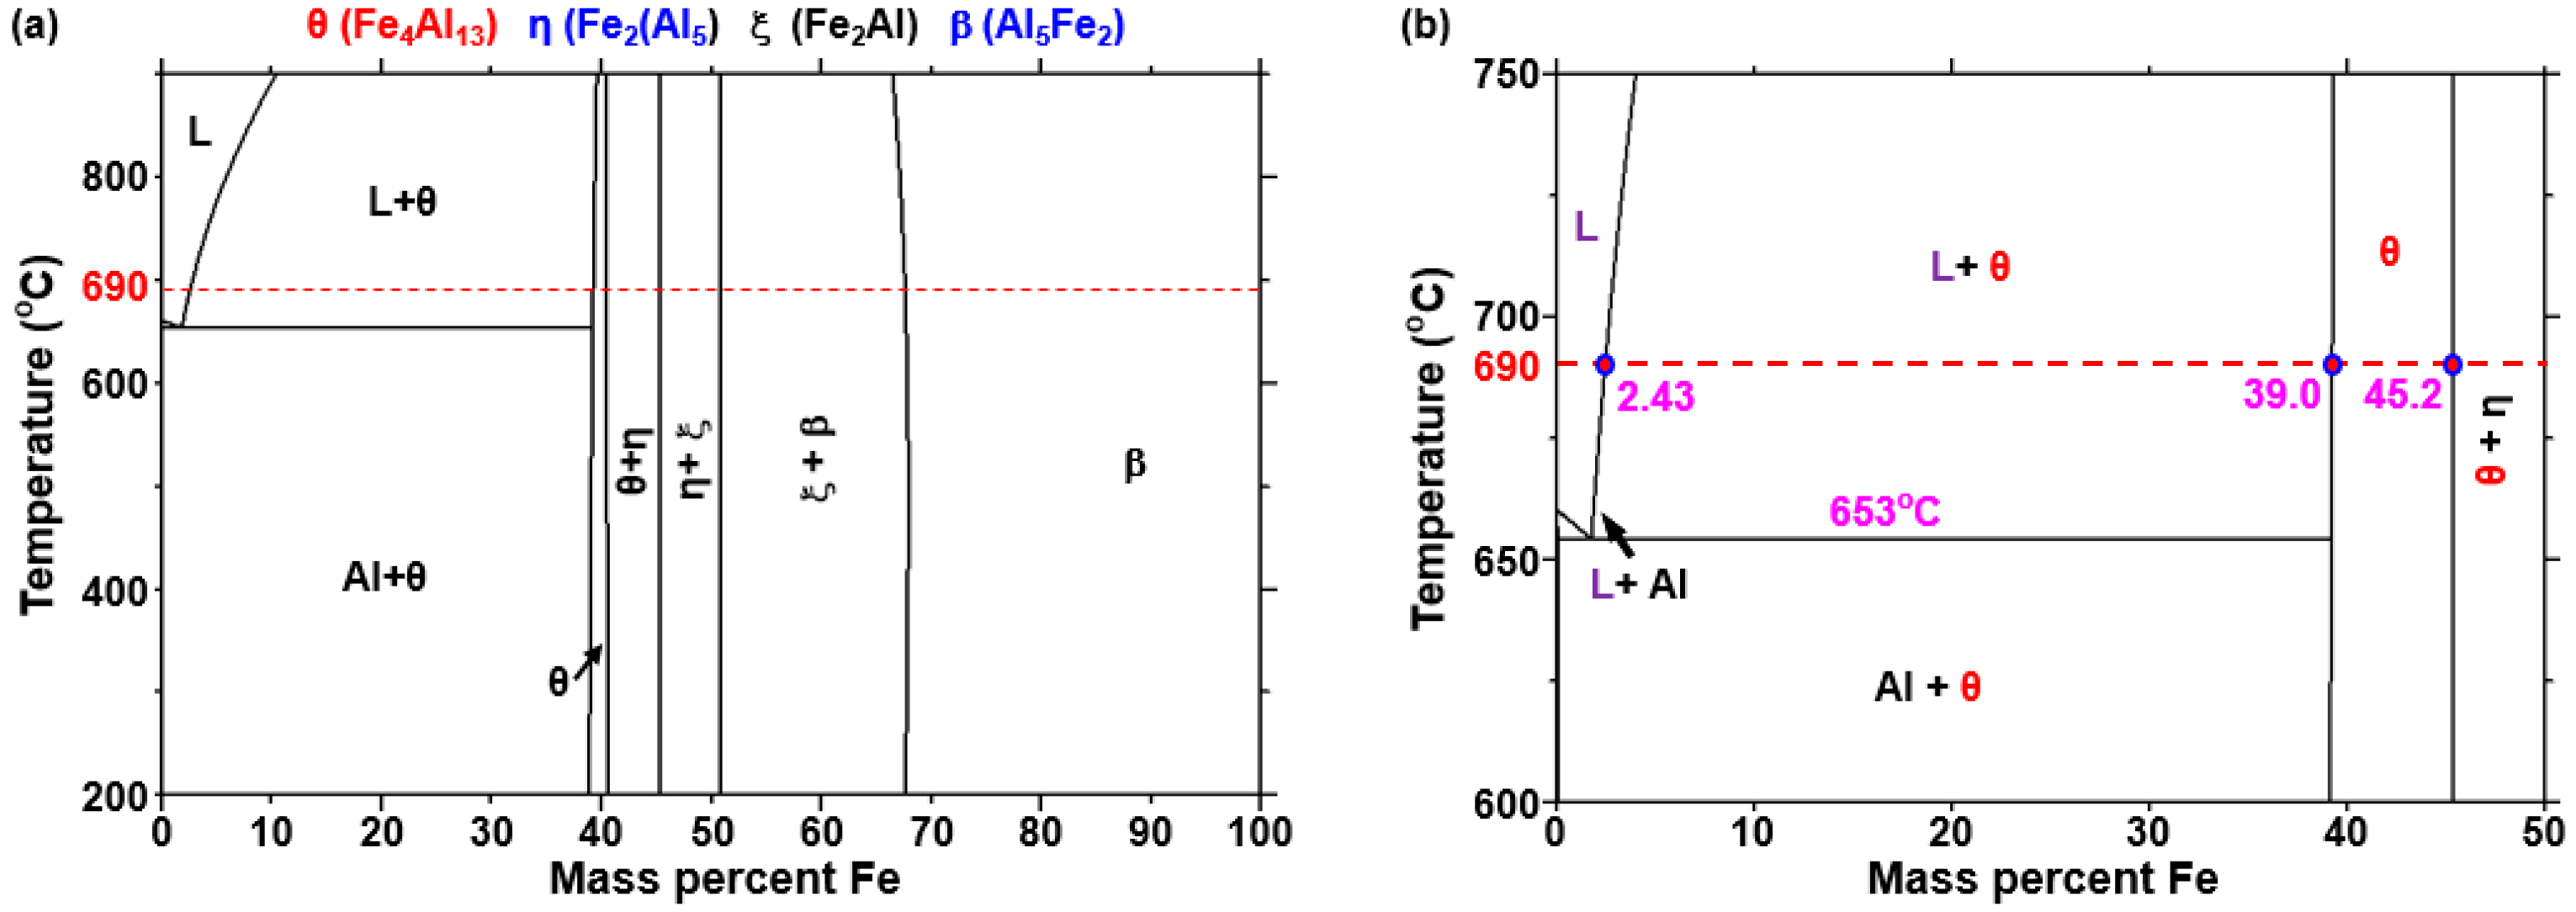
In order to determine the phase transformation of the liquid Al with increasing Fe content at 690 °C, the Al-Fe binary phase diagram was investigated using the software as shown in Figure 12. There are two processes in which a solid phase can be transformed; when the Fe concentration is increased more than approximately 2.43 wt% at 690 °C, the solid θ phase (Fe4Al13 or FeAl3) and the liquid Al is generated, so that the θ phase is solidified in the liquid near the steel interface. In other words, if the concentration of Fe in the liquid is approximately 2.43 wt% or more, the θ phase can solidify isothermally at 690 °C. Alternatively, when the concentration of Al in the liquid is higher than the eutectic composition (2.0 wt%, 3.97 at%), not only the θ phase is solidified during the cooling process but also the eutectic reaction of the combined Al and θ phase can occur. 
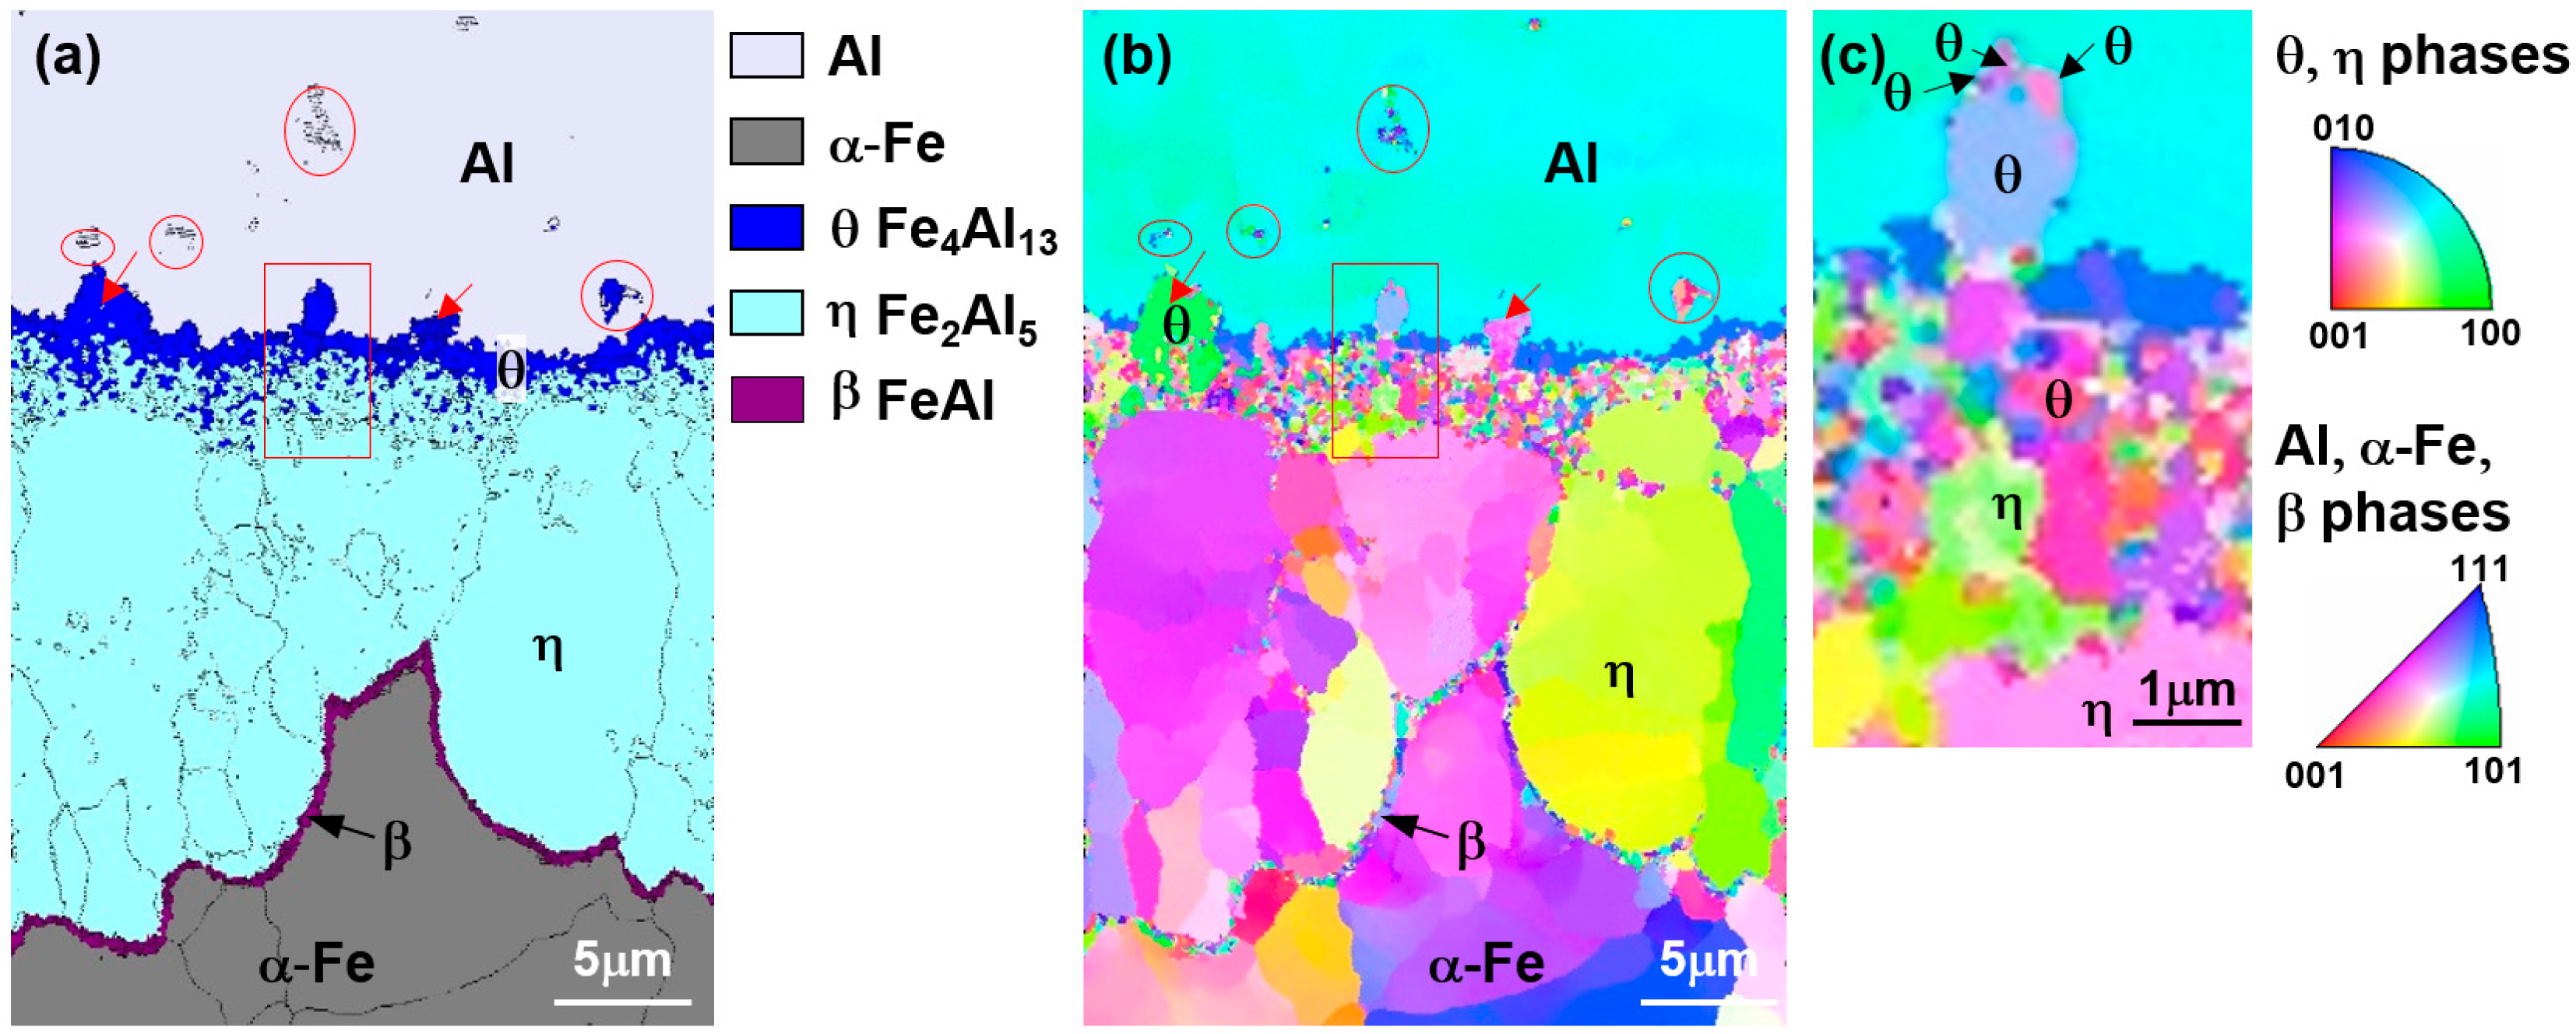
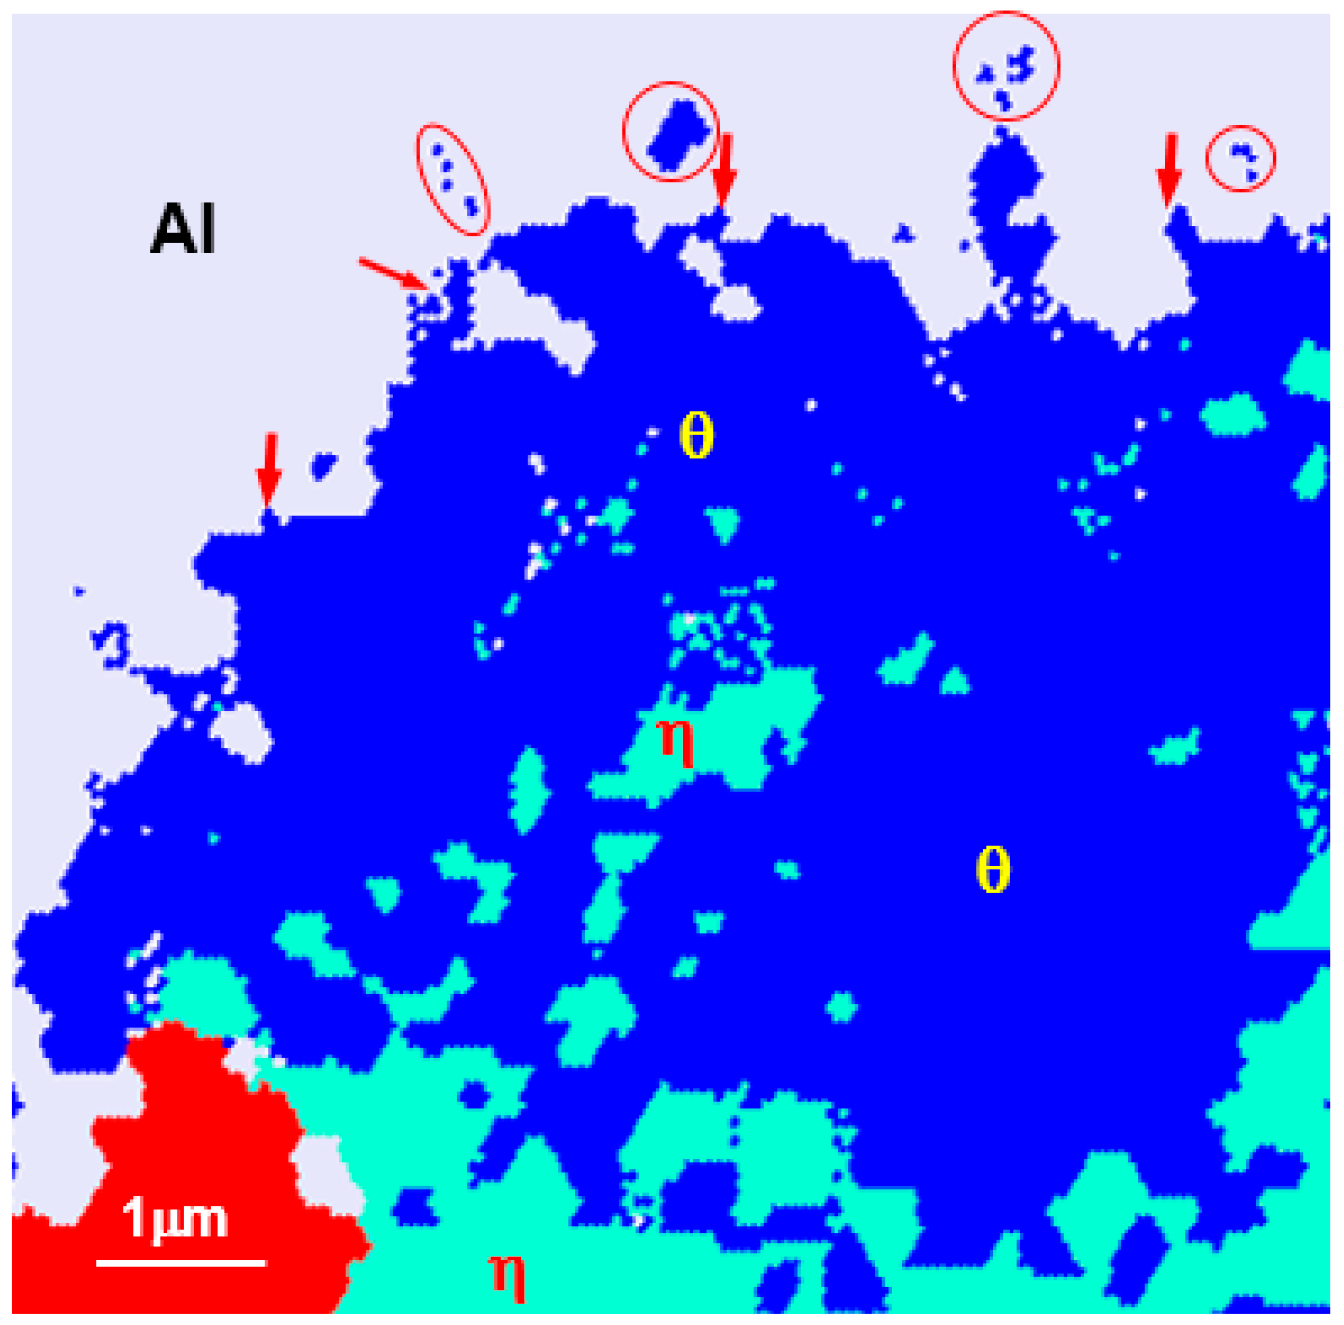
Figure 13 is a magnified view of Figure 6a in the vicinity of the liquid Al showing the nucleated reaction layer. The θ phases (marked with arrows) in the liquid were considered to have formed during isothermal solidification or cooling and to have attached to the already-formed θ phases. Regarding Figure 12, if the η phase was formed during cooling, the Fe concentration should have increased over 40 wt% or more in the liquid. However, it is not considered possible that the Fe concentration in the liquid reached 40 wt% or more in only 30 s. Therefore, the θ phases in which η phases coexist are not formed during cooling but are formed by isothermal solidification at 690 °C.
The growth rate of the θ phase with respect to dipping time was studied differently. Bouche [8] reported that the growth of FeAl3 obeyed a parabolic law, whereas Bouayad [11] reported that growth followed a linear relationship. In this study, it was thought that the growth rate of θ phases was slow because they were growing toward the liquid phase and because the θ phases near the steel interface were transformed into η phases. The complicated formation processes seemed to be the reason the that growth rate could not be accurately measured.
Next, the formation process of the η phases was considered. When the θ phase was formed between the liquid Al and the steel, the Al atoms would not diffuse directly into the steel but would instead pass through the solid θ phase and then diffuse to the steel (liquid Al → θ → steel). In contrast, Fe atoms diffused in the opposite direction (steel → θ → liquid Al). In the Fe-Al phase diagram, there are four phases that can be formed by the diffusion of Fe and Al in the solid state: θ (Fe4Al13 or FeAl3), η (Fe2Al5), ζ (FeAl2), and β or α2 (FeAl). Table 2 shows the Al concentration and crystal structure of these phases. It is noted that the η phase has the least difference in the composition of Al and Fe with the θ phase. In other words, the θ phase is 2.4 at% higher than the η phase, and, in contrast, the Fe concentration is lower by 5.04 at% than the η phase. If Al diffused from the θ phase to the steel by 2.5 at% and Fe diffused to the liquid Al along the θ phase by 2.5 at% in the opposite direction, then the θ phase will transform into the η phase. The above phase transformation is considered to be the nucleation mechanism of the η phase.
From Figure 6 and Figure 10, the growth of η phases is greater than the θ phase in the two-phase (θ and η) region near the steel interface. This is because Al diffuses actively toward the steel and because the θ phase can transform into the η phase. The growth of the η phase is thought to be the nuclei of the η phase, which itself was transformed from the θ phase and takes place in the direction of the steel due to the inter-diffusion of Al and Fe. The grain boundary of η phases is characterized by the longer growth along the c-axis of the crystal structure, as shown in Figure 10b. The morphology of η phases is known as a tongue-like (or sawtooth) grain. The morphology of the η phases has been studied and explained to be a result of the 30% vacancy rate of the c-axis of the η phase, which can be seen as a rapid diffusion tunnel. It causes the η phase to be orientated by the fixed crystal structure and grows preferentially along the diffusion direction during hot dipping.
The formation mechanism of the β (FeAl) phase of 500 nm near the η phase/steel interface was deduced from Figure 4c,f and Figure 6. At the interface, Fe diffuses to the η phase via decreasing Fe concentration, as Al also diffuses into the liquid Al → θ phase → η phase via increasing Al concentration, resulting in the formation of new Fe-Al phases. In the Fe-Al phase diagram, there are four representative phases (Figure 12 and Table 2). Among them, β is preferentially formed due to it possessing the lowest Al concentration. However, considering the Al diffusion path, the η phase near the base material must transform into β (FeAl) → ζ (FeAl2) → η (Fe2Al5) by the mutual diffusion of Al and Fe. However, the ζ (FeAl2) phase was not observed in the experimental results.
Another reaction phase formed in the steel near the η phase was κ (Fe3AlC), which was formed at the grain boundary of the ferrite. Springer [19] recently reported that an 800 nm band consisting of β and κ phases was formed between the steel and η phase by inter-diffusion in the solid reaction of low-carbon steel and pure Al at 600 °C. Although the existence of the phase was revealed, its formation mechanism was not confirmed. The ζ phase was not observed because it is smaller than the β phase. According to a previous study on a steel coated with Al alloy through the hot dipping process [26,27,28,29], the κ (Fe3AlC) phase was formed because Al atoms in liquid Al and C atoms emitted from the η phase, which barely features C, and diffuses preferentially along the grain boundary.
From the experimental results above and subsequent discussion, the formation process of the reaction layer is proposed as follows: Al reacts with the iron oxide layer (Fe3O4) on the surface of the steel that decomposes into Al2O3 and the liquid Al flows into the destroyed oxide layer. When the Fe atoms from the steel dissolve above approximately 2.5 at% (0.6 wt%) into the liquid Al, the θ phase (Fe4Al13) forms individually in a solid state and grows. The η phase (Fe2Al5) is then formed by the inter-diffusion of Al and Fe at the θ phase/steel interface. The η phase grows in a long columnar form towards the steel, and finally, a β phase with a low Al concentration is formed at the steel interface.

4. Conclusions

The nucleation and growth of the reaction layer and phase formed on boron steel hot dipped in a pure liquid Al bath at 690 °C for varying times was successfully investigated, which yielded the following observations and conclusions.
(1) With a dipping time less than 30 s, most of the surface did not react at all due to the presence of a Fe3O4 oxide film. When the dipping process was maintained for 30 s, the Al reacted with the iron oxide layer (Fe3O4) on the surface of the steel and decomposed into Al2O3. Liquid Al flowed into the destroyed oxide layer and contacted the steel surface, causing Fe to dissolve into the Al liquid phase. The nuclei of the reaction layer of width 10–15 μm and height of 10 μm were sporadically generated on the liquid side. As the retention time increased, the nuclei of the reaction layer grew in the surface direction and coalesced with each other for approximately 90 s.
(2) The reaction layer formed on the surface of the steel was divided into a reaction layer formed during the maintained temperature and a solidified Al layer formed during cooling. The nuclei of the reaction layer were observed by TEM and EBSD. The θ phase (Fe4Al13) was formed on the liquid Al side, the η phase (Fe2Al5) was formed below the original steel surface, and a layer in which fine θ and η phases were mixed. β (FeAl) phase was formed at the η phase/steel interface about 500 nm, and κ (Fe3AlC) was formed at the grain boundary of ferrite in the steel.
(3) The phase in which the Fe in steel dissolves in the liquid Al and initially nucleates is θ. When the Fe is dissolved in approximately 2.5 at% (0.6 wt%) or greater in the Al-Fe binary phase system state, the θ phase (Fe4Al13) is formed individually in a solid state. The θ phase continues to grow as Fe dissolves into the liquid Al, but the θ phase already formed transforms into the η phase, which has a small difference in composition from the inter-diffusion of Al and Fe. This results in a mixed region of θ phase and η phase forming on the steel surface in several nanoscale sizes.
(4) The η phase formed in a mixed region becomes a nucleus and grows toward the steel by the inter-diffusion of Al and Fe. Because the Al diffuses along the c-axis <100> direction quickly, the η phase grows in a long columnar morphology.
(5) In the steel region adjacent to the η phase, Fe diffuses into the η phase by decreasing concentration and Al conversely diffuses along the liquid → θ phase → η phase path by increasing Al concentration. β (FeAl) phase with lower Al concentration is then formed.
(6) It is thought that the κ (Fe3AlC) phase was formed because the Al atoms in liquid Al and C atoms emitted from the η phase, which barely contains C, diffuses preferentially along the grain boundary.

Author Contributions

D.S., J.-Y.L., H.H., and C.-Y.K. conceived and designed the experiments; J.-Y.L. and H.H. performed the experiments; H.H. and C.-Y.K. analyzed the data; D.S. and H.H. wrote this paper.

Funding

This research was funded by a National Research Foundation of Korea (NRF) grant funded by the Korean government (MSIP) grant number (No. 2012R1A5A1048294).

Conflicts of Interest

The authors declare no conflict of interest. The funding sponsors had no role in the design of the study; in the collection, analyses, or interpretation of data; in the writing of the manuscript, and in the decision to publish the results.

References

  1. Kobayashi, S.; Yakou, T. Control of intermetallic compound layers at interface between steel and aluminum by diffusion-treatment. Mater. Sci. Eng. 2002, 338, 44–53. [Google Scholar] [CrossRef]
  2. Chang, Y.-Y.; Tsaur, C.-C.; Rock, J.C. Microstructure studies of an aluminide coating on 9Cr-1Mo steel during high temperature oxidation. Surf. Coat. Technol. 2006, 200, 6588–6593. [Google Scholar] [CrossRef]
  3. Wang, C.-J.; Chen, S.-M. The high-temperature oxidation behavior of hot-dipping Al–Si coating on low carbon steel. Surf. Coat. Technol. 2006, 200, 6601–6605. [Google Scholar] [CrossRef]
  4. Sakidja, R.; Perepezko, J.; Calhoun, P. Synthesis, thermodynamic stability and diffusion mechanism of Al5Fe2-based coatings. Oxid. Met. 2014, 81, 167–177. [Google Scholar] [CrossRef]
  5. Heumann, T.; Dittrich, S. Uber die kinetik der reaktion von festem und flûssigem aluminium mit eisen. Z. Metallk. 1959, 50, 617–625. [Google Scholar]
  6. Eggeler, G.; Vogel, H.; Friedrich, J.; Kaesche, H. Target preparation for the transmission electron microscopic identification of the Al sub 3 Fe(theta-phase) in hot-dip aluminised low alloyed steel. Prakt. Metallogr. 1985, 22, 163–170. [Google Scholar]
  7. Eggeler, G.; Auer, W.; Kaesche, H. Reactions between low alloyed steel and initially pure as well as iron-saturated aluminum melts between 670 and 800-degrees-c. Z. Metallk. 1986, 77, 239–244. [Google Scholar]
  8. Bouche, K.; Barbier, F.; Coulet, A. Intermetallic compound layer growth between solid iron and molten aluminium. Mater. Sci. Eng. 1998, 249, 167–175. [Google Scholar] [CrossRef]
  9. Shahverdi, H.; Ghomashchi, M.; Shabestari, S.; Hejazi, J. Microstructural analysis of interfacial reaction between molten aluminium and solid iron. J. Mater. Process. Technol. 2002, 124, 345–352. [Google Scholar] [CrossRef]
  10. Shankar, S.; Apelian, D. Die soldering: Mechanism of the interface reaction between molten aluminum alloy and tool steel. Metall. Mater. Trans. 2002, 33, 465–476. [Google Scholar] [CrossRef]
  11. Bouayad, A.; Gerometta, C.; Belkebir, A.; Ambari, A. Kinetic interactions between solid iron and molten aluminium. Mater. Sci. Eng. 2003, 363, 53–61. [Google Scholar] [CrossRef]
  12. Deqing, W.; Ziyuan, S.; Longjiang, Z. A liquid aluminum corrosion resistance surface on steel substrate. Appl. Surf. Sci. 2003, 214, 304–311. [Google Scholar] [CrossRef]
  13. Murakami, K.; Nishida, N.; Osamura, K.; Tomota, Y.; Suzuki, T. Aluminization of high purity iron and stainless steel by powder liquid coating. Acta Mater. 2004, 52, 2173–2184. [Google Scholar] [CrossRef]
  14. Sasaki, T.; Yakou, T.; Mochiduki, K.; Ichinose, K. Effects of carbon contents in steels on alloy layer growth during hot-dip aluminum coating. ISIJ Int. 2005, 45, 1887–1892. [Google Scholar] [CrossRef]
  15. Shih, T.-S.; Tu, S.-H. Interaction of steel with pure Al, Al–7Si and a356 alloys. Mater. Sci. Eng. 2007, 454, 349–356. [Google Scholar] [CrossRef]
  16. Cheng, W.-J.; Wang, C.-J. Growth of intermetallic layer in the aluminide mild steel during hot-dipping. Surf. Coat. Technol. 2009, 204, 824–828. [Google Scholar] [CrossRef]
  17. Tanaka, Y.; Kajihara, M. Morphology of compounds formed by isothermal reactive diffusion between solid Fe and liquid Al. Mater. Trans. 2009, 50, 2212–2220. [Google Scholar] [CrossRef]
  18. Blumenau, M.; Norden, M.; Friedel, F.; Peters, K. Use of pre-oxidation to improve reactive wetting of high manganese alloyed steel during hot-dip galvanizing. Surf. Coat. Technol. 2011, 206, 559–567. [Google Scholar] [CrossRef]
  19. Springer, H.; Kostka, A.; Payton, E.; Raabe, D.; Kaysser-Pyzalla, A.; Eggeler, G. On the formation and growth of intermetallic phases during interdiffusion between low-carbon steel and aluminum alloys. Acta Mater. 2011, 59, 1586–1600. [Google Scholar] [CrossRef]
  20. Yousaf, M.; Iqbal, J.; Ajmal, M. Variables affecting growth and morphology of the intermetallic layer (Fe2Al5). Mater. Charact. 2011, 62, 517–525. [Google Scholar] [CrossRef]
  21. Pasche, G.; Scheel, M.; Schäublin, R.; Hébert, C.; Rappaz, M.; Hessler-Wyser, A. Time-resolved X-ray microtomography observation of intermetallic formation between solid Fe and liquid Al. Metall. Mater. Trans. 2013, 44, 4119–4123. [Google Scholar] [CrossRef]
  22. Yin, F.-C.; Zhao, M.-X.; Liu, Y.-X.; Wei, H.; Zhi, L. Effect of si on growth kinetics of intermetallic compounds during reaction between solid iron and molten aluminum. Trans. Nonferr. Met. Soc. China 2013, 23, 556–561. [Google Scholar] [CrossRef]
  23. Takata, N.; Nishimoto, M.; Kobayashi, S.; Takeyama, M. Crystallography of Fe2Al5 phase at the interface between solid Fe and liquid Al. Intermetallics 2015, 67, 1–11. [Google Scholar] [CrossRef]
  24. Chen, S.; Yang, D.; Zhang, M.; Huang, J.; Zhao, X. Interaction between the growth and dissolution of intermetallic compounds in the interfacial reaction between solid iron and liquid aluminum. Metall. Mater. Trans. 2016, 47, 5088–5100. [Google Scholar] [CrossRef]
  25. Botta, P.M.; Mercader, R.C.; Aglietti, E.F.; Porto López, J.M. Synthesis of Fe–FeAl2O4–Al2O3 by high-energy ball milling of Al–Fe3O4 mixtures. Scr. Mater. 2003, 48, 1093–1098. [Google Scholar] [CrossRef]
  26. Lee, J.-H.; Yun, J.-G.; Kwak, S.-Y.; Kang, C.-Y. Nucleation and growth of intermetallic compounds formed in boron steel hot-dipped in al–ni alloy. Coatings 2017, 7, 195. [Google Scholar] [CrossRef]
  27. Yun, J.-G.; Lee, J.-H.; Kwak, S.-Y.; Kang, C.-Y. Microstructural evolution of intermetallic compound formed in boron steel hot-dipped in Al–7% Ni alloy. Metals 2017, 7, 393. [Google Scholar] [CrossRef]
  28. Yun, J.-G.; Lee, J.-H.; Kwak, S.-Y.; Kang, C.-Y. Study on the formation of reaction phase to si addition in boron steel hot-dipped in Al–7Ni alloy. Coatings 2017, 7, 186. [Google Scholar] [CrossRef]
  29. Kwak, S.-Y.; Yun, J.-G.; Lee, J.-H.; Shin, D.-I.; Kang, C.-Y. Identification of intermetallic compounds and its formation mechanism in boron steel hot-dipped in Al-7 wt.% Mn alloy. Coatings 2017, 7, 222. [Google Scholar] [CrossRef]
Figure 1. (a) Optical microscopy of hot-dipped specimen reaction layer in liquid Al melt at 690 °C for 30 s, (b) magnified view, and (c) SEM image of the dotted rectangular area in (a).
Metals 08 00820 g001
Figure 2. Field-emission electron probe microanalysis (FE–EPMA) elemental maps of O (a), Al (b) and Fe (c) for the dotted rectangular area in Figure 1c.
Metals 08 00820 g002
Figure 3. (a) Cross-sectional SEM image of the surface of steel hot-dipped in liquid Al at 690 °C for 30 s and (b) XRD analysis of the surface. The oxide layer formed on the steel surface.
Metals 08 00820 g003
Figure 4. (a) High-angle annular dark-field (HAADF) image of the dotted rectangular area in Figure 1c, (bd) bright-field images taken from the area denoted as X-Z (yellow rectangular) in (a), and (e,f) dark-field images of (b,c), respectively.
Metals 08 00820 g004
Figure 5. (ah) Diffraction patterns and the selected diffraction pattern for the areas marked 1–8 in Figure 4, respectively.
Metals 08 00820 g005
Figure 6. (a) Electron backscatter diffraction (EBSD) phase map and (b) Inversed Pole Figure (IPF) of the specimen hot-dipped in pure Al melt at 690 °C for 30 s in Figure 2.
Metals 08 00820 g006
Figure 7. Cross-sectional optical micrograph of specimens hot-dipped at 690 °C for (a) 40 s, (b) 50 s, (c) 60 s, (d) 90 s, and (e) 120 s.
Metals 08 00820 g007
Figure 8. (a) SEM image and (bd) FE-EPMA mapping analysis of O, Al and Fe for the specimen hot-dipped in liquid Al melt at 690 °C for 50 s.
Metals 08 00820 g008
Figure 9. (a) SEM image and (bd) FE-EPMA mapping analysis of O, Al and Fe for the specimen hot-dipped in liquid Al melt at 690 °C for 120 s.
Metals 08 00820 g009
Figure 10. (a) EBSD phase map (b) IPF, and (c) magnified view for the rectangular area of specimen hot-dipped in liquid Al melt for 120 s.
Metals 08 00820 g010
Figure 11. Schematic diagram of the nucleation process of the reaction layer and phases during the hot-dipping of steel in liquid Al at 690°C. (a) Initial stage of hot-dipping; (b) Oxide film breaks and dissolution-diffusion of Fe; (c) nucleation of θ phase; (d) growth of θ phase; (e) nucleation of η phase; (f) growth of η phase and generation of β (FeAl) phase.
Metals 08 00820 g011
Figure 12. Fe-Al binary phase diagram calculated using ThermoCalcTM software ver 6.0 (Solna, Sweden). (a) Fe: 0–100%; (b) Fe: 0–50%.
Metals 08 00820 g012
Figure 13. Enlarged view of the EBSD phase map in Figure 6a. Al and θ phase region observed on the left side.
Metals 08 00820 g013
Table 1. Energy dispersive spectroscopy (EDS) analysis results of phases marked 1–5 in Figure 4a, respectively.
No.at%/wt%AlFePhase
1at%99.590.41Al
wt%99.160.84
2at%72.0627.94Fe4Al13
wt%55.4844.52
3at%71.0628.94Fe4Al13
wt%54.2645.74
4at%70.4429.56Fe2Al5
wt%53.5146.49
5at%1.1798.83Fe
wt%0.5799.43
Table 2. Al content and crystal structure of phases in Fe-Al binary phase diagram.
Phaseα-Feβ, FeAlζ, FeAl2η, Fe2Al5θ, FeAl3θ, Fe4Al13
Al contentat%-50.066.777.475.076.5
wt%-32.638.242.842.042.5
Crystal structureBCCCubicTriclinicOrthorombicMonoclinicMonoclinic

