Article

Study on Interface Structure of Cu/Al Clad Plates by Roll Casting

1
College of Materials Science and Engineering, Henan University of Science and Technology, Luoyang 471023, China
2
Collaborative Innovation Center of Non-Ferrous Materials, Luoyang 471023, China
*
Author to whom correspondence should be addressed.
Metals 2018, 8(10), 770; https://doi.org/10.3390/met8100770
Submission received: 15 September 2018 / Revised: 25 September 2018 / Accepted: 25 September 2018 / Published: 27 September 2018

Abstract

:
Large scale Atomic/Molecular dynamic Parallel Simulator (LAMMPS) molecular dynamics simulation software was used to simulate the copper and aluminum atom diffusion and changes of interface during heating and cooling process of copper and aluminum composite panels. The structures of the interface were characterized through scanning electron microscope (SEM), X-ray diffraction (XRD), and transmission electron microscope (TEM), and the mechanical properties were also tested. The simulation results show that the diffusion rate of copper atom is higher than that of aluminum atom, and that the CuAl2 radial distribution function of the interface at 300 K is consistent with that of pure CuAl2 at room temperature. At 930 K, t = 50 ps Cu atoms spread at a distance of approximately four Al lattice constants around the Al layer, and Al atoms spread to about half a lattice constant distance to the Cu layer. The experimental results show that the thickness of the interface in copper–aluminum composite plate is about 1 μm, and only one kind of CuAl2 with tetragonal phase structure is generated in the interface, which corresponds with the result of molecular dynamics simulation.

1. Introduction

With the development of science and technology, various new technologies and materials have become more and more widely used in application. Copper–aluminum (Cu/Al) composite panels can be used widely in aviation, petroleum, chemical, shipbuilding, automobile, electronics [1], and other industrial fields because of the excellent electrical and thermal conductivity of copper and, also, in aluminum being light, corrosion resistant, and economical [2,3].
At present, the most common methods of production of layered metal composite panels are a roll casting composite method and an explosive welding composite method. In addition, some other methods, such as the electromagnetic continuous rolling [4,5], friction pressure welding [6], ultrasonic welding [7], and brazing [8], and others, have also been studied and used in some development applications. However, for Cu/Al composite panels, the roll casting method has more advantages because of its high security and low energy cost. Wide, semi-solid, and whole roll casting can be achieved through roll casting method for Cu/Al composite panels, without any change in the original good electrical conductivity of the copper and aluminum, and the Cu/Al composite panels are a metallurgical combination, which can further improve the bonding strength of Cu/Al composite materials.
Xu et al. [9] studied the growth mechanism of nanoscale-sized intermetallic compound at the interface annealed at low temperature by HRTEM, and explained the atom diffusion and bonding mechanism at the Cu/Al interface. Lee et al. [10] obtained the Cu/Al composite materials through the thermal pressure method, and they evaluated the mechanical properties of CuAl2, Cu9Al4, and CuAl phases using nanoindentation. Zu et al. [11] prepared Cu/Al composite plates by an asynchronous rolling method, and discussed the influence of intermetallic compounds on the bonding strength of the Cu/Al interface. Chen et al. [12] studied the interfacial microstructure and bonding strength of steel/aluminum clad sheet processed by horizontal twin-roll casting.
The purpose of this work is to test and explore the type of intermetallic compound that is the first to produce intermetallic compounds in the Cu/Al composite interface during semi-molten casting. Unlike the above studies, our aim is to pass phase change molecules. The combination of kinetic simulation and experimentation is used to determine the process parameters required to produce a nanoscale thick intermetallic layer. To this end, molecular dynamics models of Cu/Al cast-rolled composite sheets were carried out using LAMMPS. The type and layer thickness of the metal compounds are mainly controlled by changing the parameters of the simulated casting rolling process used to determine the process parameters of the excellent rolling process and the type of intermetallic compound. At the same time, experiments and simulations also provide a theoretical basis for the industrialization of rolled composite panels.

2. Experimental Materials and Method

2.1. Molecular Dynamics Simulation of the Structure Evolution in the Semi-Molten Roll Casting Interface of Cu/Al Composite Panels

This simulation was done using the open source-molecular dynamics simulation software named Large scale Atomic/Molecular dynamic Parallel Simulator (LAMMPS)(Sandia National Laboratories, US, lammps-16 February 2016) [13]. This work used the modified embedded-atom method (MEAM) potential, which can fully reflect the nature of metal materials.
The initial structure model is established by using a low index (111) [14,15] of Cu/Al composite panels, as shown in Figure 1. The lattice constant of Al and Cu are 4.05 Å and 3.615 Å, respectively. The ratio of Al and Cu size is set up as 8/9, and the model is established as 8 × 8 × 16 (αAl3) [16], where the origin of Z axis is the surface boundary, and Al atoms fill above the origin, while Cu atoms fill below the origin. First, Cu/Al atoms are balanced with a constant number under the condition of 10 K, and controlled with constant pressure and temperature, and then the movement of Al and Cu atoms during this period is record. The diagram of the model at 10 K is shown in Figure 1a, in which the copper and aluminum atoms are stable, without any diffusion. Figure 1b shows the diagram of the model at 710 K. When the temperature increases to 710 K, Al atoms in the matrix begin to move under the energy, and the arrangement becomes messy. The matrix produces a large number of dislocations which migrate to the interface. Moreover, copper atoms are arranged orderly, and some of the copper atoms in the interface have a tendency to jump. Figure 1c shows the distribution of the atoms reacted for 50 ps at the temperature of 930 K. There are a large number of Cu atoms molten in the atom vacancy of the Al layer through the interfacial transition at high temperature. In such a case, the Al lattice has been completely destroyed, and the Cu lattice is also damaged to a certain extent. Moreover, some Al atoms transfer into the vacancy of Cu atoms. There are two reasons for this phenomenon. On the one hand, the atomic radius of Al atoms is higher than that of Cu atoms. On the other hand, the activation energy of copper atoms is 1.36 × 10⁵ J/mol, which is less than that of Al (1.655 × 10⁵ J/mol) [17]. The higher activation energy is conducive to the diffusion of copper atoms.
Figure 2 shows the concentration distribution of Cu and Al atoms at different temperatures. For Figure 2a, the temperature is 10 K, and there is no diffusion of Al and Cu atoms. Since the energy provided is lower than the activation energy, and atoms are stable. When the temperature is 930 K, t = 50 ps, and the diffusion is shown in Figure 2b.
The diffusion distance of Cu atoms in the Al layer is nearly four times of Al lattice constants, while for Al atoms, the distance is just half a lattice constant. At the same time, the area where the two kinds of atoms exist is the area where the number of Al atoms is larger. That is to say, the intermetallic compounds usually formed in the area of Al side.
According to the relevant literature [9], CuAl2 is the intermetallic compound which is most easily formed. The radial distribution function of Cu/Al composite panels model and CuAl2 at 300 K are shown in Figure 3a. It is easy to see that the peaks of the Cu/Al composite panels model match with pure CuAl2 at room temperature. It can be demonstrated that CuAl2 is formed under the casting process conditions. In addition, the molar ratio of Cu atoms is shown in Figure 3b, in which there are more Cu atoms diffusing into the Al layer. After stabilization, the proportion of Cu atoms in the Al layer is approximately 21.4%.
Although the formation energy of Cu9Al4 is lower than CuAl2, the maximum solubility of Al in Cu is 9.4%, and the solubility of Cu in Al is 1.5%. Therefore, it is difficult to generate Cu9Al4 without enough Cu atoms. However, the formation energy of CuAl2 is lower than CuAl3 (−0.093 ev), so CuAl2 its formation is preferred.

2.2. Overview of the Solid-Liquid Roll Casting Composite Process

As shown in Figure 4 [12], a copper strip with thickness 1 mm is rolled into the rolling gap between the double stick by the top roll, and then contacts with liquid aluminum at temperature 650 °C from the thermal flow slot, and bends and curdles under the extrusion of double rolling, and the whole process, from casting to rolling, including cooling, freezing, and formation, is finished. During the roll casting process, the cast is constantly moving forward and cooling down continuously under the squeeze and drag of the double roll, resulting in the snake-like interface of solid-liquid phases. In the steady state, the position of the concentration boundary layer of copper and the interface of solid-liquid remain unchanged in the liquid aluminum.
Selected samples should be cleaned using sandpaper and mechanical polishing. Finally, the samples were tested by scanning electron microscope (JSM-5610LV SEM, JEOL Ltd., Tokyo, Japan) to check the interface area, energy dispersive spectroscopy (EDS. EDAX Inc., Draper, UT, USA) was used to detect the chemical composition, and X-ray diffraction (D8 ADVANCE XRD, Bruker Inc., Massachusetts, MA, USA) was used to analyze the phases of the peeling interface. The analysis of intermetallic compounds in interfacial layer was conducted using a transmission electron microscope (TEM, JEM-2100, JEOL Ltd., Tokyo, Japan) to judge the accuracy of the simulation results.

2.2.1. Analysis of Interface Structure and Chemical Composition

The SEM images and line scan spectra of interface in Cu/Al composite panels are shown in Figure 5, in which the black area means Cu, while the white area means Al. Figure 5b shows the line scan of the corresponding position in Figure 5a. Table 1 summarize the analysis of the EDS elements near the interface in Figure 5a. As we can see, there is a white, straight line at the interface, without any other fragmentation. As shown in Figure 5b, Cu atoms transfer into the Al matrix. Additionally, the diffusion rate of copper atoms is higher than aluminum atoms according to the peak fluctuation of atomic content. The main reason is that the grain size of copper atoms is smaller than aluminum atoms (the lattice constant αCu = 0.3615 nm, αAl = 0.4082 nm). It is easier for Cu atoms to enter into the interval position of the aluminum lattice [10]. The thickness of diffusion layer is determined by the migration distance of intermetallic compounds and solid–liquid interface during the diffusion process. The thickness of the diffusion layer at the interface shown in Figure 5b is about 1 μm.
According to the EDS element analysis shown in Figure 5a, and binary alloy phase diagram of Cu/Al [18], intermetallic compounds, such as CuAl2, CuAl, Cu4Al3, Cu3Al, and Cu9Al4, may be formed [19]. However, the CuAl2 phase is the compound which has the lowest stable energy. Therefore, CuAl2 is the most likely to be formed in the interface, and the results speculated are shown in Table 1.
Figure 6 shows the XRD patterns of the bonding interface in Cu/Al composite panels. It is obvious that there is only CuAl2 phase in the Al side and only Cu phase in the Cu side. Combined with Figure 5, it is true that CuAl2 is the only phase obtained from the roll casting process, and the content of the CuAl2 phase is relatively low, and that the CuAl2 phase is first formed in the Al matrix. At the same time, the diffusion rate of Cu shown in Figure 5 is higher than that of Al.
Figure 7 shows the structure and EDS spectra of the bonding interface in Cu/Al composite panels. As we can see from Figure 7, there is a layer with irregular surface covering the Al side, whereas the Cu side is more smooth. Then, we analyzed some points on two sides by EDS. The result shows that the oxygen content is low, which is conducive to reducing the damage of the oxide to the interface. During the roll casting process, the oxidation films on the surface of Cu/Al are torn because of the extra force, and then the internal raw Cu and Al atoms contact directlywith the participation of oxygen. In such a case, when the energy increases to bonding, Cu–Al compounds will be formed, resulting in higher bonding strength [20]. According to the results of EDS analysis, point 2 in Figure 7a, and point 3 in Figure 7b are the matrices. However, point 1 in Figure 7a is a point from the white covering layer, where the content ratio of Al and Cu atoms is close to 1:2. Actually, the compound is CuAl2. As for point 4, although there is a certain amount of Al, it is true that it is solid solution of Cu, rather than a compound, according to the XRD results shown in Figure 6.

2.2.2. Analysis of TEM Images

Figure 8 shows the TEM image and electron diffraction patterns of the interface in Cu/Al composite panels. As for Figure 8a, there is a layer make up of compound in the interface with a thickness of about 350 nm. On the basis of dynamics calculation, simulation, phase analysis, and electron diffraction patterns of experimental interface, the compound is tetragonal crystal CuAl2 (space group: p-43 m, lattice constant a = 0.6065 nm, b = 0.6065 nm, c = 0.4873 nm), and the calibration result is shown in Figure 8c. According to this result, it is found that the top area shown in Figure 8a is the Al matrix, and its diffraction pattern is shown in Figure 8b, while the bottom area is labeled as Cu with FCC crystal structure. The results show that only one intermetallic compound phase is formed in the interface of Cu/Al composite panels, and the existence of compounds promotes the diffusion of atoms and increases the bonding strength of the interface.

3. Conclusions

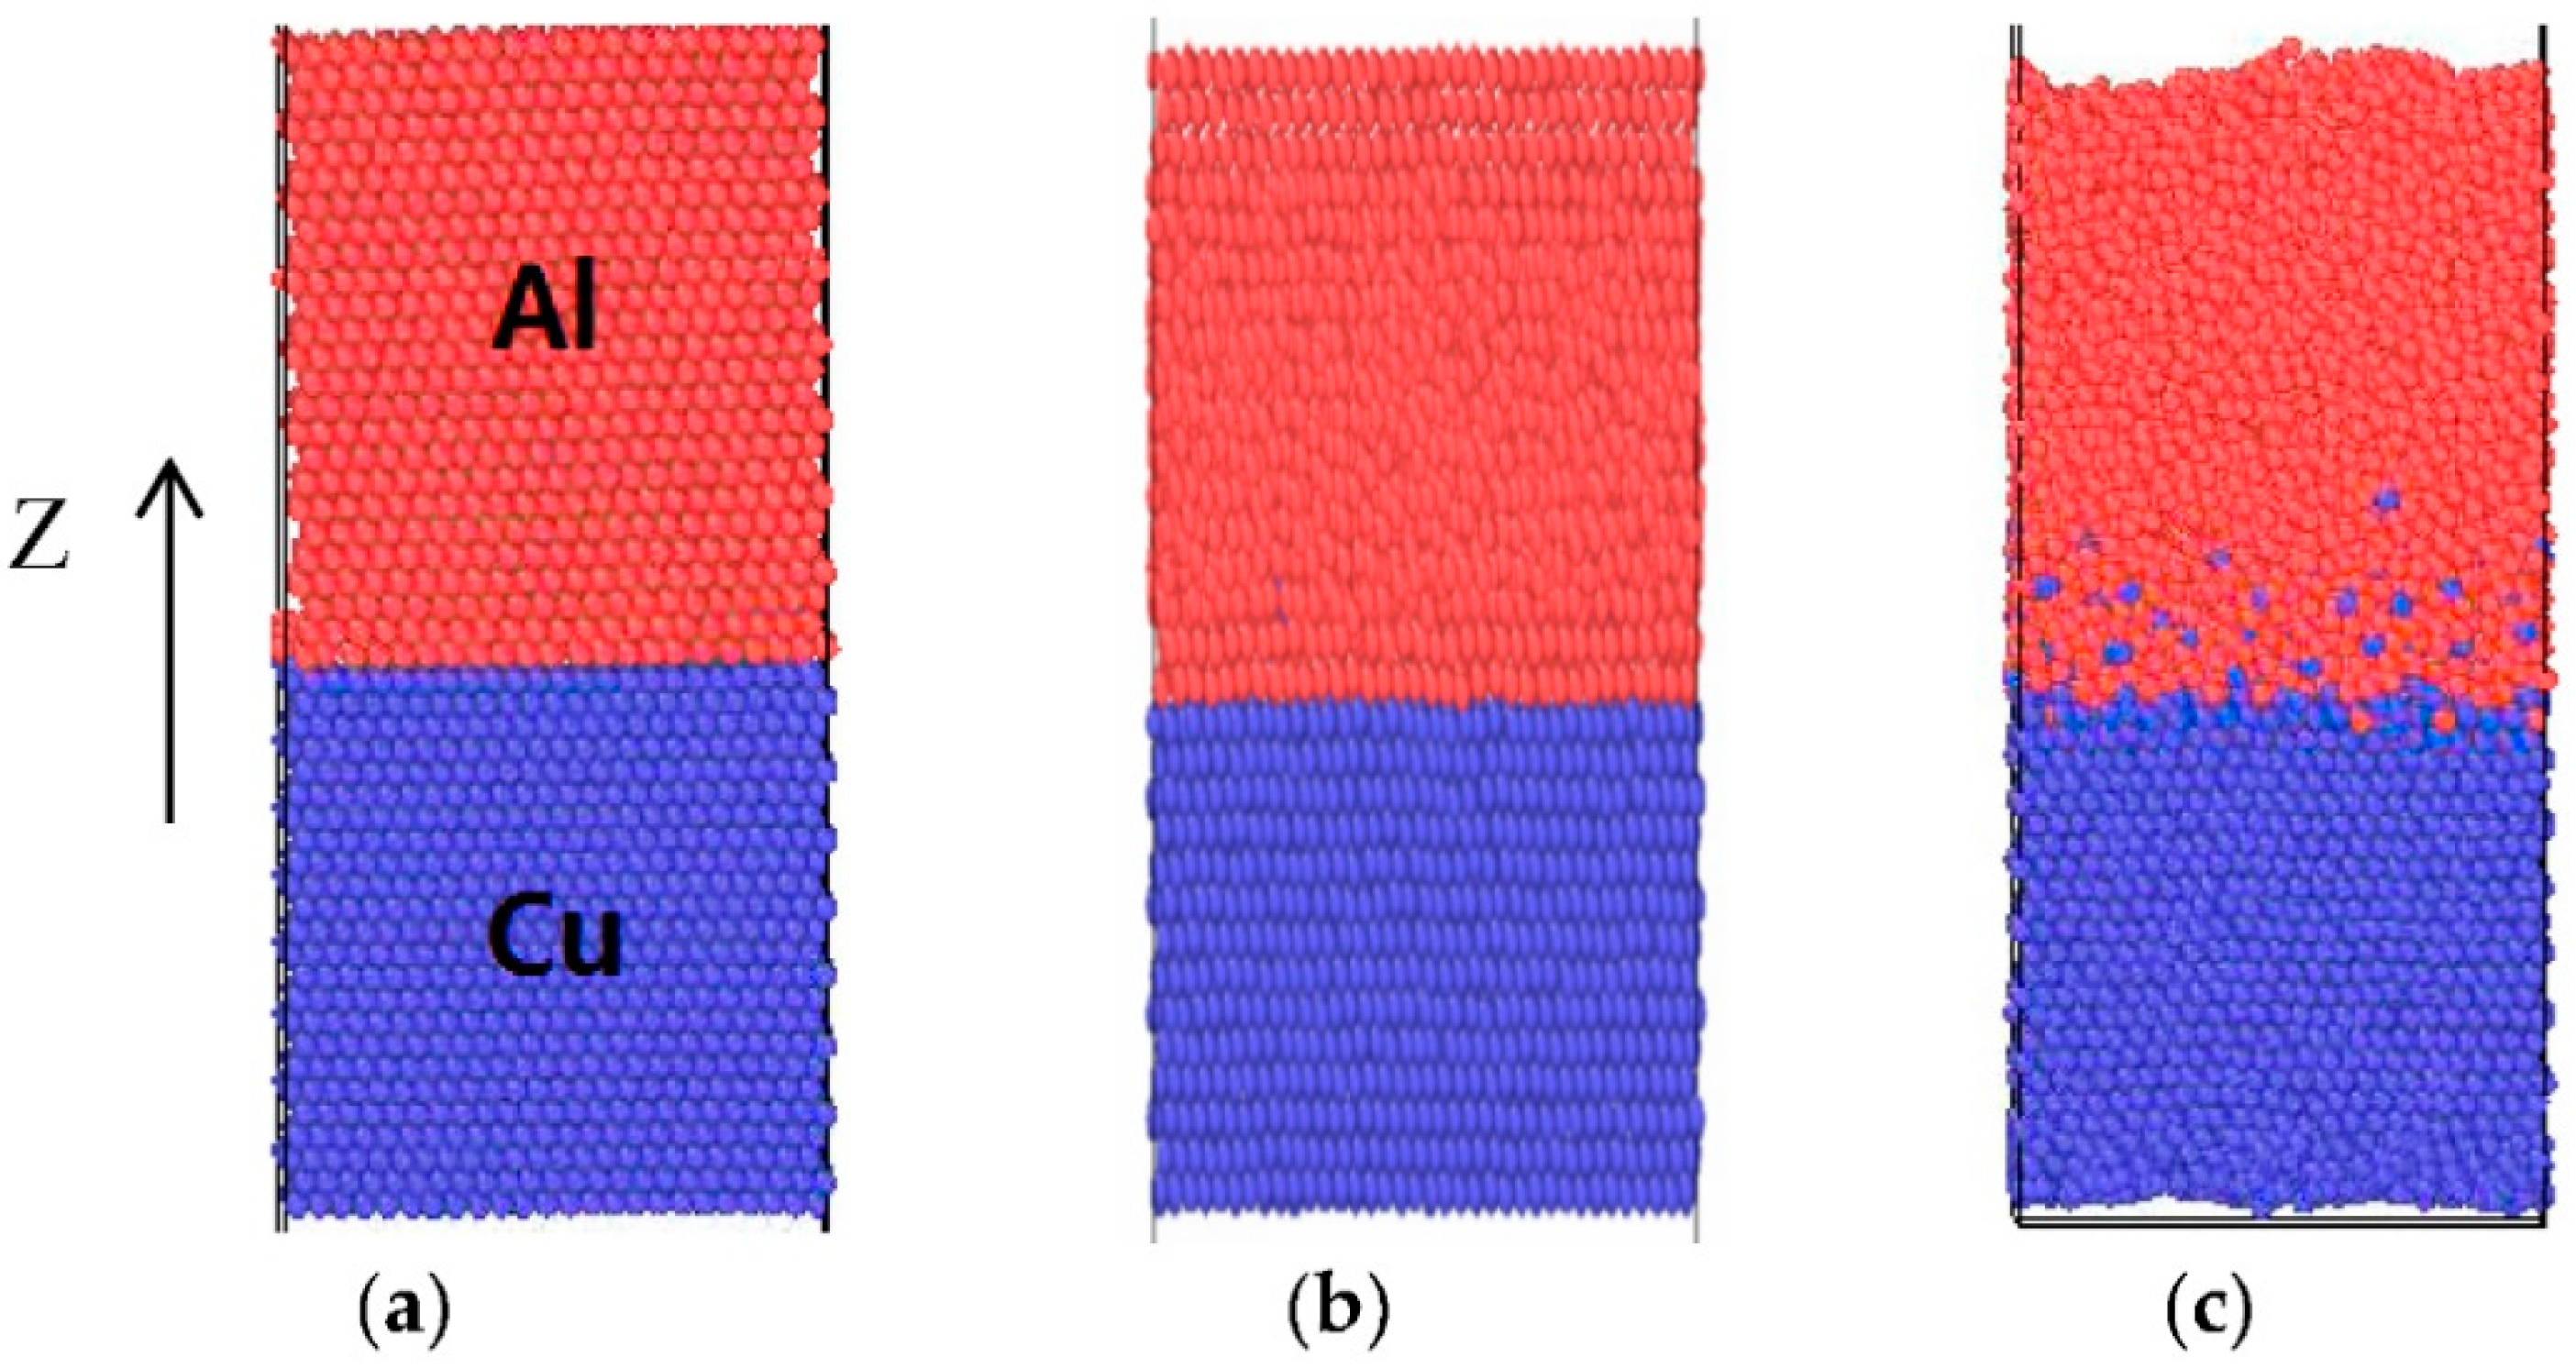
  • The results of LAMMPS molecular dynamics simulation show that Cu atoms are arranged orderly, while Al lattice structures are destroyed at high temperature. Additionally, the diffusion rate of Cu atoms is higher than that of Al atoms. Cu atoms at the interface transfer into the Al matrix.
  • When T = 930K, t = 50 ps, the diffusion distance of Cu atoms in the Al layer is nearly four times the Al lattice constants, while for Al atoms, the distance is just half a lattice constant. The radial distribution function shows that CuAl2 compound will be formed at the interface when the temperature is 300 K.
  • The TEM results show that the thickness of compound at the interface is about 0.35 μm, and there is only one compound phase tetragonal CuAl2 formed, according to the electron diffraction patterns of experimental interface. The results of experiments are same as LAMMPS simulation. That is to say, the parameters of simulation can be used in industrialization.
Future work will study the relationship between the evolution of intermetallic compound and bonding strength in the interface during different processes of heat treatment or rolling. Moreover, electronic microscopy and mechanical techniques, such as electron backscatter diffraction techniques, transmission electron microscopy, and stripping machine, will be used to examine how the crystal structure and the type of intermetallic compound affects the bonding strength of composite material.

Author Contributions

For research articles with several authors, a short paragraph specifying their individual contributions must be provided. The following statements should be used “Conceptualization, Q.C. and J.X.; Methodology, W.W.; Software, A.M.; Q.C.; W.W.; Formal Analysis, Q.C. and J.X.; Investigation, W.W.; Resources, J.X.; Data Curation, Q.C.; Writing-Original Draft Preparation, Q.C.; Writing-Review & Editing, Q.C.; Project Administration, Q.C.; Funding Acquisition, J.X. and W.W.”, please turn to the CRediT taxonomy for the term explanation. Authorship must be limited to those who have contributed substantially to the work reported.

Acknowledgments

This research was funded by (U1604251) the National Natural Science Foundation of China.

Conflicts of Interest

The authors declare no conflict of interest.

References

  1. Wadsworth, J.; Lesuer, D.R. Ancient and modern laminated composites—From the Great Pyramid of Gizeh to Y2K. Mater. Charact. 2000, 45, 289–313. [Google Scholar] [CrossRef]
  2. Lacaze, J.; Tierce, S.; Lafont, M.C.; Thebault, Y.; Pébère, N.; Mankowski, G.; Blanc, C.; Robidou, H.; Vanumousse, D.; Daloz, D. Study of the microstructure resulting from brazed aluminium materials used in heat exchangers. Mater. Sci. Eng. A 2005, 413, 317–321. [Google Scholar] [CrossRef] [Green Version]
  3. Foley, J.; Clauberg, H.; Chylak, B. Enabling high volume fine pitch copper wire bonding: Enhancements to process and equipment capability. In Proceedings of the 2010 3rd Electronic System-Integration Technology Conference (ESTC), Berlin, Germany, 13–16 September 2010; pp. 1–4. [Google Scholar] [CrossRef]
  4. Lee, T.H.; Lee, Y.J.; Park, K.T.; Jeong, H.G.; Lee, J.H. Mechanical and asymmetrical thermal properties of Al/Cu composite fabricated by repeated hydrostatic extrusion process. Met. Mater. Int. 2015, 21, 402–407. [Google Scholar] [CrossRef]
  5. Mahdavian, M.M.; Khatami-Hamedani, H.; Abedi, H.R. Macrostructure evolution and mechanical properties of accumulative roll bonded Al/Cu/Sn multilayer composite. J. Alloys Compd. 2017, 703, 605–613. [Google Scholar] [CrossRef]
  6. Watanabe, T.; Yoneda, A.; Yanagisawa, A.; Konuma, S.; Ohashi, O. Ultrasonic Welding of Al-Cu and Al-SUS304. Q. J. Jpn. Weld. Soc. 2009, 17, 223–233. [Google Scholar] [CrossRef]
  7. Sun, X.J.; Tao, J.; Guo, X.Z. Bonding properties of interface in Fe/Al clad tube prepared by explosive welding. Trans. Nonferrous Met. Soc. China 2011, 21, 2175–2180. [Google Scholar] [CrossRef]
  8. Rhee, K.Y.; Han, W.Y.; Park, H.J.; Kim, S.S. Fabrication of aluminum/copper clad composite using hot hydrostatic extrusion process and its material characteristics. Mater. Sci. Eng. A 2004, 384, 70–76. [Google Scholar] [CrossRef]
  9. Xu, H.; Liu, C.; Silberschmidt, V.V.; Pramana, S.S.; White, T.J.; Chen, Z.; Acoff, V.L. Behavior of aluminum oxide, intermetallics and voids in Cu–Al wire bonds. Acta Mater. 2011, 59, 5661–5673. [Google Scholar] [CrossRef]
  10. Lee, K.S.; Ha, T.K.; Ahn, S.; Chang, Y.W. High temperature deformation behavior of the Zr 41.2 Ti 13.8 Cu 12.5 Ni 10 Be 22.5, bulk metallic glass. J Non-Cryst. Solids 2003, 317, 193–199. [Google Scholar] [CrossRef]
  11. Li, X.B.; Zu, G.Y.; Wang, P. Microstructural development and its effects on mechanical properties of Al/Cu laminated composite. Trans. Nonferrous Met. Soc. China 2015, 25, 36–45. [Google Scholar] [CrossRef]
  12. Chen, G.; Li, J.T.; Yu, H.L.; Su, L.H.; Xu, G.M.; Pan, J.S.; You, T.; Zhang, G.; Sun, K.M.; He, L.Z. Investigation on bonding strength of steel/aluminum clad sheet processed by horizontal twin-roll casting, annealing and cold rolling. Mater. Des. 2016, 112, 263–274. [Google Scholar] [CrossRef]
  13. Majure, D.L.; Haskins, R.W.; Lee, N.J.; Ebeling, R.M.; Maier, R.S.; Marsh, C.P.; Bednar, A.J.; Kirgan, R.A.; Welch, C.R.; Cornwell Charles, F. Large-Scale Atomic/Molecular Massively Parallel Simulator (LAMMPS) Simulations of the Effects of Chirality and Diameter on the Pullout Force in a Carbon Nanotube Bundle. In Proceedings of the DoD HPCMP Users Group Conference, Seattle, WA, USA, 14–17 July 2008; IEEE: Piscataway, NJ, USA, 2009; pp. 201–207. [Google Scholar] [CrossRef]
  14. Ramakrishnan, R.; Phanikumar, G.; Sankarasubramanian, R. Crystal–Melt Interface Growth Velocity of Ni–Zr Alloys Through Molecular Dynamics Simulations. Trans. Indian Inst. Met. 2015, 68, 1113–1117. [Google Scholar] [CrossRef]
  15. Geysermans, P.; Pontikis, V. The structure of the solid-liquid interface: Atomic size effect. J. Phys. IV 2002, 12, 239–248. [Google Scholar] [CrossRef]
  16. Kim, S.P.; Chung, Y.C.; Lee, S.C.; Lee, K.R.; Lee, K.H. Surface alloy formation of Co on Al surface: Molecular dynamics simulation. J. Appl. Phys. 2003, 93, 8564–8566. [Google Scholar] [CrossRef]
  17. Chen, C.Y.; Chen, H.L.; Hwang, W.S. Influence of Interfacial Structure Development on the Fracture Mechanism and Bond Strength of Aluminum/Copper Bimetal Plate. Mater Trans. 2006, 47, 1232–1239. [Google Scholar] [CrossRef] [Green Version]
  18. Lim, A.B.; Long, X.; Shen, L.; Chen, X.; Ramanujan, R.V.; Gan, C.L.; Chen, Z. Effect of palladium on the mechanical properties of Cu–Al intermetallic compounds. J. Alloys Compd. 2015, 628, 107–112. [Google Scholar] [CrossRef]
  19. Zhu, D.; Li, C.; Guo, C.; Du, Z. Thermodynamic assessment of the Ni–Sc binary system. Calphad 2015, 48, 106–112. [Google Scholar] [CrossRef]
  20. Kawakami, H.; Suzuki, J.; Nakajima, J. Bonding process of Al/Cu dissimilar bonding with liquefaction in air. Weld. Int. 2007, 21, 836–843. [Google Scholar] [CrossRef]
Figure 1. Model of Cu/Al composite panels at different average temperature: (a) 0 K; (b) 710 K; (c) 930 K.
Metals 08 00770 g001
Figure 2. Concentration distribution of Cu and Al atoms at different temperatures (a) 10 K; (b) 930 K.
Metals 08 00770 g002
Figure 3. (a) Radial distribution function; (b) mole ratio of Cu atoms of Cu/Al composite panels model and CuAl2 at 300 K.
Metals 08 00770 g003
Figure 4. Schematic diagram of roll casting process: 1—Self-made pinch roll; 2—Cu belt; 3—Al melt; 4—Sluice; 5—Nozzle; 6, 9—Cooling water; 7—Lower roll; 8—Clad sheet; 10—Upper roll.
Metals 08 00770 g004
Figure 5. SEM images and line scan spectra of interface in Cu/Al composite panels.
Metals 08 00770 g005
Figure 6. XRD patterns of bonding interface in Cu/Al composite panels.
Metals 08 00770 g006
Figure 7. The structure and EDS spectra of the bonding interface in Cu/Al composite panels.
Metals 08 00770 g007
Figure 8. TEM image and electron diffraction patterns of the interface in Cu/Al composite panels: (a) TEM image; (bd) electron diffraction patterns.
Metals 08 00770 g008
Table 1. Speculated phases of the interface in Cu/Al composite panels.
PointsCu (At%)Al (At%)Al (At%)Phase
198.811.19Cu Matrix
297.382.42Cu Matrix
368.7632.14Cu and CuAl2
443.5756.43CuAl2
511.1388.87CuAl2 and Al
64.3695.64Al Matrix
72.3797.63Al Matrix

