Article

Analysis of Fracture Modes of Resistance Spot Welded Hot-Stamped Boron Steel

1
Shanghai Key Laboratory of Digital Manufacture for Thin-Walled Structures, Shanghai Jiao Tong University, Shanghai 200240, China
2
State Key Laboratory of Mechanical System and Vibration, Shanghai Jiao Tong University, Shanghai 200240, China
*
Author to whom correspondence should be addressed.
Metals 2018, 8(10), 764; https://doi.org/10.3390/met8100764
Submission received: 4 September 2018 / Revised: 23 September 2018 / Accepted: 25 September 2018 / Published: 26 September 2018

Abstract

:
Fracture modes of resistance spot welded ultra-high strength hot-stamped boron steel via lap-shear test are different from that of the traditional advanced high strength steel due to the difference in geometrical size and material property of the spot welds. In this paper, lap-shear fracture modes of resistance spot welding joints were analyzed and joint characteristics that affecting the fracture behavior were discussed. Three fracture modes were found to change from interfacial fracture (IF) to pull-out fracture (PF) with the increase of nugget diameter. For PF I mode, the fracture initiated at the transition zone between the fusion zone and upper-critical heat affected zone (HAZ) and propagated along the thickness of the nugget. For PF II mode, during which the failure initiated at the sub-critical HAZ where the softest zone occurred, and it propagated to the base material. Obvious hardness decrease was observed in the transition zone with the formation of the delta ferrite at the fusion boundary due to the relatively high amount of alloying element in the hot-stamped boron steel, which could provide the reason for route of PF I extending along this zone. Fluctuation in the hardness in the transition zone led to the existence of both PF I and PF II at the same welding current.

1. Introduction

With great potential to reduce the weight, ultra-high strength hot-stamped boron steel has been increasingly used in body-in-white [1]. Resistance spot welding (RSW) is the most widely used method to join lapped steel because of its stable quality and low cost. The lap-shear test is usually used to evaluate the strength of the spot welded joint [2,3,4]. As fracture mode can significantly affect maximum lap-shear force and energy absorption capability of the resistance spot welds [5,6,7], it is vital to determine the fracture mode of the spot welded joint and identify the key influencing factors.
As a qualitative index, fracture mode is often used to assess the RSW joint quality. Fracture mode was the competition result between shear deformation of fusion zone (FZ) and necking in the base metal (BM) or heat affected zone (HAZ). The interfacial fracture (IF) mode, in which a fracture propagates through the area of the FZ, is determined by the nugget diameter and the hardness of FZ. A pull-out fracture (PF) mode, in which a fracture happens by the withdrawal of the nugget, is determined by the notch of the sheet/sheet interface, the hardness of the failure area, and the loading condition. On the whole, a fracture mode is significantly affected by both the material properties and geometrical size of the weld zones (i.e., FZ, HAZ, and BM) [8]. High percentages of alloy elements contribute to the tendency to form the brittle martensite phase of the fusion zone during the rapid heating and cooling cycles of the RSW process [9]. Microstructures and mechanical properties of spot welded, hot-stamped boron steel with an Al-Si coating will be different from that of the previously reported advanced high-strength steel (AHSS) [5,7]. Thus, it is vital to investigate the fracture mode of the welded joint in RSW hot stamped boron steel.
Various previous researchers have focused on the lap shear fracture mode of the resistance spot welded joint. Ma et al. [10] investigated the fracture mode of the spot-welded hot dipped galvanized (HDG) DP600 steel and the causes for various fracture modes were discussed in relation to the microstructure and weld parameters. Pouranvari et al. [8] investigated the failure mode transition from interfacial to pullout mode during tensile-shear, and found that fusion zone size and hardness characteristics were key factors controlling the failure mode of AISI 304 resistance spot welds. Emre et al. [11] evaluated the tensile shear strength and failure mode of TRIP800 associated with nugget geometry and electrode indentations, and three distinct failure modes were observed with the difference in fracture route. These researches provided a guide for analyzing the fracture mode of B1500 and revealing the mechanism for various fracture modes. Currently, a number of research studies about resistance spot welding of ultra-high strength hot-stamped boron steel have been conducted [6,12,13,14], but most of them mainly concentrate on steel with strengths below 1500 MPa. Limited works have been published regarding resistance spot welding of martensitic steel with more than 1500 MPa. In consideration of the increasing application of stronger steels, high-hardness levels and brittleness of the weld leading to unfavorable fracture modes. Therefore, it is essential to investigate the microstructure changes and failure behavior of hot-stamped martensitic boron steel welds.
In this paper, effects of welding current on the fracture mode and maximum lap shear force were investigated. Fracture route, fracture characteristic, and absorbed energy during the lap shear process for three fracture modes were compared. To reveal the mechanism for various fracture modes, hardness distribution, and microstructure characteristics in the welded joint were analyzed, and fluctuations of the hardness were counted. This paper provides a guide to choose the proper welding parameters for guaranteeing the weld quality of hot-stamped boron steel.

2. Experimental Procedure

2.1. Materials

1.5-mm-thick 1500 MPa grade hot-stamped martensitic boron steel (hereinafter referred to as “B1500”) with an Al-Si coating was used in this study. Per manufacturers’ data sheet, chemical compositions and typical mechanical properties of the as-received 1.5-mm-thick B1500 steel are listed in Table 1 and Table 2, respectively. Figure 1 shows the microstructure of the as-received steels, which are fully stamped with martensite after hot stamping. The results of the tensile test of the steel sheet, which was performed according to ASTM E8/E8M-09 [15], are presented in Figure 2. The detailed geometrical sizes and shape of the specimens is shown in Figure 2a. The strain was captured by the laser extensometer (Epsilon Technology Corp., Jackson, WY, USA). The measurement device used in this investigation is shown in Figure 3a. Five replicates were performed for each test, and the average stress-strain curve was reported in Figure 2b.

2.2. Sample Fabrication

Resistance spot welding of the B1500 steel was conducted using a medium frequency direct current (MFDC) welding machine with a servo actuator (Medar Welding Equipment Co., Ltd., Shanghai, China) with a servo actuator. Electrodes with an 8.0 mm diameter flat B made of class II copper-chromium alloy were used according to ISO 5821:2009(E) and Resistance Welder Manufacturers Association (RWMA) standard. Unless otherwise specified, all resistance welding testing was performed using the parameters listed in Table 3 that had been determined based on a series of preliminary tests.

2.3. Cross-Sectional Examinations

Cross-Sectional examinations of the welds were performed using a standard metallographic procedure. The polished welds were subjected to hardness and metallographic examinations. The Vicker hardness was measured under an applied load of 9.81 N and a dwelling time of 10 s. Metallographic examinations were carried out to observe the microstructural evolutions and possible weld discrepancies. Specimens for metallographic examinations were prepared using standard metallography procedures and then etched with a 4% Nital for 30 s and rinsed by ethanol. All surfaces were analyzed using standard optical and stereo microscopes. To obtain high-resolution images, scanning electron microscopy was also employed.

2.4. Tensile-Shear Test

Tensile shear test were used to evaluate the mechanical performance of the joint. Since the tensile shear specimen was asymmetrical in its plane, two spacers having the same thickness were welded at the grip sections of the specimen to ensure the alignment and to reduce the sheet bending and nugget rotation. Major nominal dimensions of the test sample are shown in Figure 3b. The crosshead speed was constant at 2 mm/min. Fractured surfaces of the specimens are examined by microscope (Leica DM2500 M, Heidelberg, Germany) to identify the failure mechanisms.

3. Results and Discussion

3.1. Typical Fracture Mode

Figure 4 shows the typical fracture mode for welded B1500 joint. As shown, fracture mode was the competition result of the nugget zone and transition zone between nugget and upper-critical zone. When the nugget diameter was small, the nugget was the weakest position in the joint, and the fracture happened at the interface of the nugget, and this fracture mode is called interfacial fracture (IF). Schematic of IF and failed IF joint are shown in Figure 4a,b, respectively. When the nugget diameter was large enough, the nugget was stronger than the transition zone between nugget and the upper critical zone, fracture happened at the transition zone, this fracture mode is called pull-out fracture (PF). When the fracture only happened at the transition zone of a sheet, the nugget was pulled out from this sheet, and this mode was defined as PF I. Schematic of PF I and failed PF I joint were shown in Figure 4c,d, respectively. When the fracture happened at the transition zone of both sheets, the nugget was pulled out from both sheets, and this mode was defined as PF II. Schematic of PF II and failed PF II joint were shown in Figure 4e,f, respectively.
Figure 5a shows the effect of welding current on the nugget diameter and the corresponding fracture mode. The nugget diameter increased with the increase of welding current, and the fracture mode changed with the welding current. As shown, when the welding current was smaller than 6.0 KA, the fracture mode was IF. When the welding current was between 6.0 KA and 7.2 KA, both IF and PF I appeared. When the welding current was larger than 7.2 KA, both PF I and PF II appeared. As spatter appeared in one of the three specimens when the welding current was 8.0 KA, the welding current stopped increasing at this current. Figure 5b shows the effect of welding current on the indentation depth. As shown, indentation depth increased with the welding current at first, and then kept stable when the welding current reached 6.8 KA.
Figure 6a shows the schematic of the maximum lap-shear force and the fracture energy. As shown, maximum lap-shear force was the peak force of the force-displacement curve, while fracture energy represented the area of force and displacement during the lap shear process until the force decreased to zero. Figure 6b,c shows the effect of welding current on the maximum lap-shear force and the fracture energy. With the increasing welding current, both the maximum lap-shear force and the fracture energy had the tendency to increase. Both the average maximum lap-shear force and the average fracture energy of PF II mode had the maximum value, followed by those of PF I mode, and those of IF mode had the minimum value. Though there was no decrease in nugget diameter for the spattered specimen at the welding current of 8.0 KA, significant decrease appeared in both the maximum lap shear force and the fracture energy. The reason was that spatter might lead to the decrease of the nugget volume, as there was no decrease in nugget diameter, the thickness of the nugget might decrease, and fracture was easy to happen at the spattered specimen.
It was reported that 4 t could be used to calculate the critical nugget diameter between IF and PF for traditional low carbon steel and advanced high strength steel used in auto body manufacturing [16]. For 1.5 mm B1500, the calculated critical nugget diameter by this equation was 4.9 mm, far less than the required nugget diameter for PF as shown in Figure 5a. However, the critical nugget diameter calculated by 5 t , which was 6.1 mm, met well with the experimental results. Thus, the empirical equation 5 t could be used to calculate the critical nugget diameter in lap shear test for B1500.

3.2. Fracture Route

Figure 7 shows the fracture route of three various modes. For IF mode shown in Figure 7a, fracture initiated near the sheet interface and propagated towards the FZ before redirecting along the edge of FZ and failing through the sheet, thus the joint was separated along the interface of the nugget. For PF I mode shown in Figure 7b, the notch tip, which means the opening between two sheets in the nugget-surrounding area, is acting as an initial crack due to the stress concentration, thus the nugget was pulled out from one sheet. For PF II mode shown in Figure 7c, fracture also initiated near the notch tip and extended along the interface where the softened zone occurs. Failure happened by the withdrawal of the nugget, thus the nugget was pulled out from both sheets.
Figure 8 shows the typical force-displacement curves for three fracture modes. Force decrease velocity of IF mode was maximum, followed by that of PF I mode, and that of PF II was minimum. As shown in Figure 8, the displacement for IF, PF I and PF II, when force decreased to zero, were 0.65, 1.18 and 2.91 mm, respectively.
Figure 9 shows the SEM micrographs (JEOL JSM-6490, Tokyo, Japan) of the fracture surface after the tensile test of the joints welded at the IF mode. Figure 9a shows the overall view of the fracture. It was seen that there were macro-voids or cracks existing in the weld nugget which would cause the occurrence of interfacial failure and decrease the weld properties. It is indicated that small weld diameter in the joints might weaken the fusion zone and finally lead to the fracture in the region. As shown in Figure 9b,c, some short tearing ridges are observed on the fracture surface of the joints. Tiny cleavage planes connect with each other through the tearing ridge. It is a typical feature of quasi-cleavage mode, which belongs to a brittle transgranular fracture. Moreover, some small dimples can be observed as indicated by Figure 9c. The existence of dimples and tearing ridges means some plastic deformation occurred, which is a dominant brittle fracture, mixed with a measure of ductile fracture.
Figure 10 shows the microstructure of the fracture of PF I. Figure 10a shows the overall view of the fracture, enlarged views of the microstructure of zones (c) and (b) are shown in Figure 10b,c, respectively. As shown, dimple-like ductile fracture characteristics were observed in zone (b), while rive pattern cleavage fracture characteristics were observed in zone (c). The characteristics of the fracture showed that ductile fracture happened at first, and then the cleavage fracture would be next formed. For PF II mode, dimple-like ductile fracture characteristics were observed at all the fracture routes, similar to that shown in Figure 10b, which validated that ductile fracture appeared at all the fracture routes.

4. Discussion

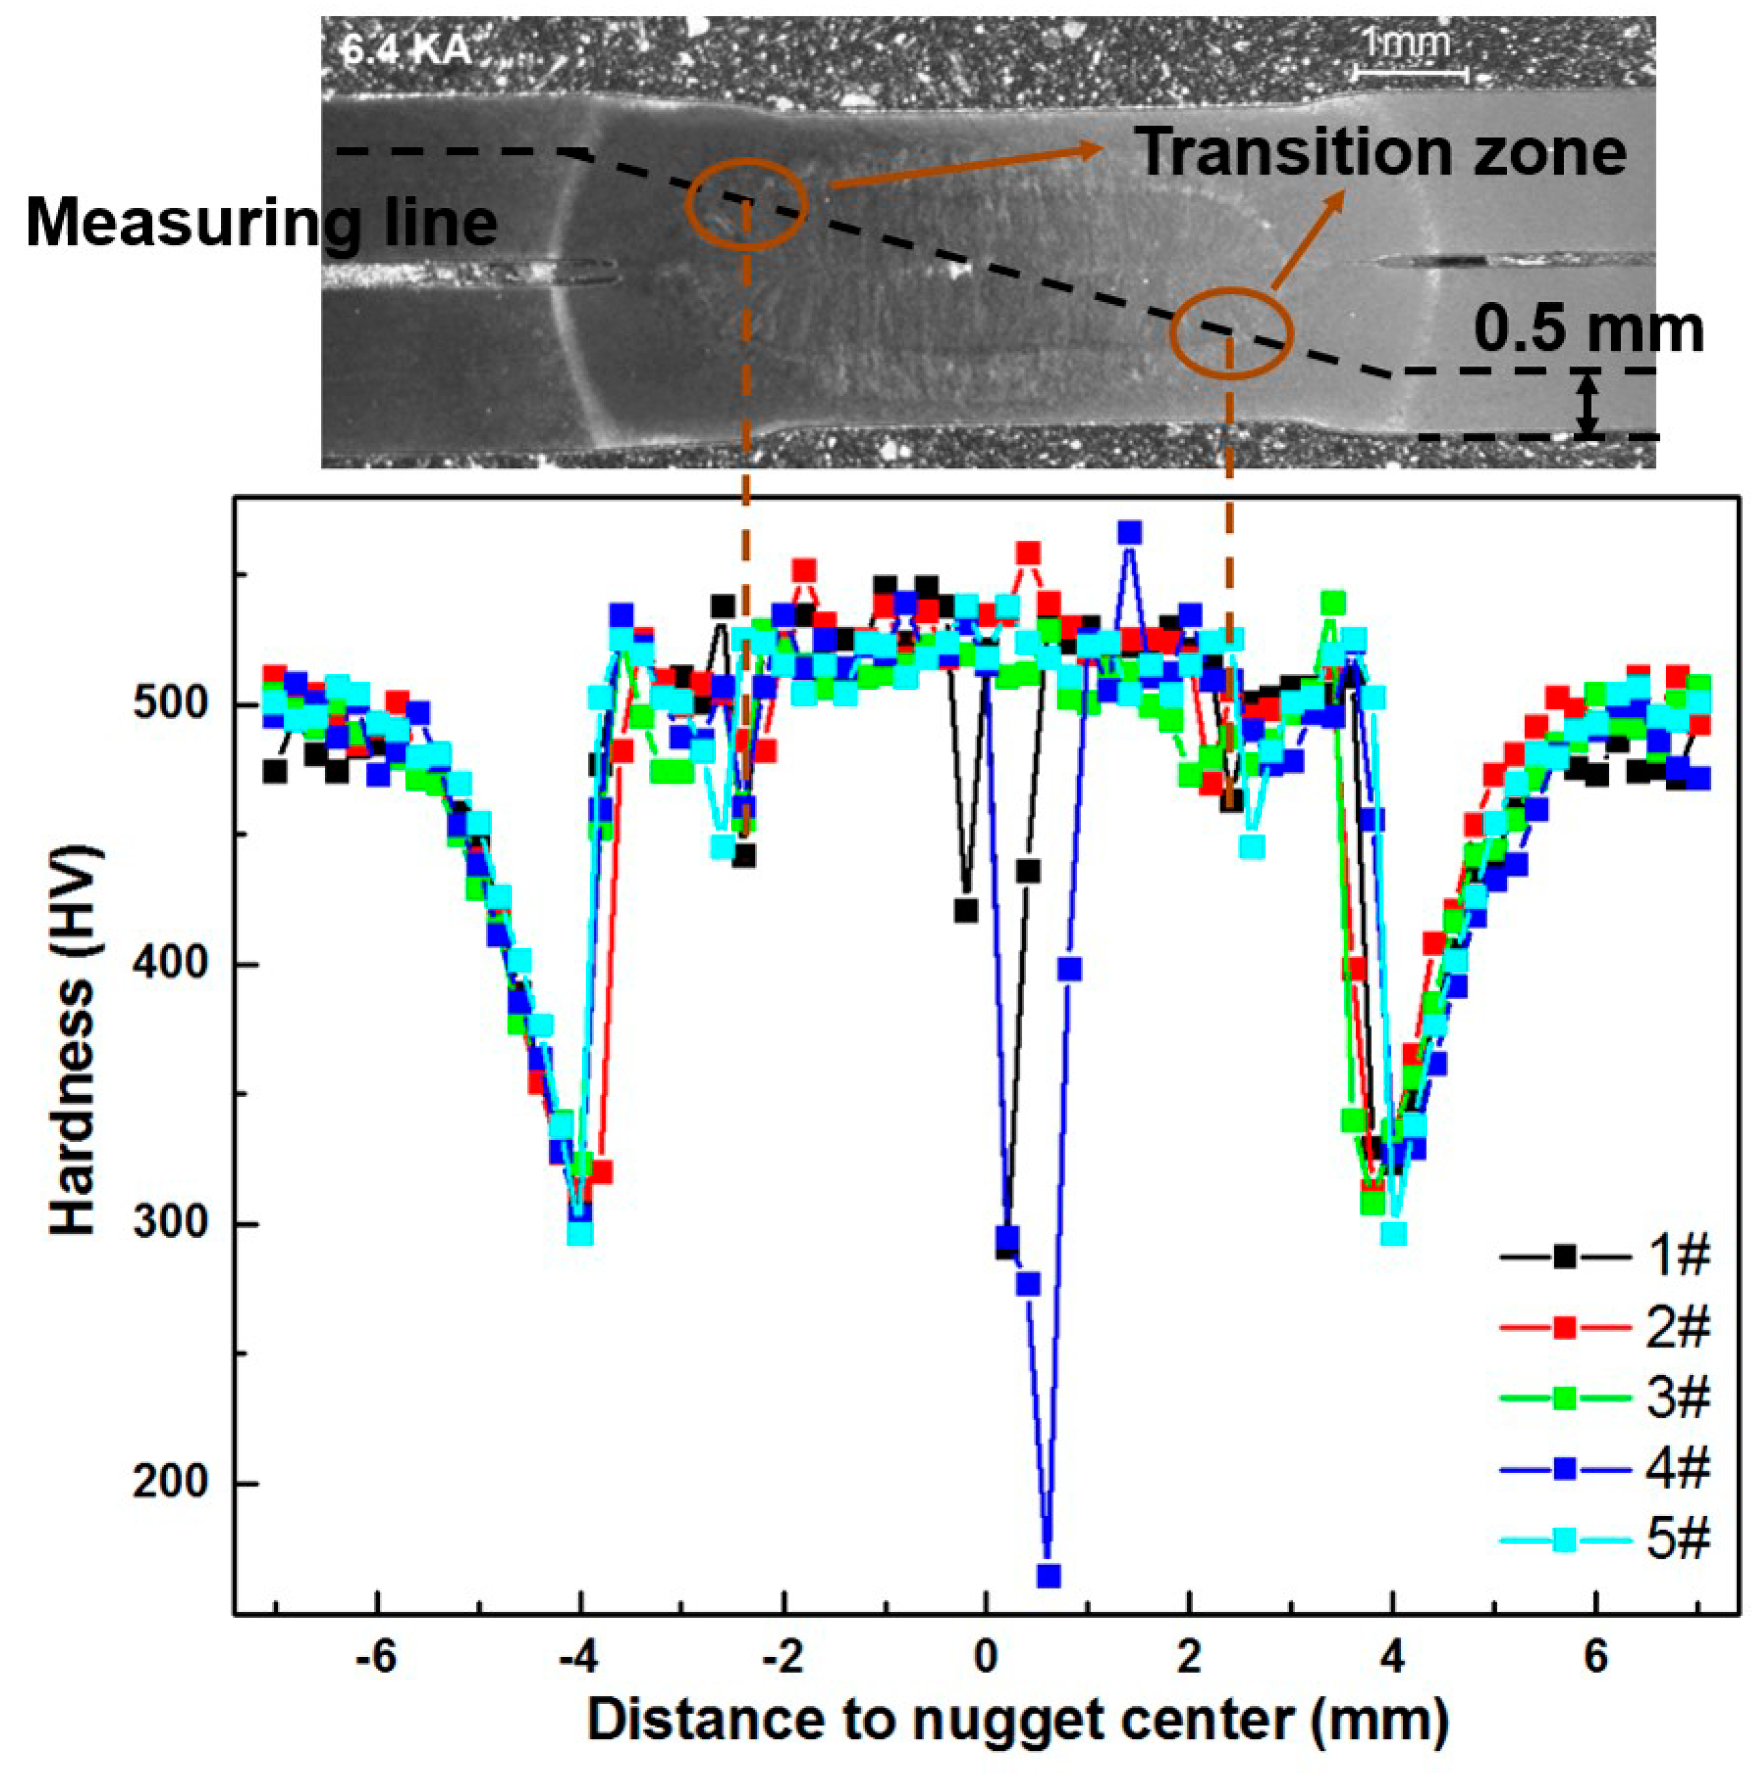
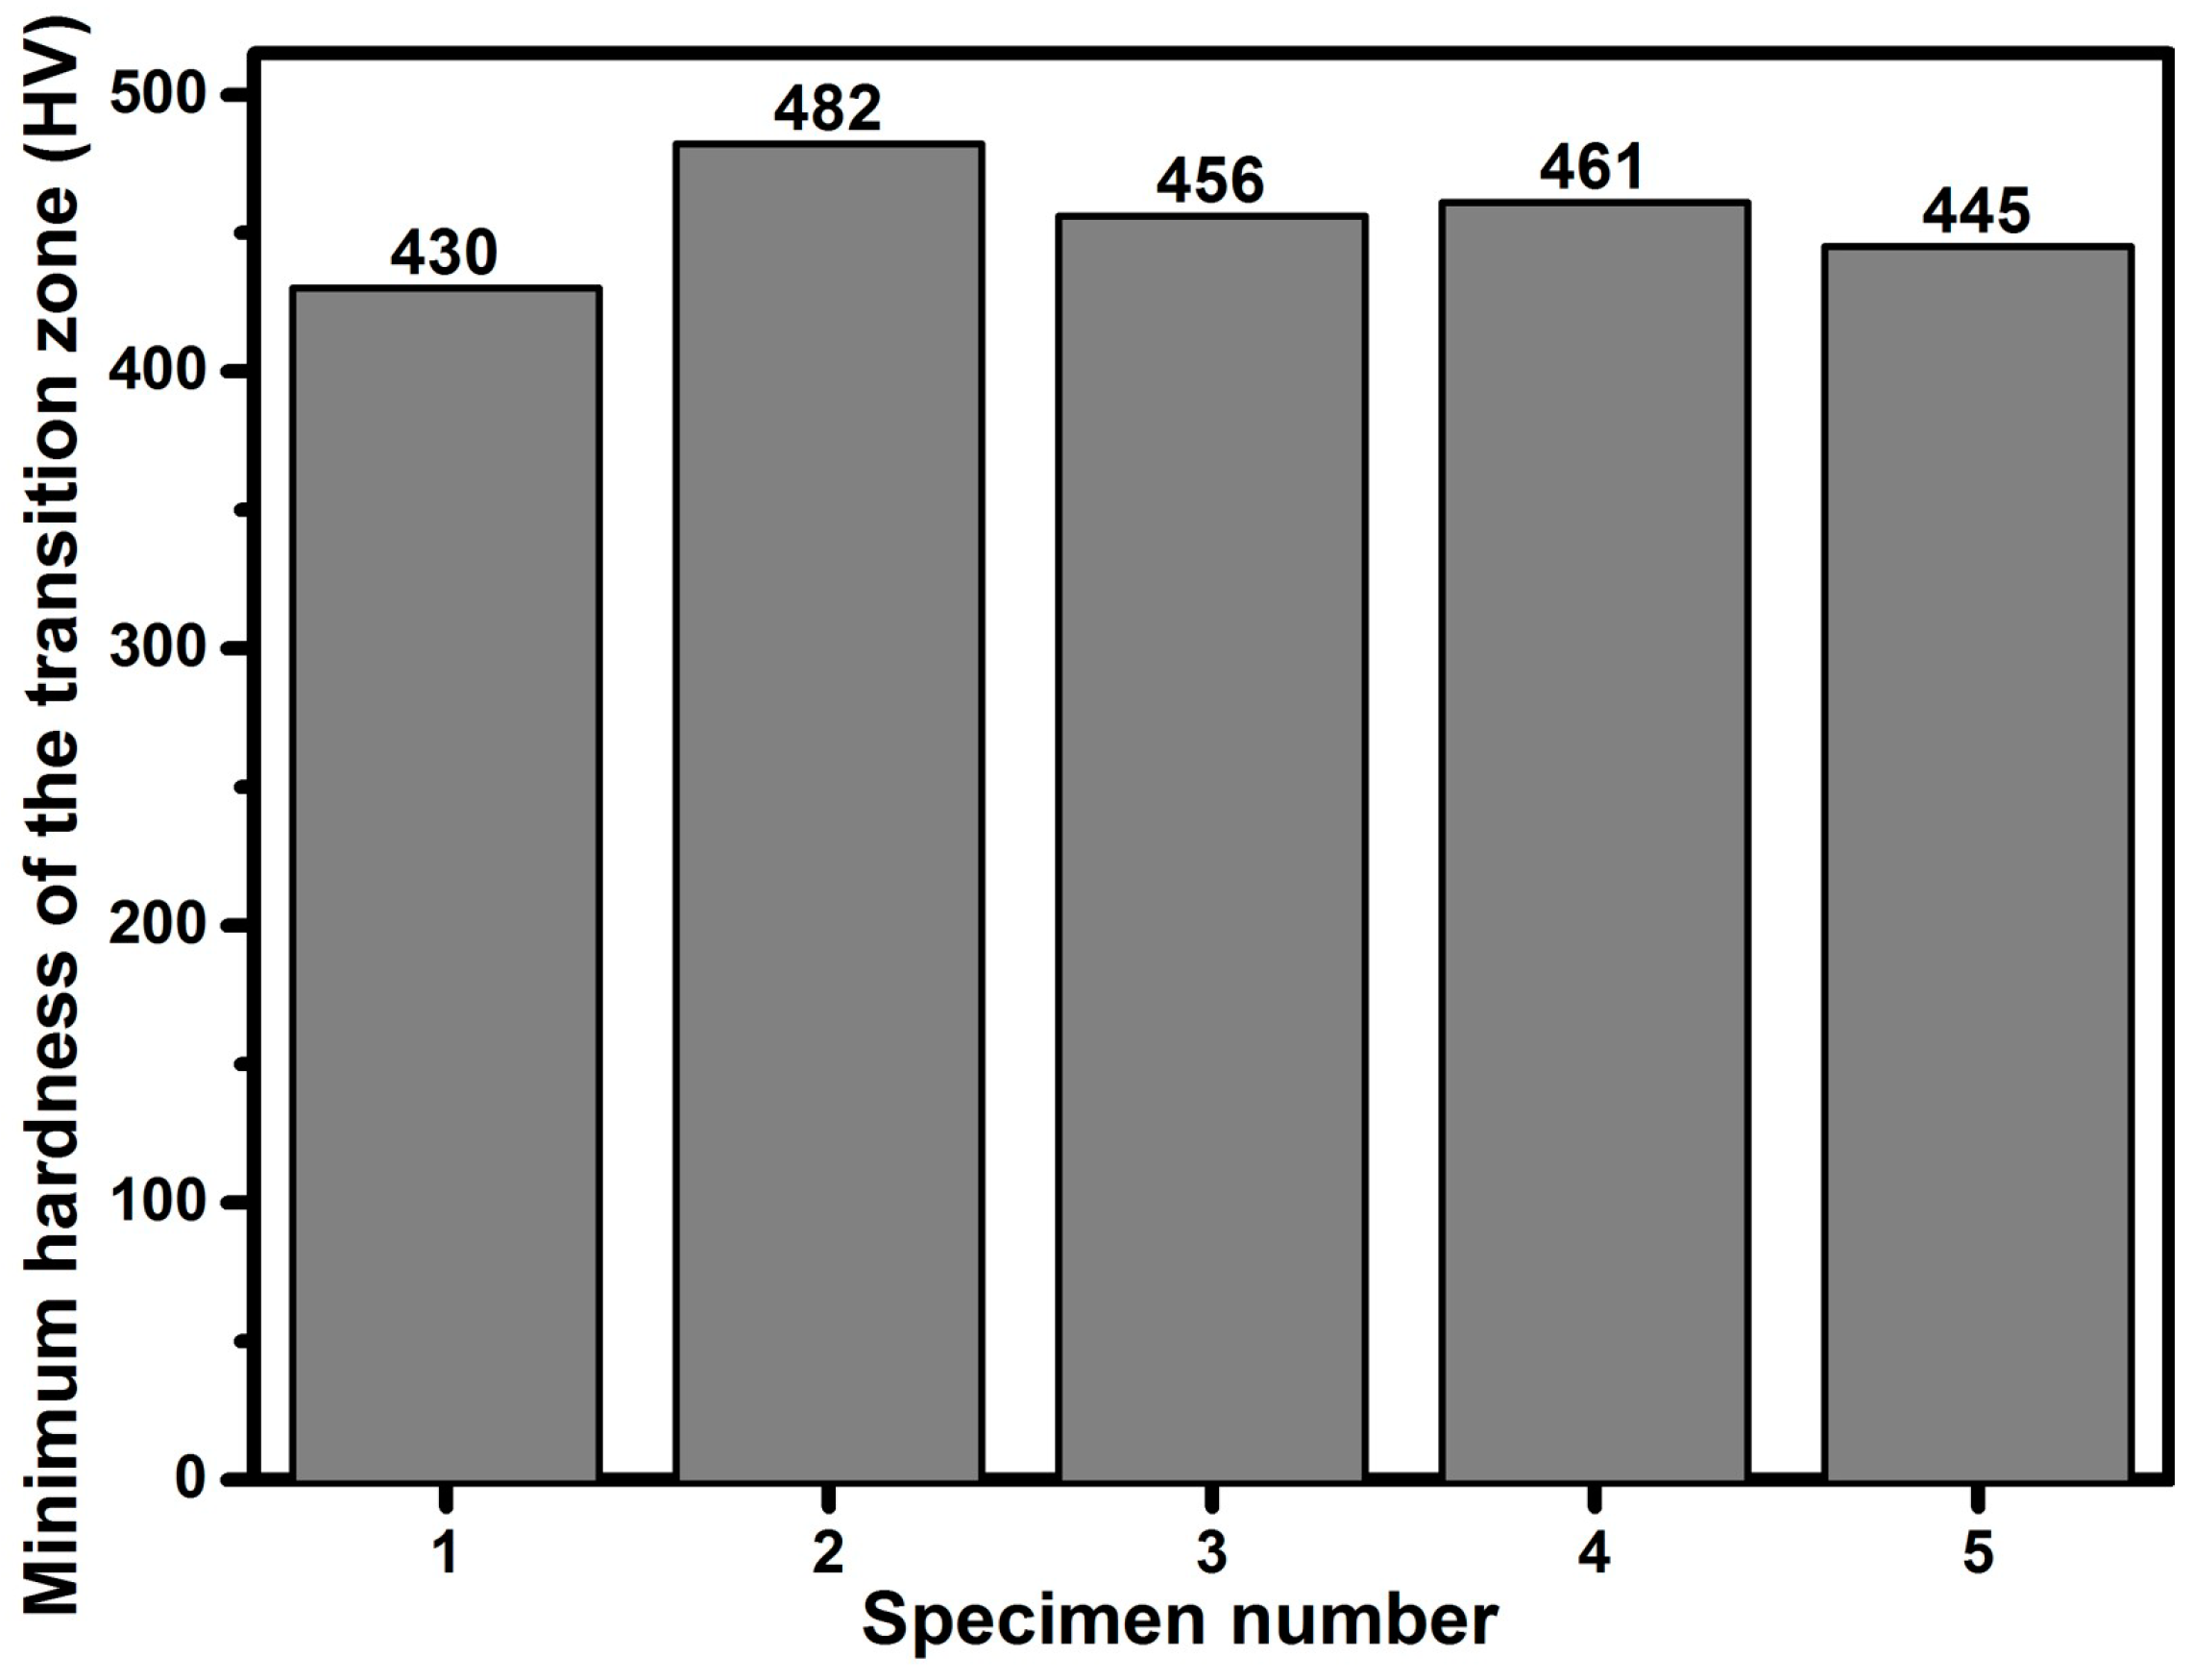
4.1. Microhardness Distribution
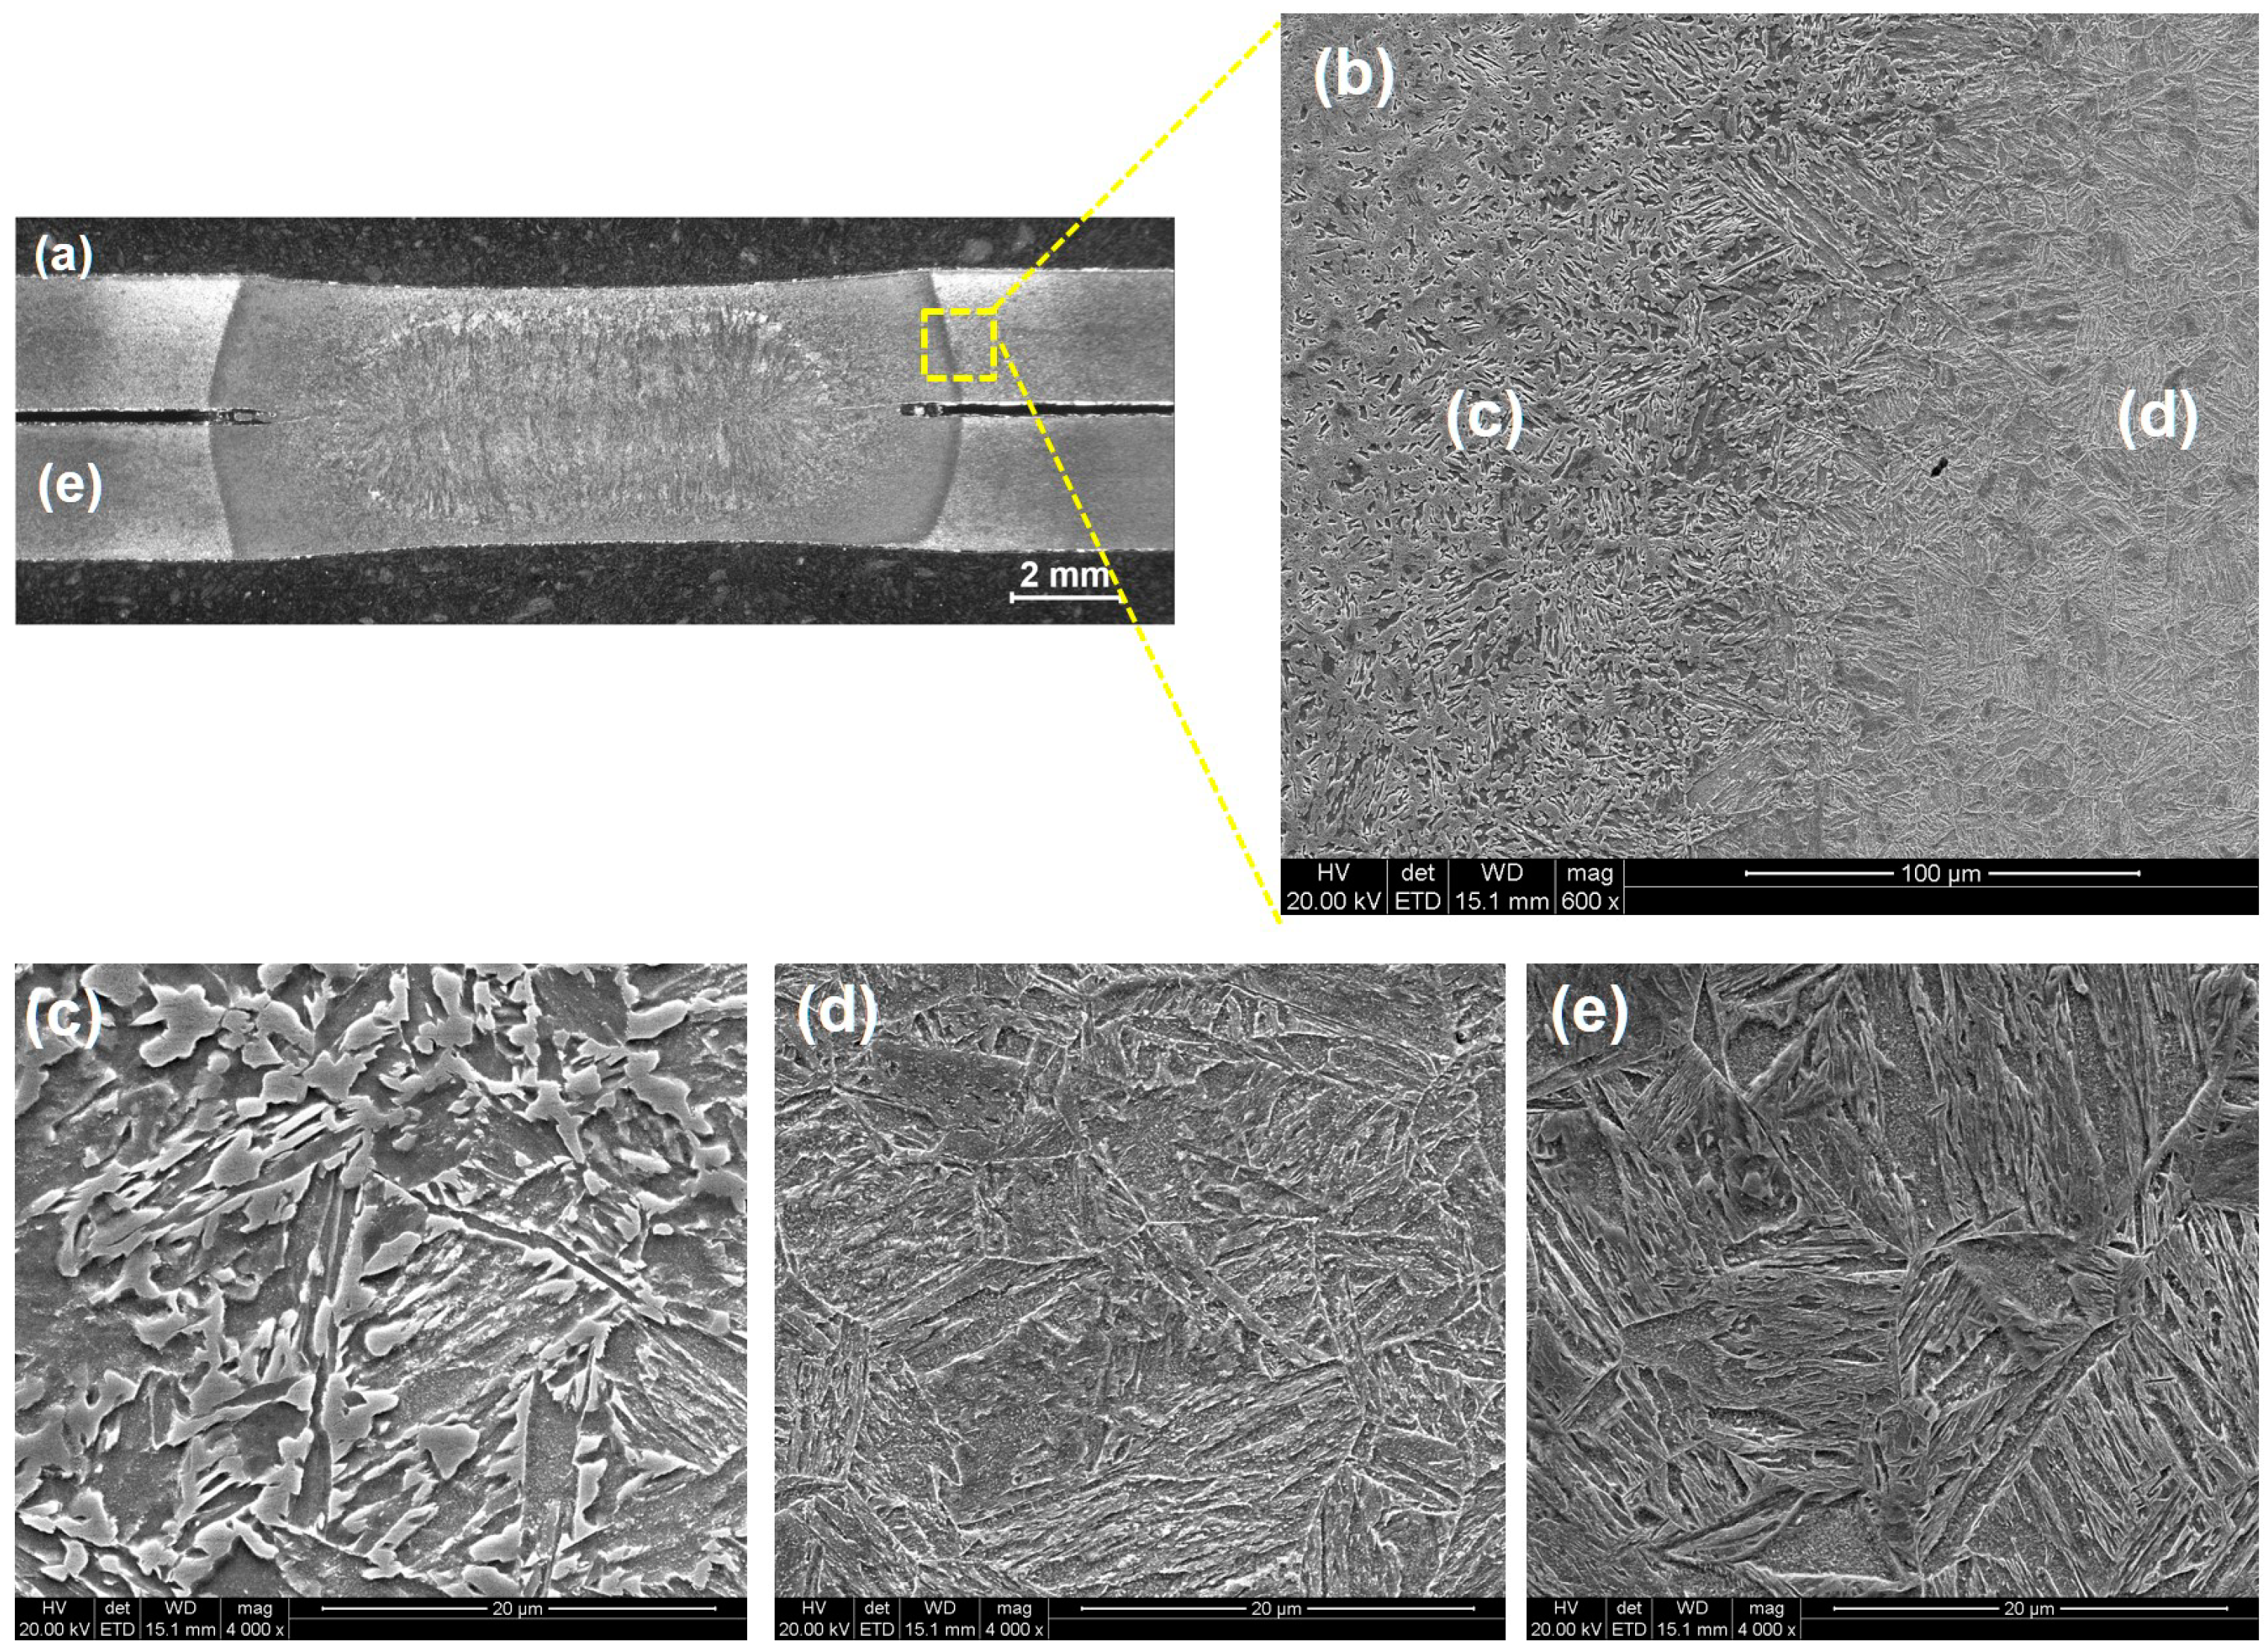
Figure 11 shows the hardness distribution at the cross section of the nugget of 6.4 KA. According to the hardness distribution, the joint could be divided into base metal zone (BM), heat affected zone (HAZ), and fusion zone (FZ). As also indicated by Figure 11, HAZ can be divided into three subregions: up-critical HAZ (UCHAZ) including coarse-grained HAZ (CGHAZ) and fine-grained HAZ (FGHAZ), inter-critical HAZ (ICHAZ), and sub-critical HAZ (SCHAZ). In the UCHAZ, the peak temperature during RSW was more than Ac3 and full austenitizing occurred. The ICHAZ is obtained when the zone is heated to Ac1-Ac3 and the martensite of the BM transforms into ferrite and austenite during the heating process based on the phase diagram. After cooling, the austenite in the ICHAZ will transform into martensite. For the SCHAZ, the peak temperature is below Ac1 and tempering of the martensite phase in the base metal occurs in this region due to the weld thermal cycle. The average typical hardness of the above-mentioned zone was 493, 499 and 521 HV, respectively. In SCHAZ, hardness varied significantly with the location, and the minimum hardness appeared at the location adjacent to the ICHAZ, corresponding to the white line in the metallographic figure. Meanwhile, there was slight hardness decrease in the transition zone between UCHAZ and nugget zone, this phenomenon was also observed in the previous literature in Reference [17]. The observed hardness decrease can be explained with the formation of the delta ferrite at the fusion boundary due to the high amount of Al element in the hot-stamped boron steel [18]. The hardness decrease in the transition zone could provide the reason for that fracture routes extended along the transition zones in both PF I and PF II mode.
Previous experimental results showed that fracture mode was fluctuant at some welding currents as shown in Figure 6b. For example, both IF and PF I appeared when the welding current were 6.4 and 6.8 KA, and both PF I and PF II appeared when the welding current were 7.2 and 7.6 KA. To reveal the reason of fluctuation, five specimens at the same welding current of 6.4 KA were prepared and hardness was measured. The measuring line and the results were shown in Figure 12. As shown, significant hardness drop appeared in the nugget zone of samples 1 and 4, the macro-voids and solidification shrinkage may account for the hardness drop, and these defects were also observed in the fracture shown in Figure 9. Meanwhile, significant hardness fluctuation was observed in the transition zone between the nugget zone and the upper critical zone. And minimum hardness of the transition zone of these five specimens were shown in Figure 13. As shown, the minimum value was 430 HV, while the maximum value was 482 HV. As hardness was the indicator of strength, it meant that significant fluctuation existed in the strength of the transition zone.
Fracture mode was the competition result of between shear deformation of FZ and necking in HAZ. IF mode initiated at the sheet interface and propagated towards the FZ and failed through the sheet. The IF mode will have a very low energy absorption which was not accepted in the joint quality tests. The emergence of shrinkage or cracks in the weld nugget would be prone to cause IF and decrease the weld properties. At the same time, small nugget diameter in the welds might be another possible reason to lead to the IF in the region by decreasing the load capability of the fusion zone. At higher welding currents and thus larger nugget size, a fracture mode will transit from IF to PF mode. For PF I mode, the notch tip between two sheets in the nugget-surrounding area will act as an initial crack due to the stress concentration. The fracture initiated at the FZ/UC zone and propagated along the thickness of the nugget, thus the nugget was pulled out from one sheet. When welding currents further increased, higher peak load, maximum displacement, and failure energy could be obtained with the PF II mode, during which the failure initiated at the SCHAZ where the softest zone occurred and propagated to the BM side, indicating more reliability of the welds. Fracture mode happened by the withdrawal of the nugget, thus the nugget was pulled out from both sheets.

4.2. Microstructure

To explain the reason for hardness distribution, microstructure in the cross section of the joint was observed and shown in Figure 14. Figure 14a shows the overall view of the cross section, and Figure 14b shows the enlarged view of zone (b) in Figure 14a, which is the transition zone between nugget and upper critical zone. Figure 14c–e shows the enlarged view of zones in Figure 14b, respectively. As shown, coarse martensite phase growing towards the center of the nugget was observed in (c), which was the microstructure of the FZ. Brittle martensite phase was also observed in (e), which was the microstructure of the upper critical HAZ. This was due to the fact that austenitizing was incomplete in this zone due to the short time above the austenitizing temperature, and even when austenite grains formed, grain growth was restricted by the formation of martensite during the fast cooling stage [19,20]. Figure 14d shows the microstructure of the transition zone between the fusion zone and the upper-critical HZA. The softening in this transition zone is mainly caused by macro segregation of carbon and other alloying element melt into the fusion zone [21]. The grain grew towards the center of the nugget, which was consistent with the direction of temperature gradient [22]. The effect of element segregation is explained by the formation of delta ferrite at the transition zone. The steel materials between the fusion zone and upper-critical HAZ will be heated above the transition temperature between the austenite and delta ferrite. In the subsequent quenching at the rapid cooling stage of RSW, the carbon redistribution and decomposition of delta ferrite would be inhibited and preserved in the transition zone, which resulted in the slight decrease of the hardness [23,24].
Figure 15b shows the microstructure of zone in Figure 15a, which is the softening zone with different softening degree varying with the location, and microstructure changing with the location is observed in this figure. The enlarged views of zones (c) and (d) are shown in Figure 15, respectively. A lot of tempered martensite phase is observed in (c), while martensite phase in (d) is only slightly tempered. The volume of the tempered martensite phase was determined by the temperature history, especially the highest temperature and the time above the tempering temperature [25]. Figure 15e shows the microstructure of zone in (a), which is the base metal of B1500. As shown, base metal was made of single martensite phase, produced by hot stamping.
In this paper, fracture modes of IF, PF I and PF II were found in the welded B1500 joint, and the fracture positions were observed either in the nugget zone or the transition zone between the nugget and the upper critical zone. In fact, significant softening was observed in the softening zone of the joint. And the fracture could happen in the softening zone when the nugget diameter was further increased without spatter by new welding schedules, e.g., multiple pulses, larger electrode force. And this research will do in the future.

5. Conclusions

In this paper, fracture mode of the resistance spot welded B1500 lap-shear joint was investigated by experimental test. Joint characteristics that affected the fracture mode were discussed. The following conclusions were obtained:
(1)
Three fracture modes (IF, PF I and PF II) were found in lap-shear test of resistance spot welded B1500 joint. With the increase of nugget diameter, the fracture mode tended to change from IF to PF. Fracture route of IF extended along the interface of the nugget, while route of PF extended along the transition zone between nugget and upper critical zone. The PF II mode had the maximum lap shear force and fracture energy.
(2)
At the welding current of 5.6 KA, IF mode initiated at the sheet interface and propagated towards the FZ and failed through the sheet. At higher welding currents and thus larger nugget size, a fracture mode will transit from IF to PF mode. For PF I mode, the fracture initiated at the FZ/UC zone and propagated along the thickness of the nugget, thus the nugget was pulled out from one sheet. For PF II mode, during which the failure initiated at the SCHAZ where the softest zone occurred and propagated to the BM side, indicating more reliability of the welds.
(3)
Obvious hardness decrease was observed in the transition zone of B1500 joint, which could provide the reason for route of PF I extending along this zone. This phenomenon can be explained with the formation of the delta ferrite at the fusion boundary due to the relatively high amount of alloying element in the hot-stamped boron steel. Fluctuation of the hardness in the transition zone led to the existence of both PF I and PF II at the same welding current.

Author Contributions

All the authors had the significant contribution to this manuscript. Y.Z. (Yixi Zhao) and Y.Z. (Yansong Zhang) are mainly responsible for implementing the experiments, analyzing the test results as well as writing the manuscript. X.L. is responsible for providing the test platform and important suggestions.

Funding

This work was supported by National Natural Science Foundation of China (51675338).

Conflicts of Interest

The authors declare no conflict of interest.

References

  1. Karbasian, H.; Tekkaya, A.E. A review on hot stamping. J. Mater. Process. Technol. 2010, 210, 2103–2118. [Google Scholar] [CrossRef]
  2. Pouranvari, M.; Marashi, S.P.H. Critical review of automotive steels spot welding: Process, structure and properties. Sci. Technol. Weld. Join. 2013, 18, 361–403. [Google Scholar] [CrossRef]
  3. Shaw, J.R.; Zuidema, B.K. New High Strength Steels Help Automakers Reach Future Goals for Safety, Affordability, Fuel Efficiency and Environmental Responsibility. SAE Trans. J. Mater. Manuf. 2001, 110, 976–983. [Google Scholar]
  4. Ighodaro, O.L.; Biro, E.; Zhou, Y.N. Comparative effects of Al-Si and galvannealed coatings on the properties of resistance spot welded hot stamping steel joints. J. Mater. Process. Technol. 2016, 236, 64–72. [Google Scholar] [CrossRef]
  5. Chabok, A.; van der Aa, E.; De Hosson, J.T.M.; Pei, Y.T. Mechanical behavior and failure mechanism of resistance spot welded DP1000 dual phase steel. Mater. Des. 2017, 124, 171–182. [Google Scholar] [CrossRef]
  6. Pouranvari, M.; Sobhani, S.; Goodarzi, F. Resistance spot welding of MS1200 martensitic advanced high strength: Microstructure-properties relationship. J. Mater. Process. 2018, 31, 867–874. [Google Scholar] [CrossRef]
  7. Chung, K.; Noh, W.; Yang, X.; Han, H.N.; Lee, M. Practical failure analysis of resistance spot welded advanced high-strength steel sheets. Int. J. Plast. 2017, 94, 122–147. [Google Scholar] [CrossRef]
  8. Pouranvari, M.; Marashi, S.P.H. Failure mode transition in AISI 304 resistance spot welds. Weld. J. 2012, 91, 303s–309s. [Google Scholar]
  9. Eller, T.K.; Greve, L.; Andres, M.T.; Medricky, M.; Hatscher, A.; Meinders, V.T.; Boogaard, A.H.V.D. Plasticity and fracture modeling of quench-hardenable boron steel with tailored properties. J. Mater. Process. Technol. 2014, 214, 1211–1227. [Google Scholar] [CrossRef]
  10. Ma, C.; Chen, D.L.; Bhole, S.D.; Boudreau, G.; Lee, A.; Biro, E. Microstructure and Fracture Characteristics of Spot-Welded DP600 Steel. Mater. Sci. Eng. A 2008, 485, 334–346. [Google Scholar] [CrossRef]
  11. Emre, H.E.; Kaçar, R. Development of weld lobe for resistance spot-welded TRIP800 steel and evaluation of fracture mode of its weldment. Int. J. Adv. Manuf. Technol. 2015, 83, 1737–1747. [Google Scholar] [CrossRef]
  12. Safanama, D.S.; Marashi, S.P.H.; Pouranvari, M. Similar and dissimilar resistance spot welding of martensitic advanced high strength steel and low carbon steel: Metallurgical characteristics and failure mode transition. Sci. Technol. Weld. Join. 2012, 17, 288–294. [Google Scholar] [CrossRef]
  13. Ashiri, R.; Marashi, S.P.H.; Park, Y.D. Weld Processing and Mechanical Responses of 1-GPa TRIP Steel Resistance Spot Welds. Weld. J. 2018, 97, 157s–169s. [Google Scholar]
  14. Tamizi, M.; Pouranvari, M.; Movahedi, M. Welding metallurgy of martensitic advanced high strength steels during resistance spot welding. Sci. Technol. Weld. Join. 2017, 22, 327–335. [Google Scholar] [CrossRef]
  15. American Society for Testing Materials. Standard Test Methods for Tension Testing of Metallic Materials; ASTM E8/E8M-09; ASTM International: West Conshohocken, PA, USA, 2008. [Google Scholar]
  16. Sun, X.; Stephens, E.V.; Khaleel, M.A. Effects of fusion zone size and failure mode on peak load and energy absorption of advanced high strength steel spot welds. Weld. J. 2007, 86, 18s–25s. [Google Scholar]
  17. Eller, T.K.; Greve, L.; Andres, M.; Medricky, M.; Geijselaers, H.J.M.; Meinders, V.T.; Boogaard, A.H.V.D. Plasticity and fracture modeling of the heat-affected zone in resistance spot welded tailor hardened boron steel. J. Mater. Process. Technol. 2016, 234, 309–322. [Google Scholar] [CrossRef]
  18. Lu, Y.; Peer, A.; Abke, T.; Kimchi, M.; Zhang, W. Subcritical heat affected zone softening in hot-stamped boron steel during resistance spot welding. Mater. Des. 2018, 155, 170–184. [Google Scholar] [CrossRef]
  19. Marya, M.; Gayden, X.Q. Development of Requirements for Resistance Spot Welding Dual-Phase (DP600) Steels Part 1—The Causes of Interfacial Fracture. Weld. J. 2005, 84, 172s–182s. [Google Scholar]
  20. Gould, J.E.; Khurana, S.P.; Li, T. Predictions of microstructures when welding automotive advanced high-strength steels. Weld. J. 2006, 85, 111s–116s. [Google Scholar]
  21. Inoue, H.; Koseki, T.; Okita, S.; Fuji, M. Epitaxial growth and phase formation of austenitic stainless steel weld metals near fusion boundaries: Study of solidification and transformation of Cr-Ni stainless steel weld metals (3rd Report). Weld. Int. 1998, 12, 195–206. [Google Scholar] [CrossRef]
  22. Yang, Z.; Sista, S.; Elmer, J.W.; Debroy, T. Three dimensional Monte Carlo simulation of grain growth during GTA welding of titanium. Acta Mater. 2000, 48, 4813–4825. [Google Scholar] [CrossRef]
  23. Ma, G.; Wu, D.; Guo, D. Segregation Characteristics of Pulsed Laser Butt Welding of Hastelloy C-276. Metall. Mater. Trans. A 2011, 42, 3853–3857. [Google Scholar] [CrossRef]
  24. Vignier, S.; Biro, E.; Hervé, M. Predicting the hardness profile across resistance spotwelds in martensitic steels. Weld World 2014, 58, 297–305. [Google Scholar] [CrossRef]
  25. Xia, M.; Biro, E.; Tian, Z.; Zhou, Y.N. Effects of Heat Input and Martensite on HAZ Softening in Laser Welding of Dual Phase Steels. ISIJ Int. 2008, 48, 809–814. [Google Scholar] [CrossRef] [Green Version]
Figure 1. Microstructures of the B1500 steel.
Metals 08 00764 g001
Figure 2. Experimental specimen and stress-strain curve of the B1500 steel: (a) Detailed geometrical specimen (b) stress-strain curve.
Metals 08 00764 g002
Figure 3. (a) The device used to measure the strain using the laser extensometer. (b) Major nominal dimensions of the lap shear test sample (unit: mm).
Metals 08 00764 g003
Figure 4. Typical fracture mode for welded B1500 joint: (a) schematic of interfacial fracture (IF); (b) failed IF joint; (c) schematic of pull-out fracture (PF) I; (d) failed PF II joint; (e) schematic of PF II; (f) failed PF II joint.
Metals 08 00764 g004
Figure 5. Effect of welding current on the: (a) nugget diameter; (b) indentation depth.
Metals 08 00764 g005
Figure 6. (a) Schematic of lap shear strength and fracture energy; and effect of welding current on the: (b) lap shear force; (c) fracture energy.
Metals 08 00764 g006aMetals 08 00764 g006b
Figure 7. Fracture position and route of three modes: (a) IF; (b) PF I; (c) PF II.
Metals 08 00764 g007
Figure 8. Typical force-displacement curve for three fracture modes.
Metals 08 00764 g008
Figure 9. SEM micrographs of the fracture surface after the tensile test at the IF mode (a) Overall view of the fracture surface, (b) higher magnification of the quasi-cleavage fracture surface, (c) higher magnification of the small dimples fracture surface.
Metals 08 00764 g009
Figure 10. Microstructure of the fracture of PF I: (a) overall view; (b) zone (b) in (a) with dimple-like ductile fracture characteristics; (c) zone (c) in (a) with rive pattern cleavage fracture characteristics.
Metals 08 00764 g010
Figure 11. Typical microhardness distribution at the cross section of the nugget with a welding current of 6.4 KA.
Metals 08 00764 g011
Figure 12. Microhardness fluctuation at the cross-section of the overall joint.
Metals 08 00764 g012
Figure 13. Microhardness fluctuation in the transition zone of the overall joint.
Metals 08 00764 g013
Figure 14. Cross-section characteristic of the spot welds: (a) overall view; (b) enlarged view of zone (b) in (a); (c) enlarged view of nugget zone in (b); (d) enlarged view of transition zone between nugget and upper-critical HAZ; (e) enlarged view of upper-critical HAZ.
Metals 08 00764 g014
Figure 15. Cross-section characteristic of the spot welds: (a) overall view; (b) enlarged view of zone (b) in (a); (c) enlarged view of softening zone (c) in (b); (d) enlarged view of softening zone (d) in (b); (e) enlarged view of base metal zone.
Metals 08 00764 g015
Table 1. Chemical composition in wt. % of B1500 steel.
SteelChemical Composition in wt. %
CSiMnCrTiAlB
B15000.230.241.190.180.040.030.0023
Table 2. Mechanical properties of B1500 steel.
SteelMechanical Properties
Yield Strength (MPa)Tensile Strength (MPa)Elongation (%)
B15001250 1530 7
Table 3. Welding parameters for spot welded B1500 steel.
ParametersElectrode Force (kN)Welding Current (KA)Squeeze Time (ms)Weld Time (ms)Hold Time (ms)
Value6.05.2~8.01000580200

