Abstract
Amounts of rare earth oxides were transferred into mold fluxes for the continuous casting of rare earth alloyed heavy railway steels. B2O3 was added to improve the viscosity properties and the crystallization behavior of this traditional mold flux. Thus, in this paper, effects of B2O3 on viscosity, structure, and crystallization of CeO2-bearing mold fluxes for casting rare earth alloyed heavy railway steels were investigated by rotating cylinder method, Raman spectroscopy, and magic angle spinning nuclear magnetic resonance (MAS NMR). Experimental results revealed that with the addition of B2O3, viscosity values of mold fluxes at some certain temperatures decreased significantly. By analyzing the structure of glassy mold fluxes, it can be observed that B2O3 behaved as a network-forming oxide within the studied system. However, the introduction of the weak bond energy of B–O and the transition from four-fold coordination boron to three-fold coordination boron with loose structural units mainly reduced the viscosity. Moreover, results of X-ray diffraction (XRD) and differential scanning calorimetry (DSC) confirmed that B2O3 decreased the crystallization of the crystal phase Na4Ca4(Si6O18) and the solidus temperature of mold fluxes. Thus, these results obtained can provide guidelines for designing new mold fluxes for casting rare earth alloyed steels.
1. Introduction
Rare earth, as an effective additive, is widely used for the generation of rare earth treated steels and rare earth alloyed steels [1,2,3], as it can show excellent heat resistance and good weather resistance [4]. However, due to the manufacturing process, rare earth oxides enter mold fluxes and rare earth oxides in some positions were even over 10 wt.%, which has a significant effect on viscosity properties and the crystallization behavior of mold fluxes. Viscosity determines the consumption and the uniform penetration of mold fluxes during continuous casting process, which is directly related to thermal conditions in the meniscus area and the surface quality of casting. Meanwhile, crystallization ability of mold fluxes can control heat transfer and lubrication by changing slag films. When crystallization temperature and crystallization ratio improve, friction between the slab and the mold will increase, leading to the increase of breakout probability.
Wang et al. [5] found that the viscosity of mold fluxes containing over 10 wt.% RExOy was too high to cast smoothly. Qi et al. [6] found that RExOy increased the viscosity of CaO-Al2O3 based mold fluxes, which needed 14 wt.% Li2O to balance. Zhang et al. [7] concluded that La2O3 increased the crystallization ratio and the film thickness significantly, which was harmful to the casting process. Therefore, viscosity properties and crystallization behavior of mold fluxes for casting rare earth alloyed steels are urgently needed to be studied.
About 5 to 10 wt.% CaF2 can control the melting temperature, viscosity [8], and heat transfer of traditional mold fluxes since fluoride tends to reduce the polymerization degree of silicate networks and obtain cuspidine [9]. However, part of fluoride compounds are volatilized into the air [10], resulting in air and water pollution. Other parts enter the system of secondary cooling water and rolling, leading to equipment corrosion. Additionally, too much cuspidine generated in slag films between the mold and the shell during casting rare earth alloyed heavy railway steels damages the lubrication and heat transference. It was reported that mold fluxes containing B2O3 become a most promising substitute for traditional mold fluxes. B2O3 has been taken into consideration for being introduced into mold fluxes to adjust viscosity or crystallization.
Therefore, this work focuses on studying viscosity and crystallization properties of CeO2-bearing mold fluxes with different amounts of B2O3. Viscosity tests conclude that B2O3 decreases viscosity and the reasonable amount of additive B2O3 in mold fluxes is 10 wt.% according to the required viscosity value (0.5 Pa·s at 1300 °C). B2O3 decreases the viscosity of the mold fluxes by introducing the weaker bond energy of B–O compared with that of Si–O and the transition from four-fold coordination to three-fold coordination. Crystallization tests indicates that B2O3 decreases the crystallization temperature and the solidus temperature of mold fluxes simultaneously. In this paper, results can provide reference for the understanding of developing mold fluxes for casting rare earth alloyed heavy railway steels.
2. Materials and Methods
2.1. Experimental Slags
Reagent grade powders of CaO (≥98 wt.%), SiO2 (≥99 wt.%), Al2O3 (≥99 wt.%), Na2CO3 (≥99.8 wt.%), B2O3 (≥98.5 wt.%), and CeO2 (≥99 wt.%) were used as raw materials. CaO was calcined in a muffle furnace at 1000 °C for 10 h and other powders were dried at 500 °C for 5 h to remove moisture and impurities. 3 wt.%, 5 wt.%, 7 wt.% and 10 wt.% B2O3 were added into traditional mold fluxes to replace CaF2, respectively. Well mixed samples were first ground and pressed into blocks, then melted in a graphite crucible using a silicon molybdenum rod furnace at 1400 °C for 30 min with Ar gas protection. After pre-heating, samples were water quenched and dried at 120 °C for 10 h followed by grinding into powders screened through 200-mesh sieve. Powder samples were subjected to the inductive coupled plasma optical emission spectrometry (ICP-OES) to determine the B2O3 content. The chemical composition of experimental mold fluxes analyzed by X-ray fluorescence (XRF) is shown in Table 1, water-quenched slags were homogenous verified by the X-ray diffraction (XRD) analysis in Figure 1.

Table 1.
Chemical composition of experimental mold fluxes.
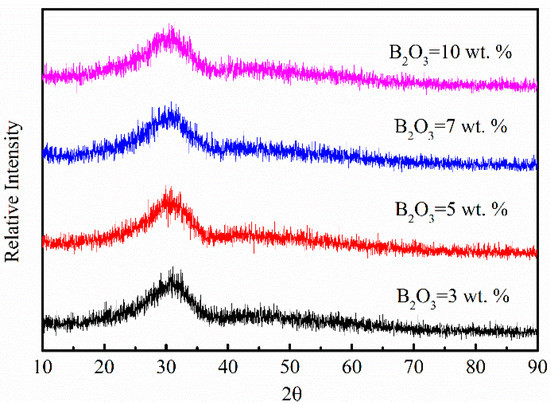
Figure 1.
XRD pattern of water quenched slags with different B2O3 contents after pre-heating.
2.2. The Viscosity Test
Viscosity values were measured using the rotating cylinder method during decreasing temperature. The measure system had three parts, including a heating system, a rotating system and a measuring system as shown in Figure 2. Resistance furnace (SHIMADEN FP21, Tokyo, Japan) was employed to melt experimental mold fluxes in a molybdenum crucible with the corundum crucible protection. Molybdenum rotor (height of 12 mm and diameter of 15 mm) rotated as the inner cylinder, the measured instrument was a Brookfield DV2T type viscometer (AMETEK Brookfield, Middleboro, MA, USA). Before measurement, viscosity values were calibrated at room temperature (25 °C) by using standard oil with known viscosity (0.495 Pa·s), and the measurement error was less than 2%. The measured viscosity values were calculated via Equation (1):
where η is measured viscosity values (Pa·s), TK is the torque constant (0.09373), SMC is the spindle multiplier constant (41.75) and Torque is the practical measured value (10–100%).
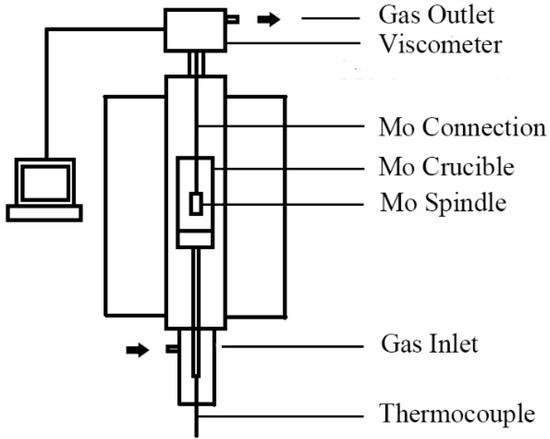
Figure 2.
Schematic figure of rotating cylinder viscometer.
Powders (150 g) were put in the molybdenum crucible. Samples were heated at a rate of 10 °C/min from room temperature to 1400 °C in 90% Ar and 10% H2 atmosphere and held for 30 min Rotor was used to stir the melts about 15 min before the measurement, and data were automatically recorded by a computer.
2.3. The Structure Test
Raman spectrometry (LabRAM HR Evolution, HORIBA Jobin Yvon S.A.S, Longjumeau, France) was employed to analyze the structure of glassy mold fluxes at room temperature. In this work, the analyzed frequency range was 400–2000 cm−1, and the excitation wavelength was 532 nm. Raman spectra of silicate samples quenched by water are similar to that of melts at high temperature, so it is feasible to study the structure of melts by analyzing the structure of glassy samples.
The 11B MAS NMR spectra of glassy samples were collected on a JNM-ECZ600R spectrometer (14.09 T, JEOL, Tokyo, Japan) at 192.4 MHz, using a probe with 3.2 mm ZrO2 rotors. 11B MAS spectra were obtained using a single pulse with the frequency of 12 kHz.
2.4. The Crystallization Test
A synchronous thermal analyzer (SDT-Q600, TA, New Castle, DE, USA) was employed to analyze non-isothermal crystallization characteristics of experimental mold fluxes. It can measure heat flow, temperature and weight change simultaneously in the same test condition. About 3 mg powder samples were well mixed and heated in the ZrO2 crucible at a rate of 20 °C/min from room temperature to 1300 °C in an Ar atmosphere. All data of differential scanning calorimetry (DSC) were recorded automatically.
An X-ray diffractometer (SMARTLAB 9 kW, Rigaku, Beijing, China) was used to analyze crystal phases of powder samples mentioned as follows. Powder samples were pressed into blocks to melt in a MoSi2 furnace at a rate of 5 °C/min from room temperature to the peak temperature on the DSC curve. After holding for 3 h at the peak temperature, samples were air quenched. Then samples were ground and screened to be analyzed using an X-ray diffractometer.
3. Results and Discussion
3.1. Effect of B2O3 Content on Viscosity
Figure 3 presents the viscosity of mold fluxes for casting rare earth alloyed heavy railway steels with different B2O3 contents. Viscosity continuously decreased and did not have obvious break points with decreasing temperature. The viscosity as function of temperatures decreased with increasing B2O3 content, which was more obvious at low temperatures than at high temperatures seen from Figure 3. According to the requirement of a viscosity value of 0.5 Pa·s at 1300 °C, the reasonable amount of additive B2O3 in mold fluxes for casting rare earth alloyed heavy railway steels is 10 wt.%.

Figure 3.
Viscosity results of experimental mold fluxes with decreasing temperature.
Figure 4 presents viscosity results of mold fluxes with different B2O3 contents at different temperatures in order to compare their different rheology behaviors. The value of Ea can be obtained as the slope by plotting ln η versus 1/(RT) via Equation (2):
where η is the viscosity, A is a constant dependent upon the slag structure, Ea is the activation energy of viscosity and R is the gas constant.

Figure 4.
Viscosity results of experimental mold fluxes with decreasing temperature.
The activation energy values of samples are shown in Table 2. The activation energy decreases with increasing B2O3 content, which indicates that B2O3 decreases the energy barrier and the increase of B2O3 is advantageous to the viscous flow.
Table 2.
The activation energy of experimental mold fluxes.
3.2. The Effect of B2O3 Content on Structure
Previous studies [11,12,13] found that viscosity values at high temperatures could be influenced by network structure and the bond energy of flow units. Raman spectroscopy is one of the techniques which has been widely utilized to analyze the structure of melts. Figure 5 shows the room temperature Raman spectra of mold fluxes with different B2O3 contents in this work. For every curve, three Raman peaks mainly appeared around 650 cm−1, 950 cm−1 and 1450 cm−1, respectively. With the increasing amount of B2O3, the Raman peak of the band at 950 cm−1 was shifted to higher frequencies. The Raman peak of the band at 1450 cm−1 could not be observed when the B2O3 content was 3 wt.% or 5 wt.%. With continuous increasing B2O3 content, relative intensity of the Raman peak of the band at 1450 cm−1 increased. The specific explanations about the change of Raman peaks are mentioned in the following sections.
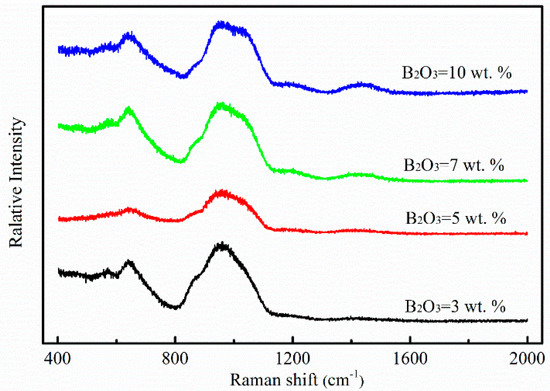
Figure 5.
Raman spectra for samples with different B2O3 contents at room temperature.
Figure 6a–d show deconvoluted results of the Raman spectra in Figure 5. Raman signals were subtracted and deconvoluted by using a Gaussian-Deconvolution method with the minimum correction coefficient r2 ≥ 0.995 [14,15] via Equation (3):
where I is the intensity of corrected spectra, I0 is the intensity of original spectra, ν and ν0 are frequencies of exciting line and Raman shift, respectively.
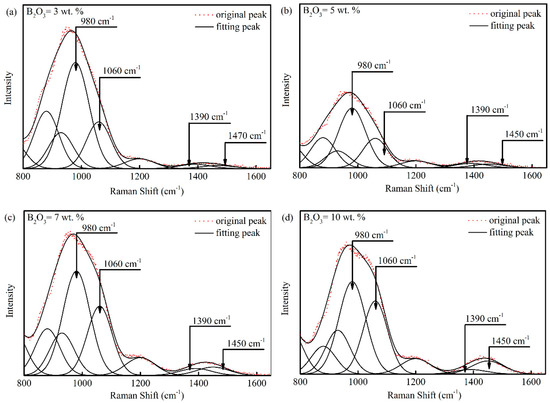
Figure 6.
Deconvoluted results of Raman spectra for mold fluxes with different B2O3 contents: (a) B2O3 = 3 wt.%; (b) B2O3 = 5 wt.%; (c) B2O3 = 7 wt.% and (d) B2O3 = 10 wt.%.
In Figure 6a–d, Raman peaks around 980 cm−1 and 1060 cm−1 are due to the stretching vibration of bridging oxygen in Q2 and Q3 structure. Q2 is (Si2O6)4− with two bridging oxygen in single chain structural units and Q3 is (Si4O11)6− with three bridging oxygen in double chain structural units [16,17]. Peaks around 1390 cm−1 and 1450 cm−1 are ascribed to BO2O− triangles linked to [BO4] units and BO2O− triangles linked to other triangular units [18,19,20]. The area ratio of a Raman peak is related to the proportion of corresponding structural units in the melt according to Frantz and Mysen [21,22] via Equation (4):
where Xi is the molar fraction, θi is the Raman scattering coefficient, Ai is the band area of structure units. It is reasonable to assume that the ratio of Raman scattering coefficients for Q3 and Q2 in our system is 2.92 (θ2/θ3 = 1/2.92). It can be obtained from the ratio of X2 to X3 in mold fluxes with different B2O3 contents. Therefore, the area ratio of Q2 to Q3 is estimated and used to represent abundance changes of bridging oxygen. Effects of B2O3 on the ratio of Q2 to Q3 can be seen in Figure 7, where the estimated ratio of Q2 to Q3 decreases with B2O3 addition. That means Q3 increases more quickly than Q2, leading to the increase of bridging oxygen in borosilicate glasses. It can be concluded that B2O3 plays the role of network former in this system.
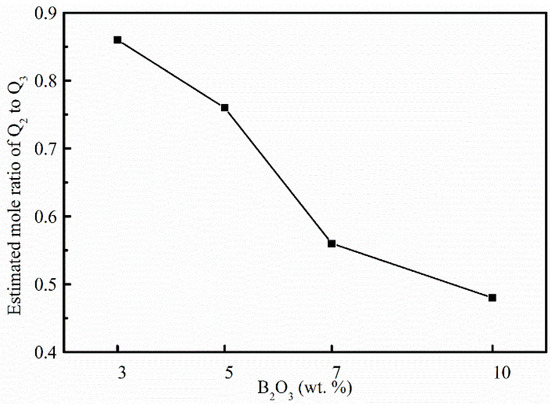
Figure 7.
Estimated mole ratio of Q2 to Q3 in four experimental mold fluxes.
Previous studies on the structure of silicates have shown that B2O3 can enhance the polymerization as a network former. Furthermore, a certain number of Si–O–B linkages exist in borosilicate and alkaline borosilicate glasses [23,24]. It is proposed that the increase of bridging oxygen may be due to the appearance of Si–O–B units. Normally, the viscosity would increase since structural network became more complex with the addition of B2O3. However, the viscosity of melts is not only decided by the structure, but also the bond energy of structural units. The introduction of B2O3 with weak B–O bond energy into silicate with strong Si–O bond energy would lead to the viscosity decrease. Besides, the area of A1 (peak around 1390 cm−1 due to BO2O− triangles linked to [BO4] units) decreased compared with the area of A2 (BO2O− triangles linked to other triangular units) as shown in Figure 8. The area ratio of A1 to A2 decreases with increasing B2O3 content, which indicates that some BO2O– triangles linked to [BO4] units converted to BO2O− triangles linked to other triangular units. In borosilicate melts, there are four-fold coordinated boron and three-fold coordinated boron coexisting. The three-fold coordinated boron is prone to form looser structural units than the four-fold coordinated boron, which is advantageous to the decrease of the viscosity at each temperature in this system.

Figure 8.
Area ratio of A1 to A2 in four experimental mold fluxes.
In this work, although the structure network of mold fluxes became more complex with the increasing B2O3, introduction of B2O3 resulted in the decrease of the viscosity at each temperature.
The signal from [BO3] and [BO4] units (centered around 12 ppm and 0 ppm as shown in Figure 9) are well resolved in 11B MAS NMR spectra [25], simultaneously. When the B2O3 content increased from 3 to 10 wt.%, the relative intensity of [BO3] and [BO4] units both increased. Details about analyses of the spectra are discussed below.
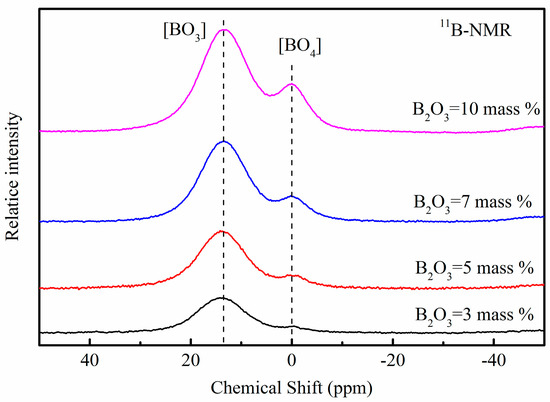
Figure 9.
11B MAS NMR spectra for glassy mold fluxes.
Figure 10a–d show deconvoluted results of MAS NMR spectra in Figure 9. The area ratio of A3 to A4 is used to represent the amount ratio of [BO3] to [BO4] as shown in Figure 11. The area ratio decreases with the addition of B2O3, which is similar to results and analyses of Raman spectra. In conclusion, adding B2O3 is of benefit to decrease the viscosity of mold fluxes for casting rare earth alloyed heavy railway steels by changing the structural network.

Figure 10.
Deconvoluted results of MAS NMR spectra for mold fluxes with different B2O3 contents: (a) B2O3 = 3 wt.%, (b) B2O3 = 5 wt.%, (c) B2O3 = 7 wt.%, and (d) B2O3 = 10 wt.%.
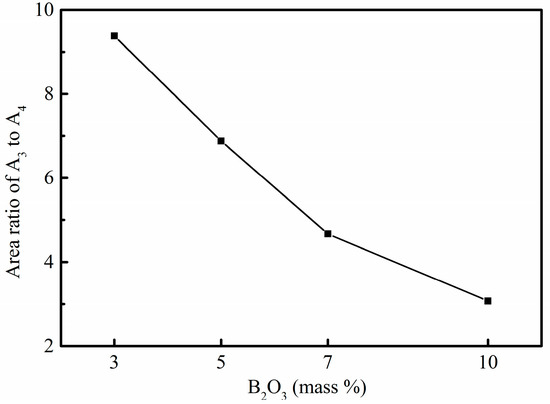
Figure 11.
Area ratio of A3 to A4 in four experimental mold fluxes.
3.3. Effect of B2O3 Content on Crystallization
Figure 12 shows DSC measurements of experimental mold fluxes with 3 wt.%, 5 wt.%, 7 wt.%, and 10 wt.% B2O3 during the heating process. With increasing temperature, an exothermic peak appeared around 800 °C, and an endothermic peak appeared about 900 °C, simultaneously. The exothermic peak temperature is referred to as the crystallization temperature of air quenched slags. Its peak area represents the enthalpy of the crystallization associated with the crystallization ability. With the addition of B2O3, the exothermic peak became less distinct as shown in Figure 12 corresponding to the decrease of the crystallization ability. Accordingly, the crystalline exothermic peak temperature of mold fluxes for casting rare earth alloyed heavy railway steels decreased first and then increased slightly when B2O3 increased from 3 to 10 wt.% as shown in Table 3, which proposes that the crystallization temperature during the heating process decreased first and increased a little later. The endothermic peak temperature is due to the solidus temperature at which the solid phase begins to transit to the liquid phase [26]. When B2O3 increased from 3 to 10 wt.%, the solidus temperature of air quenched samples decreased from 911 to 876 °C, as shown in Table 3 since B2O3 in mold fluxes has a low melting point or more low-melting compounds appeared. For the experimental mold fluxes, the B2O3 addition decreased the crystallization ability and the solidus temperature during the heating process of experimental mold fluxes.

Figure 12.
Change of the crystallization temperature (Tx) and the solidus temperature (Ts) in DSC measurements of glass mold fluxes with different B2O3 contents at a heat rate of 20 °C/min.
Table 3.
Characteristic temperatures of air quenched samples determined by DSC (°C).
Figure 13 presents XRD patterns of air quenched slags after holding for 3 h at the peak temperature of DSC curves. Three kinds of crystal phases were recognized in the samples, such as Na4Ca4(Si6O18), NaAlSiO4 and Ca2B2O5. The relative intensity of Na4Ca4(Si6O18) decreased, but the relative intensity of Ca2B2O5 increased with increasing B2O3. It was observed that B2O3 was beneficial to the precipitation of Ca2B2O5, but not to Na4Ca4(Si6O18). In Figure 12, only one crystalline exothermic peak appeared during the heating process of the four samples, which was attributed to negative conditions of DSC measurements for the secondary crystallization. The exothermic peak of the DSC curves correspond to the crystallization of Na4Ca4(Si6O18) by analyzing the XRD measurements. Thus, B2O3 decreases the crystallization temperature and the solidus temperature, and enhances the precipitation of Ca2B2O5 instead of Na4Ca4(Si6O18) during the heating process of mold fluxes.
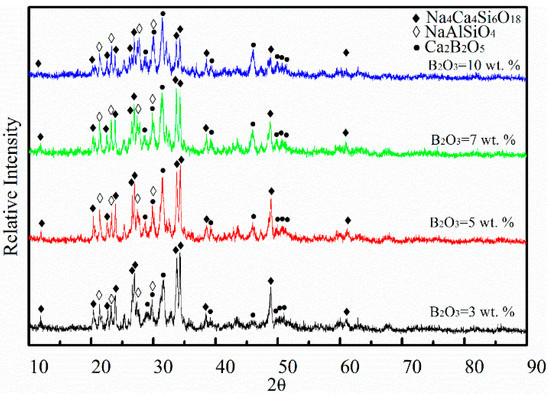
Figure 13.
XRD patterns of air quenched samples after heating for 3 h.
4. Conclusions
Viscosity and crystallization of mold fluxes with different B2O3 contents ranging from 3 wt.% to 10 wt.% were studied through the rotating cylinder method, DSC, and XRD, and the structure was analyzed using Raman spectra and MAS NMR. Three conclusions are summarized as follows:
- When B2O3 increased from 3 to 10 wt.%, the viscosity and the activation energy of mold fluxes decreased continuously at each temperature, which is beneficial to mold fluxes for casting rare earth alloyed heavy railway steels. According to the requirement of a viscosity value of 0.5 Pa·s at 1300 °C, the reasonable amount of additive B2O3 in mold fluxes is 10 wt.%.
- B2O3 played the role of network former in melts, but decreased the viscosity due to the introduction of B–O with weak bond energy and the structural units transition from four-fold coordination boron to threefold coordination boron with loose structure.
- B2O3 decreased the crystallization ability and the melting point by decreasing the crystallization temperature and the solidus temperature of mold fluxes during the heating process. The increase of B2O3 was beneficial to the crystallization of Ca2B2O5, but not Na4Ca4(Si6O18) during the heating process of mold fluxes.
Author Contributions
Z.C. designed the work and conducted the viscosity experiments and wrote the manuscript under the advice of B.S., B.S., L.L., Z.L. and X.C. revised the manuscript before submission.
Funding
This work was supported by National Natural Science Foundation of China (grant No. 51774024).
Conflicts of Interest
The authors declare no conflict of interest.
References
- Wang, L.M.; Lin, Q.; Ji, J.W.; Lan, D.N. New Study Concerning Development of Application of Rare Earth Metals in Steels. J. Alloys Compd. 2006, 48, 384–386. [Google Scholar] [CrossRef]
- Zhou, X.F.; Yin, X.Y.; Fang, F.; Jiang, J.Q.; Zhu, W.L. Influence of Rare Earths on Eutectic Carbides in AISI M2 High Speed Steel. J. Rare Earths 2012, 30, 1075–1078. [Google Scholar] [CrossRef]
- Xing, X.G.; Han, Z.J.; Wang, H.F.; Lu, P.N. Electrochemical Corrosion Resistance of CeO2-Cr/Ti Coatings on 304 Stainless Steel via Pack Cementation. J. Rare Earths 2015, 33, 1122–1128. [Google Scholar] [CrossRef]
- Liu, Y.Q.; Wang, L.J.; Chou, K.C. Effect of Cerium on the Cleanliness of Spring Steel Used in Fastener of High-Speed Railway. J. Rare Earths 2014, 32, 759–766. [Google Scholar] [CrossRef]
- Wang, D.Y.; Jiang, M.F.; Liu, C.J.; Shi, P.Y.; Yao, Y.; Wang, H.H. Effects of Rare Earth Oxide on Viscosity of Mold Fluxes for Continuous Casting. J. Rare Earths 2005, 23, 68–72. [Google Scholar]
- Qi, J.; Liu, C.J.; Li, C.L.; Jiang, M.F. Viscous Properties of New Mold Flux Based on Aluminate System with CeO2 for Continuous Casting of RE Alloyed Heat Resistant Steel. J. Rare Earths 2016, 34, 328–335. [Google Scholar] [CrossRef]
- Zhang, F.; Yuan, C.; Wang, Y.C.; Dong, F.; Wu, M.Q. Influence of La2O3 on Crystallization Behavior of Free-fluoride Mold Flux and Heat Transfer of Slag Films. J. Rare Earths 2011, 29, 173–177. [Google Scholar] [CrossRef]
- Nichols, M.W.; Lingras, A.P.; Apelian, D. Viscosity Characteristics of Commercial Fluxes for Bottom Poured Ingots. In Proceedings of the Second International Symposium on Metallurgical Slags and Fluxes, Lake Tahoe, NV, USA, 11–14 November 1984; pp. 235–251. [Google Scholar]
- Seo, M.D.; Shi, C.B.; Baek, J.Y.; Cho, J.W.; Kim, S.H. Kinetics of Isothermal Melt Crystallization in CaO-SiO2-CaF2-Based Mold Fluxes. Metall. Mater. Trans. B 2015, 46, 2374–2383. [Google Scholar] [CrossRef]
- Zaitsev, A.I.; Leites, A.V.; Lrtvina, A.D.; Mogutnov, B.M. Investigation of the Mould Powder Volatiles During Continuous Casting. Steel Res. Int. 1994, 65, 368–374. [Google Scholar] [CrossRef]
- Zhou, L.J.; Wang, W.L.; Zhou, K.C. Viscosity and Crystallization Behavior of F-free Mold Flux for Casting Medium Carbon Steels. ISIJ Int. 2015, 55, 1916–1924. [Google Scholar] [CrossRef]
- Shimizu, F.; Tokunaga, H.; Saito, N.; Nakashima, K. Viscosity and Surface Tension Measurements of RE2O3-MgO-SiO2 (RE = Y, Gd, Nd and La) melts. ISIJ Int. 2006, 46, 388–393. [Google Scholar] [CrossRef]
- Wang, Z.; Shu, Q.F.; Chou, K.C. Viscosity of Fluoride-free Mold Fluxes Containing B2O3 and TiO2. Steel Res. Int. 2013, 84, 766–776. [Google Scholar] [CrossRef]
- Zhang, P.; Grandinetti, P.J.; Stebbins, J.F. Anionic Species Determination in CaSiO3 Glass using Two-dimensional 29Si NMR. J. Phys. Chem. B 1997, 101, 4004–4008. [Google Scholar] [CrossRef]
- Maekawa, H.; Maekawa, T.; Kawamura, K.; Yokokawa, T. The Structural Groups of Alkali Silicate Glasses Determined from 29Si MAS-NMR. J. Non-Cryst. Solids 1991, 127, 53–64. [Google Scholar] [CrossRef]
- Sasaki, Y.; Urata, H.; Ishii, K. Structural Analysis of Molten Na2O-NaF-SiO2 System by Raman Spectroscopy and Molecular Dynamics Simulation. ISIJ Int. 2003, 43, 1897–1903. [Google Scholar] [CrossRef]
- Parkinson, B.G.; Holland, D.; Smith, M.E.; Howes, A.P.; Scales, C.R. The Effect of Oxide Additions on Medium-Range Order Structures in Borosilicate Glasses. J. Phys. Condens. Matter 2007, 19, 415114. [Google Scholar] [CrossRef] [PubMed]
- Chryssikos, G.D. Bond Length-Raman Frequency Correlations in Borate Crystals. J. Raman Spectrosc. 1991, 22, 645–650. [Google Scholar] [CrossRef]
- Akagi, R.; Ohtori, N.; Umesaki, N. Raman Spectra of K2O-B2O3 Glasses and Melts. J. Non-Cryst. Solids 2001, 293, 471–476. [Google Scholar] [CrossRef]
- Chryssikos, G.D.; Kamitsos, E.I.; Patsis, A.P.; Bitsis, M.S.; Karakassides, M.A. The Devitrification of Lithium Metaborate: Polymorphism and Glass Formation. J. Non-Cryst. Solids 1990, 126, 42–51. [Google Scholar] [CrossRef]
- Frantza, J.D.; Mysen, B.O. Raman Spectra and Structure of BaO-SiO2-SrO-SiO2 and CaO-SiO2 Melts to 1600 °C. Chem. Geol. 1995, 121, 155–176. [Google Scholar] [CrossRef]
- Mysen, B.O.; Frantz, J.D. Structure of Silicate Melts at High Temperature: In-Situ Measurements in the System BaO-SiO2 to 1669 °C. Am. Mineral. 1993, 78, 699–709. [Google Scholar]
- Wang, S.; Stebbins, J.F. Multiple-Quantum Magic-Angle Spinning 17O NMR Studies of Borate, Borosilicate, and Boroaluminate Glasses. J. Am. Ceram. Soc. 1999, 82, 1519–1528. [Google Scholar] [CrossRef]
- Soraru, G.D.; Dallabona, N.; Gervais, C.; Babonneau, F. Organically Modified SiO2-B2O3 Gels Displaying a High Content of Borosiloxane (B-O-Si⋮) Bonds. Chem. Mater. 1999, 11, 910–919. [Google Scholar] [CrossRef]
- Du, L.S.; Stebbins, J.F. Network Connectivity in Aluminoborosilicate Glasses: A High-Resolution 11B, 27Al and 17O NMR Study. J. Non-Cryst. Solids 2005, 351, 3508–3520. [Google Scholar] [CrossRef]
- Shu, Q.F.; Wang, Z.; Klug, J.L.; Chou, K.C.; Scheller, P.R. Effects of B2O3 and TiO2 on Crystallization Behavior of Slags in Al2O3-CaO-MgO-Na2O-SiO2 System. Steel Res. Int. 2013, 84, 1138. [Google Scholar] [CrossRef]
© 2018 by the authors. Licensee MDPI, Basel, Switzerland. This article is an open access article distributed under the terms and conditions of the Creative Commons Attribution (CC BY) license (http://creativecommons.org/licenses/by/4.0/).