Abstract
Mushy zone morphology in AlSiMn alloys was studied using directional solidification, and the CALPHAD (Computer Coupling of Phase Diagrams and Thermochemistry) technique was applied for thermodynamic calculations. The specimens solidified with forced convection presented segregation across the sample diameter, and the measured compositions were located on the Al-Si-Mn phase diagram. Scheil-Gulliver calculations for measured compositions were used to determine various solidification paths that may occur in specimens. Property diagrams and solidification paths presented the segregation effect on the characteristic temperatures, mushy zone length and the sequence of occurring phases whilst 2D maps enabled visualization of the mushy zone during directional solidification. Melt stirring was found to change solidification range, as well as mushy zone length and shape, and the dendrite tips formed a rough profile across the specimens. The study revealed mushy zones with dense dendritic structure and liquid channels empty of Mn phases, where intermetallics had no possibility to flow in the liquid, whilst in other samples with channels filled with Al15Si2Mn4, Mn-precipitates also flowed above the α-Al. The melt flow may lead to a mainly dendritic mushy zone or to a mushy zone with dendrites reaching only lower half of mushy length with intermetallics forming and freely flowing above dendrites in the liquid upper half.
1. Introduction
The design of industrial processes requires an understanding of the relationship between composition, microstructure and processing conditions. Phase diagrams, which show the equilibrium phase or phases present at different compositions and temperatures, are particularly important tools for understanding and controlling material behavior. An extensive collection of experimentally determined phase diagrams can be found in [1]. Phase diagrams can also be predicted using the modern CALPHAD (Computer Coupling of Phase Diagrams and Thermochemistry) technique, which models thermodynamic properties of different phases and predicts behavior and interactions between phases [2,3]. To be accurate, the CALPHAD method [3,4,5] requires databases with theoretical and experimental information about phase equilibria and thermomechanical properties in a studied system. The interrelations between phases are modeled with the Gibbs free energy, using mathematical modeling aided by various material parameters [3,4,5]. However, it is not possible to produce a precise description of the Gibbs energies of a complex system with analytical equations alone. The parameters for phase description and the relationships are obtained by fitting the model to existing information. Only after collecting databases, models and parameters, does it become possible to predict a phase diagram in regions without experimental data, for metastable states, or for multi-component systems [3,4,5].
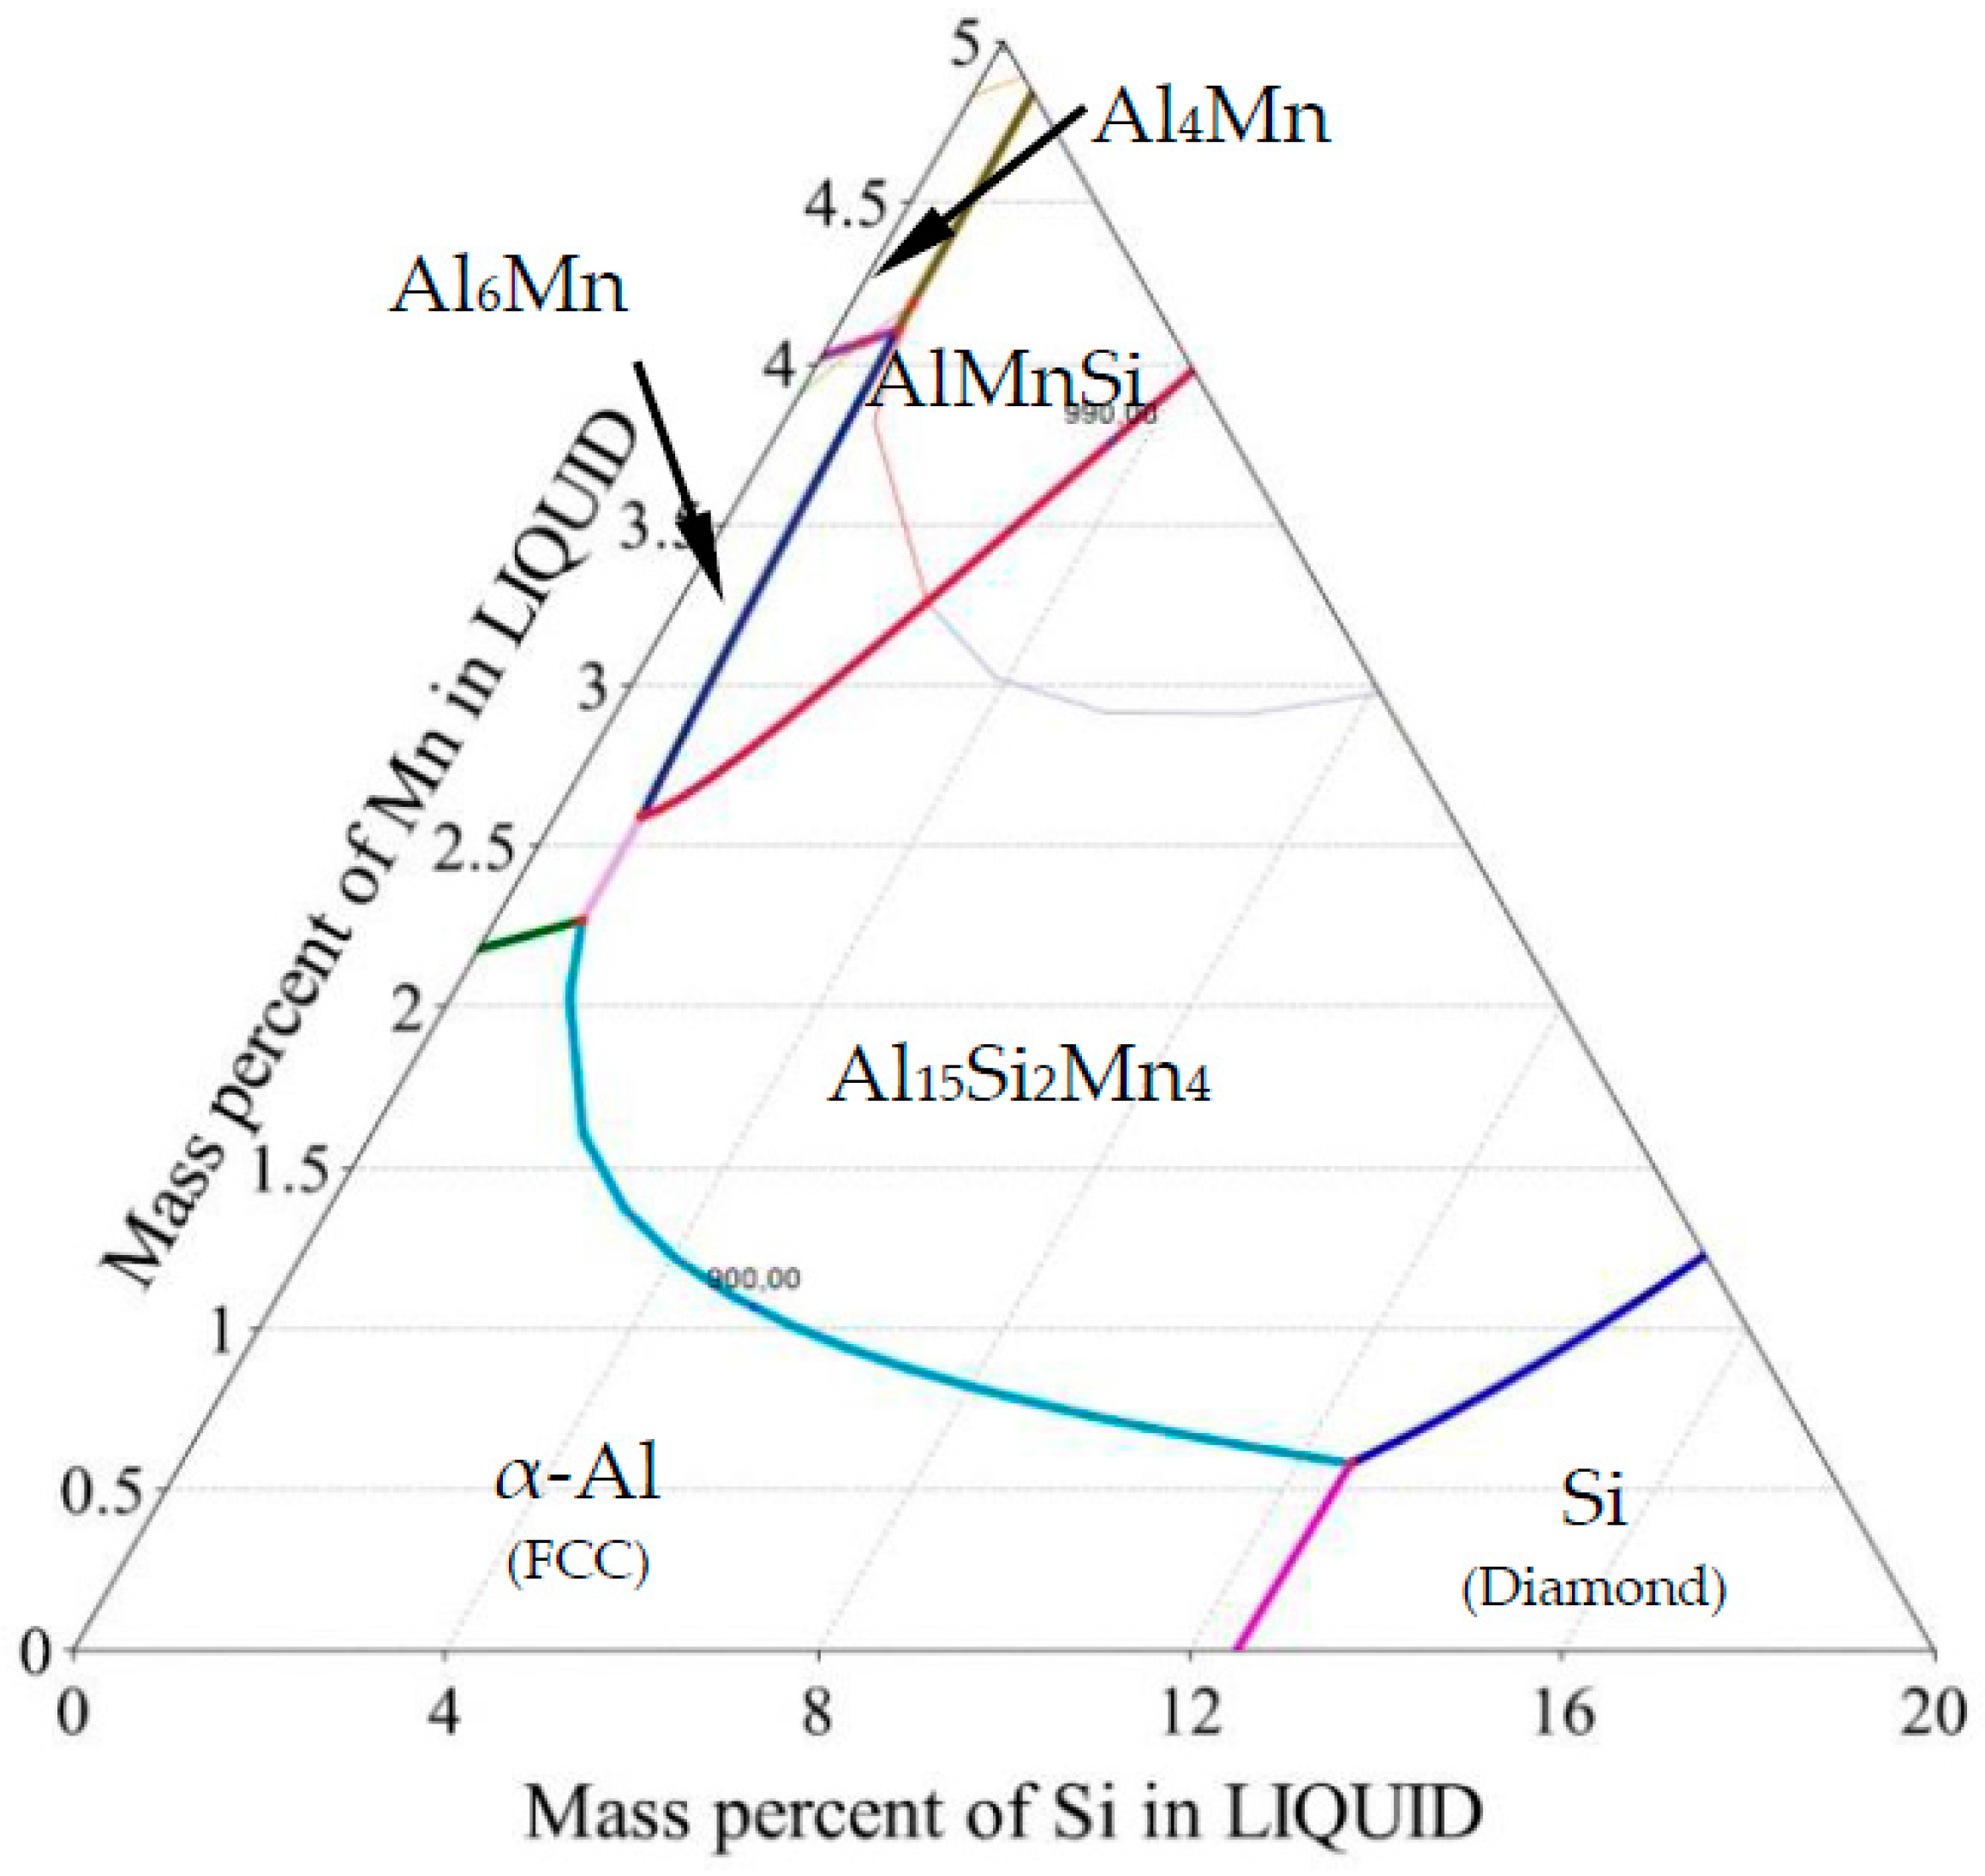
Cast aluminum alloys are industrially important and cost-effective materials due to their low melting point and high strength. The most important cast aluminum alloy system is Al-Si, where silicon (4.0–13%) contributes to good casting properties. Aluminum alloys are widely used in engineering structures and components where lightweight or corrosion resistance is required, especially in the automotive industry. Alloys composed mostly of aluminum have been very important in aircraft and aerospace manufacturing and remain competitive to plastic composites. The microstructure of AlSi alloys consists of α-Al dendrites, Al-Si eutectic and sometimes other phases formed due to the presence of Mn, Fe, Mg, Cu or other elements. Even small amounts of iron in aluminum alloys cause the formation of intermediate Fe-rich phases like the deleterious monoclinic β-Al5FeSi. To prevent this, alloying elements such as Mn, Cr, Mo and Be have been used to replace the acicular β phase with α-Al(Mn,Fe)Si, which has granular or skeleton (or Chinese script) morphology. Especially manganese seems to have great influence on controlling the Fe-rich intermetallics, making the phases that occur in the Al-Si-Mn system of particular importance and interest. The Al-rich region of the Al-Si-Mn phase diagram is shown in Figure 1 and Figure 2 (for all references to color, the reader is referred to the web version of this article).
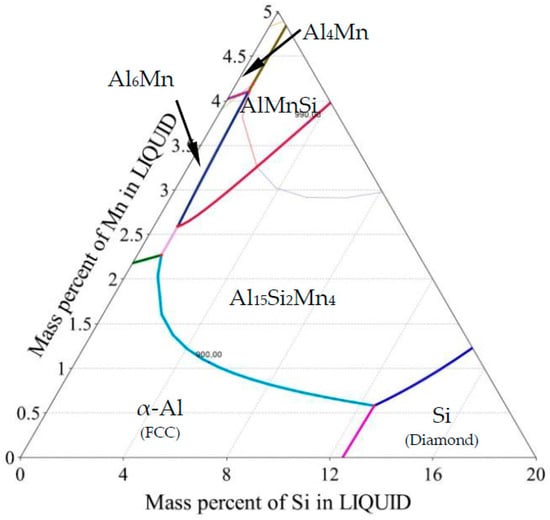
Figure 1.
Ternary phase diagram—Al-Si-Mn system: Liquidus projection of Al rich corner.

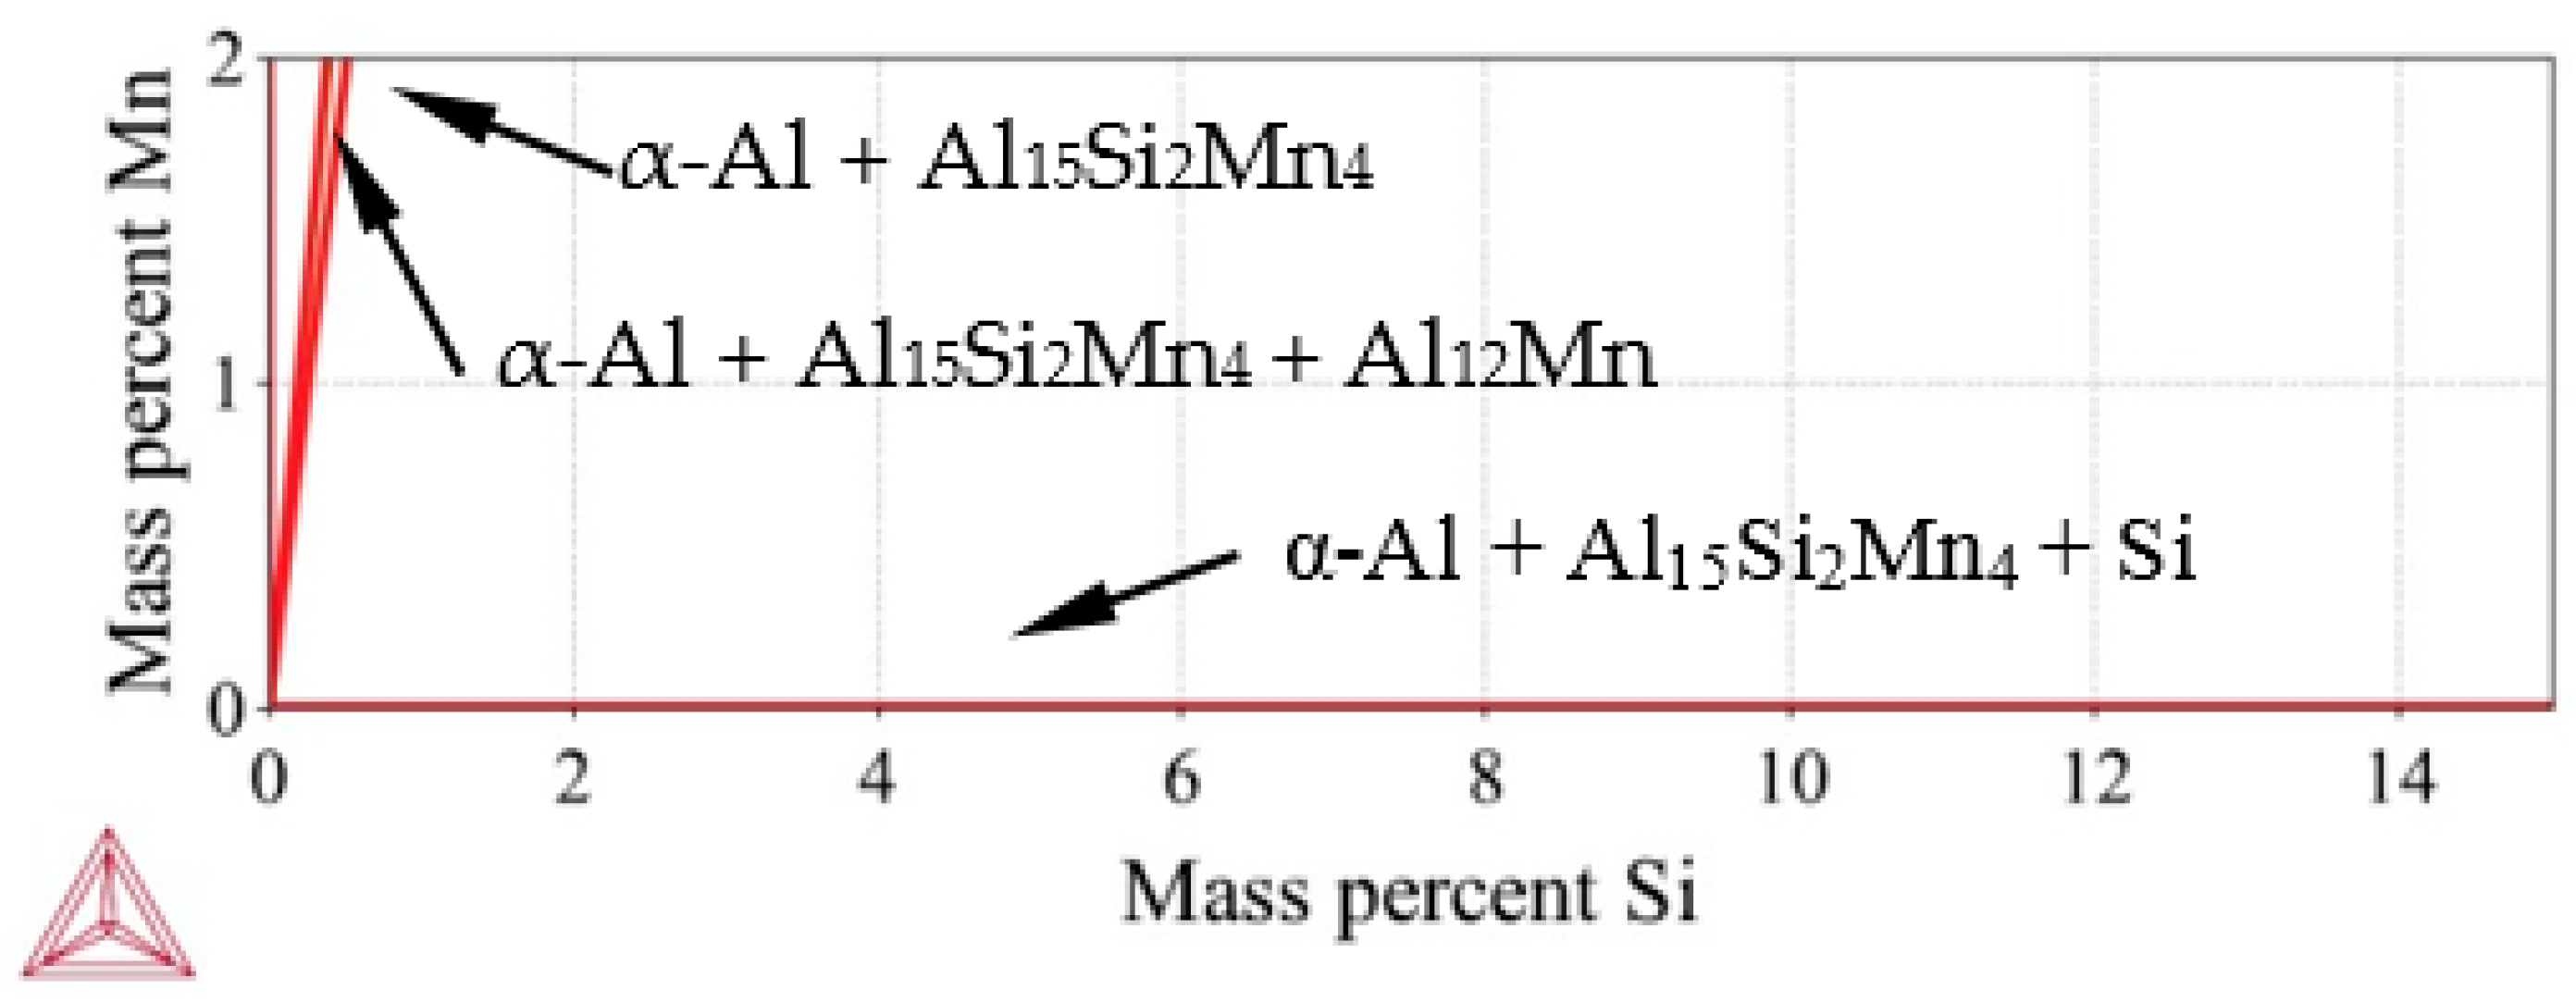
Figure 2.
Ternary phase diagram—Al-Si-Mn system—Isothermal section at 20 °C.
Directional solidification is an important technique for studying alloy behavior, because the solidification velocity and thermal gradient can be controlled independently. It is used to study things like interface evolution, solute redistribution, phase selection and crystal growth instability [6,7]. While the technique of Bridgman-Stockbarger [8,9] is widely known and utilized for directional solidification, another technique, known as the power down method, allows similar control using two controlled heaters. Implementation of this technique using a vacuum chamber and aerogel crucibles provides better control of the solidification process because the transparent aerogel allows for optical monitoring of the solid-liquid interface [10,11,12].
In the current paper, we apply thermodynamic calculations for estimation of the mushy zone and prediction of phase precipitation during directional solidification experiments of AlSi alloys with Mn-rich intermetallics. The software package Thermo-Calc [13] was used for calculation of ternary phase diagrams, Scheil solidification paths, and property diagrams, enabling the creation of 2D maps showing the evolving position of the mushy zone in specific samples.
2. Materials and Methods
To analyze the given Al-Si-Mn alloys, we have applied Thermo-Calc 4.1 [13] software (using the CALPHAD approach) with TCAl3 (TCS Al-based alloys database v.3) and MOBAl3 (TCS Al-alloys mobility database v.3) databases. Thermo-Calc may be used for a wide variety of applications, including the calculation of stable and metastable heterogeneous phase equilibria, amounts of phases and their compositions as a function of temperature and chemistry, phase transformation temperatures such as liquidus and solidus, binary and ternary phase diagrams, isoplethal and isothermal sections for higher order systems, thermochemical data such as enthalpies, heat capacity and activities, driving force for phase transformations, and solidification applying the Scheil-Gulliver model.
For this study, we used hypoeutectic aluminum alloys with 5, 7 and 9 wt % Si and 0.2, 0.4 and 1.0 wt % Mn prepared from pure components: Al (99.999%, Hydro Aluminium Deutschland GmbH, Bonn, Germany), Si (Crystal Growth Laboratory, Berlin, Germany) and Mn (from Manganese Flake 99.95%, Goodfellow Cambridge Ltd., Huntingdon, UK). These specific values of Si and Mn were chosen to reflect the compositions of common industrial alloys. From the given values of Si and Mn, five samples were created and processed for mushy zone analysis, allowing the effect of each element individually to be analyzed across three different samples.
Specimens with 8 mm diameter and 120 mm length were processed in the Artemis-3 facility (German Aerospace Center, Cologne, Germany), which is similar to a Bridgman furnace, in that it allows directional solidification of metal alloys under controlled conditions [10,11,12]. The specimen is contained within a silica aerogel crucible, held between an upper heater and a lower heater equipped with an active cooling system [10,12]. The construction of this furnace allows for solidification with a maximum temperature gradient G = 3 K/mm and solidification velocity in the range v = 0.02–0.12 mm/s. In the current study, specimens were solidified with a temperature gradient G = 3 K/mm and solidification velocity v = 0.04 mm/s in order to allow an extended period of melt stirring to affect the mushy zone. In order to investigate flow effect on the microstructure, fluid flow was induced by three pairs of coils located close to the sample that can yield a rotating magnetic field (RMF) up to 6 mT at a frequency of 50 Hz. Applied stirring with induction B = 6 mT induced first azimuthal flow and additional secondary flows in radial and axial directions [14,15,16] still by laminar flow and produced characteristic microstructure features including enrichment of eutectics or intermetallics in the specimen center. Such structures were previously observed in AlSiMg [17], AlSiCu, [18], AlSiFe [14,19,20,21], Pb-Sn [22], Sn-Cd [23] alloys, where segregation of alloying elements, particular location of phases or modification of dendritic structure might be observed.
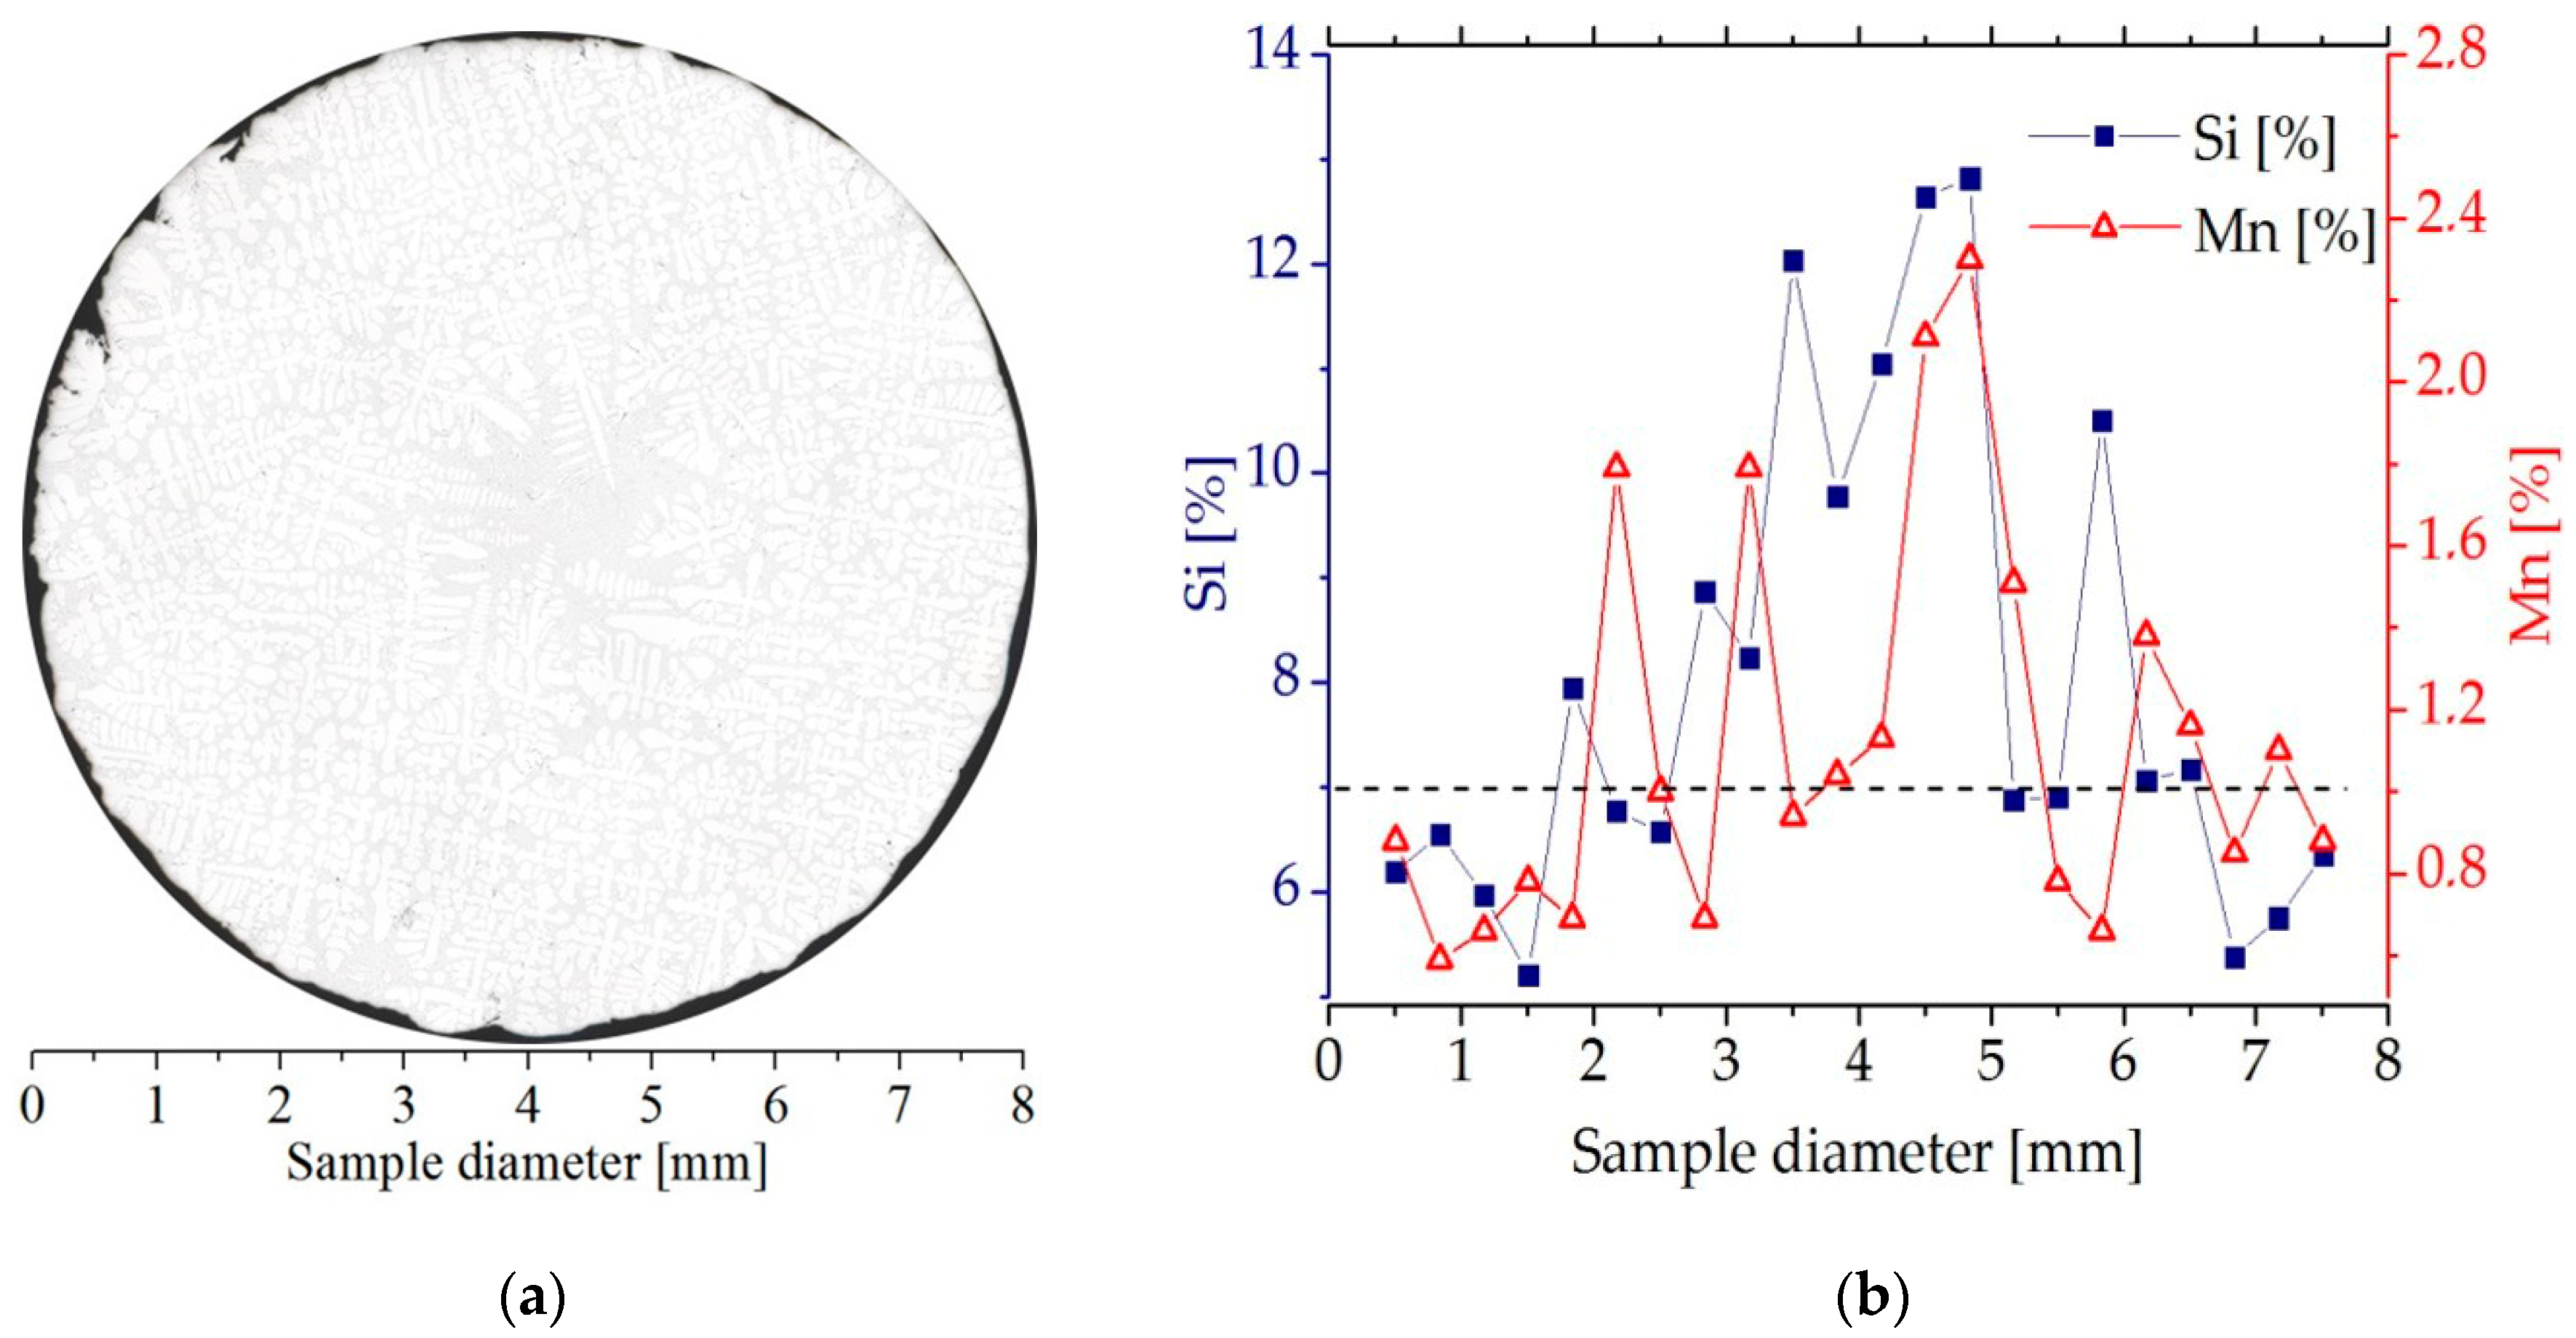
The solidified samples were cut (Isocut 4000, Buehler) at a height of 45 mm from the bottom heater. The coordinate 0 mm on the longitudinal specimen section (Figure 3a) corresponds to this cut, that is, a solidification distance of 45 mm. The composition across each specimen was investigated on a transverse cross-section using EDS (Princeton Gamma-Tech Instruments Inc., Princeton, NJ, USA) in Vega Tescan SEM (Tescan, Brno, Czech Republic). Each scan consisted of 22 points, spaced 0.363 mm apart, as shown in Figure 3b. The samples showed some segregation of the Si and Mn toward the center. This compositional variation is also visible in Figure 3a as an increase in eutectic fraction in the center of the sample.
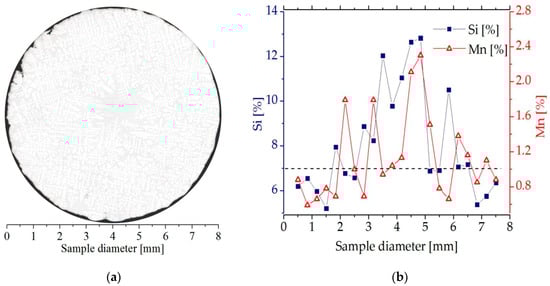
Figure 3.
(a) a microstructure on the cross section of the Al-7 wt % Si-1.0 wt % Mn specimen solidified under influence of a rotating magnetic field (G = 3 K/mm, v = 0.04 mm/s, B = 6 mT); (b) silicon and manganese concentration profile on the Al-7 wt % Si-1.0 wt % Mn specimen (G = 3 K/mm, v = 0.04 mm/s, B = 6 mT).
In the current study, we made use of five specimens with compositions AlSi5Mn0.2, AlSi5Mn0.4 AlSi5Mn1.0, AlSi7Mn1.0 and AlSi9Mn1.0, all solidified with induced flow (with RMF). The chemical compositions measured on various cross-sections were located on the Al-Si-Mn phase diagram and treated as potentially solidifying alloys within the specimens. For selected compositions, the solidification paths were calculated in Thermo-Calc using the assumption of Scheil-Gulliver solidification. Application of the Scheil equation, which assumes no diffusion in the solid and complete mixing in the liquid, is common in directional solidification, and the additional mixing of the liquid due to the RMF makes it particularly appropriate for these samples. The solidification paths calculated in Thermo-Calc allow us to identify possible solidification outcomes (that is, the precipitation order of predicted phases and their compositions) for various positions within each sample. For example, for the AlSi5Mn0.4 specimen shown in Figure 3b, the compositions AlSi3.49Mn0.44 (at position 0.5 mm) and AlSi5.15Mn0.23 (at position 4.1 mm) were analyzed. The compositions were chosen to present the most extreme differences in solidification behavior.
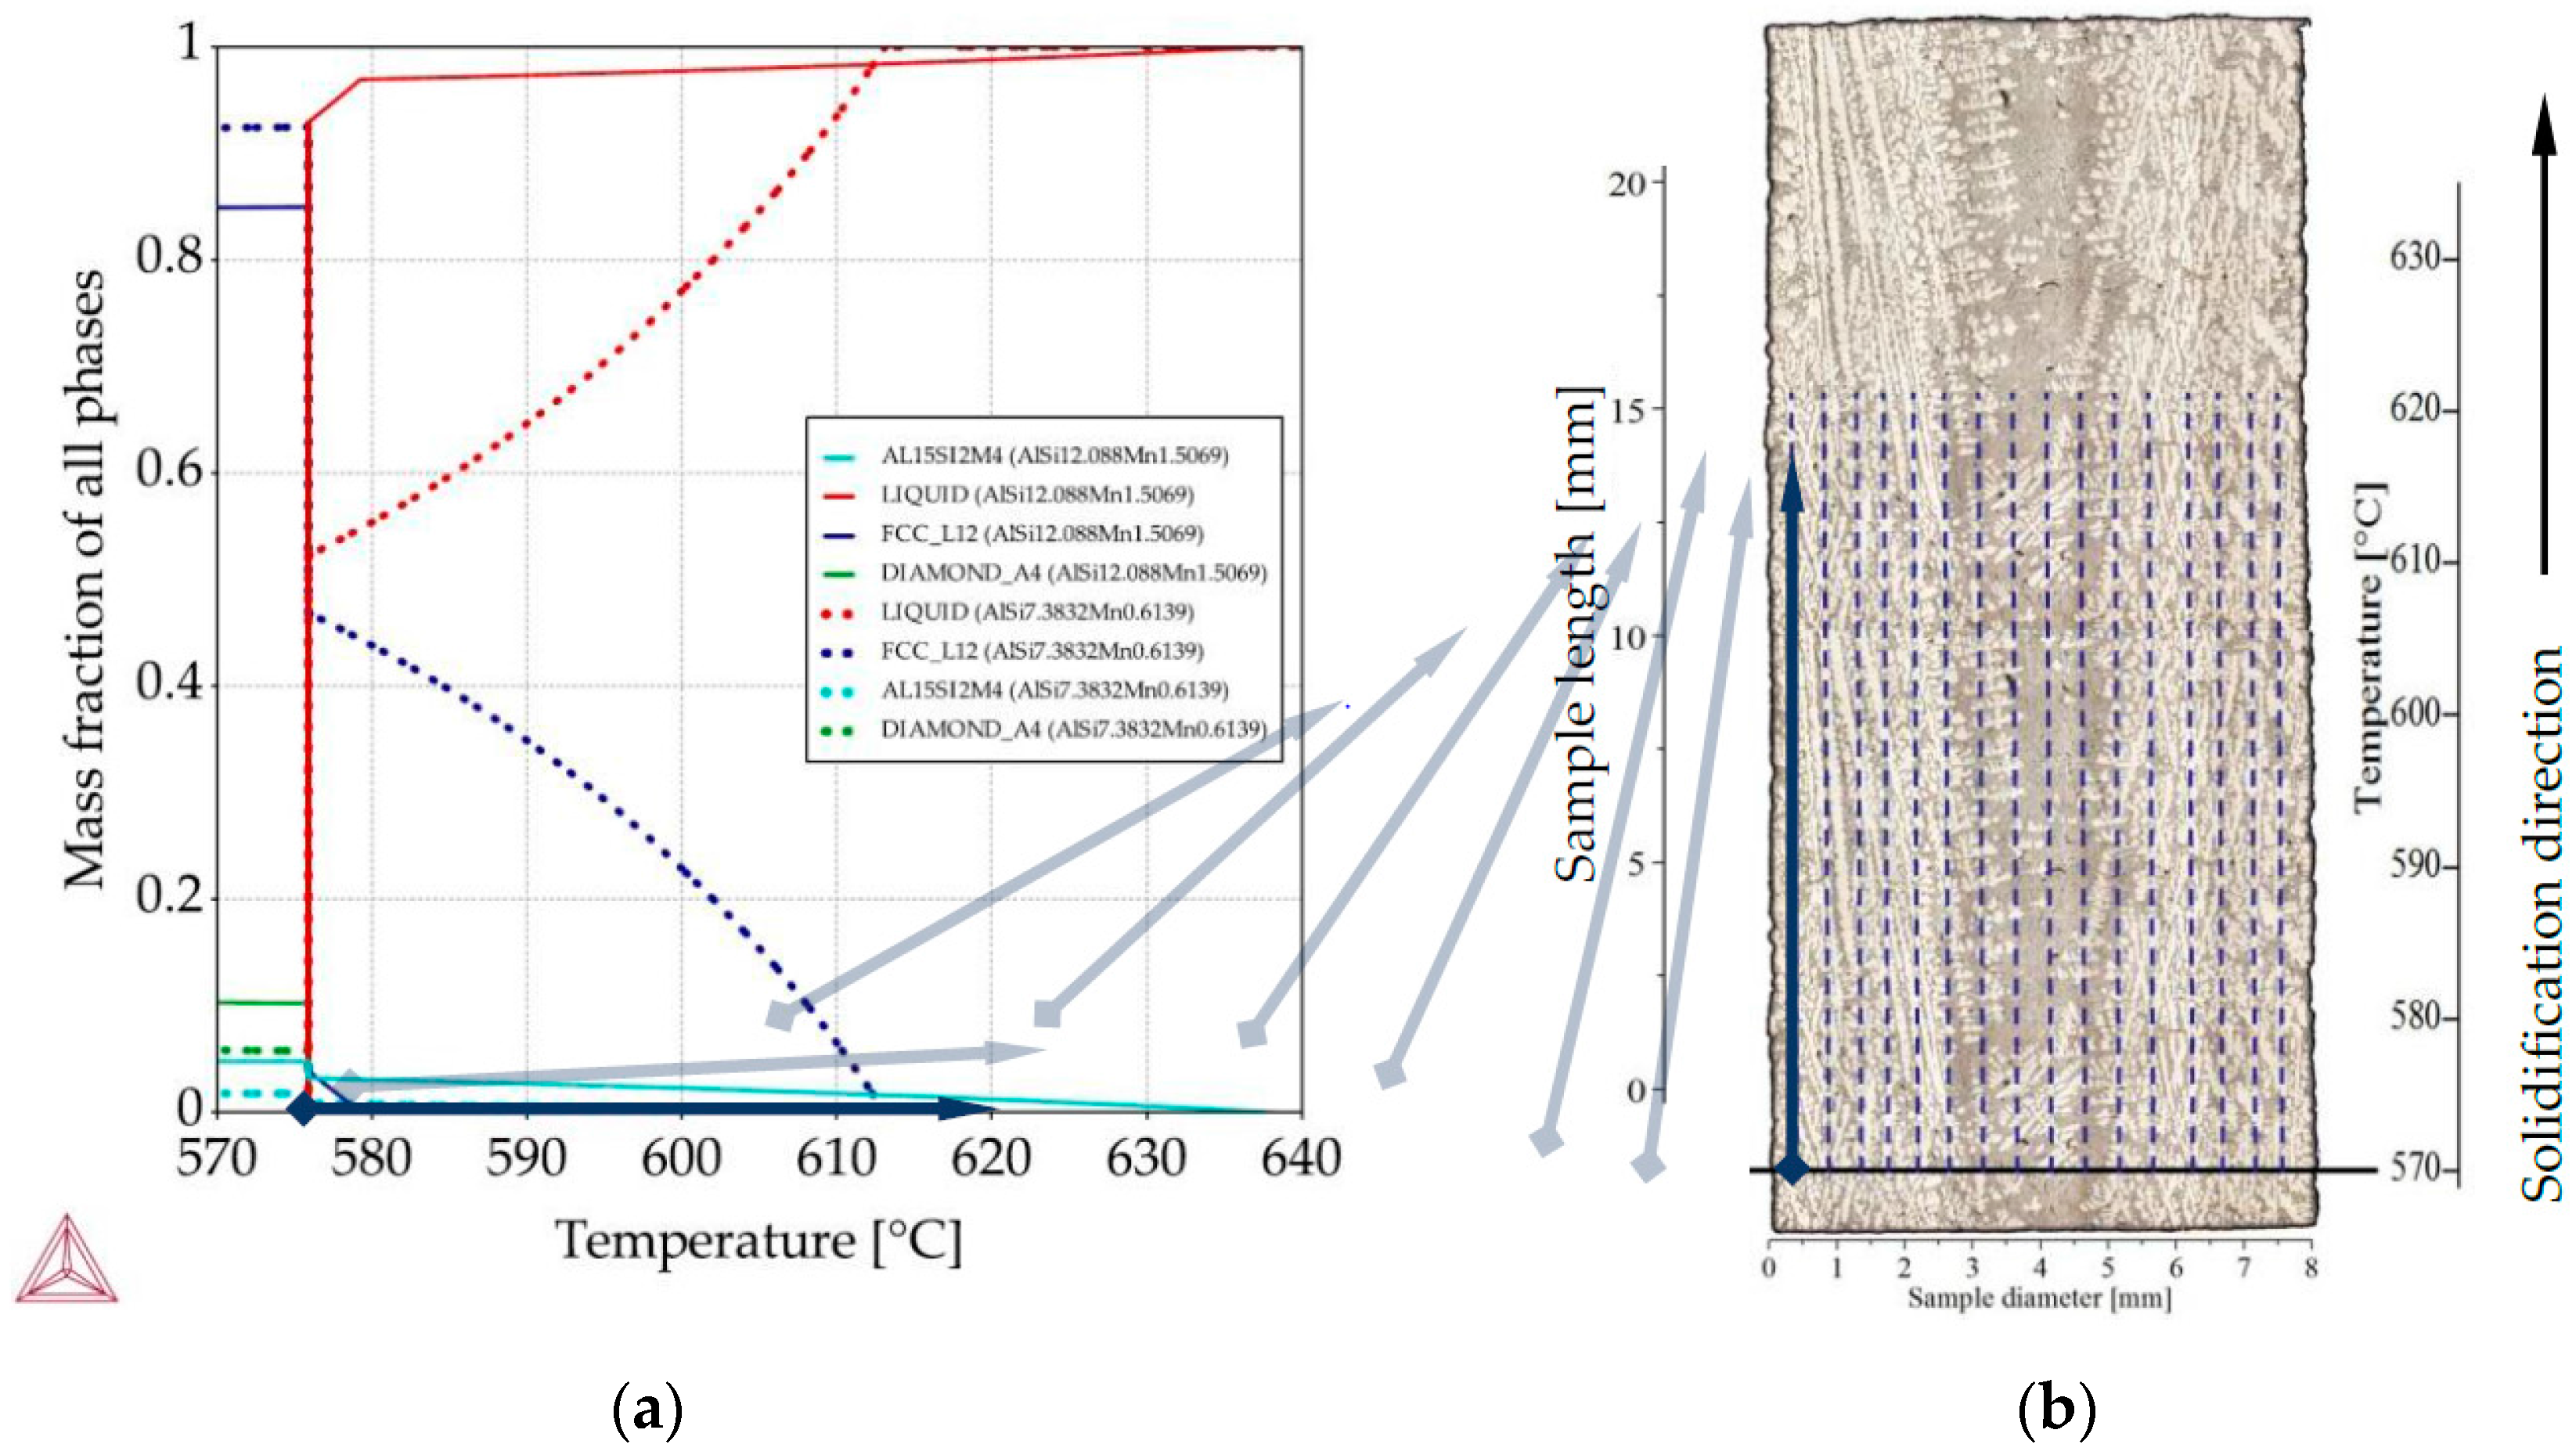
For all twenty-two measured compositions on all five specimens, Thermo-Calc “property diagrams” were calculated, which provide the precipitation sequence and mass fraction of phases as a function of decreasing temperature. Taking each of the twenty-two points as if it were an independent alloy, the calculated property diagrams were assigned a position (along the diameter) on the longitudinal section, as showed by “flying” light blue arrows on Figure 4. Because the EDS measurements enclosed the rectangle areas with dimensions about 0.36 mm, by distances between them 0.36 too, it seemed applicable to assign data from property diagrams into suitable 0.36 m wide areas. The data from the “property diagram” for chosen composition (an independent alloy) were transformed using graphical software, from charts into 0.36 wide belts and placed with spacing (0.36 mm) equal measuring interval. Transformation from temperature into length was based on linear temperature field supported by slow solidification velocity 0.04 mm/s. It would, of course, also be possible to apply a nonlinear temperature field, gained e.g., from thermal macro-scale modeling, and produce the same type of plots. For each specimen, the property diagrams were used to prepare 2D maps showing the mass fraction (of liquid, α-Al dendrites, Al15Si2Mn4) as a function of location on the longitudinal section and temperature (or length) of phase precipitation (Figure 4). The controlled solidification conditions (consistent, known temperature gradient and velocity) in Artemis-3 allowed for rescaling the temperature axis into a length axis, showing in this way 2D maps of the mushy zone as function of position within the sample, both across the diameter and along the solidification direction.
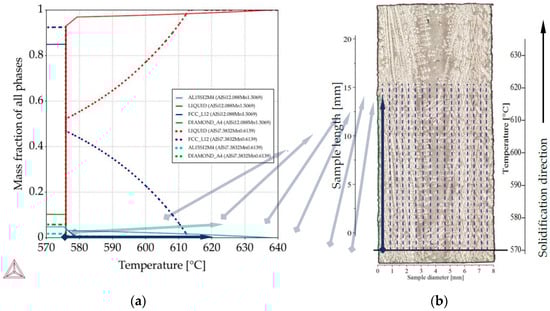
Figure 4.
Methodology of 2D maps construction based on property diagrams. Blue arrow shows the transformation of temperature axis from property diagram onto longitudinal section and its placement along sample length in specified places along sample diameter: (a) property diagram for AlSi9Mn1.0 specimen, for places with chemical composition AlSi12.08Mn1.50 and AlSi7.38Mn0.61; (b) longitudinal section with marked sites (dashed lines) for mass fraction placement.
The ternary phase diagram shown in Figure 5 is a liquidus projection generated in Thermo-Calc with temperature range 550–900 °C and interval 2 °C. Scheil solidification was calculated with temperature interval 1 °C and mass fraction interval 0.005. Property diagrams (Figures 6–13) were generated by temperature interval 2 °C and mass fraction interval 0.017–0.059 for liquid and α-Al, and 0.00017–0.00148 for Al15Si2Mn4.
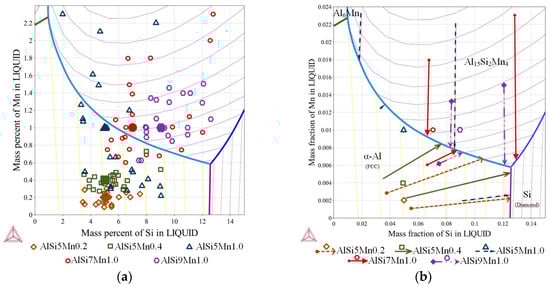
Figure 5.
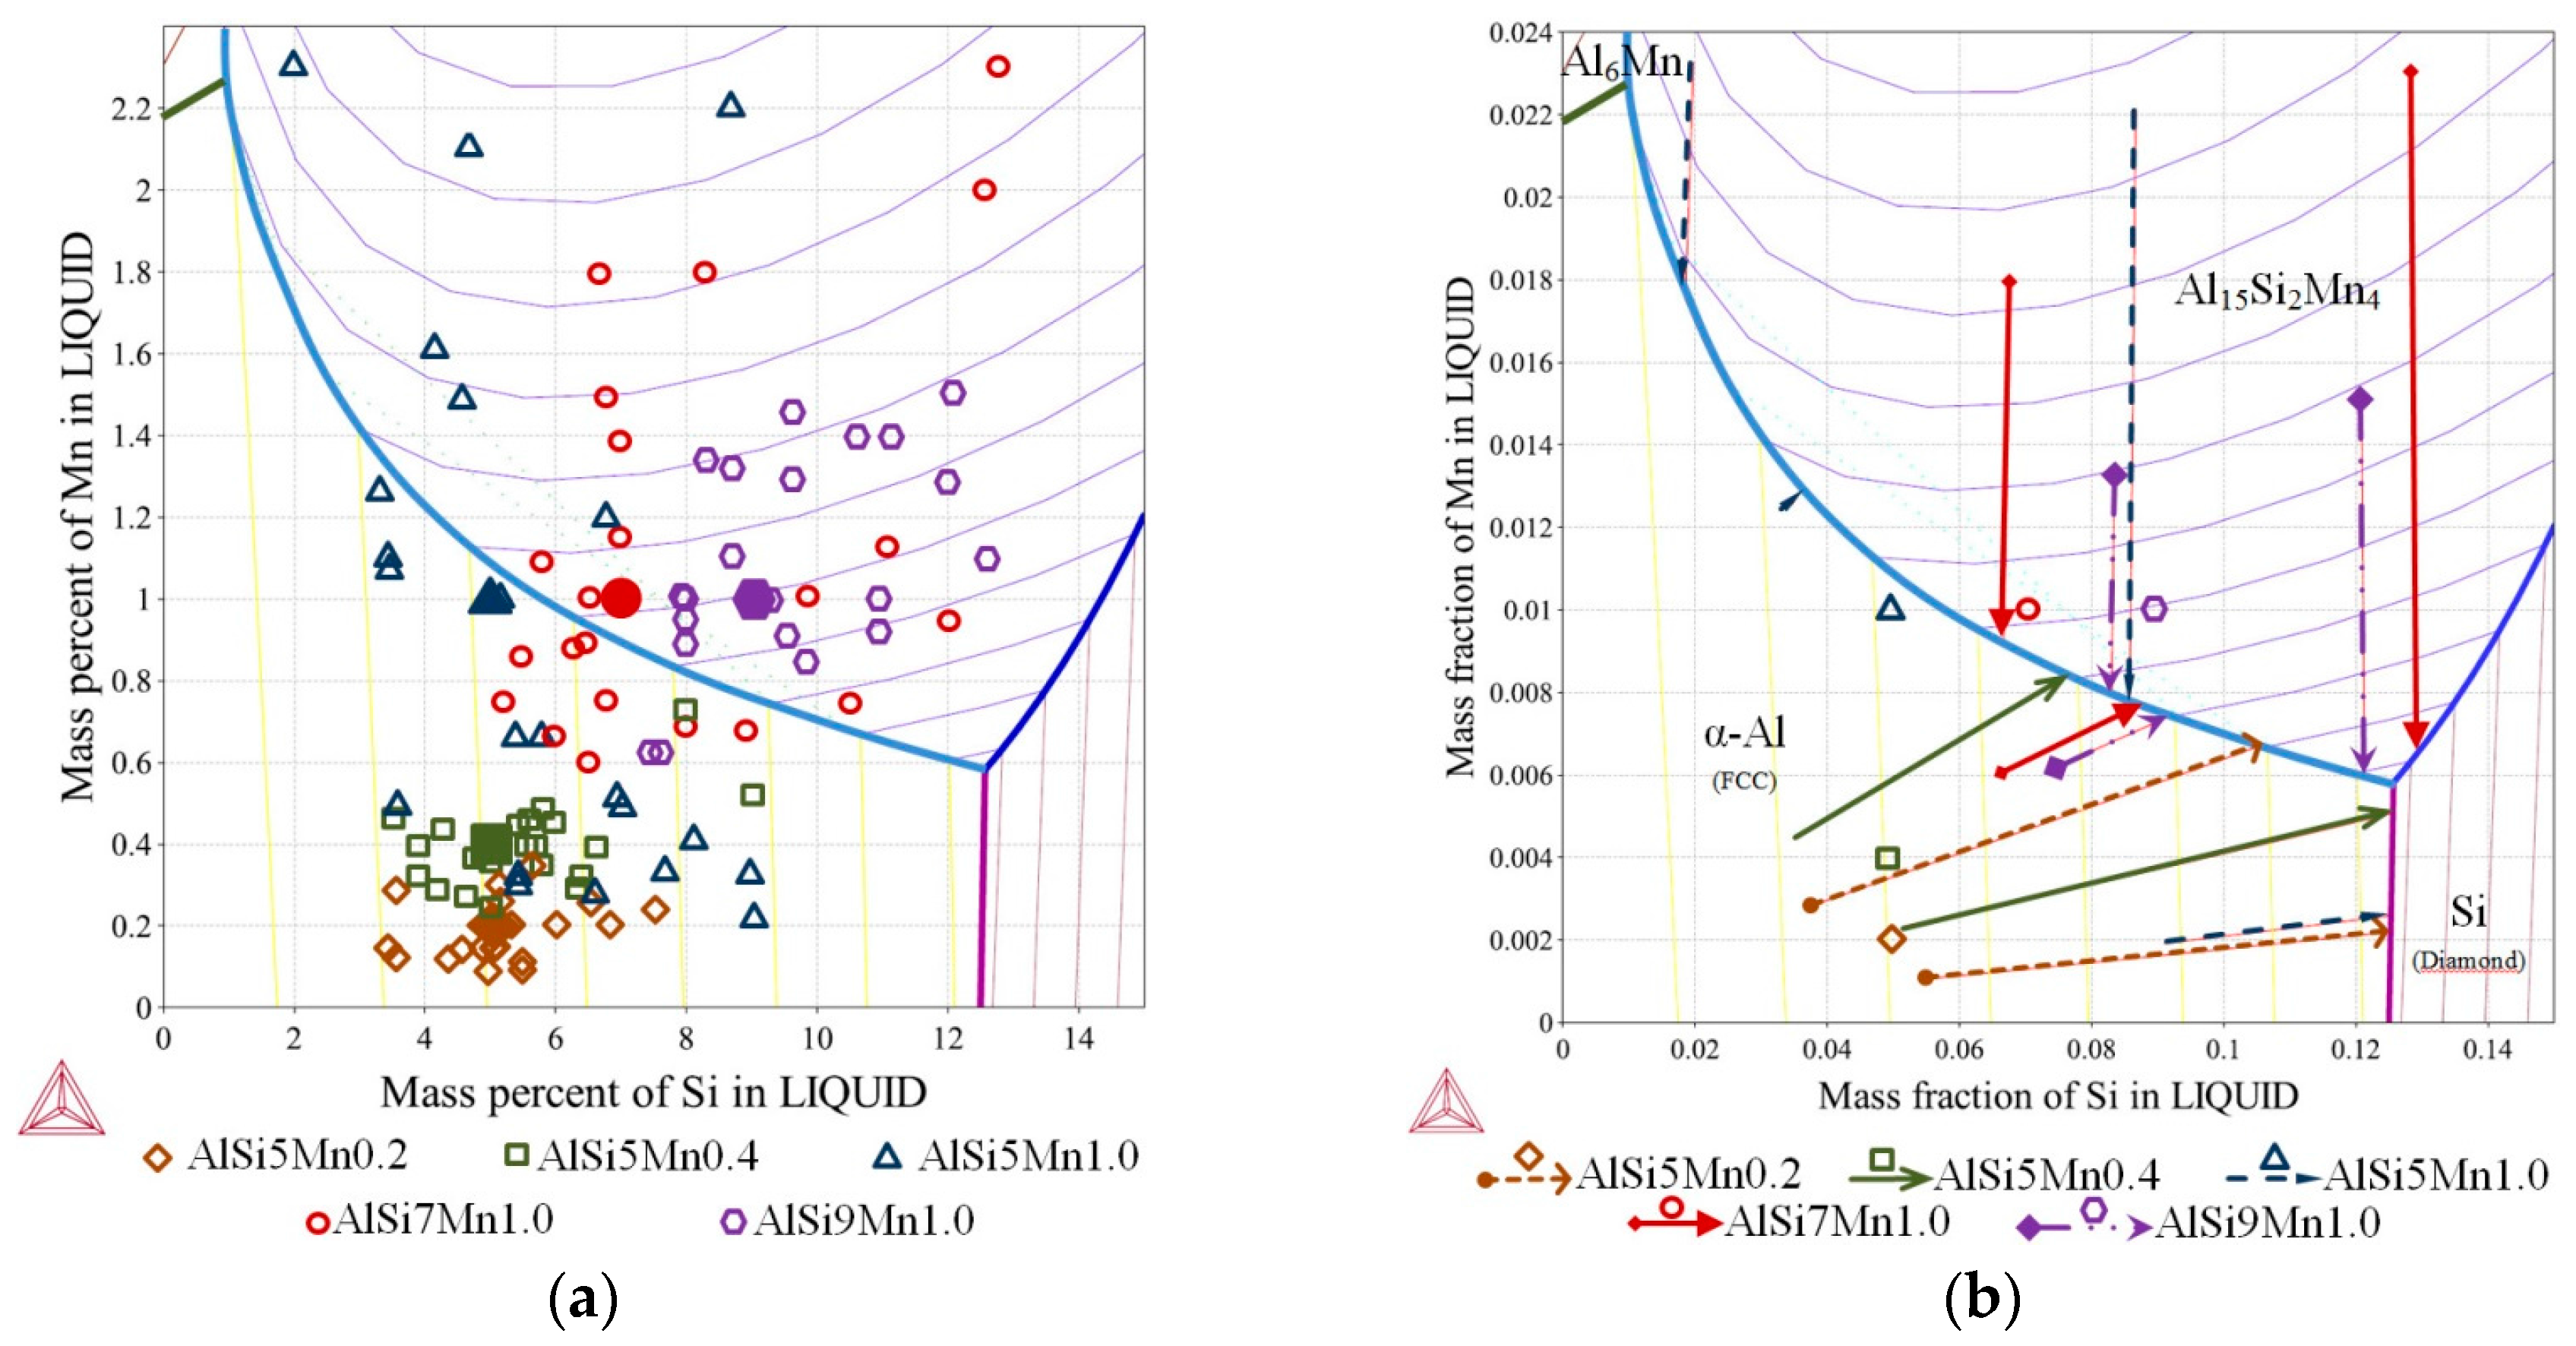
Ternary phase diagram—Al-Si-Mn system: (a) liquidus projection with marked chemical compositions measured on the specimens in selected twenty-two points (as on Figure 3b); (b) liquidus projection with marked solidification paths (Scheil-Gulliver solidification).
3. Results
The specimens with nominal compositions AlSi5Mn0.2, AlSi5Mn0.4, AlSi5Mn1.0, AlSi7Mn1.0 and AlSi9Mn1.0 solidified directionally in Artemis-3 with fluid flow (generated by RMF) were precisely examined. The chemical compositions measured on the cross-sections were located on the phase diagram together with solidification paths for selected compositions. For all measured points on the cross-sections, the phase precipitation and mushy zone were investigated using Thermo-Calc property diagrams and 2D maps were created.
3.1. Solidification Paths
For the five nominal compositions, Thermo-Calc was used to determine the solidification paths, which are given in Table 1. In each case, the alloys follow the same general order of solidification reactions. First, a primary phase appears which has a different composition than the liquid. As the primary phase freezes out, the composition of the liquid moves toward one of the three binary eutectic grooves. When the liquid reaches the eutectic groove, a two-phase eutectic begins to form. Note that, in ternary alloys, binary eutectics can occur over a range of temperatures and compositions. The composition of the remaining liquid moves down the eutectic groove to the invariant ternary eutectic point, where the final liquid will freeze as a three-phase eutectic solid.

Table 1.
Calculated solidification paths for investigated alloys. All compositions given in weight percent.
For AlSi5Mn0.2 specimen (Figure 5b, nominal composition Al-5wt % Si-0.2wt % Mn marked with brown rhombus), first, α-Al forms at 902.4 K (629.4 °C). On further cooling, the melt enriches up to 12.46 wt % Si and 0.45 wt % Fe and reaches the eutectic valley at 849.1 K (576.1 °C), where the AlSi-eutectic forms L → α-Al + Si + L. Next solidification follows until 848.9 K (575.9 °C), where the final ternary eutectic reaction L → α-Al + Al15Si2Mn4 + Si occurs at composition 12.55 wt % Si and 0.59 wt % Mn. Segregation in the sample caused departure from this solidification path, and two possible alternate solidification paths, based on measured composition variation, are given on the figure as dashed brown arrows.
For AlSi7Mn1.0 specimen (Figure 5b, nominal composition Al-7wt % Si-1.0wt % Mn marked with red circile), first, Al15Si2Mn4 forms at 895.5 K (622.5 °C) according to L → Al15Si2Mn4 + L. On further cooling, the solidification path reaches the eutectic groove at 888.4 K (615.4 °C) at the point with 6.99 wt % Si and 0.90 wt % Mn, where the Al15Si2Mn4 and α-Al starts to form according to L → α-Al + Al15Si2Mn4 + L and follows the eutectic groove until 848.9 K (575.9 °C), where the final ternary eutectic reaction L → α-Al + Al15Si2Mn4 + Si occurs. In this specimen, possible alternate solidification paths are indicated with red arrows.
It is clear from the table and Figure 5b that small composition changes in this region of the phase diagram can produce marked changes in the solid phases that appear. For the three compositions with 5 wt % Si, α-Al is the primary phase. For the two compositions with more silicon, Al15Si2Mn4 is the first phase to form. In AlSi5Mn0.2, the binary eutectic is the expected L → α-Al + Si, whereas, in all other sampled alloys, the binary eutectic is L → α-Al + Al15Si2Mn4. In each alloy, the final formation of the ternary eutectic is the same.
As described in Section 2, fluid flow generated during solidification caused segregation across the diameter of the samples. The various chemical compositions measured across the five samples (22 points each) are mapped onto the liquidus surface of the ternary phase diagram in Figure 5a. Each shape/color represents one sample; the larger, solid markers indicate the nominal composition. For selected compositions, the solidification paths were determined (Figure 5b), which sometimes differ substantially from the paths for the nominal compositions described above.
On the specimen with nominal composition, AlSi5Mn0.2 (marked as brown rhombus, Figure 5a), the measured compositions are all located in the α-Al region, so that α-Al dendrites form as the primary phase. For most of the 22 measured compositions, for this sample, AlSi-eutectic grew as the second phase, although for four points, Al-Al15Si2Mn4 formed the binary eutectic. The α-Al was again the primary phase for the AlSi5Mn0.4 specimen (marked as green squares), but, in this sample, Al15Si2Mn4 was predicted as the binary eutectic for most regions of the sample. As the lower green arrow shows in Figure 5b, three regions of this sample varied in composition enough that the solidification path fell along the Al-Si binary eutectic groove. However, the measured composition variation for both of these samples was relatively limited.
The three specimens with nominally 1.0% Mn all showed (Figure 5a) much larger variations in composition. For nominal alloy composition AlSi5Mn1.0 (blue triangles), 16 of 22 measurement points, α-Al was the primary phase, while Al15Si2Mn4 was first in the other six points. Two of these points in the primary α-Al region had such high levels of silicon that Si was the second phase to appear, forming Al-Si eutectic regions. The specimen AlSi7Mn1.0 (red circles) also showed large variations in composition, with 13 points where Al15Si2Mn4 precipitated first and nine where α-Al formed as first. There are also two points with extremely high concentrations of both Si and Mn where the Al15Si2Mn4 primary phase was followed by a Si-Al15Si2Mn4 eutectic, a combination found in none of the other measured compositions. Finally, on the specimen with nominal composition AlSi9Mn1.0 (violet octagons), the measured compositions remain mostly in the Al15Si2Mn4 primary region, although two points had low enough Si and Mn to be slightly across the border into the primary α-Al region.
3.2. Property Diagrams
Property diagrams (Figure 6, Figure 7 and Figure 8) presenting mass fraction of growing phases as a function of the temperature were calculated for selected compositions as described above. For each diagram, one composition is depleted in Si and enriched in Mn (solid lines) compared to the nominal composition, while the other is enriched in Si and depleted in Mn (dashed lines). The precise compositions of each point are given on the figures. The solidification paths shown as the arrows on Figure 5b were obtained from Scheil-Gulliver calculations and agree with these property diagrams.
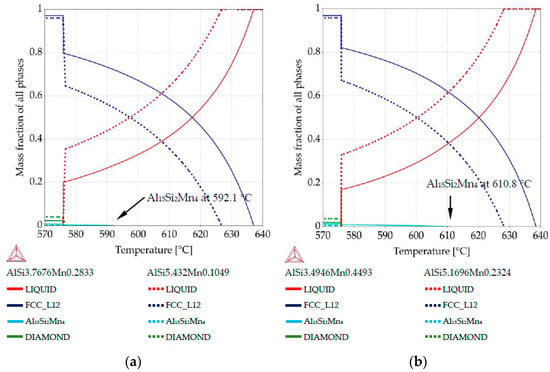
Figure 6.
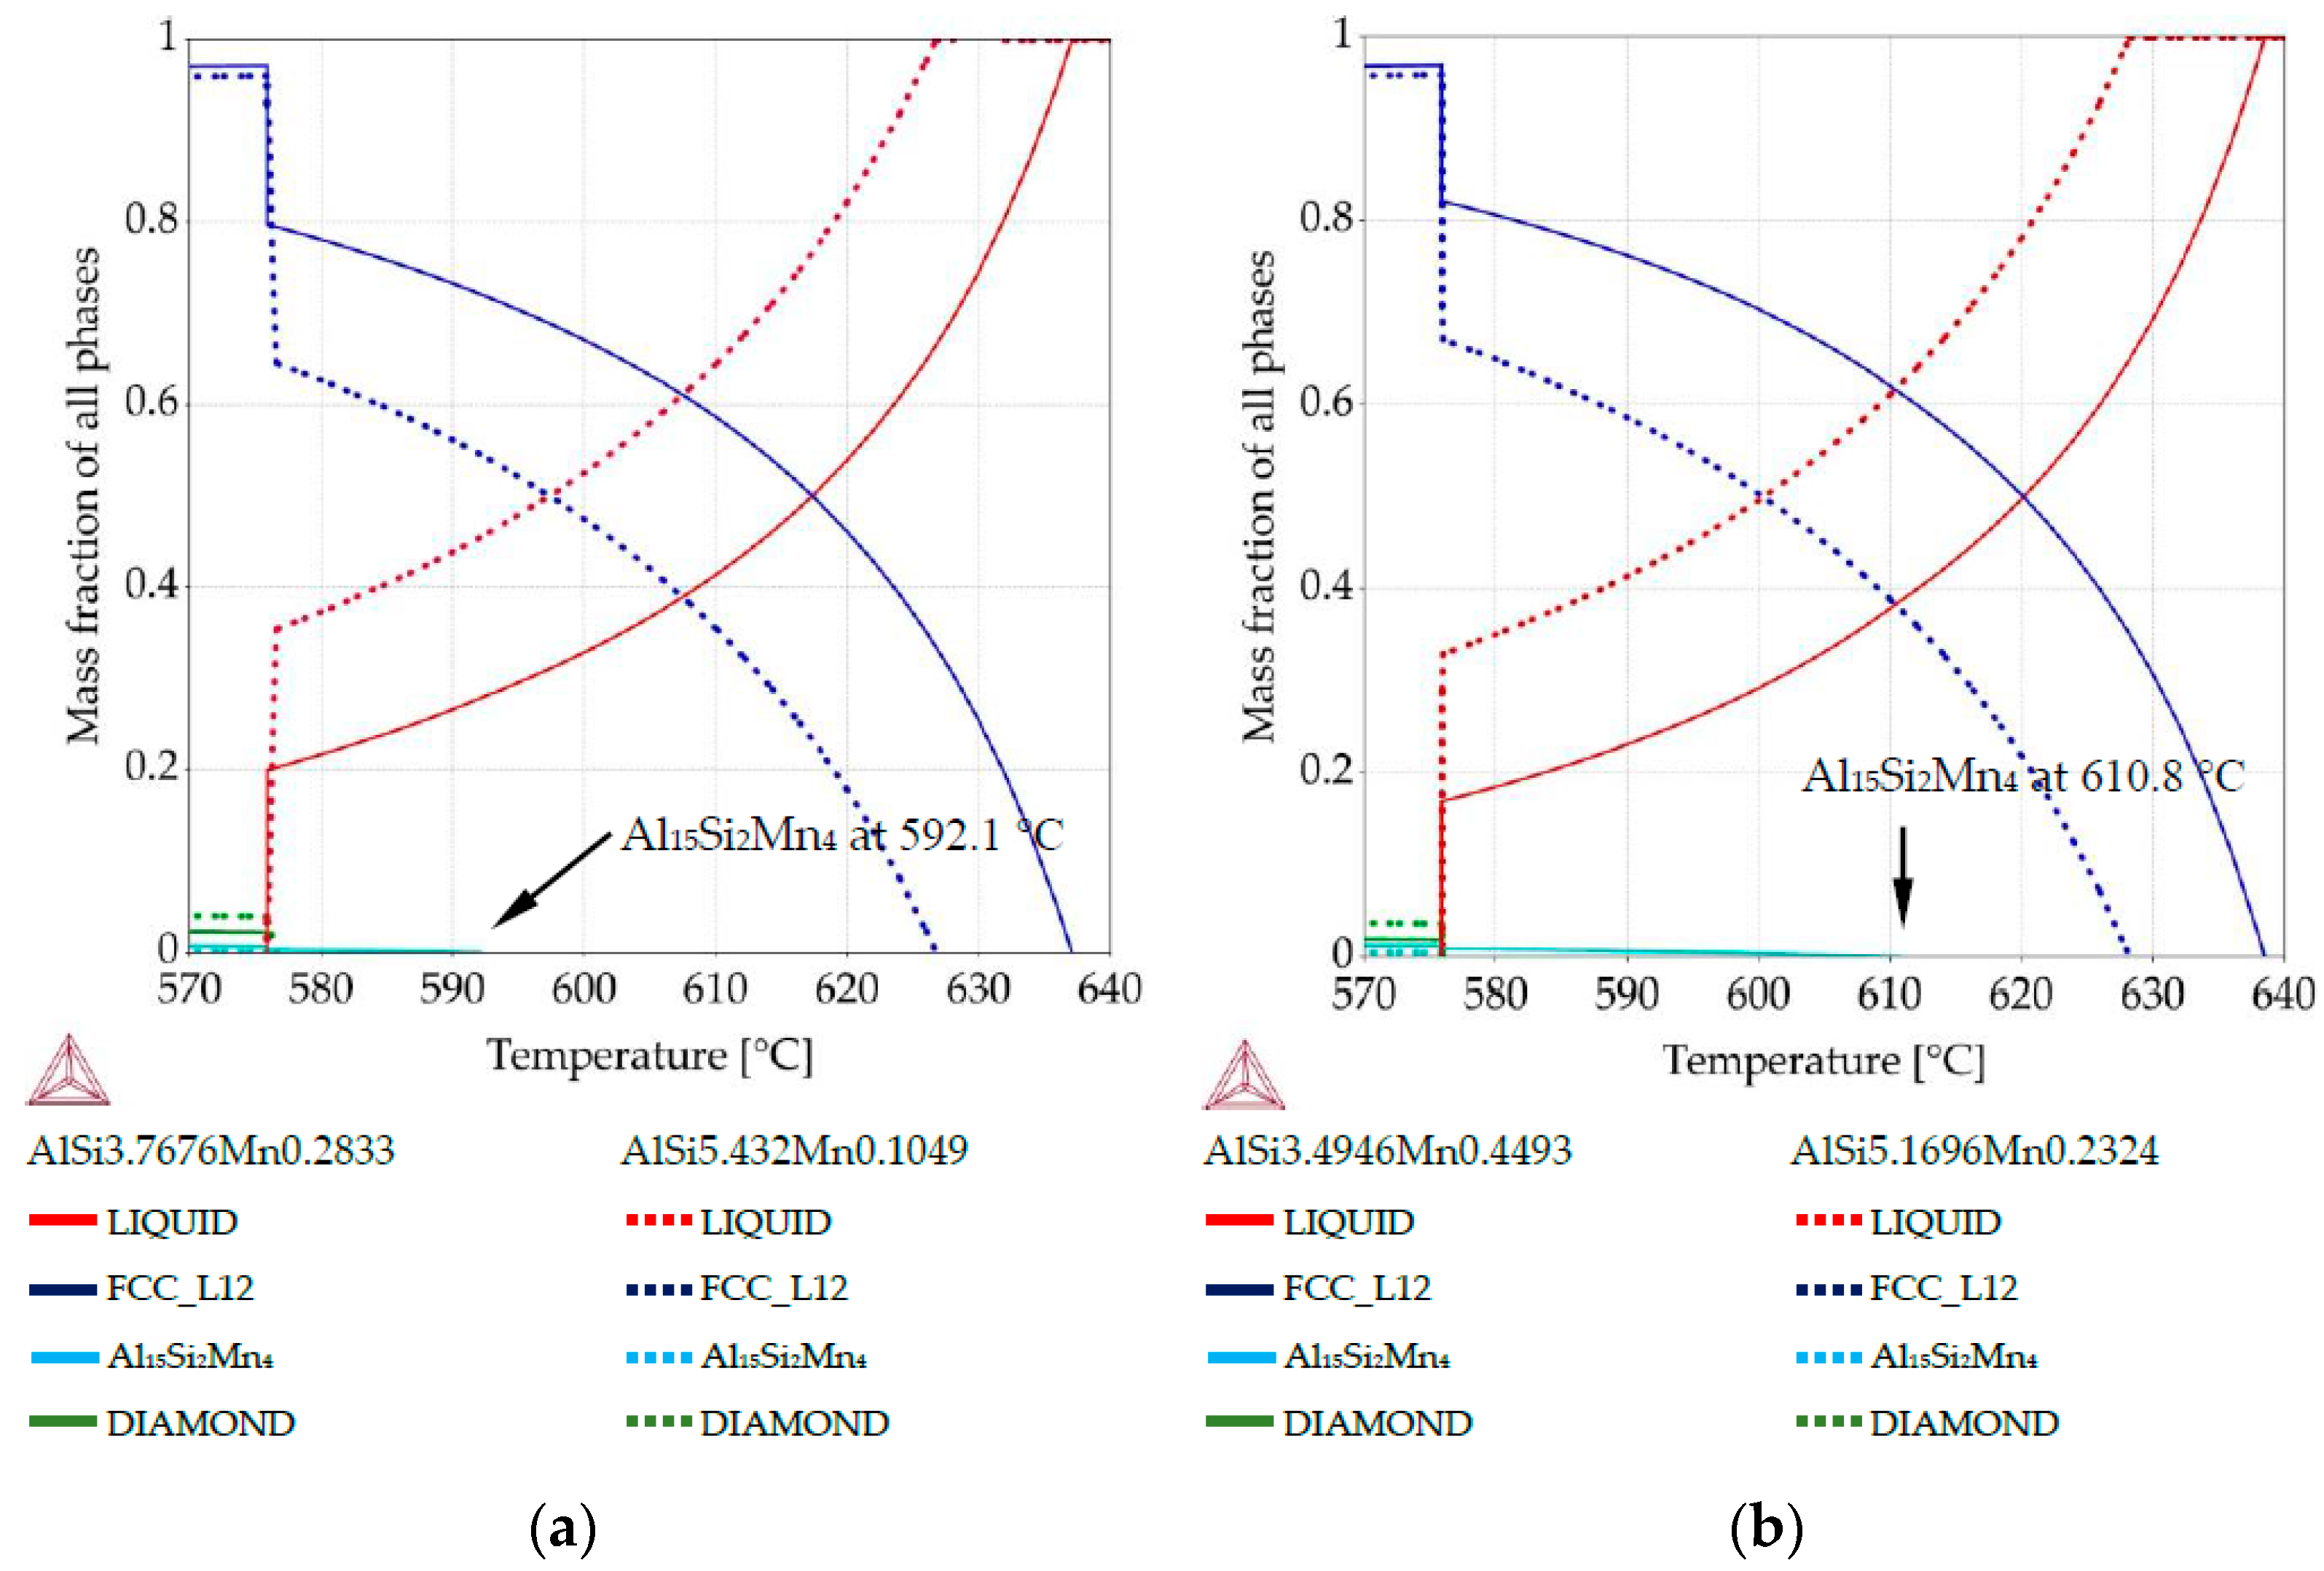
Property diagrams: (a) property diagram for AlSi5Mn0.2 specimen, for places with chemical composition AlSi3.76Mn0.28 and AlSi5.43Mn0.10; (b) property diagram for AlSi5Mn0.4 specimen, for places with chemical composition AlSi3.49Mn0.44 and AlSi5.16Mn0.23.
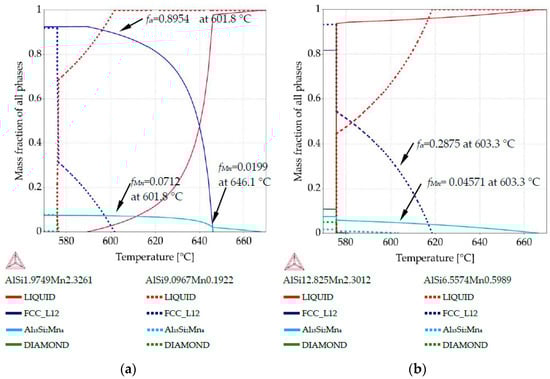
Figure 7.
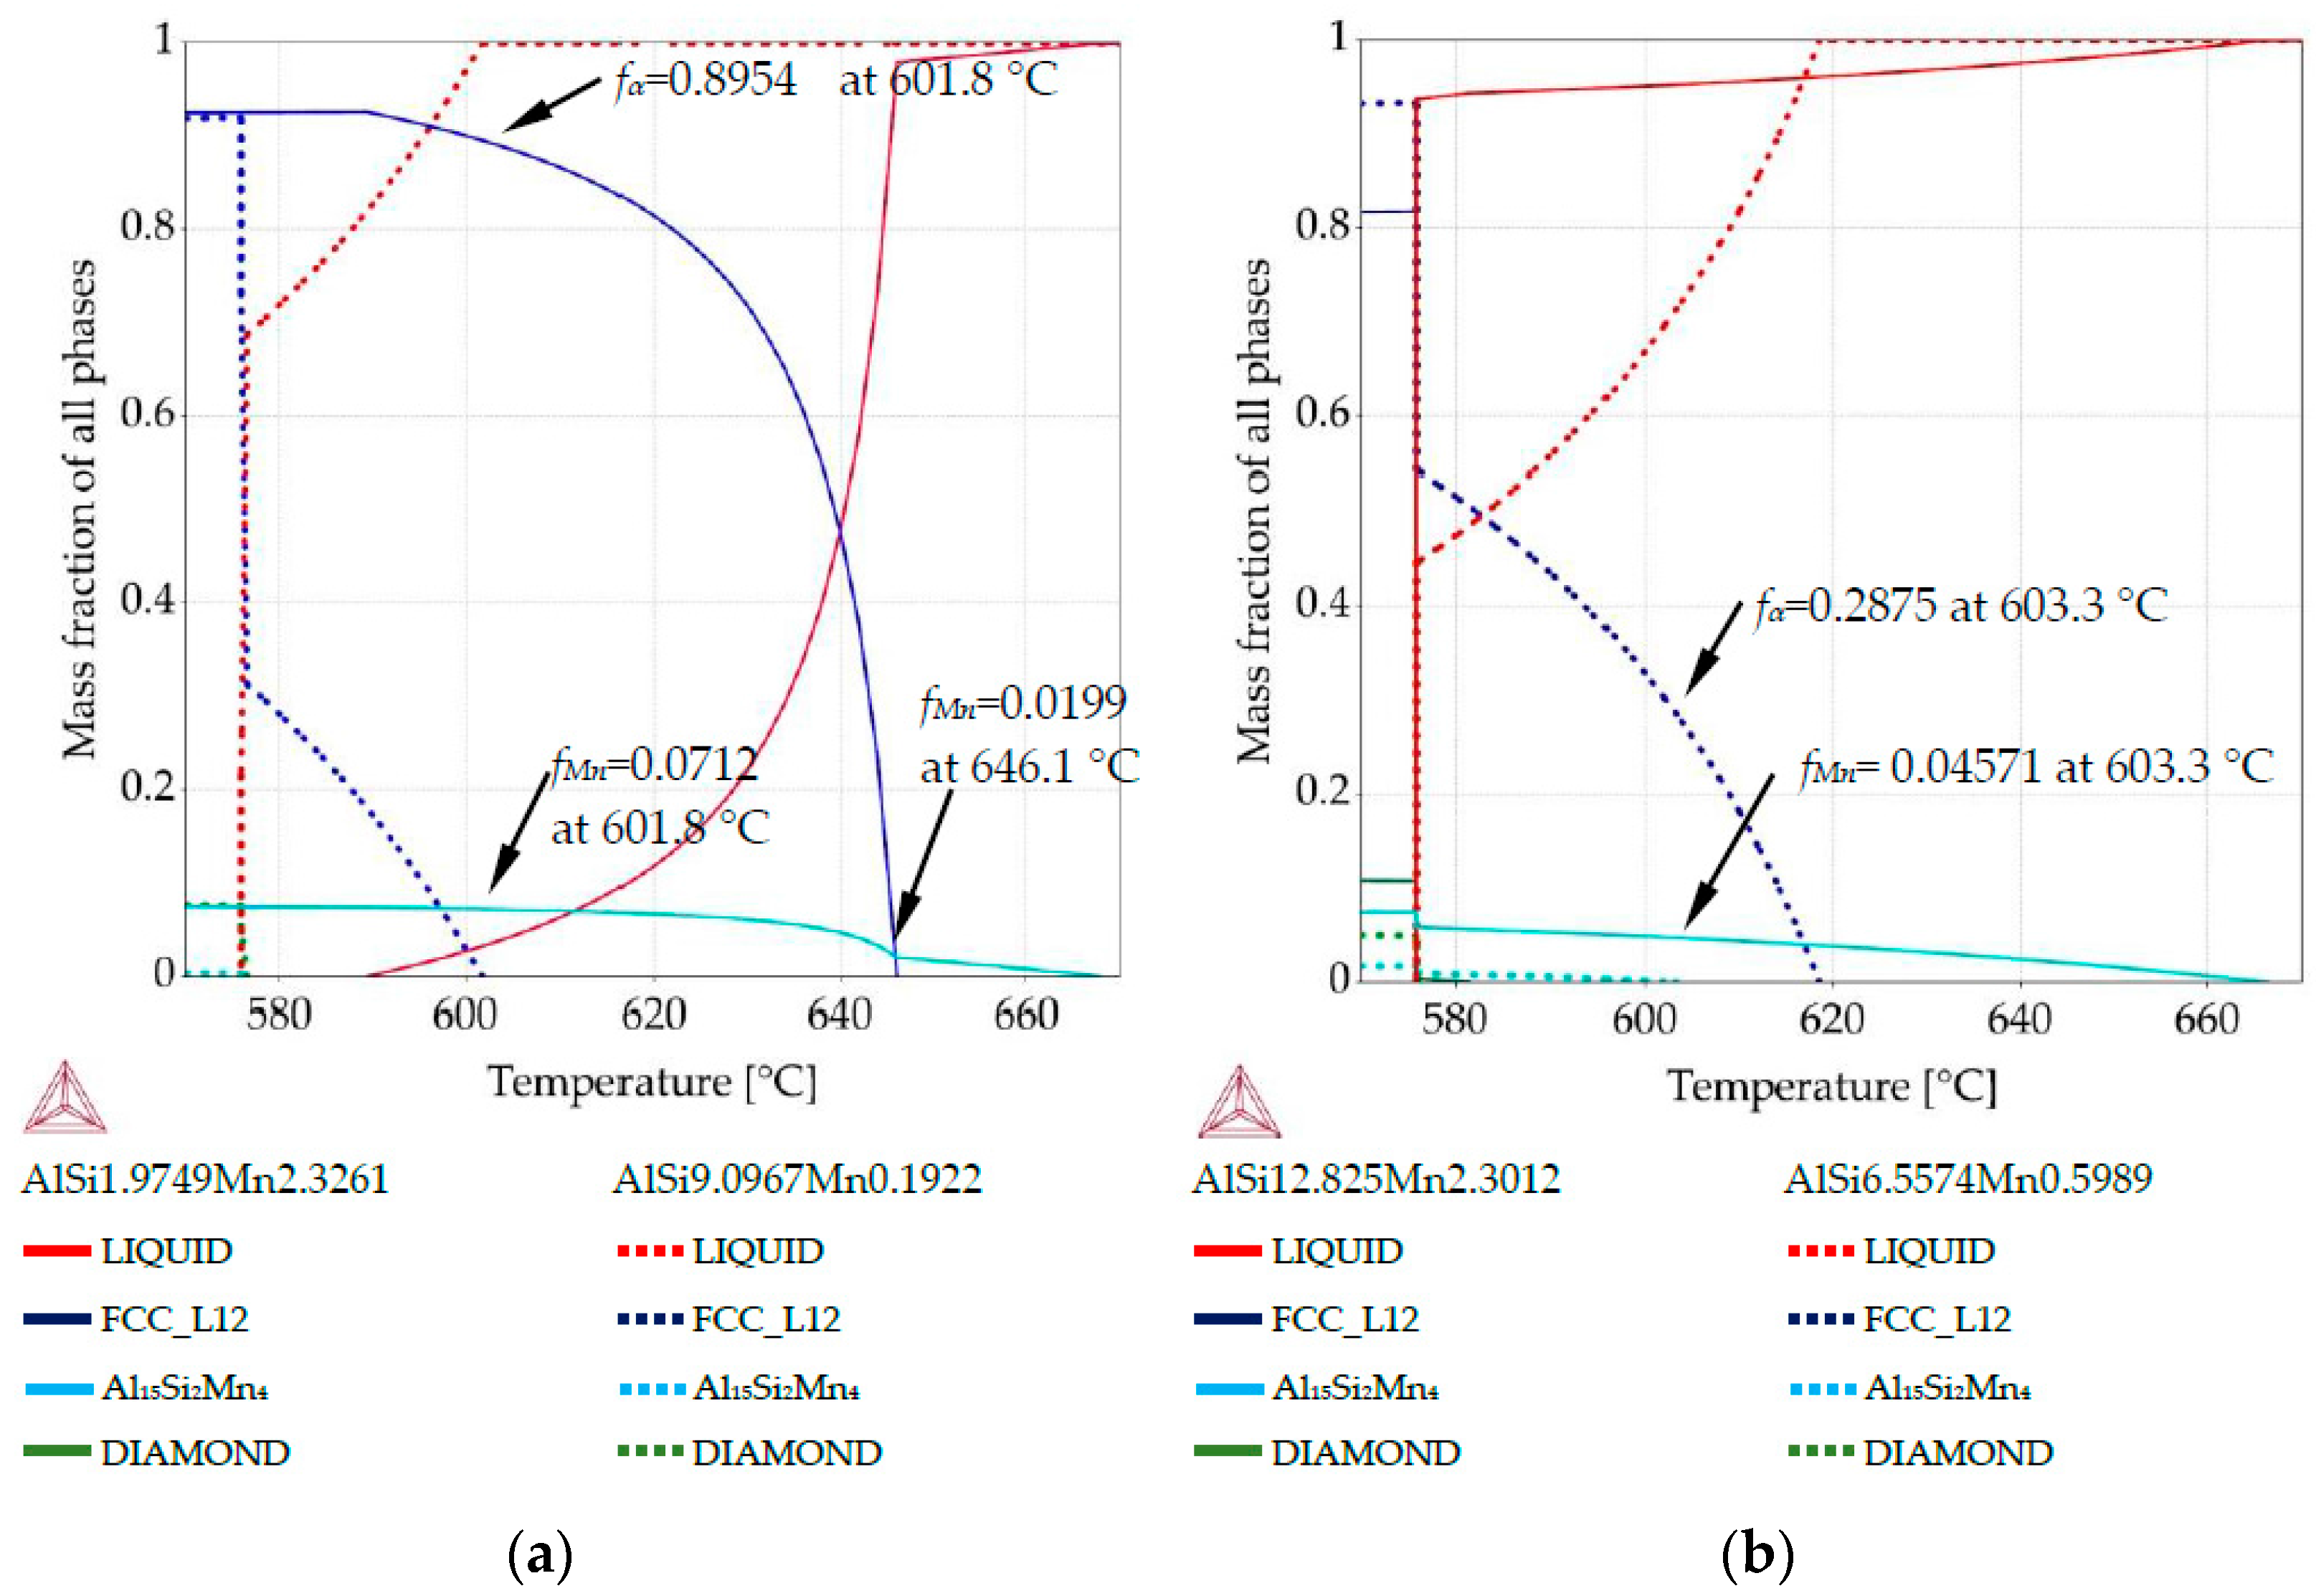
Property diagrams: (a) property diagram for AlSi5Mn1.0 specimen, for places with chemical composition AlSi1.97Mn2.32 and AlSi9.09Mn0.19; (b) property diagram for AlSi7Mn1.0 specimen, for places with chemical composition AlSi12.82Mn2.30 and AlSi6.55Mn0.59.

Figure 8.
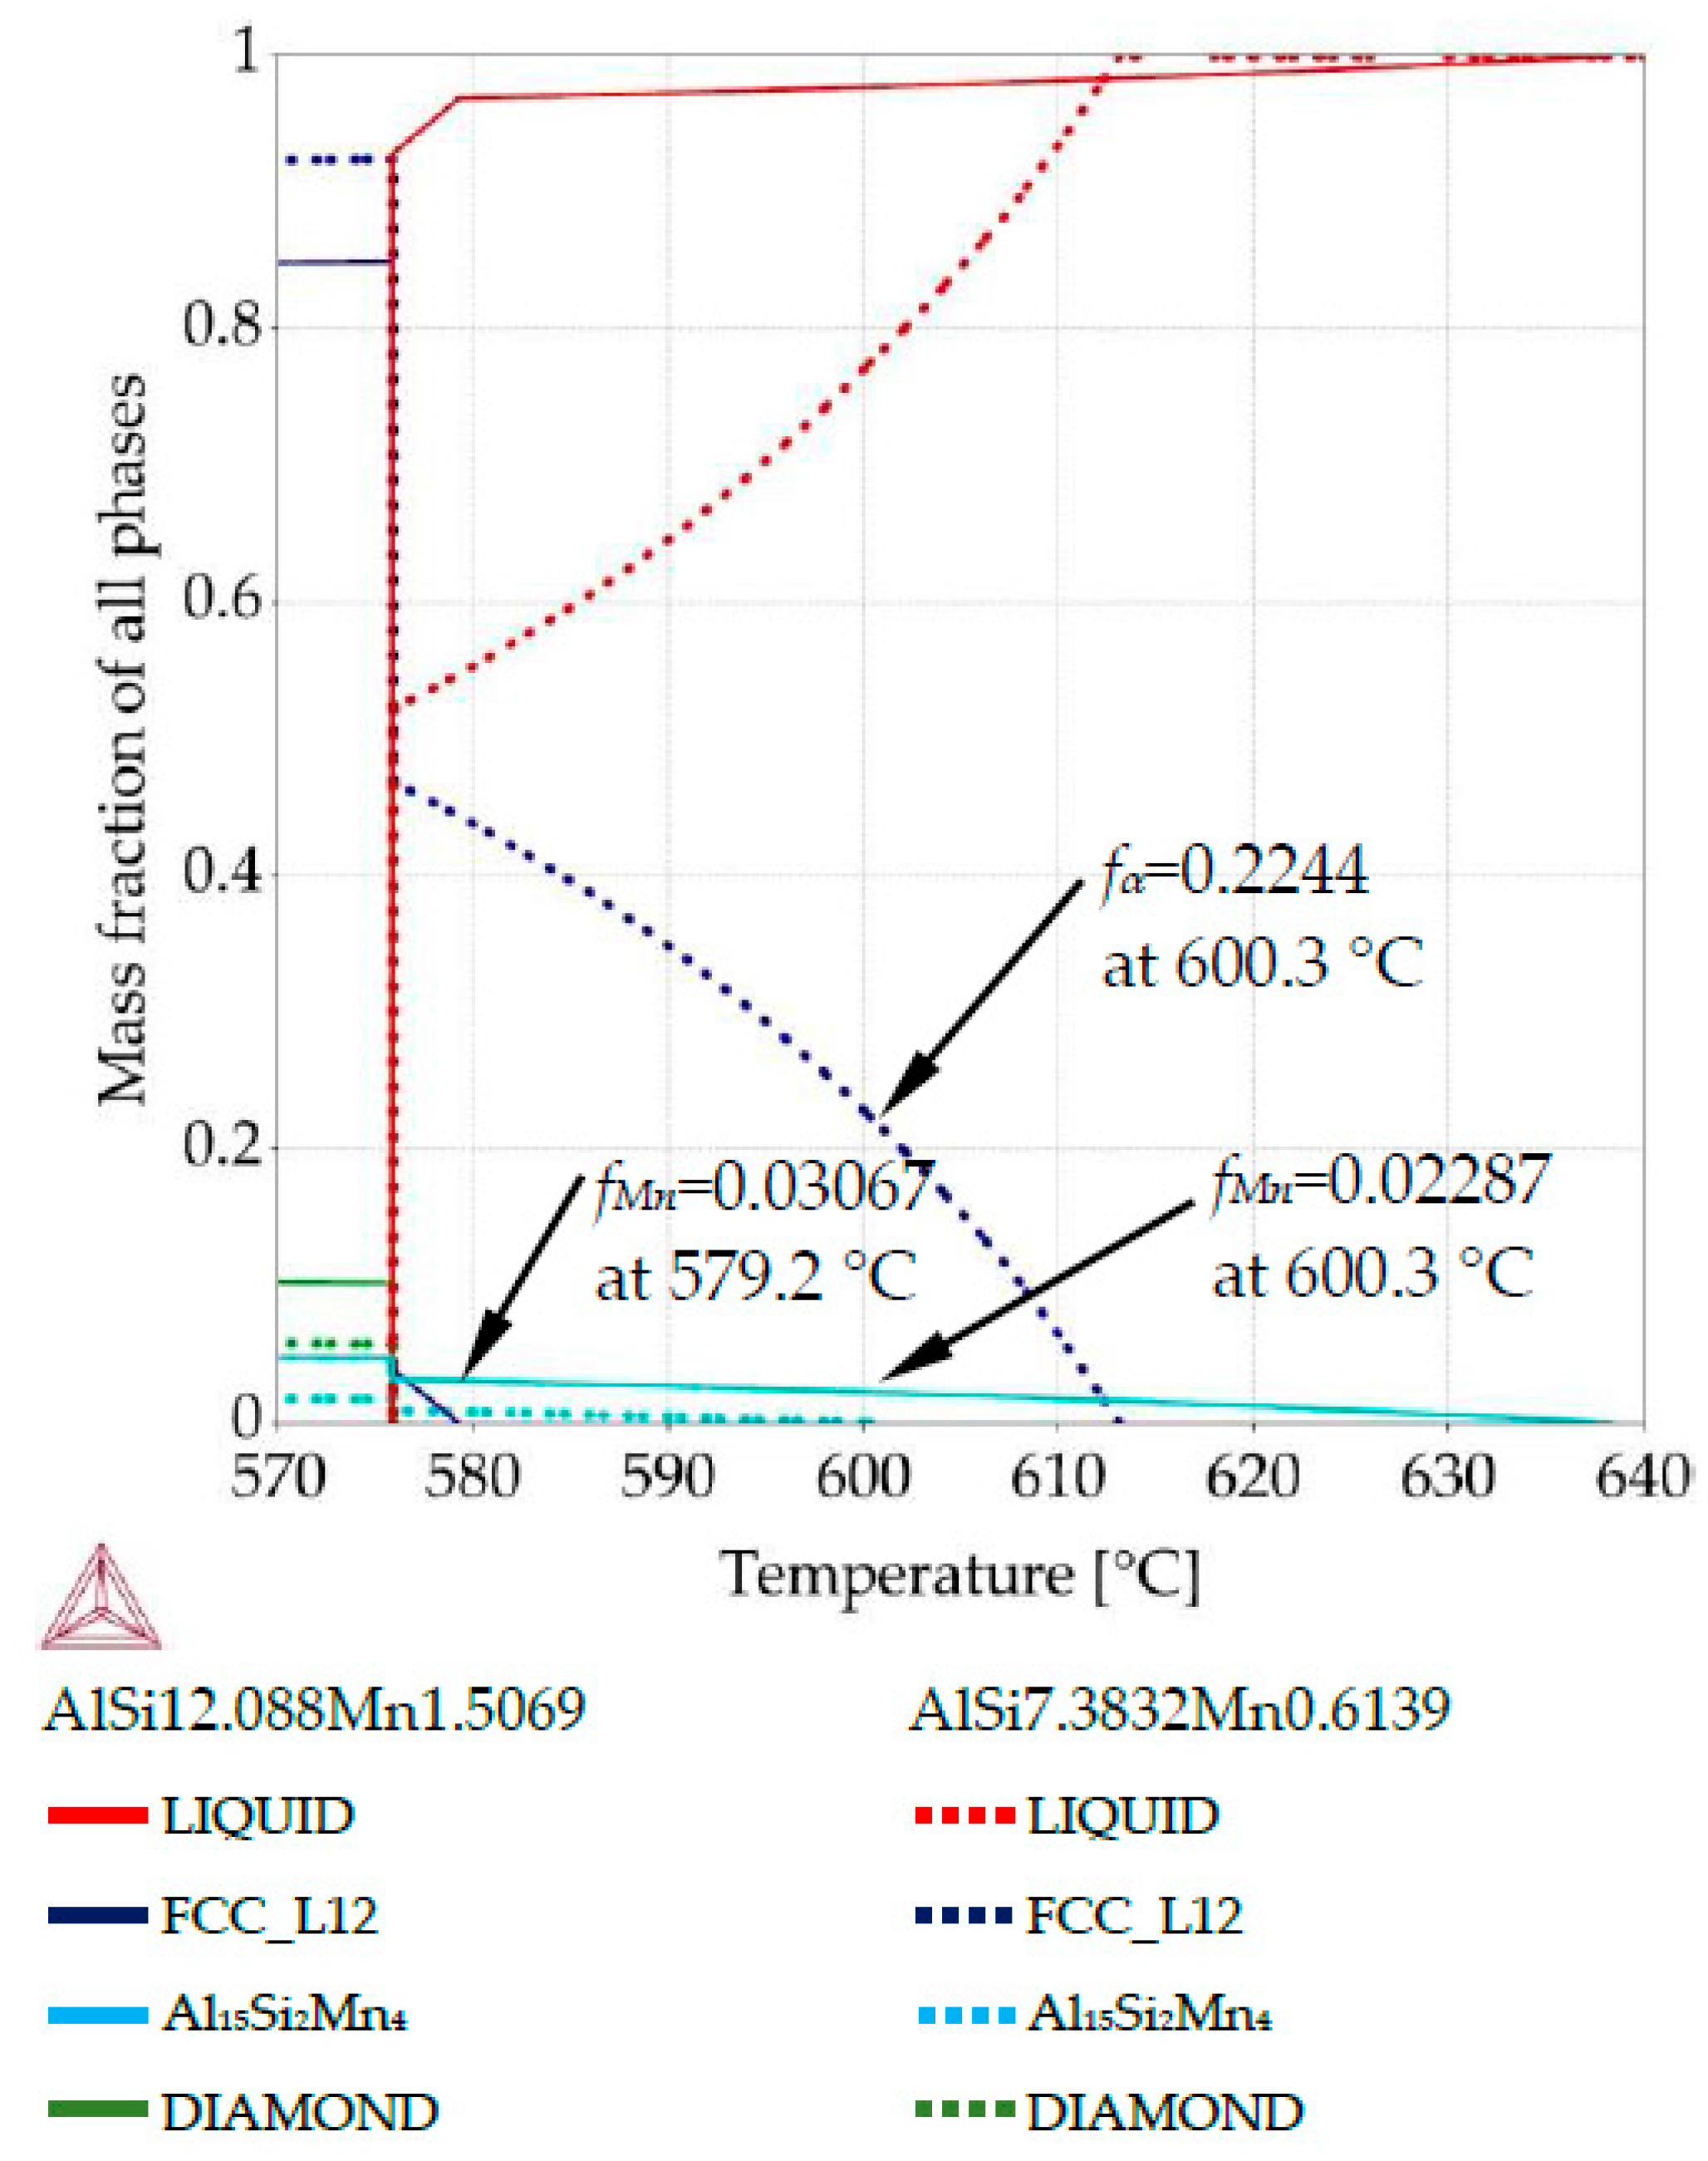
Property diagram for AlSi9Mn1.0 specimen, for places with chemical composition AlSi12.08Mn1.50 and AlSi7.38Mn0.61.
The property diagram for specimen AlSi5Mn0.2 is shown in Figure 6a. The primary phase is α-Al for both points. The blue lines show the difference in liquidus temperature due to composition variation: 637.0 °C at the point with composition AlSi3.76Mn0.28 (coordinate 6.1 mm, using scale given in Figure 3 and Figure 4) versus 626.7 °C for the point with AlSi5.43Mn0.10 (coordinate 3.5 mm). The formation of the Al15Si2Mn4 phase as part of the Al-Al15Si2Mn4 binary eutectic starts at 592.1 °C for the lower Si, higher Mn composition (solid lines) with Al15Si2Mn4 comprising fMn = 0.003 of the sample at the ternary eutectic temperature (575.9 °C) and increasing to fMn = 0.006 at room temperature. For the other composition (dotted lines), a binary Al-Si eutectic begins to form less than a degree above the ternary eutectic reaction. Al15Si2Mn4 appears only as part of the ternary eutectic, ending with phase mass fraction (fMn) of just fMn = 0.0006.
Figure 6b shows very similar behavior for the specimen AlSi5Mn0.4 (green arrows in Figure 5b). In this case, more Mn in the sample causes the Si-poor region to begin forming Al15Si2Mn4 earlier at 610.8 °C and fMn reaches 0.012 at room temperature. In the Si-rich region, Al15Si2Mn4 still forms only as part of the ternary eutectic and makes up a maximum of 0.005 of the structure.
The property diagram for AlSi5Mn1.0 in Figure 7a reflects the large differences in composition that were detected across this sample. For the Si-poor composition of AlSi1.97Mn2.32, Al15Si2Mn4 starts to grow first at 667.9 °C, with α-Al not appearing until 646.1 °C. However, for Si-rich AlSi9.09Mn0.19 α-Al is the first precipitate, forming at 601.8 °C. Al15Si2Mn4 does not appear for this composition until the final eutectic reaction at 575.9 °C, after some formation of AlSi-eutectic as the second phase. This indicates that, in the region of the sample with low Si (coordinate 5.8 mm), α-Al started to grow when Al15Si2Mn4 constituted fMn = 0.0199 of the sample and Al15Si2Mn4 finally reached fMn = 0.0748 at 575.9 °C. In the high Si region, α-Al started to grow at 601.8 °C while in the low Si region, solid α-Al at that temperature already constituted at mass fraction fα = 0.895 of the sample, and Al15Si2Mn4 made up another fMn = 0.071, leaving only about fL = 0.035 liquid. This illustrates how dramatically the segregation in the samples can affect the structure of the mushy zone.
For AlSi7Mn1.0, the first phase to grow should be Al15Si2Mn4. The property diagram (Figure 7b) for the point with composition AlSi12.82Mn2.30 (coordinate 4.5 mm) shows Al15Si2Mn4 starting to grow first at 667.0 °C and α-Al dendrites not precipitating at all. Instead, AlSi eutectic starts to grow at 581.6 °C. For AlSi6.55Mn0.59 (coordinate 0.8 mm), α-Al precipitates first at 618.6 °C and Al15Si2Mn4 appears next at 603.3 °C, when the α-Al constitutes fα = 0.2875 of the alloy. At that same temperature, for the high Si composition, primary Mn-intermetallics were continuing to grow uninhibited, constituting fMn = 0.0457. The final mass fraction for Mn-intermetallics below 575.9 °C is fMn = 0.0588 for AlSi12.82Mn2.30 and fMn = 0.0175 for AlSi6.55Mn0.59.
For AlSi9Mn1.0, the first phase to grow should be Al15Si2Mn4 (Figure 5). The property diagram (Figure 8) for the point with composition AlSi12.08Mn1.50 (violet dash-doted arrows on Figure 5b) shows Al15Si2Mn4 starting to form at 638.3 °C and α-Al following at 579.2 °C, when Mn intermetallics had obtained mass fraction fMn = 0.0307. For AlSi7.38Mn0.61 (point with coordinate 0.8 mm), α-Al phase precipitated first at 613.1 °C, followed by Al15Si2Mn4 at 600.3 °C when α-Al dendrites constituted mass fraction fα = 0.224. At that same temperature in the Si rich region, about half of the total Mn-intermetallics had formed, with mass fraction reaching fMn = 0.0229. The final mass fractions for those intermetallics are similar to the previous sample, with fMn = 0.047 and fMn = 0.0178 for the high and low manganese regions, respectively.
3.3. 2D Maps of Mushy Zone
The collected property diagrams, one from each point of composition measured on the samples, were used to determine the relative mass fraction of liquid, α-Al and Al15Si2Mn4 as a function of position in the solidification direction and across the diameter of the samples. These values were used to create 2D maps (Figure 9, Figure 10, Figure 11, Figure 12 and Figure 13) of the mushy zone, which also indicate temperature of phase precipitation. This transformation from temperature to position is possible because the controlled directional solidification conditions of the initial experiment mean that the temperature everywhere in the sample is known at all times, and the temperature axis on the property diagrams can be converted to sample position, or a length axis, as shown on the maps.
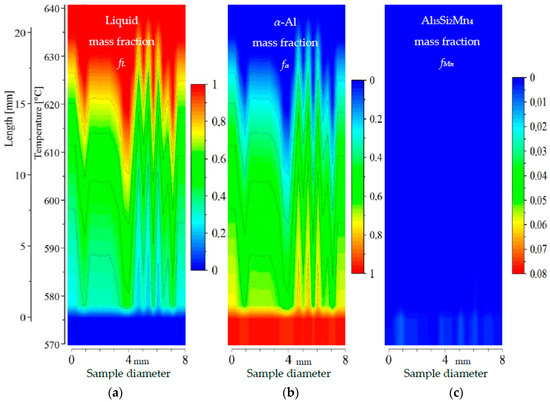
Figure 9.
2D maps of mushy zone for AlSi5Mn0.2 specimen: (a) liquid mass fraction fL; (b) α-Al mass fraction fα; (c) Al15Si2Mn4 mass fraction fMn in function of sample diameter and temperature/sample length.
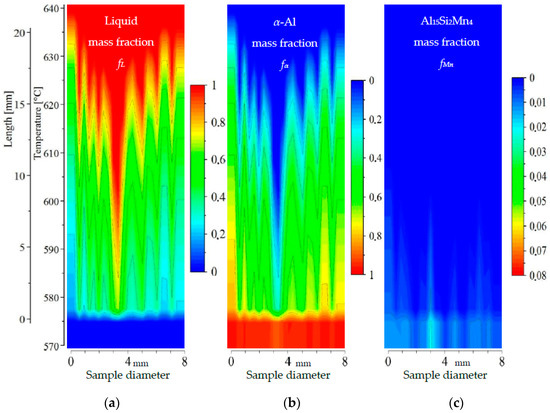
Figure 10.
2D maps of mushy zone for AlSi5Mn0.4 specimen: (a) liquid mass fraction fL; (b) α-Al mass fraction fα; (c) Al15Si2Mn4 mass fraction fMn in function of sample diameter and temperature/sample length.
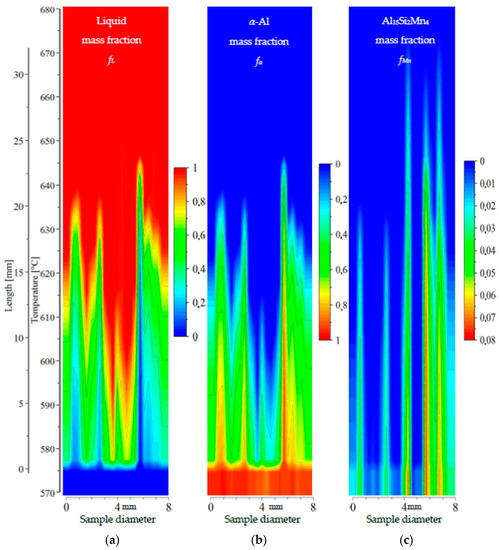
Figure 11.
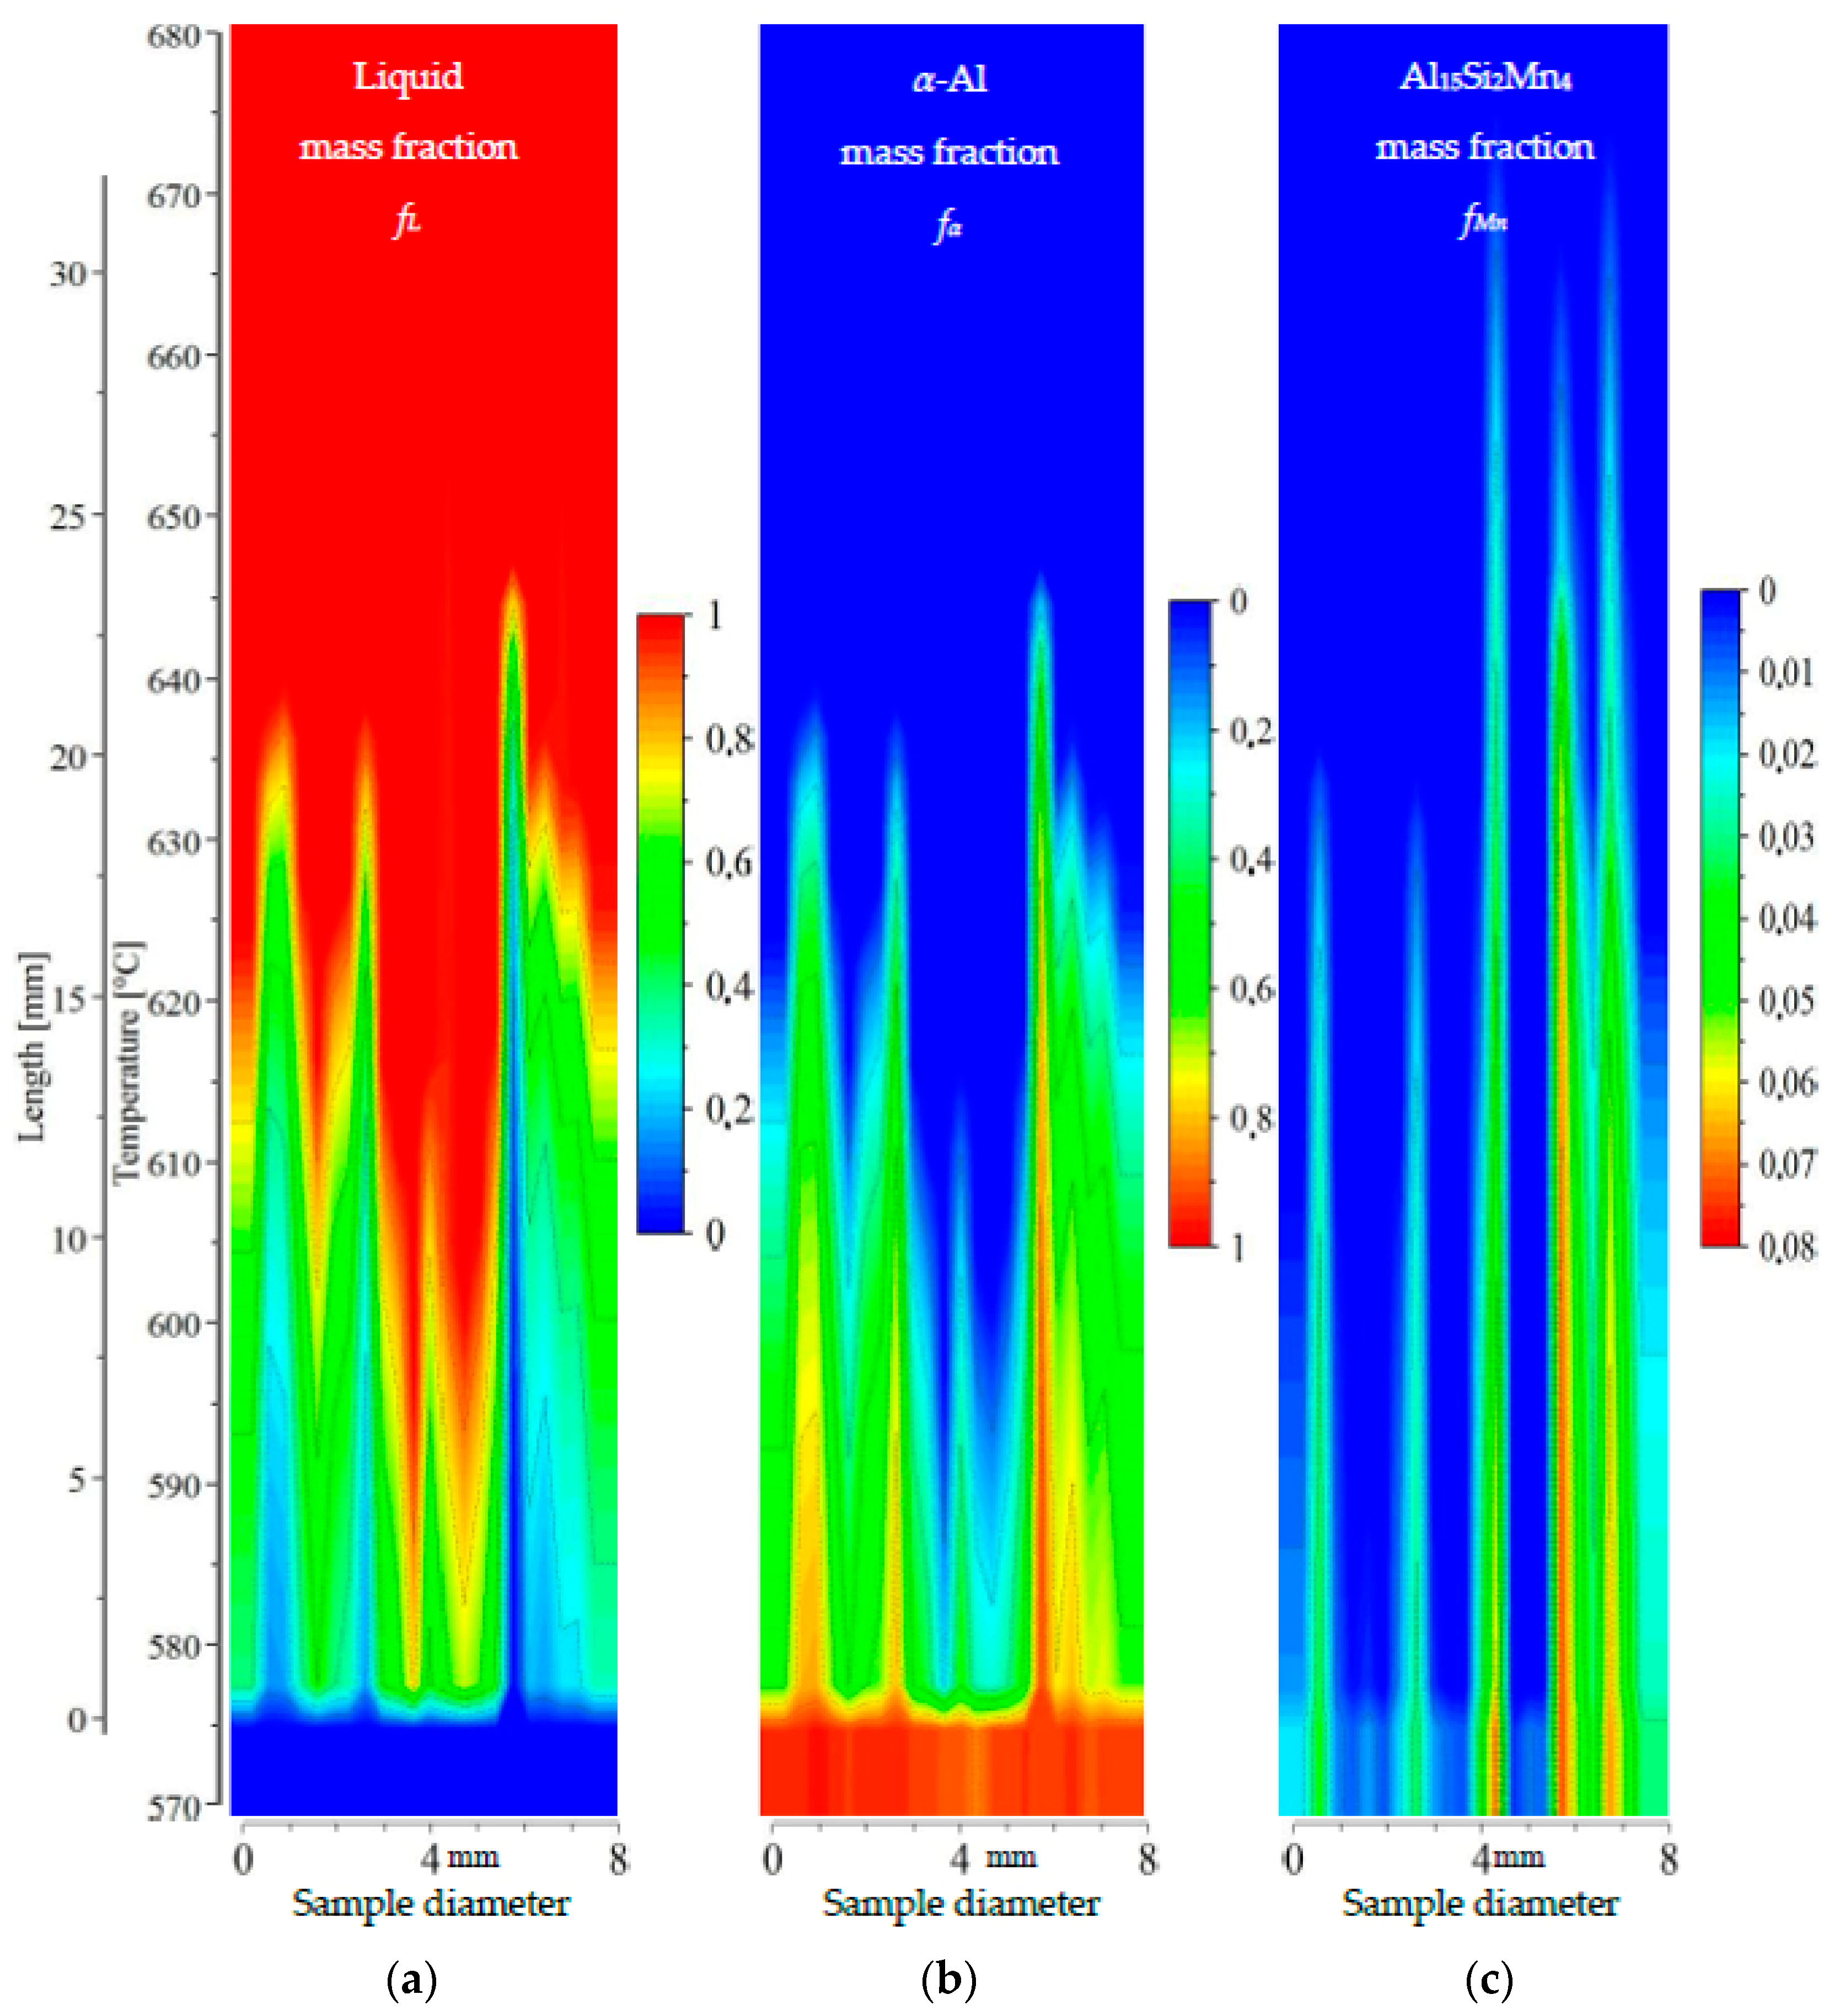
2D maps of mushy zone for AlSi5Mn1.0 specimen: (a) liquid mass fraction fL; (b) α-Al mass fraction fα; (c) Al15Si2Mn4 mass fraction fMn in function of sample diameter and temperature/sample length.
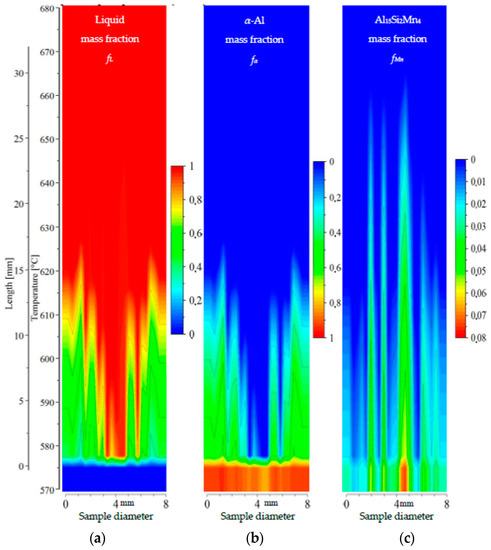
Figure 12.
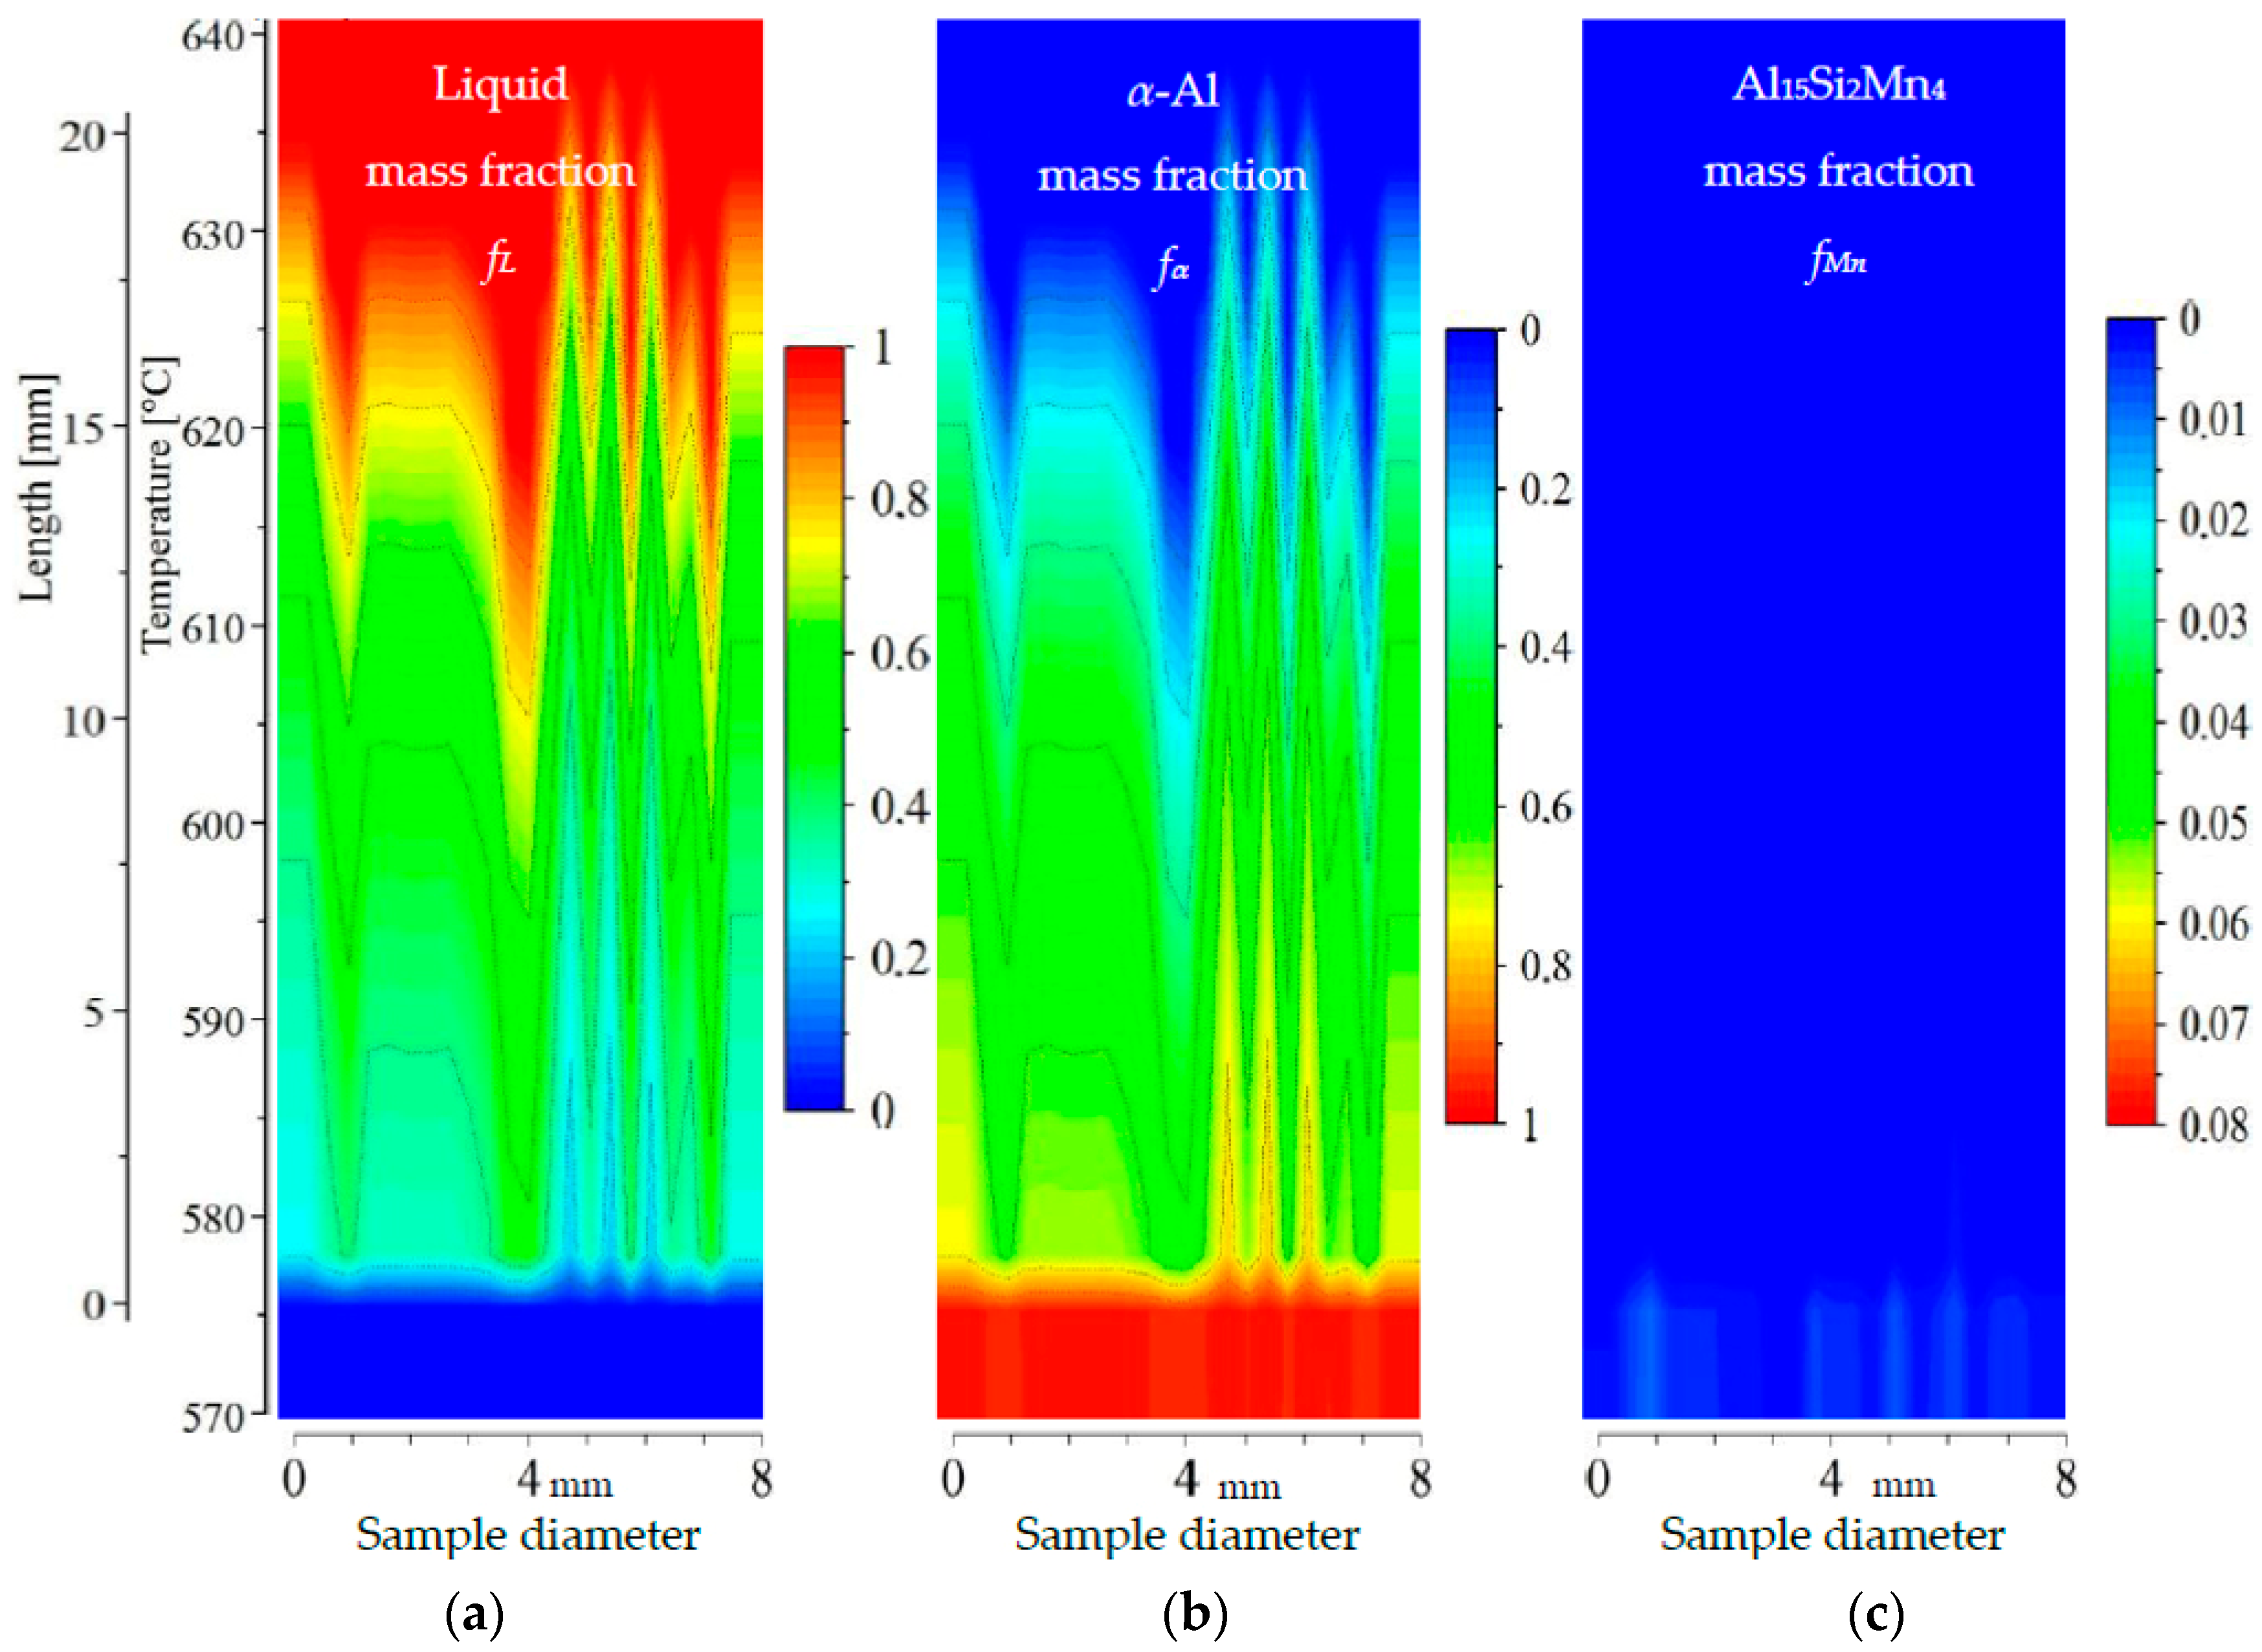
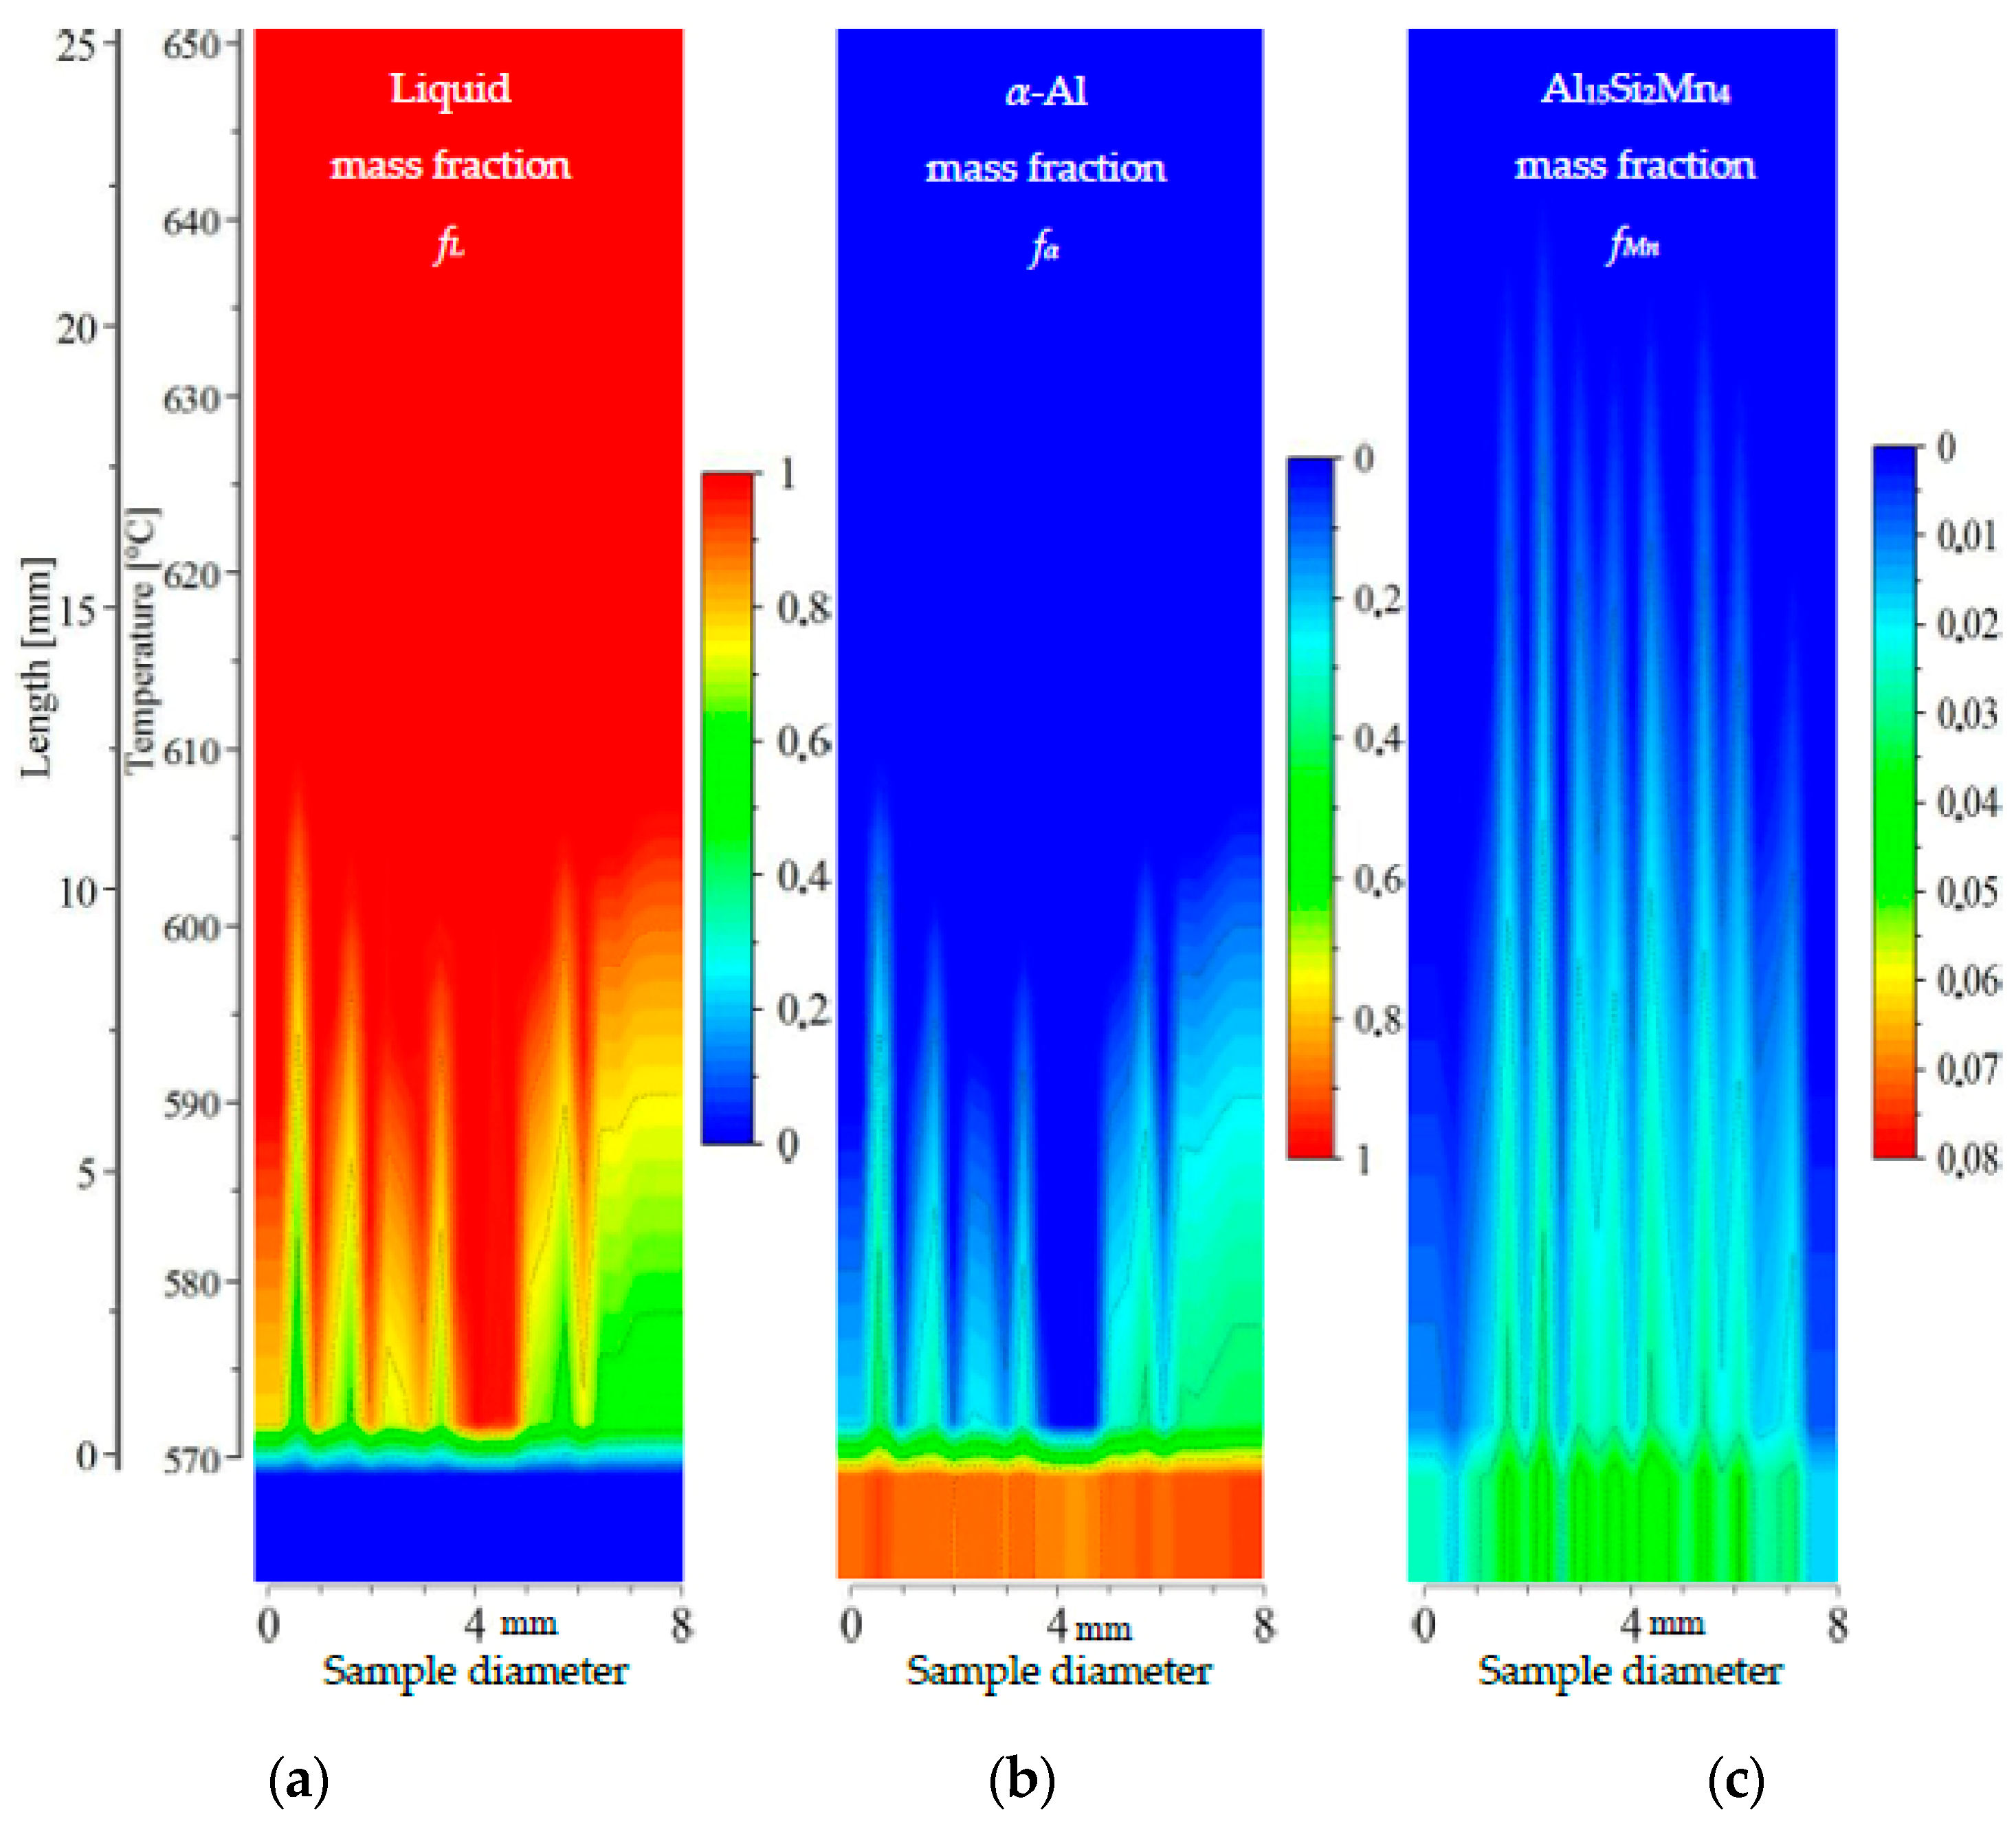
2D maps of mushy zone for AlSi7Mn1.0 specimen: (a) liquid mass fraction fL; (b) α-Al mass fraction fα; (c) Al15Si2Mn4 mass fraction fMn in function of sample diameter and temperature/sample length.

Figure 13.
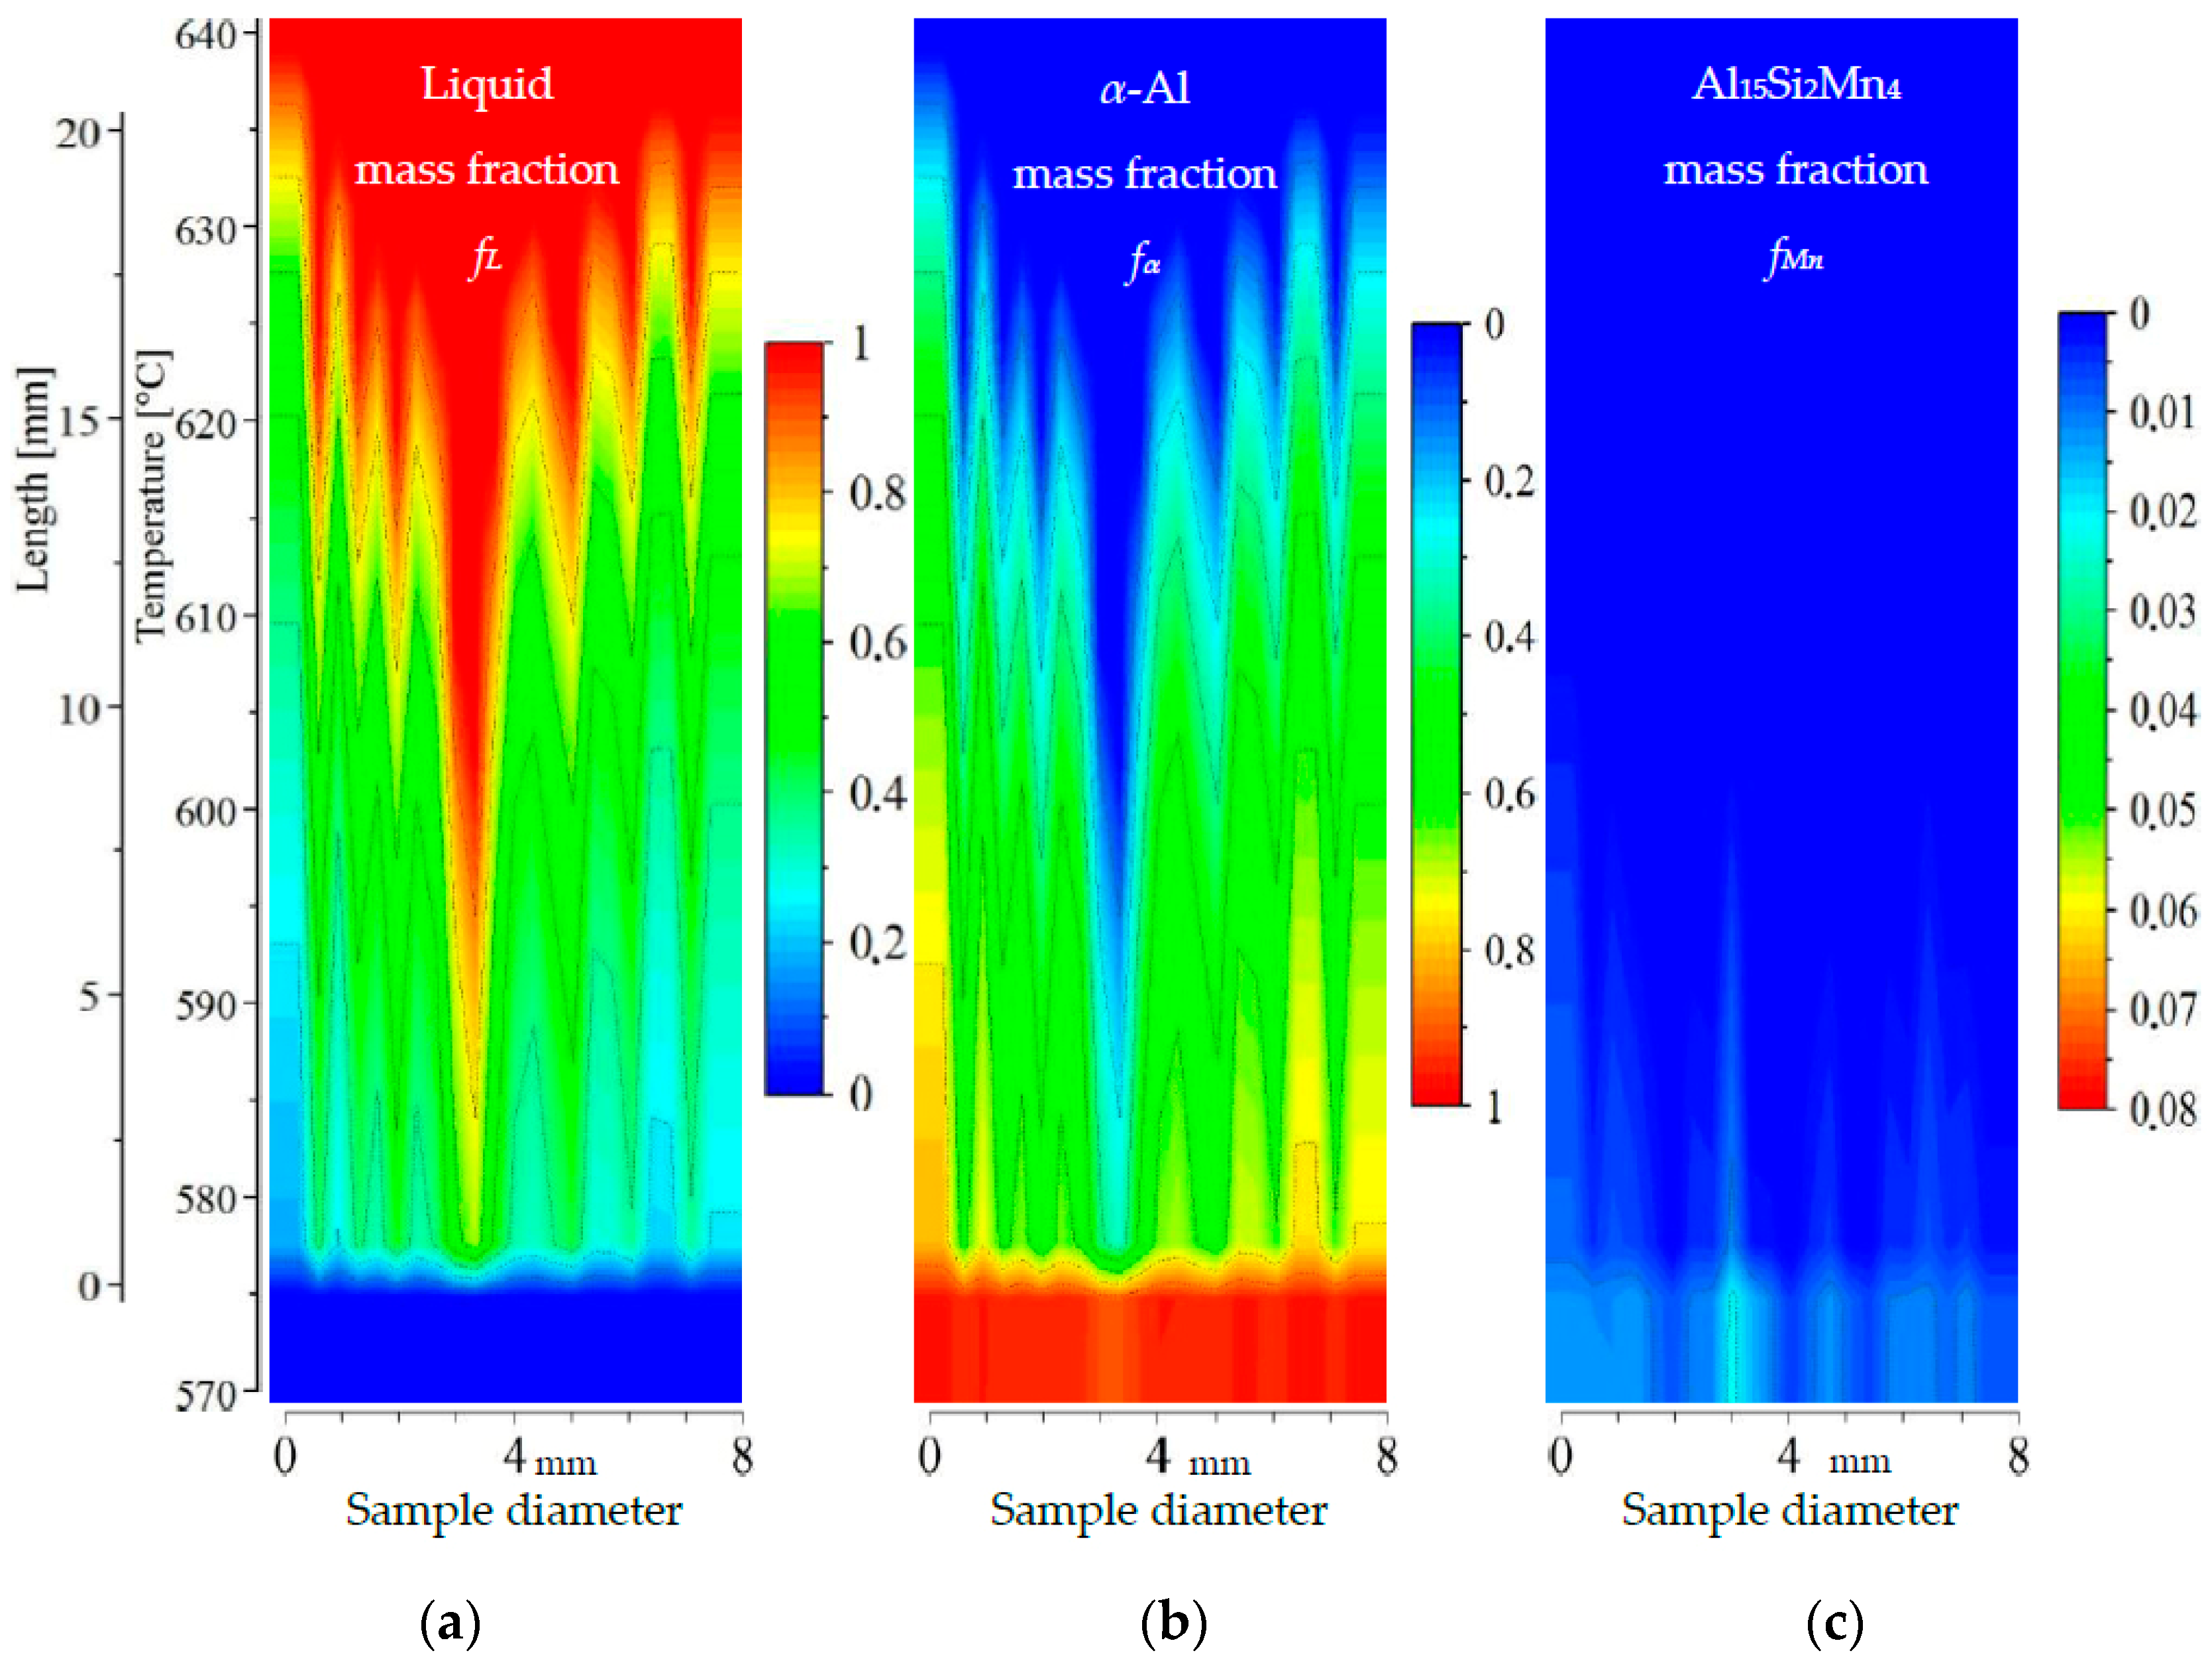
2D maps of mushy zone for AlSi9Mn1.0 specimen: (a) liquid mass fraction fL; (b) α-Al mass fraction fα; (c) Al15Si2Mn4 mass fraction fMn in function of sample diameter and temperature/sample length.
For specimen AlSi5Fe0.2, the liquid mass fraction fL (Figure 9a) and α-Al mass fraction fα (Figure 9b) clearly show the mushy zone in the temperature range from about 575 °C to about 635 °C, and a length of about 20 mm. The upper part of mushy zone (along dendrite tips) seems to be very rough. Two narrow channels may be observed at symmetric positions near the edges of the sample (positions of 1 and 7 mm). These liquid channels reach the temperature 615 °C and 610 °C, respectively, for α-Al mass fraction fα = 0.2. A third, somewhat wider, liquid channel reaches temperature 605 °C (again and in all subsequent discussion using fL = 0.8). However, a clear correlation with the type of microstructure seen in Figure 3, with a eutectic-enriched center region, is not obvious for this sample. The Al15Si2Mn4 phase (Figure 9c) seems to form suddenly at 575.9 °C, just 1 °C above the final solidification temperature, and only in a few positions, resulting in a final mass fraction of just fMn = 0.015.
For specimen AlSi5Fe0.4, liquid mass fraction fL (Figure 10a) and α-Al mass fraction fα (Figure 10b) clearly show the liquid channel in the specimen center, 0.5 mm wide in the bottom (coordinate 3.1 mm) at the temperature 600 °C and 2 mm on top at 625 °C. Because of the segregation, α-Al dendrites start to grow at about 638 °C near the edges of the specimen, and at 595 °C in the center. The mushy zone seems to be in the temperature range from 575 °C to about 638 °C, meaning a mushy zone length of about 21 mm. Dendrite tips seem to retreat deeper when moving from the edges into the specimen center. Al15Si2Mn4 (Figure 10c) starts to precipitate in the center at about 598 °C (coordinate 3.1 mm), corresponding with the position of increased liquid mass fraction (Figure 10a) and decreased α-Al (Figure 10b). In this position, the mass fraction reached fMn = 0.015. The map in Figure 10c shows additional growth of Al15Si2Mn4 across the diameter of the specimen. The final microstructure solidified at 575 °C and shows the center richer in Al15Si2Mn4 phases (mass fraction about fMn = 0.025). This agrees qualitatively with predictions [17] for β-Al5FeSi and with the measurements [14] of number density nβ and length Lβ of β-Al5FeSi phases. The liquid channel agrees with a central area enriched in AlSi-eutectic seen at temperatures below 575 °C (Figure 3). The solidification range for Al15Si2Mn4 is about 575–598 °C; that is, mass fraction isoline fMn = 0.01 reached the temperature 598 °C. At the center point (coordinate 3.1 mm) on the specimen cross-section where Mn is particularly high (composition AlSi7.97Mn0.72, Figure 5), Al15Si2Mn4 started to form at almost the same temperature as the α-Al dendrites. However, even at this points, like all other points in this sample, the Mn phase was the second phase to appear, meaning the liquid channel is empty of Mn-rich phases.
For the specimen AlSi5Mn1.0 (Figure 11), liquid mass fraction fL and α-Al mass fraction fα again show a central liquid channel consistent with a specimen center enriched in AlSi-eutectic as in Figure 3. This channel is wider and deeper than for AlSi5Mn0.4: 1 mm wide in the bottom at 590 °C and 3 mm on top at 635 °C. The mushy zone, based on the α-Al phase, is slightly longer than for AlSi5Mn0.4, with a temperature range here of about 575–645 °C (23 mm long). The length of the Al15Si2Mn4 zone, however, is much longer, from 575 to 670 °C (33 mm). At one point near the center of the sample (coordinate 4.5 mm), the measured composition was AlSi8.66Mn2.21, meaning the temperature for starting Al15Si2Mn4 growth would reach as high as 676 °C due to liquid enrichment. More variability of composition in this sample, when compared with AlSi5Mn0.4, leads to a less uniform appearance of the mushy zone. The completely solidified microstructure in the center is richer in Al15Si2Mn4 (mass fraction about fMn = 0.075) in comparison to the specimen AlSi5Mn0.4, with the fMn reaching particularly high values at coordinates 6 and 7 mm. Al15Si2Mn4 mass fraction fMn = 0.02 reached temperatures of 655, 650 and 655 °C for the points with coordinates 4.5, 5.8 and 8.6, respectively, although only the first of those points is located within the liquid channel, as determined by liquid mass fraction fL and α-Al mass fraction fα. According to these composition measurements, the Mn-rich phase starts to grow before the α-Al dendrites at each of mentioned points. In this way, in the area above, the dendrites and also in the liquid channel, the Al15Si2Mn4 precipitates may nucleate and freely flow. Unlike the AlSi5Mn0.4 specimen then, the AlSi5Mn1.0 specimen appears to have enough Mn that segregation can cause regions of the sample where Mn-phases precipitate before α-Al dendrites in what is otherwise the overwhelmingly liquid part of mushy zone.
For the specimen AlSi7Mn1.0 (Figure 12), liquid mass fraction fL and α-Al mass fraction fα show clearly a central liquid channel wider and deeper than for previously mentioned specimens. In this sample, the dendrite-free area is 1.5 mm wide on the bottom at 577 °C and 4 mm on top at 615 °C using fL = 0.8 and fα = 0.2. The mushy zone is shorter than for AlSi5Mn1.0, with a temperature range of about 575–615 °C (13 mm long) for α-Al. The Al15Si2Mn4 formation region, however, is much longer, covering 575–660 °C (28 mm). At one point (coordinate 4.8 mm, composition AlSi12.28Mn2.30), the temperature for starting Al15Si2Mn4 growth may reach even 667 °C. The middle part of the mushy zone outlined by dendrite tips is somewhat rough (Figure 12), but less so than AlSi5Mn1.0 and AlSi5Mn0.4. The completely solidified microstructure in the center channel (coordinate 4.8 mm, Figure 12c) is clearly richer in Al15Si2Mn4 (mass fraction about fMn = 0.075) in comparison to previous specimens. Based on the shorter dendrite zone (α-Al and liquid mass fraction) and longer Al15Si2Mn4 growth range, it appears that there is an area about 6 mm wide in the center of the sample where Al15Si2Mn4 precipitates before α-Al (Figure 12a). This indicates that in the liquid channel and above dendrite tips, Mn-precipitates may freely nucleate and flow.
For the specimen AlSi9Mn1.0 (Figure 13), liquid mass fraction and α-Al mass fraction show again the liquid channel leading to the specimen center being enriched in AlSi eutectic. The growth area for α-Al dendrites is only 10 mm long, corresponding to a temperature range of about 575–605 °C. The dendrite-free area in the center is 1.5 mm wide on the bottom at 575 °C and 2 mm wide on top at 600 °C. The higher Si content is clearly visible in comparison to previous specimens, as the α-Al mass fraction at 575 °C (fully solidified structure) reaches a relatively low value of about 0.4, compared to 0.6 for specimen AlSi7Mn1.0 and 0.7 for specimen AlSi5Mn0.2. The middle part of the mushy zone outlined by dendrite tips seems to be rough, with one clearly visible central channel and several smaller channels. The Al15Si2Mn4 growth area (21 mm long, Figure 13c) reaches a maximum temperature of 635 °C and extends over about 7 mm (most of the diameter of the sample). Although this sample has both a shorter dendrite growth range and a shorter Al15Si2Mn4 growth range in comparison to AlSi7Mn1.0, there is still a region in the center, about 7 mm wide, where Al15Si2Mn4 precipitates before α-Al (Figure 13). This indicates that in the liquid channel and above dendrite tips Mn-precipitates may freely nucleate, grow and flow. In this region across the center of the sample, the completely solidified microstructure is clearly enriched in Al15Si2Mn4 (mass fraction about fMn = 0.04), with the phase being much more evenly distributed than in previous specimens.
To summarize achieved results, in the studied samples, intensive fluid flow caused by electromagnetic stirring was found to produce changes in: (a) precipitation sequence; (b) growth temperature of phases; (c) mushy zone shape, i.e., formation of liquid channel; (d) length of mushy zone; (e) the possibility for phases to flow in the liquid and between dendrites (permeability). It was also found out that, for the studied composition range, as either Si or Mn content increases, mushy zone length decreases and precipitation of Mn-rich phases is favored.
4. Discussion
The combination of phase diagrams, Scheil-Gulliver solidification, and property diagrams has been used broadly in materials science to better understand the complex relationships between composition, microstructure and processing conditions. However, the application of property diagrams described in the current study for mushy zone prediction is unique.
On the 2D maps (Figure 9, Figure 10, Figure 11, Figure 12 and Figure 13), the most reliable values are those of mass fraction for the solidified area at temperatures below 575 °C. The measurement of chemical composition was conducted by 20 °C and seems to agree with that in the specimen at 575 °C. The plot of mass fractions above 575 °C (of discussed phases) is the projection resulting from chemical composition mostly frozen at 575 °C, but the real mushy zone is determined by Si and Mn release and intensive stirring (RMF) and may differ from Figure 9, Figure 10, Figure 11, Figure 12 and Figure 13.
Due to the use of aerogels [11,24]—a transparent material (90% transmission in the range 500–2000 nm wavelength) with low thermal conductivity (5–20 mW/m·K)—it was possible to measure the intensity of radiation from surface of solidifying sample. Recorded radiation intensity was used for precise determination of solidification velocity using the peak-effect by solidus temperature. Based on the radiation intensity, developed by Steinbach and Ratke [24], the method for mass fraction calculation is suitable for planar front present in Artemis-3 facility by solidification without electromagnetic stirring. In the current study by melt flow (not planar front) and very small amount of Mn-rich intermetallics (by 0.2 to 1 wt % Mn), it was impossible to validate directly the mass fraction of occurring phases, except through reference to simulation results [16].
The study of simulated directional solidification for AlSi7 (G = 4 K/mm, B = 3 mT) by Hainke [16] took into consideration, among other things, rejection of solute and fluid flow. The melt flow calculations present velocity isolines (not velocity values) that descend 4 mm in the specimen center in comparison to the edges of the sample. The simulation results [16] show the liquid mass fraction isoline fL = 0.0 also reaching 4 mm deep into the mushy zone in the central part of the specimen, and mass fraction isoline fL = 0.325 reaching 7.15 mm. Results similar to those of Hainke were found in the experimental study [25] but clearly show deeper liquid channels, to a depth of 12–15 mm for specimen AlSi7Fe1.0 and 9–13 mm for AlSi7Fe0.5, with high liquid mass fraction and low α-Al mass fraction, and the presence of β phases. This study, like the current work, used a temperature gradient of 3 K/mm, while the calculations of liquid channel depth by Hainke [16] were done using a temperature gradient of 4 K/mm. This means that the mushy zone in [16] might be estimated to be about 32% longer than when simulating with 3 K/mm. The current study presents comparable results to [16,25]; for the same Si content (specimen AlSi7Mn1.0), we see a 13 mm long mushy zone based on α-Al area (575–615 °C). This sample also has a 28 mm long area (575–660 °C) for Al15Si2Mn4, indicating Mn-phases growing in the liquid channel and above the dendrites. Similar observations indicating formation of the liquid channel apply to specimens AlSi5Mn0.4, AlSi5Mn1.0 and AlSi9Mn1.0.
The 2D maps showed precipitation of Mn-rich phases after α-Al at every point across the diameter of specimens AlSi5Mn0.2 and AlSi5Mn0.4, including the liquid channel (Figure 9c and Figure 10c). For the specimen AlSi5Mn0.2 (Figure 9c), the liquid channel is completely empty of Al15Si2Mn4, which doesn’t appear until essentially the final ternary eutectic reaction. For AlSi5Mn0.4, the Mn phase begins to form earlier, but still at a temperature just after the α-Al dendrites appear, meaning the liquid channel is also empty of Al15Si2Mn4. With 5 wt % Si, the dendritic structure is dense and seems not to allow Mn-intermetallics to flow into liquid area above dendrite tips, although it might be possible in the liquid channel in the specimen center, where only dendrite tips or AlSi eutectic exists as the first Mn phases form.
According to the maps, manganese rich-phases precipitate first across considerable regions of the specimens AlSi5Mn1.0 and AlSi7Mn1.0, especially in the central liquid channel. According to the composition measurements, the starting point for Al15Si2Mn4 growth at some points is far above dendrite tips, at the beginning of the mushy zone. In the AlSi9Mn1.0, Mn phases may precipitate first across nearly all of the specimens. Only very near the edges of the sample is the composition such that the Mn phases start to form close to final eutectic temperature 575.9 °C. By 9 wt % Si, the dendritic structure is thinner and the flow of Mn-intermetallics between dendrite arms seems possible. Such a possibility depends strongly on the dimension and morphology of intermetallics. According to [26], we may distinguish Mn phases with different morphologies: cube, colony of cubes, tree shaped, platelet shaped, and rib shaped phases. In addition, the formation of other phases caused by the presence of additional alloy components (e.g., Mg) might decrease the fluidity of the solidifying melt [27].
In previous studies of AlSiFe specimens produced using the same experimental technique [25], with decreasing mushy zone length, the width of the liquid channel increased and the amount of β-Al5FeSi in it decreased. Fe-rich phases formed first only in the liquid channel. Basing on the 2D maps, in current specimens, with decreasing mushy zone length, the number (mass fraction) of precipitating Mn-phases increased. On the Al-Si-Mn phase diagram (Figure 1 and Figure 5 and Figure 6), the eutectic groove for intermetallic formation (L → α-Al + Al15Si2Mn4 + L) goes from the point with concentration Al-12.55 wt % Si-0.45 wt % Mn to point Al-1.1 wt % Si-2.23 wt % Mn. However, in the Fe-containing alloys, the eutectic groove (L → α-Al + β-Al5FeSi + L) goes from Al-12.56 wt % Si-0.90 wt % Fe to Al-4.2 wt % Si-2.05 wt % Fe. This means that, for the Al-Si-Fe system, an alloy solidifying along the eutectic groove (L → α-Al + β-Al5FeSi) has higher amounts of Fe in comparison to the equivalent eutectic groove in the Al-Si-Mn system (L → α-Al + Al15Si2Mn4), indicating that Mn maintains an important role in determining solidification path even at lower compositions such as those in these sample (0.2%, 0.4% and 1.0% Mn). By comparing these two Al-Si systems, comparing the phase diagrams and samples with similar compositions and varied amounts of the third element shows that the flow effect on the morphology may differ from alloy to alloy.
For the samples studied here, the mushy zone length varies from 20 mm (AlSi5Mn0.2) to 32 mm (AlSi5Mn1.0), while, for Fe containing alloys [25], it varied from 10 mm (AlSi9Fe0.2) to 20 mm (AlSi5Fe1.0). This may be the next cause for differences in Mn and Fe segregation. In [16], stirring was weaker, caused by a rotating electromagnetic field of 3 mT, while, in [25], and, in the current study, the RMF was 6 mT. According to [28], the flow in the axial direction may constrain the mushy zone length to 12 mm in a temperature gradient of 4 K/mm and with electromagnetic field strength 3 mT. However, that is much less than the observed lengths of the mushy zones reported in [25] and current study (Figure 9, Figure 10, Figure 11, Figure 12 and Figure 13). The simulated flow velocities [28] in the axial direction are 2.5 mm/s for strength 3 mT and 10.5 mm/s for 6 mT. There is no information that increased flow velocities due to increased field strength may point on the longer area with included flow.
All the computations and discussions were developed considering fixed composition along sample length without composition change during solidification. However, during solidification, the composition may change due to fluid flow evolution or due to the segregation in the remaining liquid. The earlier EDS measurements [29] for AlSi7Fe1.0 alloy on similar specimens (with 8 mm diameter and 120 mm long), showed almost constant Si and Fe concentration along samples solidified without melt stirring. However, for solidification with high rotating magnetic field (HRMF) of 150 mT and temperature gradient 7 K/mm, segregation was found to occur both along and across sample. The concentration increased almost linearly from the sample beginning (2.5 wt % Si and 0.6 wt % Fe, coordinate 1 mm), to the sample end (12.8 wt % Si and 1.7 wt % Fe, coordinate 100 mm). Considering a similar linear increase, given the length of our predicted dendrite area (about 20 mm), between solidus isoline and dendrite tips, the concentration might increase about 1.2 wt % Si. Such an increase would shift the points on the Al-Si-Mn phase diagram (Figure 5) to the right, decreasing the liquidus about 7 °C and causing the mushy zone to be about 2.3 mm shorter. Such a composition shift would also result in a slightly wider liquid channel. Considering that the segregation measurements [29] by HRMF were made with 150 mT and current studies by RMF only 6 mT, it can be safely estimated that any change to the values presented here resulting from segregation along the sample length would be much less than a 10% reduction in mushy zone length and similarly scaled change to the liquid channel width.
The formation of the liquid channel in the specimen center is compatible with current and previous studies [25]. The main cause for the channel is segregation of Si, causing a shift to the right on the phase diagram toward the direction of the final ternary eutectic reaction. The segregation of Mn is not so uniform as was observed for Fe in [25], where the specimen center was clearly enriched in iron. Specimens with manganese show some enrichment in the center (e.g., AlSi9Mn1.0), but also some enrichment outside the center (e.g., AlSi5Mn1.0). This seems to result from different morphologies between platelet shaped β-Al5FeSi and complicated shaped Mn-rich phases [26].
The 2D maps revealed a mushy zone 20 mm long for AlSi5Mn0.2, 21 mm for AlSi5Mn0.4, 33 mm for AlSi5Mn1.0, 28 mm for AlSi7Mn1.0 and 21 mm for AlSi9Mn1.0. The changes in Si concentration mean different fractions of AlSi eutectic and α-Al dendrites, and variation in the permeability of the dendritic skeleton. For AlSi5Mn0.2 and AlSi5Mn0.4, the 2D maps present a liquid channel empty of Mn phase regions, while the maps for AlSi5Mn1.0, AlSi7Mn1.0 and AlSi9Mn1.0 show channels filled with Al15Si2Mn4, which also appeared and presumably flowed above the dendrite tips. These factors strongly determine permeability of mushy zone near the sample edges and in the specimen center, at the top and bottom of the mushy zone. The fluid flow generated by the magnetic field should be analyzed carefully for each specimen. In the AlSi5Mn0.2 and AlSi5Mn0.4 specimens, the fluid flow may be damped more strongly by longer and denser dendritic structures and Mn-phases located deep within the dendrite mesh. However, in AlSi5Mn1.0, AlSi7Mn1.0 and AlSi9Mn1.0, the stirring of the alloy may be stronger because of differences in the dendritic area (shorter and thinner α-Al regions) but with many more Mn intermetallics between and above dendrites.
5. Conclusions
Property diagrams showing mass fractions of different phases as a function of temperature, based on thermodynamic calculations, were used to build 2D maps, which offer an attractive method for visualizing the mushy zone during directional solidification. Property diagrams and solidification paths (Scheil-Gulliver solidification) presented the segregation effect on the characteristic temperatures and the sequence of phase precipitation across five AlSiMn specimens. These 2D maps revealed a liquid channel in the center of each sample that reached deep into the mushy zone, sometimes as far as up to the final solidification reaction at temperature 575.9 °C. The calculations presented the spatial location and mass fraction of phases (liquid, α-Al dendrites, Al15Si2Mn4) in the mushy zone.
Melt stirring may change solidification range, mushy zone length and shape, and dendrite tips may form a rough profile across the specimen. The current study revealed mushy zones with dense dendritic structure and liquid channels empty of Mn phases, where Mn intermetallics may not flow in the liquid, but only between dendrite arms. In other samples (those with more Si and Mn), thinner dendritic structures were found, where the central liquid channels were filled with Al15Si2Mn4, which also formed above the dendrites. These freely flowing Mn regions seem to have the possibility to influence the fluidity of liquid above the dendrites, as well as the nucleation and growth of other intermetallics and the growth of the dendrites tips.
The melt flow caused by rotating electromagnetic fields may lead to a mainly dendritic mushy zone in some samples, but also to a mushy zone with dendrites reaching only the lower half of mushy length and Mn intermetallics forming also in the remaining upper half of mushy area.
The Al15Si2Mn4-rich liquid channel that was elucidated high flow possibility of melt only and melt with Mn precipitates and the potential influence on the microstructure. Different flow possibilities in the dendritic and eutectic areas indicate complex interactions between phases and complicated fluid flow effects on the microstructure, which vary by alloy composition.
Acknowledgments
The research leading to these results has received funding from the People Programme (Marie Curie Actions) of the European Union’s Seventh Framework Programme (FP7/2007-2013) under Research Executive Agency REA grant agreement No. PCIG13-GA-2013-613906.
Author Contributions
Piotr Mikolajczak conceived, designed and performed experiments. Piotr Mikolajczak performed thermodynamic calculations, prepared diagrams and 2D maps, analyzed the data and wrote the paper. Amber Genau and Piotr Mikolajczak analyzed the data and wrote the manuscript. Amber Genau contributed proofreading and correction of English. Lorenz Ratke contributed consultation. All authors reviewed the final paper and contributed substantially to the work reported.
Conflicts of Interest
The authors declare no conflict of interest. The funding sponsor is the European Union’s Seventh Framework Programme (FP7/2007-2013). The founding sponsors had no role in the design of the study; in the collection, analyses, or interpretation of data; in the writing of the manuscript, and in the decision to publish the results.
References
- Massalski, T.B.; Okamoto, H. Binary Alloy Phase Diagrams; ASM International: Materials Park, OH, USA, 1990; ISBN 978-0871704030. [Google Scholar]
- Kaufman, L.; Bernstein, H. Computer Calculation of Phase Diagrams with Special Reference to Refractory Metals; Academic Press: New York, NY, USA, 1970; ISBN 9780124020504. [Google Scholar]
- Lukas, H.; Fries, S.G.; Sundman, B. Computational Thermodynamics—The Calphad. Method; Cambridge University Press: Cambridge, UK, 2007; ISBN 978-0-521-86811. [Google Scholar]
- Hillert, M. Phase Equilibria, Phase Diagrams and Phase Transformations—Their Thermodynamic Basis; Cambridge University Press: Cambridge, UK, 1998; ISBN 978-0-521-85351-4. [Google Scholar]
- Shi, P.; Sundman, B. Thermo-Calc. Software System—Thermodynamic Framework and Data; Thermo-Calc Software AB; Foundation of Computational Thermodynamics: Stockholm, Sweden, 2013. [Google Scholar]
- Jung, H.; Mangelinck-Noël, N.; Nguyen-Thi, H.; Billia, B. Columnar to equiaxed transition during directional solidification in refined Al-based alloys. J. Alloys Compd. 2009, 484, 739–746. [Google Scholar] [CrossRef]
- Ruvalcaba, D.; Mathiesen, R.H.; Eskin, D.G.; Arnberg, L.; Katgerman, L. In situ observations of dendritic fragmentation due to local solute-enrichment during directional solidification of an aluminum alloy. Acta Mater. 2007, 55, 4287–4292. [Google Scholar] [CrossRef]
- Bridgman, P.W. Certain physical properties of single crystals of Tungsten, Antimony, Bismuth, Tellurium, Cadmium, Zinc and Tin. Proc. Am. Acad. Arts Sci. 1925, 60, 305–383. [Google Scholar] [CrossRef]
- Stockbarger, D.C. The production of large single crystals of Lithium Fluoride. Rev. Sci. Instrum. 1936, 7, 133–136. [Google Scholar] [CrossRef]
- Alkemper, J.; Sous, S.; Stoker, C.; Ratke, L. Directional solidification in an aerogel furnace with high resolution optical temperature measurements. J. Cryst. Growth 1998, 191, 252–260. [Google Scholar] [CrossRef]
- Steinbach, S.; Ratke, L. In situ optical determination of fraction solid. Scr. Mater. 2004, 50, 1135–1138. [Google Scholar] [CrossRef]
- Steinbach, S. The Influence of Fluid Flow on the Microstructure Evolution of Directional Solidified Al-Si and A-Si-Mg Alloys. Ph.D. Thesis, RWTH Aachen University, Aachen, Germany, 2005. (In German). [Google Scholar]
- Thermo-Calc 4.1—Software Package from Thermo-Calc Software AB, Stockholm, Sweden. Available online: www.thermocalc.se (accessed on 16 March 2015).
- Mikolajczak, P.; Ratke, L. Effect of stirring induced by rotating magnetic field on β-Al5FeSi intermetallic phases during directional solidification in AlSi alloys. Int. J. Cast Met. Res. 2013, 26, 339–353. [Google Scholar] [CrossRef]
- Mikolajczak, P.; Ratke, L. Interplay between melt flow and the 3D distribution and morphology of Fe-rich phases in AlSi alloys. Metall. Mater. Trans. A 2015, 46, 1312–1327. [Google Scholar] [CrossRef]
- Hainke, M. Computation of Convection and Alloys Solidification with the Software Package CrysVUn. Ph.D. Thesis, Technical Faculty of Friedrich-Alexander Universität Erlangen-Nürnberg, Erlangen/Nuremberg, Germany, 2004. [Google Scholar]
- Steinbach, S.; Ratke, L. The influence of fluid flow on the microstructure of directionally solidified AlSi-base alloys. Metall. Mater. Trans. A 2007, 38, 1388–1394. [Google Scholar] [CrossRef]
- Steinbach, S.; Ratke, L. Experimental study on interaction of fluid flow and solidification in Al-Si-Cu alloys. Int. J. Cast Met. Res. 2007, 20, 140–144. [Google Scholar] [CrossRef]
- Steinbach, S.; Euskirchen, N.; Witusewicz, V.; Ratke, L. Fluid flow effects on intermetallic phases in Al-cast alloys. Trans. Indian Inst. Met. 2007, 60, 137–141. [Google Scholar]
- Kovacs, J.; Sveda, M.; Ronafoldi, A.; Roosz, A. Influence of high rotating magnetic field (RMF) on the solidified structure of Al-7 wt % Si-1 wt % Fe alloy. In Proceedings of the 6th Decennial Conference on Solidification Processing, Beaumont Estate, Old Windsor, UK, 25–28 July 2017. [Google Scholar]
- Budenkowa, O.; Nagy, C.; Du Terrail Couvat, Y.; Steinbach, S.; Roosz, A.; Fautrelle, Y. Comparison of 2D and 3D simulations of solidification of binary and ternary Al-based alloys under RMF. In Proceedings of the 6th Decennial Conference on Solidification Processing, Beaumont Estate, Old Windsor, UK, 25–28 July 2017. [Google Scholar]
- Kovacs, J.; Ronafoldi, A.; Roosz, A. Unidirectional solidification of Pb-Sn alloys in a rotating magnetic field. Mater. Sci. Forum 2013, 790–791, 408–413. [Google Scholar] [CrossRef]
- Sveda, M.; Sycheva, A.; Kovacs, J.; Ronafoldi, A.; Roosz, A. The effect of rotating magnetic field on the solidified structure of Sn-Cd peritectic alloys. Mater. Sci. Forum 2013, 790–791, 414–419. [Google Scholar] [CrossRef]
- Steinbach, S.; Ratke, L. In situ optical determination of fraction solid of Al-Si-Mg alloys. Mater. Sci. Forum 2006, 508, 491–496. [Google Scholar] [CrossRef]
- Mikolajczak, P.; Ratke, L. Thermodynamic assessment of mushy zone in directional solidification. Arch. Foundry Eng. AFE 2015, 15, 101–109. [Google Scholar] [CrossRef]
- Mikolajczak, P.; Ratke, L. Three dimensional morphology of Mn rich intermetallics in AlSi alloys investigated with X-ray tomography. Mater. Sci. Forum 2014, 790–791, 335–340. [Google Scholar] [CrossRef]
- Mikolajczak, P. Microstructural evolution in AlMgSi Alloys during solidification under electromagnetic stirring. Metals 2017, 7, 89. [Google Scholar] [CrossRef]
- Hainke, M.; Friedrich, J.; Müller, G. Numerical study on directional solidification of AlSi alloys with rotating magnetic field under microgravity conditions. J. Mater. Sci. 2004, 39, 2011–2015. [Google Scholar] [CrossRef]
- Roosz, A.; Kovacs, J.; Ronafoldi, A.; Kovacs, A. Effect of high rotating magnetic field on the solidified structure of Al-7 wt % Si-1 wt % Fe alloy. Mater. Sci. Forum 2013, 752, 57–65. [Google Scholar] [CrossRef]

© 2017 by the authors. Licensee MDPI, Basel, Switzerland. This article is an open access article distributed under the terms and conditions of the Creative Commons Attribution (CC BY) license (http://creativecommons.org/licenses/by/4.0/).