Article

Emergence and Progression of Abnormal Grain Growth in Minimally Strained Nickel-200

1
Connector & LAC Technology, Sandia National Laboratories, Albuquerque, NM 87185, USA
2
Materials Mechanics, Sandia National Laboratories, Albuquerque, NM 87185, USA
3
Metallurgical and Materials Engineering, The University of Alabama, Tuscaloosa, AL 35487, USA
*
Author to whom correspondence should be addressed.
Metals 2017, 7(9), 334; https://doi.org/10.3390/met7090334
Submission received: 1 July 2017 / Revised: 18 August 2017 / Accepted: 23 August 2017 / Published: 30 August 2017

Abstract

:
Grain boundary engineering (GBE) is a thermomechanical processing technique used to control the distribution, arrangement, and identity of grain boundary networks, thereby improving their mechanical properties. In both GBE and non-GBE metals, the phenomena of abnormal grain growth (AGG) and its contributing factors is still a subject of much interest and research. In a previous study, GBE was performed on minimally strained (ε < 10%), commercially pure Nickel-200 via cyclic annealing, wherein unique onset temperature and induced strain pairings were identified for the emergence of AGG. In this study, crystallographic segmentation of grain orientations from said experiments are leveraged in tandem with image processing to quantify growth rates for abnormal grains within the minimally strained regime. Advances in growth rates are shown to vary directly with initial strain content but inversely with initiating AGG onset temperature. A numeric estimator for advancement rates associated with AGG is also derived and presented.

Graphical Abstract

1. Introduction

Abnormal grain growth (AGG) is a mechanism by which a subset of grains grow at a rate faster than others. AGG is of significance because, like many other grain-scale and sub-grain-scale features such as freckles [1,2], precipitates [2], or dendrite arm spacing [3], AGG has been shown to have a significant effect on properties across many material systems under various loading conditions [4,5,6,7]. The exact mechanisms underpinning the occurrence of AGG are still unclear and remain a subject of much interest and research. Though debate on specific mechanisms exists, most authors agree that the formation of AGG is related to low-energy, high-mobility grain boundaries such as ∑3 and its variants (e.g., ∑9 and ∑27) [8,9,10,11,12,13,14,15,16]. This is of note as Grain Boundary Engineering (GBE) is a specific type of thermomechanical process used to improve material properties by altering their grain boundary network and often resulting in increased frequency of ∑3 boundaries [17,18].
In a previous study by the authors, GBE was performed on commercially pure Nickel-200 cold-worked to plastic strains (ε) of 3%, 6%, and 9%, respectively. This pre-strained material was then subjected to cyclic annealing schedules in which the dwell temperature was increased with each cycle. Among these cases, greater initial cold-work resulted in lower AGG onset temperatures. Specifically, for ε = 0%, 3%, 6%, and 9%, AGG was initially observed at 780 °C, 760 °C, 740 °C, and 720 °C, respectively. Furthermore, in the vicinity of AGG, ∑3, ∑9, and ∑27, boundaries exhibited local maxima either at or in the thermal cycle following the observed onset temperature for AGG [19]. While the kinetics of AGG are hypothesized analytically [8,20,21,22,23], it is rather difficult to reliably ascertain abnormal grain growth rates experimentally for a variety of reasons. These challenges include fluctuations in relative size needed to resolve AGG within a given region of interest [24], full discretization of AGG amidst a population of continuously growing grains within a changing global grain size distribution [25], and the practicality of acquiring a reasonable amount of observations within a limited thermal range to support quantification [20].
Additionally, while texture is not a central emphasis in this work, it is noteworthy that other studies have shown that both grain growth and recrystallization kinetics can be additionally influenced by grain orientation and strain path [26,27,28,29]. In this work, the effect of varying thermal and mechanical strain routes are examined specifically in relation to grain growth. To that end, one of the aforementioned studies [19] is revisited and careful electron backscatter diffraction (EBSD) experiments, similar to those reported in [30], are performed. In these experiments, however, EBSD is combined with image segmentation based on crystallographic orientation to extract advancement rates associated with initial onset (emergence) and continuing growth (progression) of abnormally large grains in a simple Ni system.

2. Materials and Methods

Commercially pure Ni-200 bars (with dimensions of 152 mm × 6.35 mm × 6.35 mm) were thermomechanically processed using a Stanat Model: TA 215 rolling mill (Stanat Mfg. Co. Inc., Westbury, NY, USA) and a Lindberg/Blue M tube furnace (Lindberg/Mph, Riverside, MI, USA), see Figure 1. Samples were cold rolled using multiple rolling passes to achieve a desired reduction of 0%, 3%, 6%, or 9%, respectively. Once rolled, samples were metallographically polished to a 0.05 μm colloidal silica finish. Focus ion beam (FIB) and micro-hardness indent fiducial markers were then placed on each sample so specific regions of interest (ROIs) could be tracked throughout each stage of the experiment while not impeding the field of view associated with any ROI. At room temperature, EBSD was performed on the rolling direction (RD) plane of the pre-selected ROIs for the 0%, 3%, 6%, and 9% strained cases. Samples were then cyclically and progressively annealed for 30 min at 700 °C, 720 °C, 740 °C, 760 °C, 780 °C, and 800 °C, under a flowing argon-rich or hydrogen-rich atmosphere to prevent oxidation.
After each annealing cycle, see Figure 2, samples were returned to room temperature and EBSD was performed on the same pre-selected ROI to document any changes in the grain population. Operating parameters for the collection of EBSD data utilized the following arrangement: A nominal beam current of 4 nA, a camera binning size of 4 × 4 or 6 × 6, and an indexing step size of 0.5 or 1 μm over multiple cross-sectional areas of 500 × 500 square μm or larger. TexSEM Laboratories (TSL) orientation imaging microscopy analysis by EDAX, Inc. (Mahwah, NJ, USA). was used to analyze EBSD data and all EBSD maps were filtered using the Neighbor Confidence Index (CI) Correlation followed by Grain CI Standardization cleanup processes, where an average confidence index of >0.1 was used. The reader is directed to reference [19] for additional information regarding the experimental procedure should further detail be desired.
Grain boundary characterization for the unstrained “as-received” Nickel-200 material is shown in Figure 3. The mean grain size diameter, including twin boundary distributions, displayed a near Gaussian distribution with a mean grain size of 7 μm and an area fraction mode of 20% at a grain size of 15 μm, Figure 3a. The polycrystalline material also bore no specific bias in texture or anisotropy in grain morphology but presented a twin-containing equiaxed microstructure, see Figure 3b–e. The orientation maps and pole figure in Figure 3c–e are shown with respect to the RD.

3. Results

For initial induced strains of 0%, 3%, 6%, and 9%, a series of EBSD maps are shown in Figure 4 where a given ROI is maintained along each row. Each cell reveals the EBSD map acquired following a specific cyclic annealing dwell temperature. As can be seen, AGG was observed to initiate at 780 °C for 0% strain; 760 °C for 3% strain; 740 °C for 6% strain; and 720 °C for 9% strain. For the cases in which abnormal grain growth was observed, bimodal distributions for grain size were also seen. Grains occupying the secondary peak of these bimodal distributions, which corresponded to higher mean grain sizes, were considered abnormally large [19]. Quantitatively, these grains corresponded to the upper 30% of their specific grain-size distributions across nearly all cases. So in this way, a consistent numeric threshold was applied for delineation of abnormally large grains. In Figure 4, these grains are outlined in black to assist in clearly identifying their locations and presence.
Inverse pole figure (IPF) maps with respect to the rolling direction (RD) for the ROIs presented in Figure 4 are shown below in Figure 5. The white circles indicate the orientations associated with the abnormally large grains. Minor changes in the texture populations contained within the ROIs are observable at or immediately before the onset of AGG. As might be expected, the population shifts are clearly indicative of the abnormally large grains increasingly occupying significant portions of the ROIs. However, the IPF maps also reveal that among the fields of view investigated, there appears to be no singularly preferred orientation among abnormally large grains in this study.
By utilizing the inherent segmentation available through the differentiation of crystallographic orientations, abnormally large grains were identified, as shown in Figure 4, and then isolated within their fields of view, see Figure 6. These sequestered grains were then used to calculate a local AGG area fraction measurement. By utilizing each successive area fraction, the rates of AGG were determined for both their onset and continued growth behavior. While differences in growth rates for twin and non-twinned grains are not captured here, the experimental quantification of the aggregate development of abnormal grain growth is notable.
The measured area fractions of abnormally large grains are plotted as a function of annealing temperature associated with their AGG onset, see Figure 7a. These area fractions are also shown as a function of the number of thermal cycles (n) beginning with the cycle prior to AGG, see Figure 7b. The error bars shown depict the area fraction variability associated with a ±10% adjustment to the upper 30% grain size threshold value imposed. As can be observed, the growth rates for all strain levels exhibit a rather consistent two-stage behavior. Where stage 1 appears relatively slow and coincides with the initial observation of AGG, and stage 2 continues rapidly once AGG has clearly presented itself. This more rapid stage is seen to advance at a rate roughly 3 times that of stage 1 for the 0%, 3%, and 9% cases, see Table 1. For convenience, the authors will henceforth refer to stage 1 growth as “emergence” and stage 2 as “progression”. Due to challenges associated with reliably identifying the emergence stage for the 3% case, emergence rates are not reported for 3% strain.
As seen in Figure 7, the greater the initial strain content, the higher the rate of abnormal grain growth in both the emergence and progression stages. Alternatively, the higher the AGG onset temperature, the slower the overall AGG advancement. While twinned and non-twinned grains were not differentiated in this analysis, the evolution of grains occupying large regions of cross-sectional area within their physical neighborhood were tracked rather successfully. To provide a more generalized extrapolation of these relative rates, the derivative of the parabolic curve fits in Figure 7b are provided in Figure 8. Here, each data series corresponds to a specific strain content and is denoted by color. The data markers provide the exact values of the calculated differential for up to 10 thermal cycles. Again, no calculated differential values for 3% are included due to the unavailability of a second order polynomial to differentiate.
Figure 8 illustrates a few informative trends. First, AGG in Ni-200 manifests unique growth rates for a given strain irrespective of the number of cyclic annealing exposures it experiences.
Stated another way, the initial strain content appears to strongly influence the emergence rate, and this imprint is preserved as abnormal grain growth continues. This estimation can be further simplified and approximated mathematically for all observed strains. This empirical relationship is provided in Equation (1) where:
d   ( A fraction ) d ( n )   =   8.2 n   +   ( ε   2.1 6 ) n .
In this instance, n is the quantity of cyclic thermal anneals and ε is the initial plastic strain. These predictive estimates are also included in Figure 8 as dashed lines to assist with their identification in comparison to the calculated differentials. Please note: A numerical prediction provided by Equation (1) is included for an initial 3% strain case by a dashed line, despite the current work’s inability to experimentally resolve the emergence rate for 3% strain. However, as can be seen, the predictive agreement is quite reasonable across all strain series shown. Furthermore, Equation (1) also illustrates that higher strain AGG rates can be estimated with a nominal (0%) AGG rate, when further incentivized by the added contribution of the higher strains as provided in the second term of Equation (1). As shown, the numeric approximation must also be accompanied by an appropriate set of prefactors. These values are provided in Equation (1) based on the experiments performed here. This suggests that in the case of consistent AGG advancement from repeated cyclic anneals, at least within the low strain regime, a methodology for the prediction of AGG advancement may be reasonably devised by clearly understanding or merely quantifying the unstrained AGG rates and the relevant scaling factors associated with additional strain content.

4. Discussion

The authors acknowledge that the findings of this work are derived from a limited number of observations within a single and specific lot of a commercially pure Ni-200 material, thermomechanically processed by rolling and exposure to a specific, consistent, and repeated cyclic annealing heat treatment. It should be anticipated that the specific area fraction measurements may be influenced by a number of these factors. Specifically, the most influential factors may be the cross-sectional areas selected for ROIs within each EBSD map, the 20 °C thermal jump between dwells, the 30 min dwell-time interval, and even the utilization of rolling to impart initial plastic strain. While these factors may introduce quantitative variation into specific measures, the authors assert these differences are likely to be insignificant to the fundamental trends observed. It has been shown that differing average grain size and cumulative area fractions can be obtained within the same pre-strained material under cyclic or isothermal annealing by introducing variations in dwell temperature, ramp rate, or hold times. However, once normalized by the local mean grain size, these varying distributions converge to a singular, invariant, cumulative fraction distribution [31]. Likewise, AGG observations could reasonably be expected to follow a similar convergence behavior when multiple observations are normalized to the local mean grain size present. The authors would further assert that the true benefit of this study is held in the observation of self-similar AGG rates being clearly and quantifiably related to initial plastic strain when exposed to equivalent, consistent, and repeated thermal exposures, not the specific area fractions reported in themselves.
Furthermore, the systematic observations across a breadth of strains and temperatures are notable in that AGG is shown to be predictively related to initial strain content. As seen here, initial strain bears a definite and significant influence on not only the emergence rate for AGG, but also, by extension, the continued progression rate. These findings are supported by the work of Decker et al. [32], He et al. [33,34,35], and Cho et al. [36], who all showed that among instances of self-similar AGG, initial strain content can serve as a significant driving force for grain boundary migration among low-energy, high-mobility grain boundaries [9,36,37]. In this work, this driving force is incorporated into the predictive estimate for AGG advancement as a superposition of a nominal rate (where ε = 0) combined with a weighted contribution from the additional plastic strain present. While good agreement has been achieved here, further experiments, along the lines of those reported herein, could additionally refine these observations and/or develop similar descriptions for other material systems. Such experiments would, however, require identification of self-similar AGG across a collection of strains and temperatures as a pre-requisite.
Two specific studies to further elucidate the AGG advancement rates reported here could include: (1) Capturing regions of interest larger than 500 × 500 square μm to acquire greater grain populations for measurement, and thereby increase the potential for identification of additional AGG events; or (2) decrease the cyclic annealing thermal or dwell time intervals to values smaller than 20 °C or 30 min, respectively. This would allow the examination of AGG emergence and progression across smaller observation spans. Further studies of this type would either grow the range of instances available for data collection or increase the resolution and granularity over which the AGG phenomena could be observed.

5. Conclusions

(1)
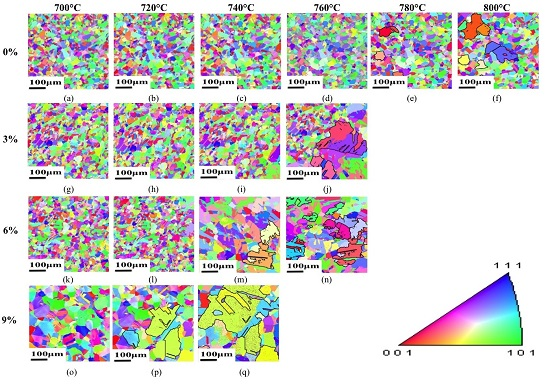
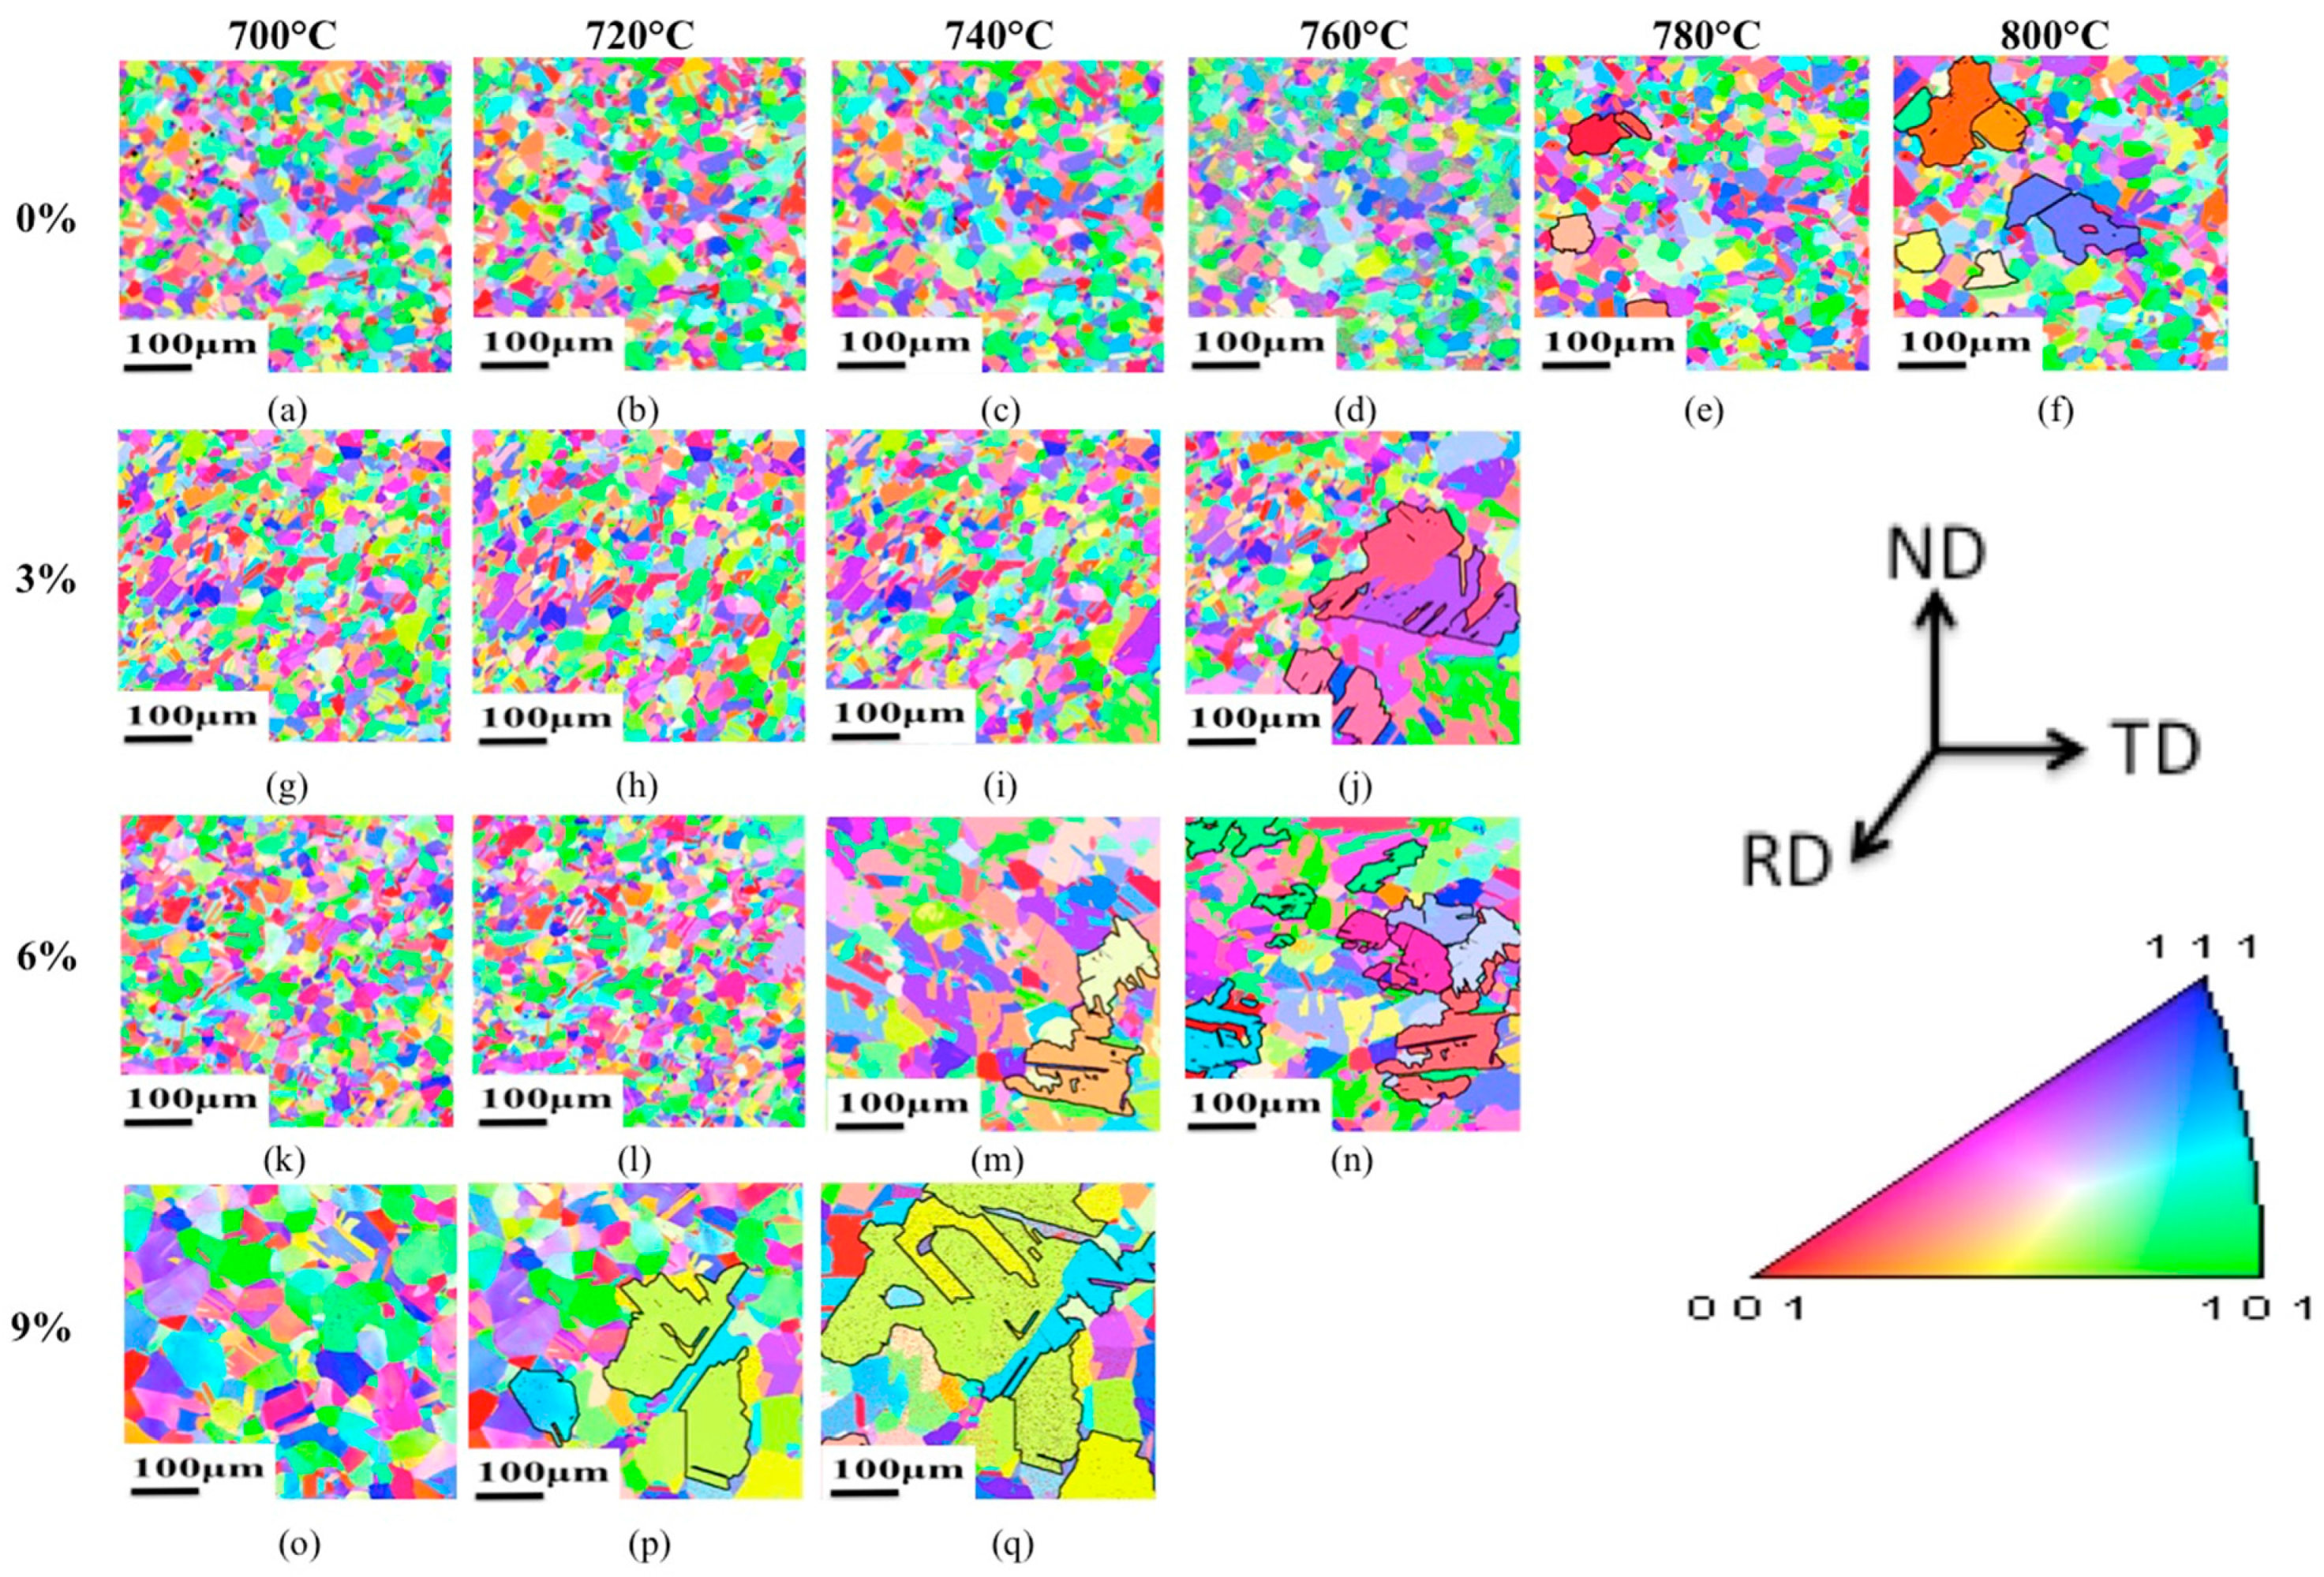
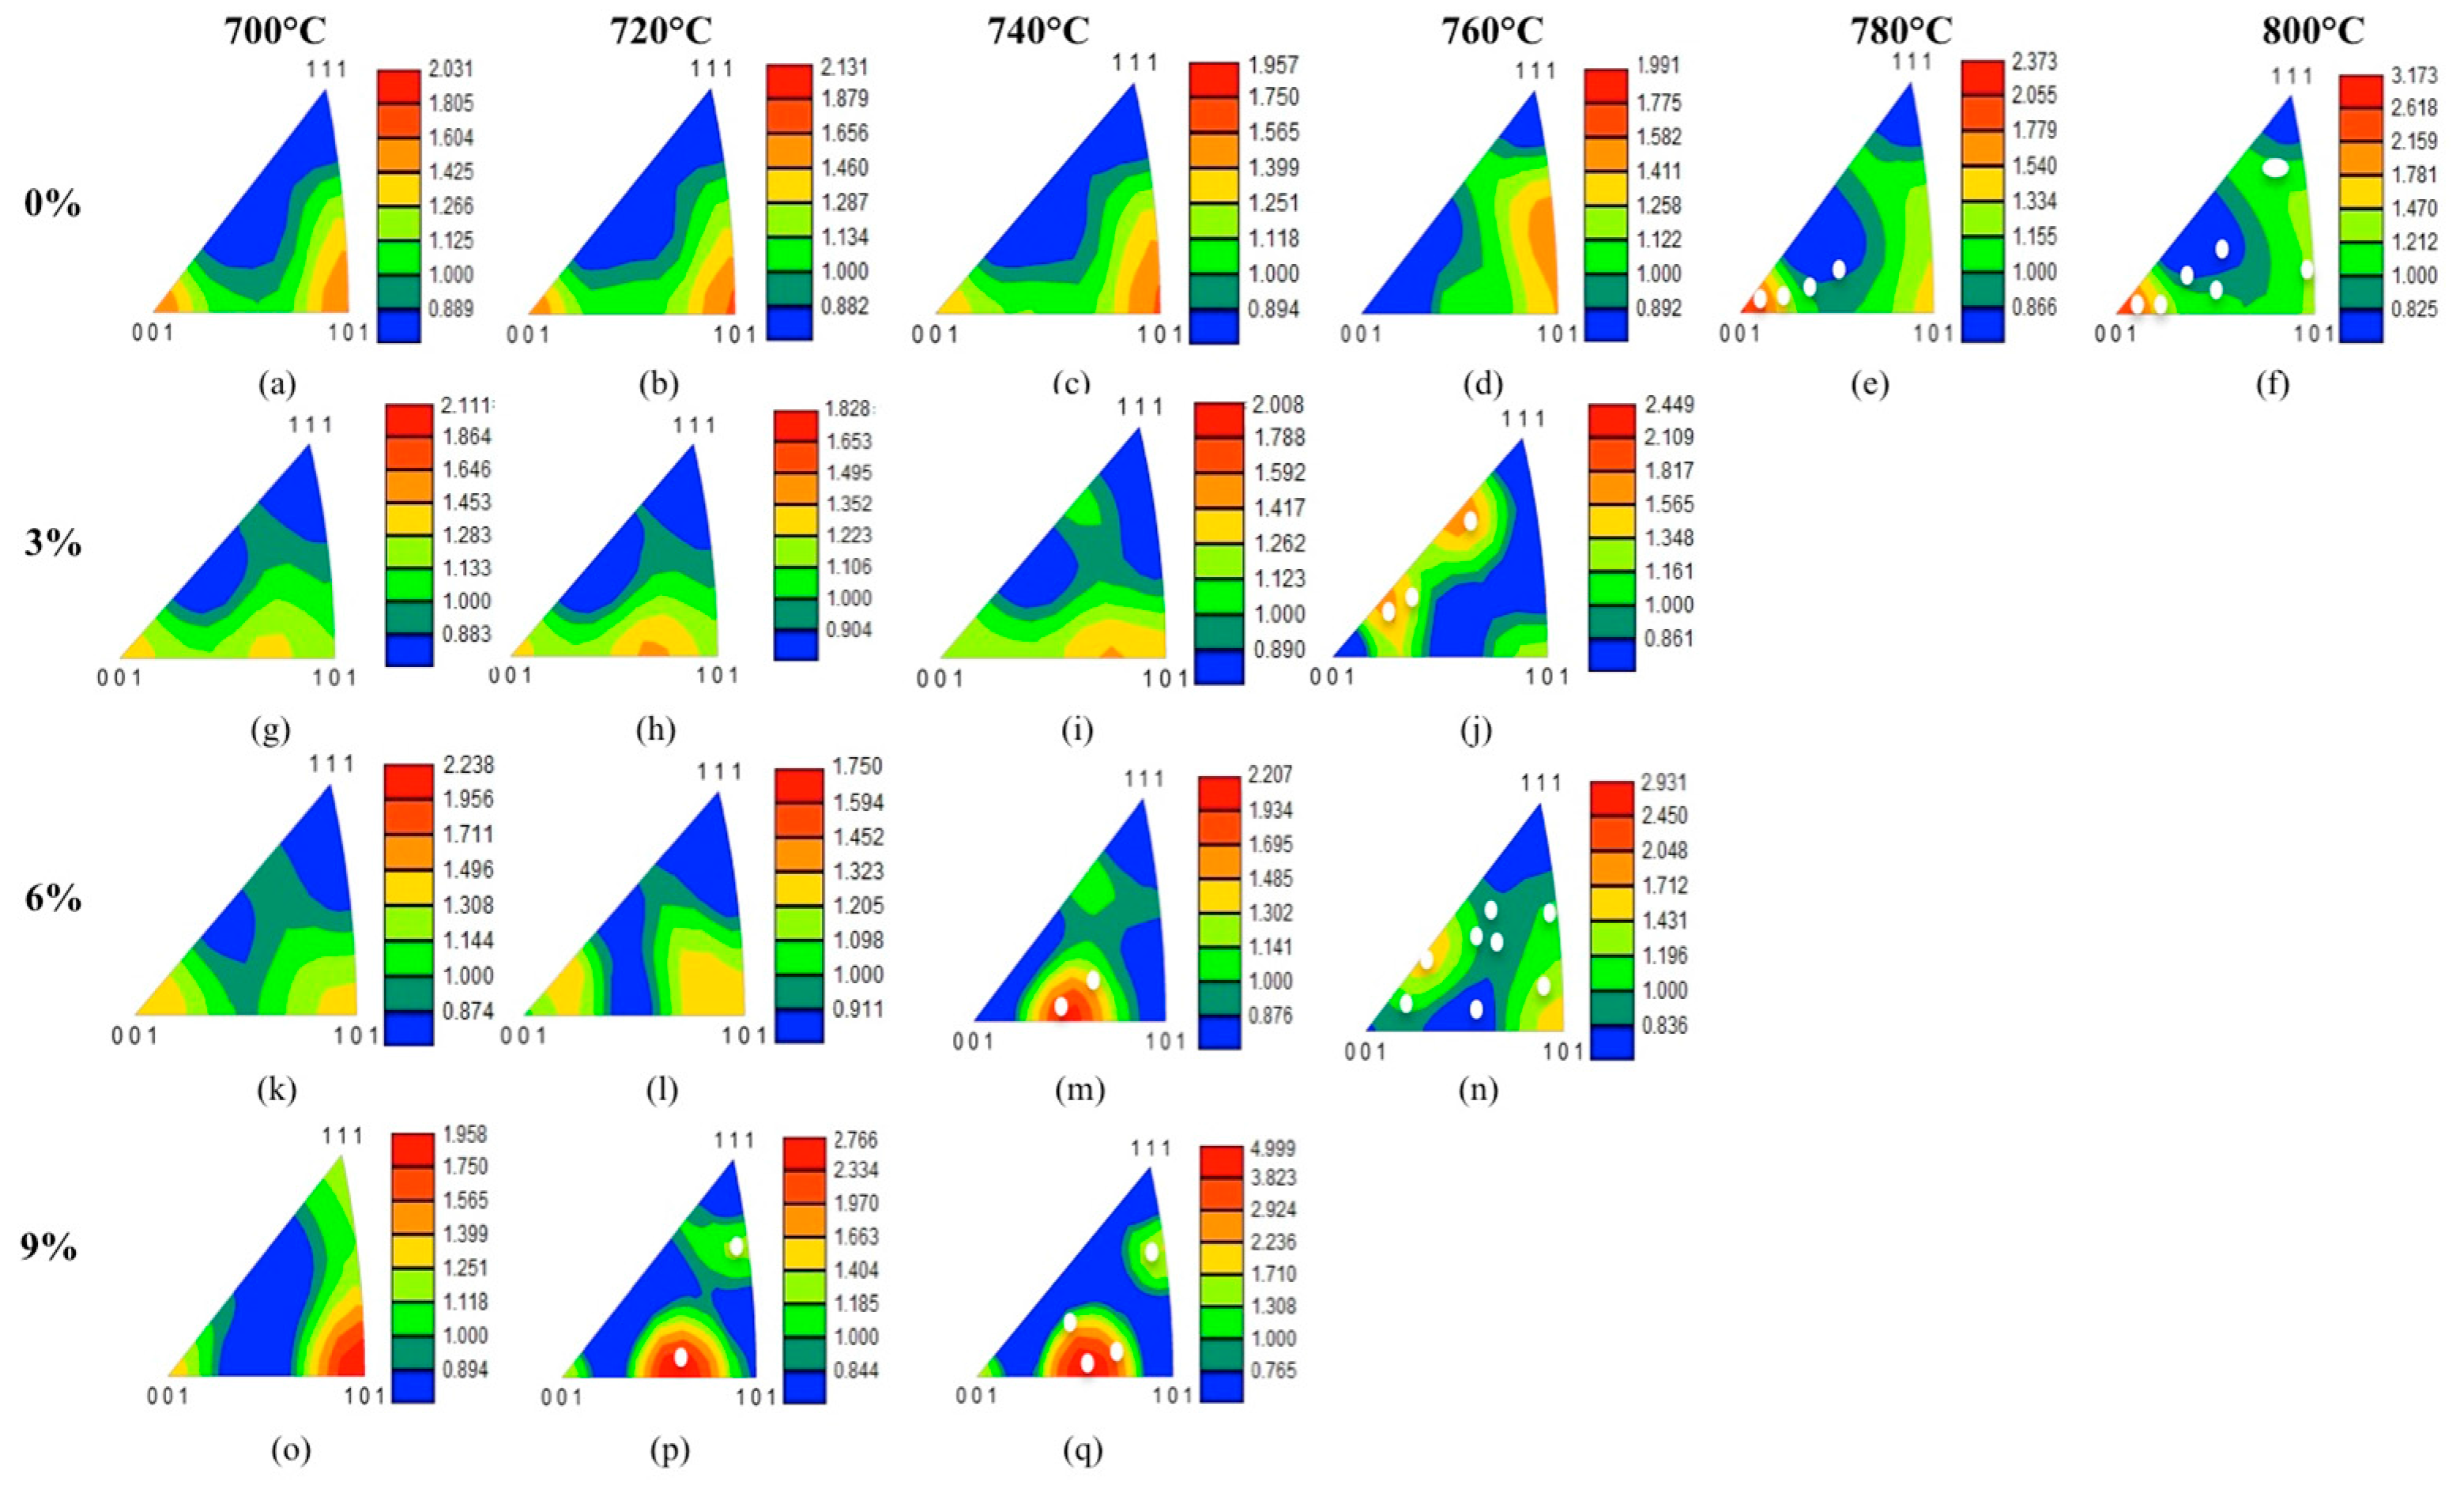
Emergence and progression rates for abnormally large grains in minimally strained, commercially pure Ni-200 were observed experimentally by EBSD and quantified using image segmentation based on crystallographic orientation and grain size distributions.
(2)
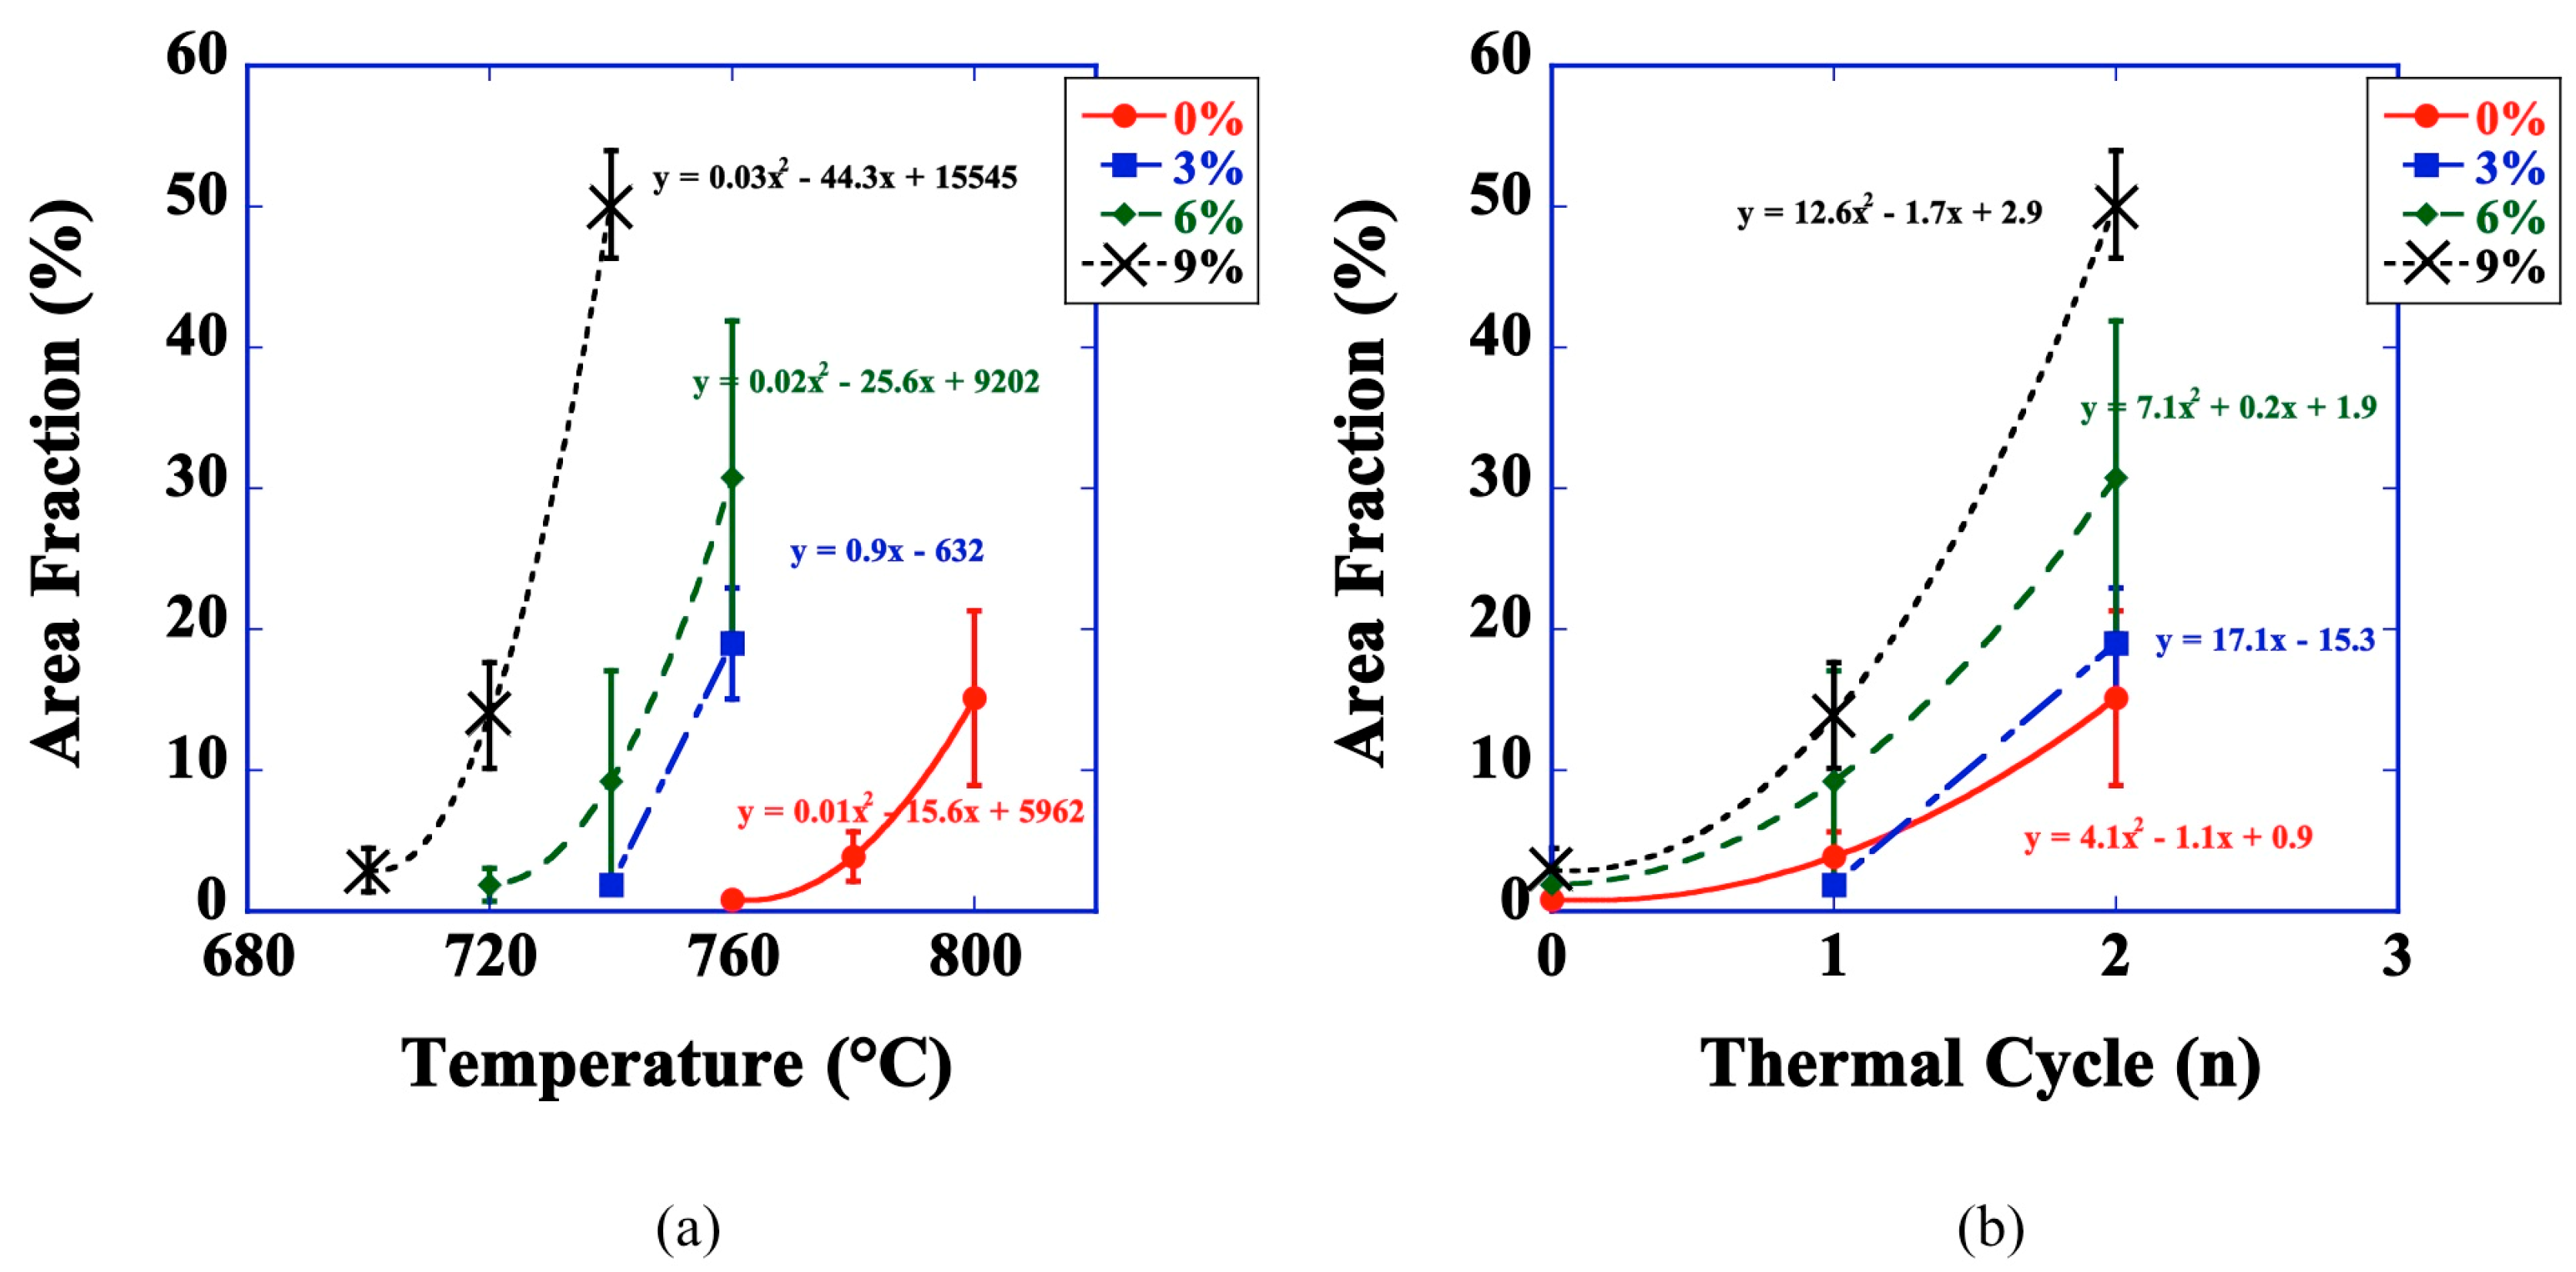
Emergence and progression growth rates were shown to scale directly with increased initial strain content and inversely with onset AGG temperature.
(3)
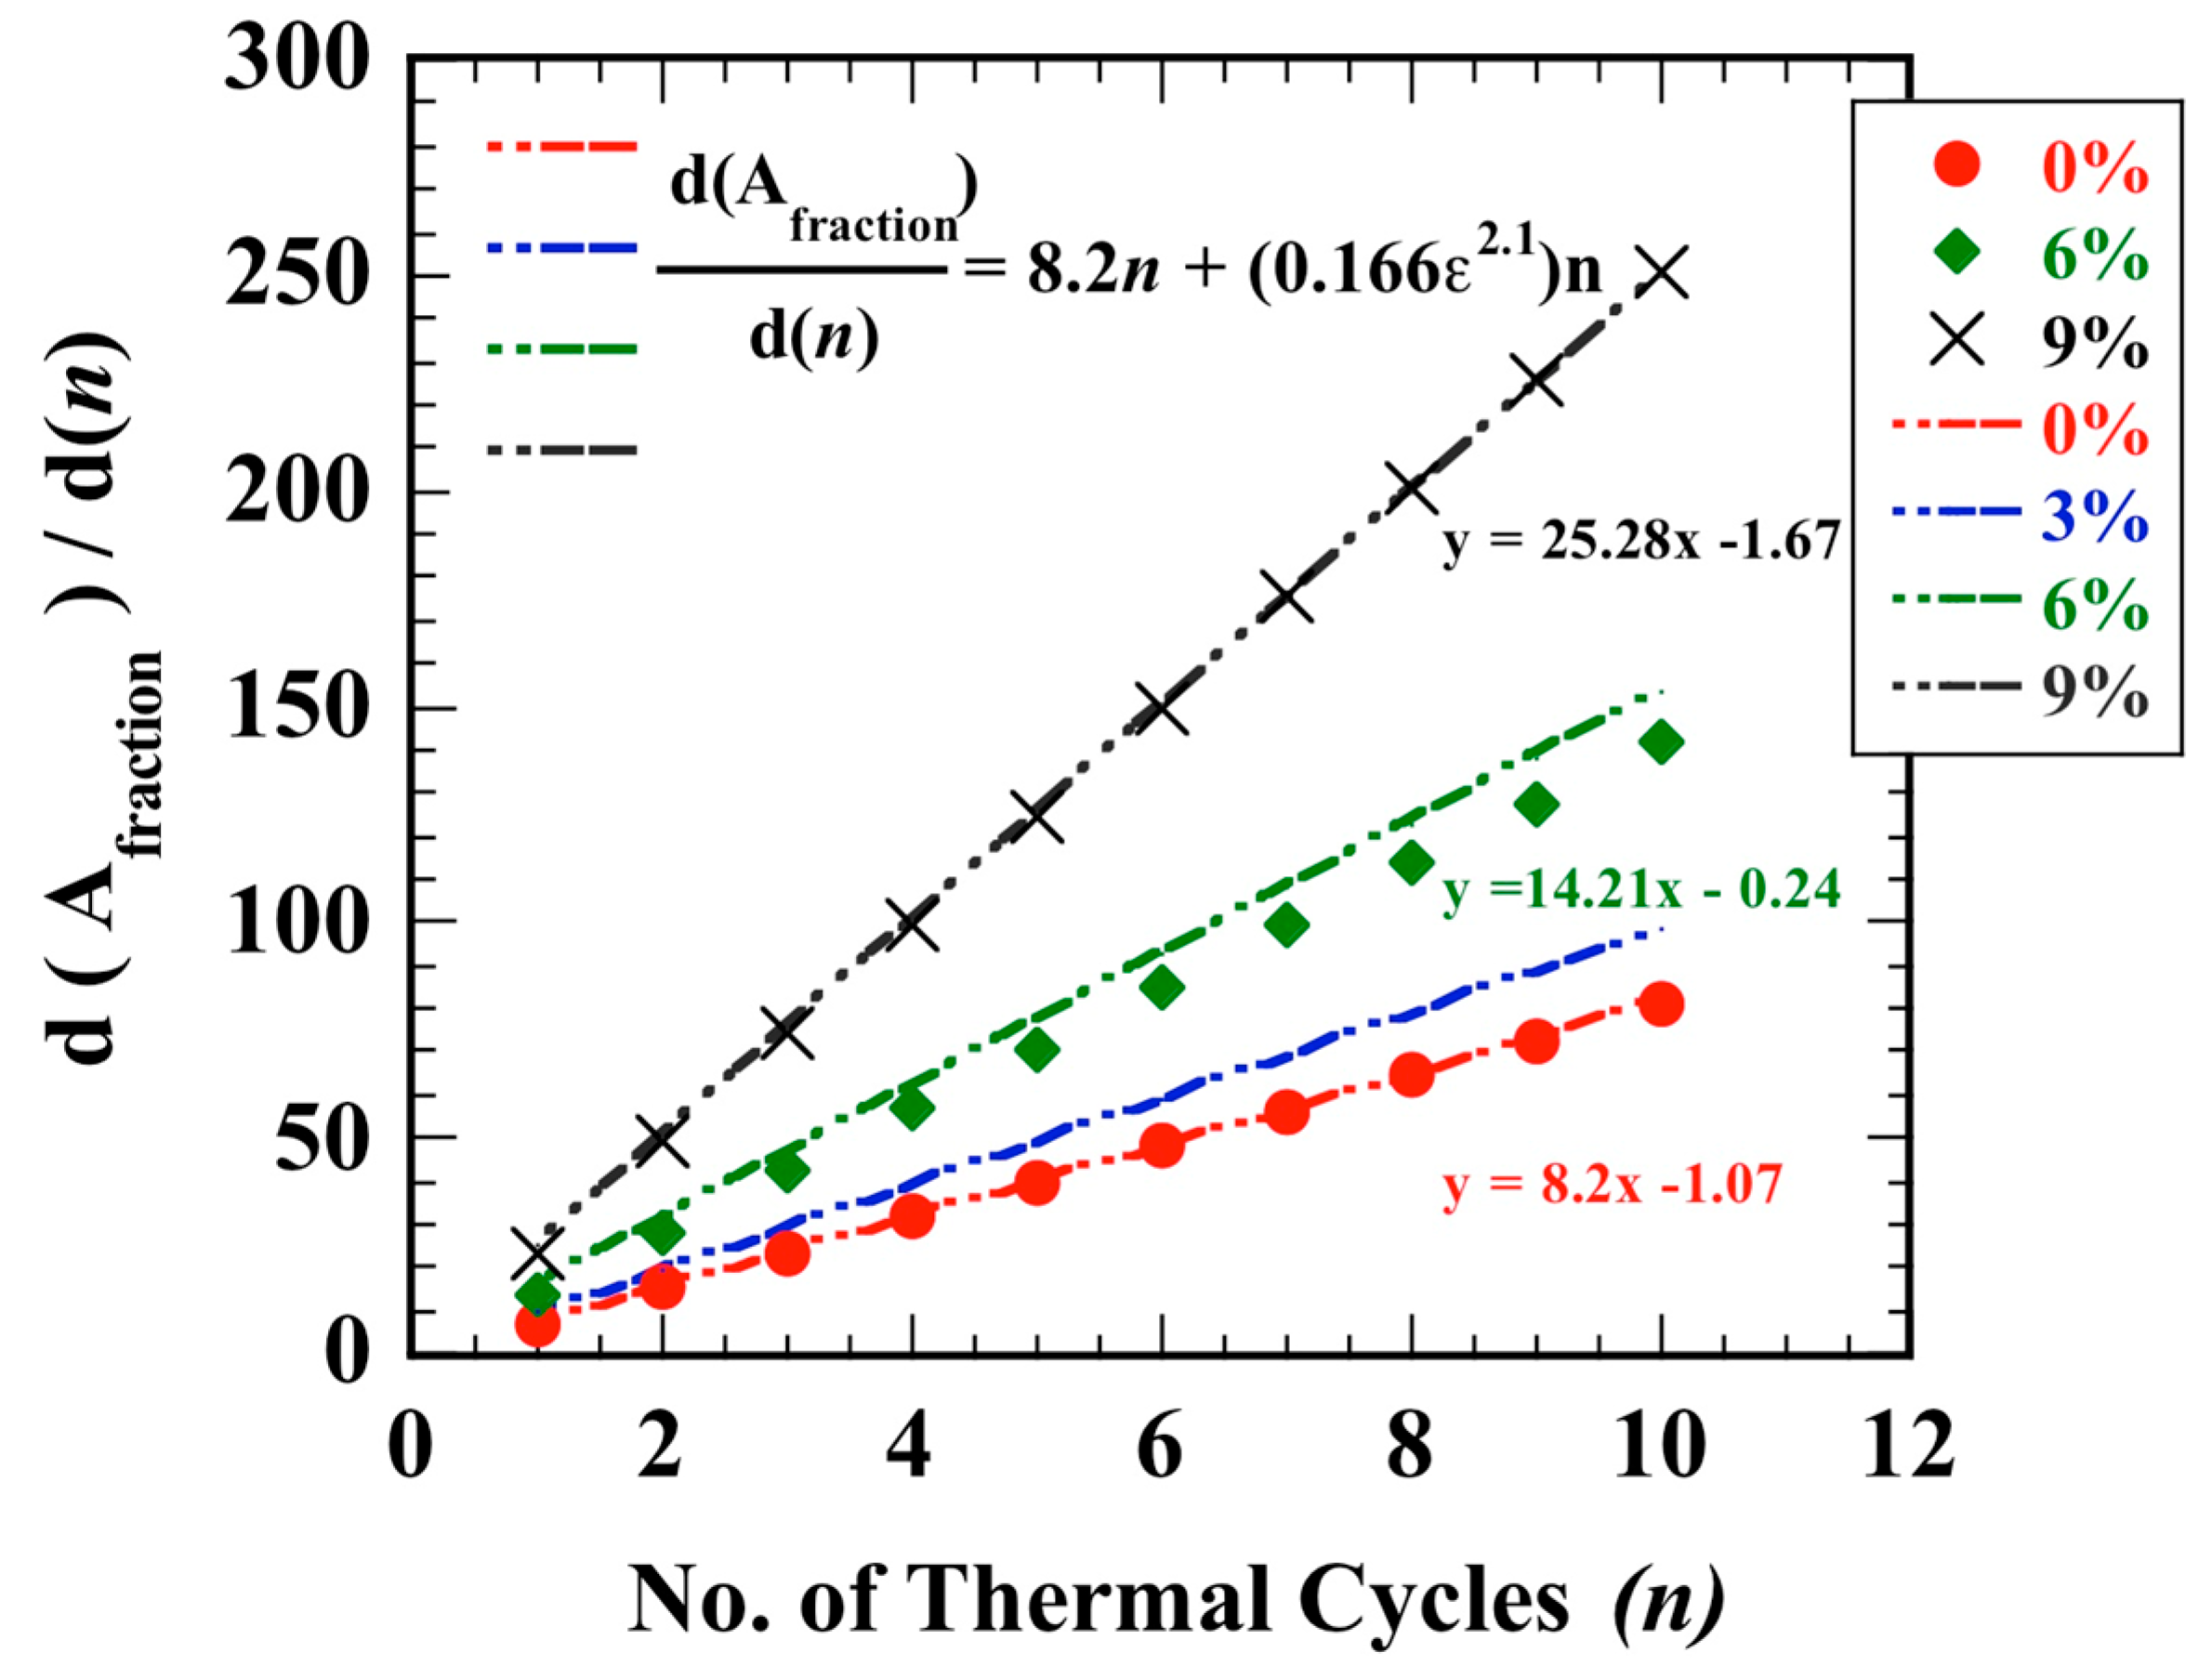
A predictive estimate for the rate of AGG area fraction advancement, as a function of repeated thermal cycles, was determined based on the derivative of the experimental area fraction measures. This estimate has the following form:
d   ( A fraction ) d ( n ) = C 1 n   +   ( C 2 ε α ) n ,
where for the experiments performed herein, C1 = 8.2, C2 = 1/6 and α = 2.1.
(4)
This numeric estimate indicates two notable implications:
i. 
Area fraction advancement rates for AGG in minimally strained, commercially pure Ni-200 proceed at unique rates for a given initial strain content;
ii. 
This advancement rate can be reasonably approximated across the low strain regime by the superposition of a nominal rate (where ε = 0) combined with the contribution of additional plastic strain (ε), modified by some prefactor value (C2), and scaled by an appropriate exponential (α).

Acknowledgments

Sandia National Laboratories is a multi-mission laboratory managed and operated by National Technology and Engineering Solutions of Sandia, Limited Liability Company (LLC), a wholly owned subsidiary of Honeywell International, Inc. for the U.S. Department of Energy’s National Nuclear Security Administration under contract DE-NA0003525. A subset of experiments for this work were supported by the National Science Foundation under Grant no. DMR-1151109. Compressive rolling was conducted at the Redstone Arsenal in Huntsville, AL, USA and the authors would like to thank Daniel Renner for initial metallographic preparation. Significant electron backscatter diffraction and annealing studies were conducted at the Center for Nanophase Materials Sciences, a U.S. Department of Energy, Office of Science and User Facility in Oak Ridge, TN, USA. The authors benefited greatly from the technical assistance of Donovan Leonard and James Kiggans and, the authors would also like to thank Rodney McCabe from Los Alamos National Laboratory for guidance in EBSD data processing. All other work was performed at Sandia National Laboratories and the authors would like to thank Alice Kilgo for sample preparation, Charles Walker for annealing studies, and Bonnie McKenzie and Joseph Michael for additional EBSD experiments. The late Professor Jeffrey L. Evans is also recognized for his initial motivation of these studies.

Author Contributions

Olivia D. Underwood and Jonathan D. Madison conceived and designed the experiments; Olivia D. Underwood performed the experiments and analyzed the data; Olivia D. Underwood, Jonathan D. Madison, and Gregory B. Thompson wrote the paper.

Conflicts of Interest

The authors declare no conflict of interest.

References

  1. Madison, J.D.; Spowart, J.E.; Rowenhorst, D.J.; Aagesen, L.K.; Thorton, K.; Pollock, T.M. Fluid flow and defect formation in the three-dimensional dendritic structure of nickel-based single crystals. Metall. Mater. Trans. A 2012, 43, 369–380. [Google Scholar] [CrossRef]
  2. Pollock, T.M.; Tin, S. Nickel-Based Superalloys for Advanced Turbine Engines: Chemistry, Microstructure, and Properties. J. Propuls. Power 2006, 22, 361–374. [Google Scholar] [CrossRef]
  3. Osorio, W.R.; Goulart, P.R.; Santos, G.A.; Neto, C.M.; Garcia, A. Effect of dendritic arm spacing on mechanical properties and corrosion resistance of Al 9 Wt Pct Si and Zn 27 Wt Pct Al alloys. Metall. Mater. Trans. A 2006, 37, 2525–2538. [Google Scholar] [CrossRef]
  4. Gabb, T.P.; Kantzos, P.T.; Palsa, B.; Telesman, J.; Gayda, J.; Sudbrack, C.K. Fatigue Failure Modes of the Grain Size Transition Zone in a Dual Microstructure Disk; John Wiley & Sons: New York, NY, USA, 2012; pp. 63–72. [Google Scholar]
  5. Flageolet, B.; Yousfi, O.; Dahan, Y.; Villechaise, P.; Cormier, J. Characterization of Microstructures Containing Abnormal Grain Growth Zones in Alloy 718; John Wiley & Sons: New York, NY, USA, 2012; pp. 594–606. [Google Scholar]
  6. Gabb, T.P.; Kantzos, P.T.; Gayda, J.; Sudbrack, C.K.; Palsa, B. Fatigue resistance of the grain size transition zone in a dual microstructure superalloy disk. Int. J. Fatigue 2011, 33, 414–426. [Google Scholar] [CrossRef]
  7. Randle, V.; Coleman, M. Grain growth control in grain boundary engineered microstructures. Mater. Sci. Forum 2012, 715–716, 103–108. [Google Scholar] [CrossRef]
  8. Holm, E.A.; Miodownik, M.A.; Rollett, A.D. On abnormal subgrain growth and the origin of recrystallization nuclei. Acta Mater. 2003, 51, 2701–2716. [Google Scholar] [CrossRef]
  9. Fang, S.; Dong, Y.P.; Wang, S. The abnormal grain growth of P/M nickel-base superalloy: Strain storage and CSL boundaries. Adv. Mater. Res. 2015, 1064, 49–54. [Google Scholar] [CrossRef]
  10. Watson, R.; Preuss, M.; Da Fonseca, J.Q.; Witulski, T.; Terlinde, G.; Buscher, M. Characterization of Abnormal Grain Coarsening in Alloy 718. MATEC Web Conf. 2014, 14, 1–5. [Google Scholar] [CrossRef]
  11. Brons, J.G.; Thompson, G.B. A comparison of grain boundary evolution during grain growth in FCC metals. Acta Mater. 2013, 61, 3936–3944. [Google Scholar] [CrossRef]
  12. Randle, V.; Booth, M.; Owen, G. Time evolution of sigma 3 annealing twins in secondary recrystallized nickel. J. Microsc. 2005, 217, 162–166. [Google Scholar]
  13. Kazaryan, A.; Wang, Y.; Dregia, S.A.; Patton, B.R. Grain growth in anisotropic systems: Comparison of effects of energy and mobility. Acta Mater. 2002, 50, 2491–2502. [Google Scholar] [CrossRef]
  14. Upmanyu, M.; Hassold, G.N.; Kazaryan, A.; Holm, E.A.; Wang, Y.; Patton, B.; Srolovitz, D.J. Boundary mobility and energy anisotropy effects on microstructural evolution during grain growth. Int. Sci. 2002, 10, 201–216. [Google Scholar]
  15. Homma, H.; Hutchinson, B. Orientation dependence of secondary recrystallization in silicon-iron. Acta Mater. 2003, 51, 3795–3805. [Google Scholar] [CrossRef]
  16. Lin, P.; Palumbo, G.; Harase, J.; Aust, K.T. Coincident site lattice (CSL) grain boundaries and goss texture development in Fe-3% Si Alloy. Acta Mater. 1996, 44, 4677–4683. [Google Scholar] [CrossRef]
  17. Watanabe, T. An approach to grain boundary design for strong and ductile polycrystals. J. Glob. 1984, 11, 47–84. [Google Scholar]
  18. Randle, V. Twinning-related grain boundary engineering. Acta Mater. 2004, 52, 4067–4081. [Google Scholar] [CrossRef]
  19. Underwood, O.D.; Madison, J.D.; Martens, R.L.; Thompson, G.B.; Welsh, S.L.; Evans, J.L. An examination of abnormal grain growth in low strain nickel-200. Metallogr. Microstruct. Anal. 2016, 5, 302–312. [Google Scholar] [CrossRef]
  20. Randle, V.; Horton, D. Grain growth phenomena in nickel. Scr. Metall. Mater. 1994, 31, 891–895. [Google Scholar] [CrossRef]
  21. Hillert, M. On the theory of normal and abnormal grain growth. Acta Metall. 1965, 13, 227–238. [Google Scholar] [CrossRef]
  22. Holm, E.A.; Hassold, G.N.; Miodownik, M.A. On misorientation distribution evolution during anisotropic grain growth. Acta Mater. 2001, 49, 2981–2991. [Google Scholar] [CrossRef]
  23. Rollett, A.D.; Srolovitz, D.J.; Anderson, M.P. Simulation and theory of abnormal grain growth-anisotropic grain boundary energies and mobilities. Acta Metall. 1989, 37, 1227–1240. [Google Scholar] [CrossRef]
  24. Rollett, A.D.; Mulins, W.W. On the growth of abnormal grains. Scr. Mater. 1997, 36, 975–980. [Google Scholar] [CrossRef]
  25. Thompson, C.V.; Frost, H.J.; Spaepen, F. The relative rates of secondary and normal grain growth. Acta Metall. 1987, 35, 887–890. [Google Scholar] [CrossRef]
  26. Sztwiertnia, K. Recrystallization textures and the concept of oriented growth revisited. Mater. Lett. 2014, 123, 41–43. [Google Scholar] [CrossRef]
  27. Jensen, D.J. Growth rates and misorientation relationships between growing nuclei/grains and the surrounding deformed matrix during recrstalization. Acta Metall. Mater. 1995, 43, 4117–4129. [Google Scholar] [CrossRef]
  28. Akhiani, H.; Nezakat, M.; Sonboli, A.; Szpunar, J. The origin of annealing texture in a cold-rolled incoloy 800H/Ht after different strain paths. Mater. Sci. Eng. 2014, 619, 334–344. [Google Scholar] [CrossRef]
  29. Akhiani, H.; Nezakat, M.; Szpunar, J.A. Evolution of deformation and annealing textures in incoloy 800H/HT via different rolling paths and strains. Mater. Sci. Eng. 2014, 614, 250–263. [Google Scholar] [CrossRef]
  30. Wilson, A.W.; Madison, J.D.; Spanos, G. Determining phase volume fraction in steels by electron backscattered diffraction. Sci. Mater. 2001, 45, 1335–1340. [Google Scholar] [CrossRef]
  31. Sahay, S.S.; Malhotra, C.P.; Kolkhede, A.M. Accelerated grain growth behavior during cyclic annealing. Acta Mater. 2003, 51, 339–346. [Google Scholar] [CrossRef]
  32. Decker, R.F.; Rush, A.I.; Dano, A.G.; Freeman, J.W. Abnormal Grain Growth in Nickel-Base Heat-Resistant Alloys; University of North Texas: Denton, TX, USA, 1957. [Google Scholar]
  33. He, G.; Tan, L.; Liu, F.; Huang, L.; Huang, Z.; Jiang, L. Unraveling the formation mechanism of abnormally large grains in an advanced polycrystalline nickel base superalloy. J. Alloys Compd. 2017, 718, 405–413. [Google Scholar] [CrossRef]
  34. He, G.; Liu, F.; Huang, L.; Huang, Z.; Jiang, L. Controlling grain size via dynamic recrystallization in an advanced polycrystalline nickel base superalloy. J. Alloys Compd. 2017, 701, 909–919. [Google Scholar] [CrossRef]
  35. He, G.; Tan, L.; Liu, F.; Huang, L.; Huang, Z.; Jiang, L. Revealing the role of strain rate during multi-pass compression in an advanced polycrystalline nickel base superalloy. Mater. Charact. 2017, 128, 123–133. [Google Scholar] [CrossRef]
  36. Cho, Y.K.; Yoon, D.Y.; Henry, M.F. The Effects of deformation and pre-heat treatment on abnormal grain growth in RENÉ 88 superalloy. Metall. Mater. Trans. A 2001, 32, 3077–3090. [Google Scholar] [CrossRef]
  37. Bozzolo, N.; Agnoli, A.; Souai, N.; Bernacki, M.; Loge, R.E. Strain induced abnormal grain growth in nickel base superalloys. Mater. Sci. Forum 2013, 753, 321–324. [Google Scholar] [CrossRef]
Figure 1. Samples were thermomechanically processed using a (a) rolling mill and (b) tube furnace.
Metals 07 00334 g001
Figure 2. Cyclic annealing schedule with increasing isothermal dwelling anneals used in this study. (Reproduced with permission from [19], © 2016 ASM International and Springer Science + Business Media New York, 2016; EBSD: Electron backscatter diffraction.)
Metals 07 00334 g002
Figure 3. Baseline grain boundary metrics for unstrained, commercially pure Ni-200. (a) Grain area fraction distribution; (b) electron backscatter diffraction (EBSD) grain contrast map; (c) grain orientation map with inverse pole figure (IPF); (d) orientation distribution function map and (e) pole figure. (Orientations reported with respect to the rolling direction (RD), normal direction (ND) and transverse direction (TD) for (ce); Adapted with permission from [19], © 2016 ASM International and Springer Science + Business Media New York, 2016.)
Metals 07 00334 g003
Figure 4. EBSD progression maps for 0% (af), 3% (gj), 6% (kn), and 9% (oq) induced strain following annealing treatments ranging from 700 °C to 800 °C. Abnormally large grains are outlined in black. (Orientation is shown with respect to the rolling direction (RD); Adapted with permission from [19], © 2016 ASM International and Springer Science + Business Media New York, 2016.)
Metals 07 00334 g004
Figure 5. Inverse pole figure maps for 0% (af), 3% (gj), 6% (kn), and 9% (oq) induced strain following annealing treatments ranging from 700 °C to 800 °C. White circles indicate the location of abnormally large grains. Orientation is shown with respect to the rolling direction (RD).
Metals 07 00334 g005
Figure 6. AGG (abnormal grain growth) identification progression maps for 0% (af), 3% (gj), 6% (kn), and 9% (oq) induced strain following annealing treatments ranging from 700 °C to 800 °C. (Orientation is shown with respect to the rolling direction (RD); Adapted with permission from [19], © 2016 ASM International and Springer Science + Business Media New York, 2016.)
Metals 07 00334 g006
Figure 7. Area fraction of abnormally growing grains for 0%, 3%, 6%, and 9% induced strain as a function of (a) temperature and (b) thermal cycle.
Metals 07 00334 g007
Figure 8. Rate of abnormal grain growth for low strained Ni-200 as a function of the number of thermal annealing cycles.
Metals 07 00334 g008
Table 1. Emergence and progression rates for abnormally growing grains.
ε (%)EmergenceProgressionProgression/Emergence
Δ (Area Fraction n = 1–0)Δ (Area Fraction n = 2–1)
03.0311.233.71
3-17.12-
67.3421.552.93
910.9736.253.30

