1. Introduction
A large number of scientific works addresses the use of titanium and its alloys in the biomedical field. Titanium, in fact, is considered a suitable biocompatible material since: (i) it is relatively inert and has a good corrosion resistance, (ii) it absorbs proteins from the biological fluids, and (iii) its surface supports growth and cell differentiation of osteoblastic cells that lead to new bone formation [
1]. The increasing interest in biomedical applications of titanium can be associated with some specific properties, which can be summarized as in the following [
1]:
The spontaneous formation in the presence of air and blood of a passivating film of highly biocompatible titanium dioxide, which gives the implant excellent quality for direct contact with the local tissue.
The corrosion resistance in air and aggressive media, a property that has a significant influence on the long-term reliability of implants.
The ability to influence redox reactions prosthesis–tissue interface that modulates cell and tissue behavior.
An improvement, compared with steel and chrome-cobalt alloys, in the images of NMR (Nuclear Magnetic Resonance) and CT (Computed Tomography).
40% lighter than steel, which makes the titanium implants useful tools for microsurgery.
No allergic reactions in patients.
A great effort is still employed to modify the surface of titanium items to obtain an increased corrosion resistance, a superior bioactivity and antibacterial properties [
2,
3,
4,
5]. As a consequence, a significant number of scientific papers, in recent years, concerns, among others, the rise of oxide layer thickness to increase corrosion resistance in biological fluids [
6], the formation of apatite-like layers for bioactivity [
7], the use of plasma electrolytic oxidation to obtain surfaces that allow a better osseointegration [
8], the study of surface topography to increase the actual surface exposed and appropriate roughness [
9,
10] and so on. Recently, several research projects addressed the growth of TiO
2 nanotubes on Ti samples, revealing strong fortification of osseointegration, improved samples bioactivity and improved osteoblast adhesion [
11,
12,
13,
14,
15,
16,
17] as well as the possibility of their use as an anti-inflammatory and/or recovery of antibiotic substances for controlled drug delivery [
18,
19,
20]. Titania nanotubes could also promote apatite-like deposition; in fact, annealing, by using appropriate temperature, can induce amorphous to anatase phase transformation, allowing some antibacterial activity and improved hydroxyapatite deposition [
21].
Despite the broad field of applications and the use of several techniques used for their characterization, less attention has been paid to the use of electrochemical impedance spectroscopy (EIS) to study titanium samples modified by TiO
2 nanotubes growth in simulated body fluid (SBF) like Hank’s solution. EIS has been used since the early 1990s to characterize a broad spectrum of materials, like electrical conductive and non-conductive medium, coated and uncoated samples, to determine, i.e., the protective properties of coatings, the effectiveness of surface treatments, the capacity in batteries and so on [
22,
23,
24]. EIS analysis can be used to model the systems under study applying electrical equivalent circuits that provide an electrical behaviour “equivalent” to that of the material to be characterized. For some applications of EIS, the electrical equivalent circuits are well defined. It is widely accepted, i.e., that the modelling of an unpainted metal, when exposed to an aggressive environment, can be displayed by using a Randles equivalent circuit [
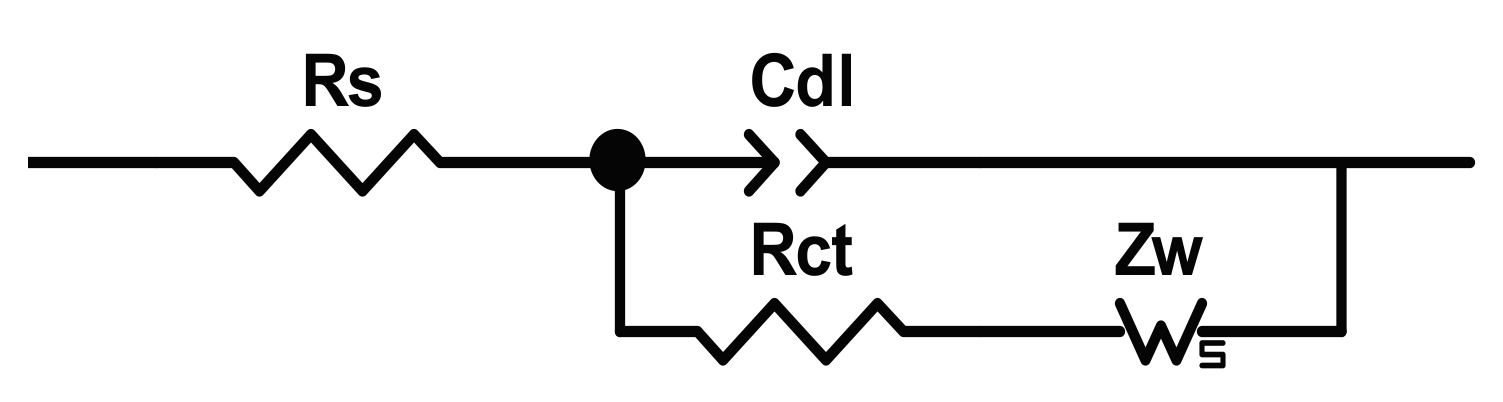
25] (named in honour of John Edward Brough Randles) reported in
Figure 1, where some linear electrical components are placed in series/parallel to simulate the electrochemical behaviour of the system and to estimate the values of the solution resistance,
Rs, the double layer capacitor,
Cdl, the charge transfer or polarization resistance,
Rct, and the reactants/products diffusion impedance,
Zw.
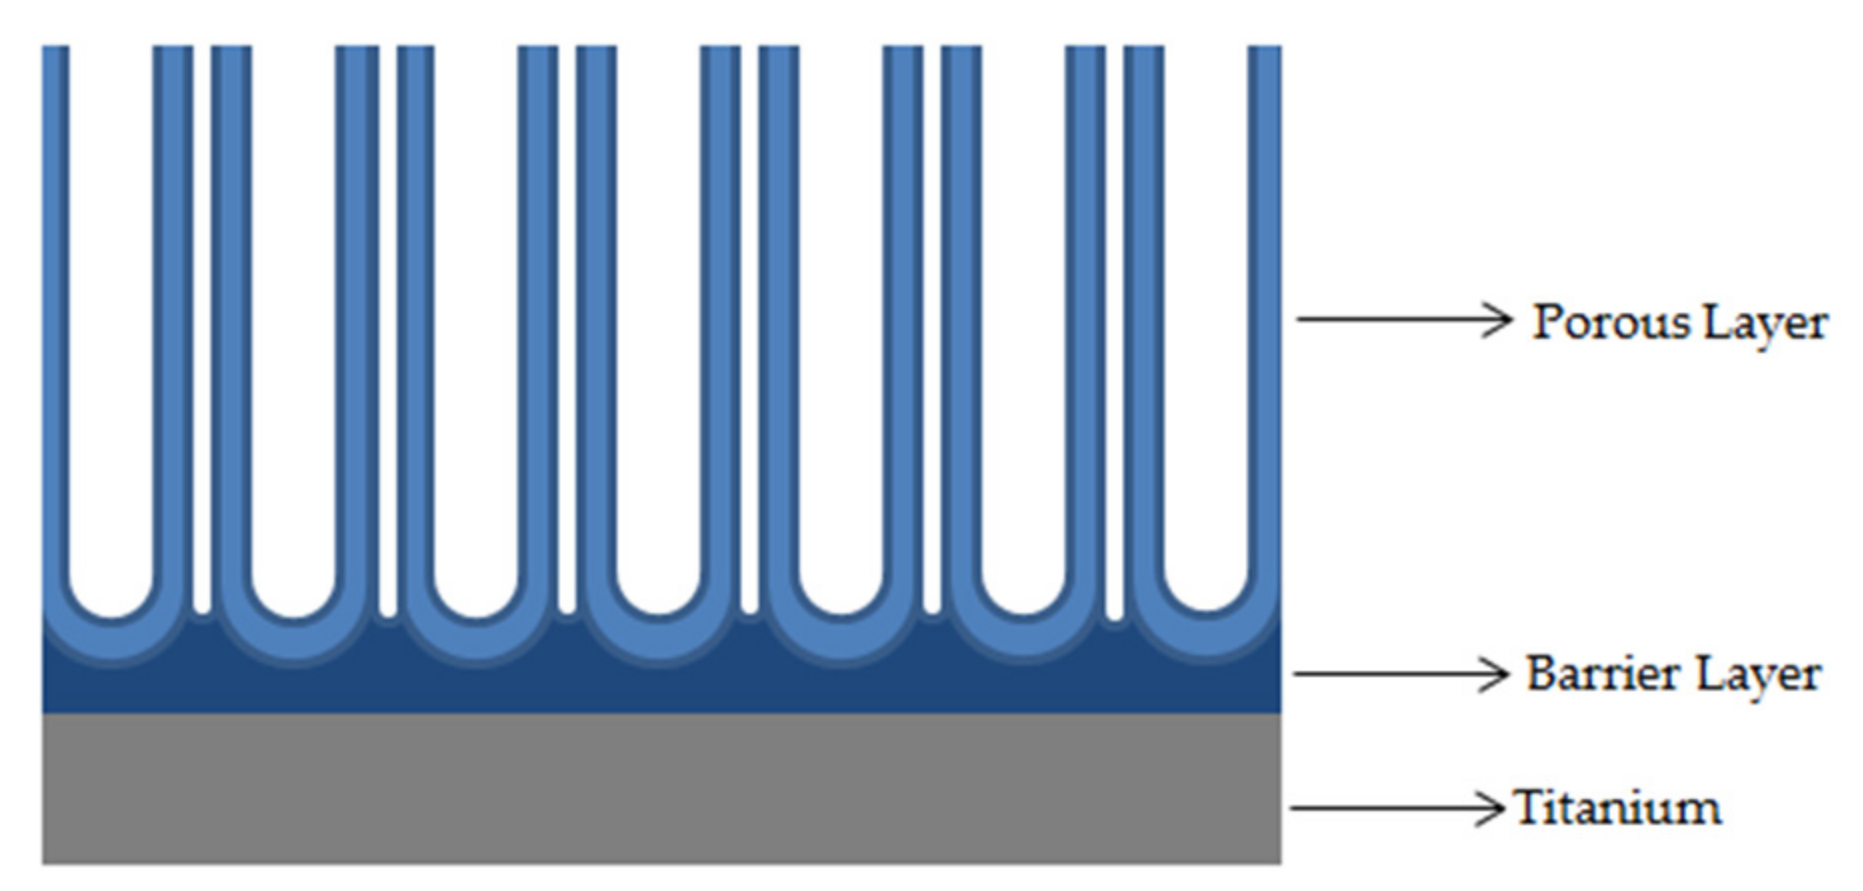
A sketch of the nanotubes layer formed on titanium sheet is reported in the
Figure 2. The structure is characterized by the presence of an outer ordinated porous layer (the nanotubes) and an inner compact layer(the barrier layer).
For such kind of complex systems, the analysis of experimental data can be tough to elaborate via EIS, due to the signals overlapping coming from simultaneous phenomena connected with transformation and processes occurring in the sample under testing. For these reasons, researchers can utilize different equivalent circuit models to investigate systems and processes, which can be considered very similar. Part of this paper is devoted to a short literature review on this topic.
The analysis of the literature shows that different models of electrical equivalents circuits have been used when evaluating the properties of titania nanotubes stored in Hank’s solution. Typically, each author uses different symbols to indicate the elements of the electrical circuit employed to simulate a real system. If “R” is usually used to indicate an electrical pure resistance, and C, is the symbol used to designate a pure capacitor, several symbols are used to specify a constant phase element (CPE). When a capacitor shows a non-ideal behavior, a new type of circuit element can be introduced. It is named “constant phase element” for which acronyms, such as CPE, or synonyms QPE or Q, are used. In the following, to avoid confusing the reader, the acronyms used for indicating the circuit elements are those reported by authors in their original papers.
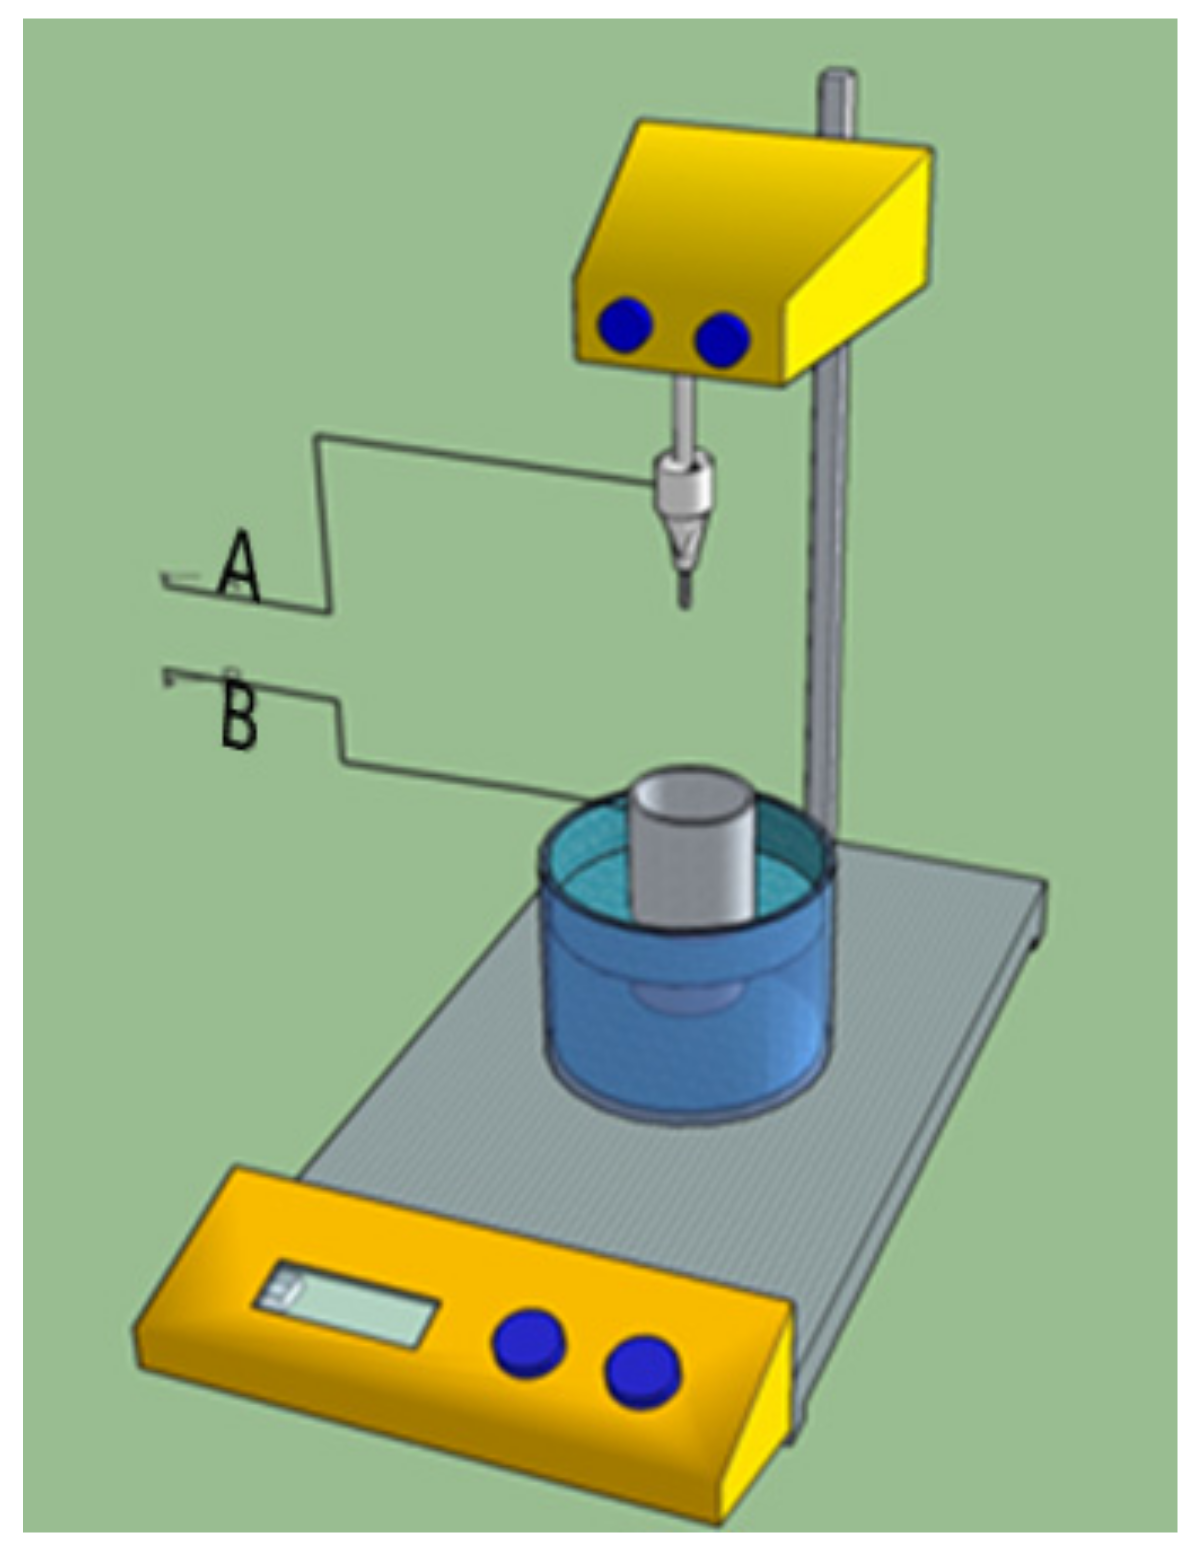
Yu et al. [
26] have grown titania nanotubes on flat samples, made in Ti (99.5%), obtaining nanotubes 400 nm in length and 80 nm in diameter. Titanium oxide nanotubes were formed by anodization in a 0.5 wt. %. Hydrofluoric acid (HF) aqueous solution at 20 V for 1 h. Three types of samples were studied: (i) smooth-Ti, (ii) amorphous layer of nanotubes and (iii) anatase layer of nanotubes. The latter were obtained annealing the amorphous sample at 450 °C for 3 h. The electrochemical characterization of samples was conducted in Hank’s solution at 37 °C, after 30 min of the open circuit potential measurement, by using the standard three electrodes configuration (titanium specimens as working electrode, platinum and saturated calomel electrode (SCE) as counter electrode and reference electrode, respectively) and recording the data in a frequency range from 100 kHz to 10 mHz.
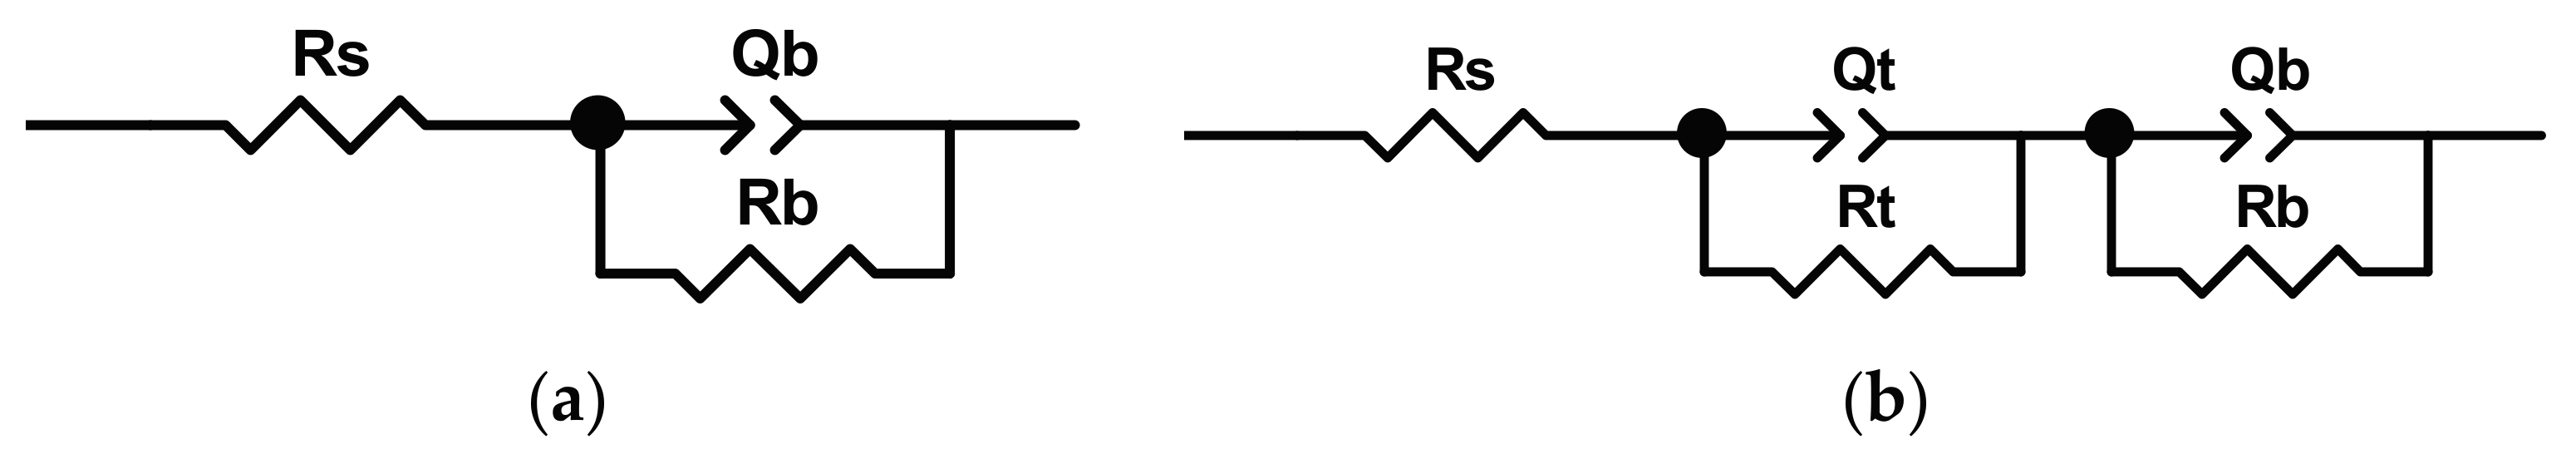
The equivalent circuit model (reported in
Figure 3a) utilized for the analysis of “smooth” sample is composed of a one-time constant circuit, represented as
Rs(
RbQb)
, which is usually used for a passive oxide layer. In the model,
Rs takes into account the electrolyte resistance,
Rb the resistance of the oxide layer, while
Qb is the constant phase elements (
CPE) of double layer formed on the oxide layer. The model used to study the sample covered by nanotubes (
Figure 3b) is composed by two-time constants, represented as
Rs(
RtQt)(
RbQb). The resistance
Rs assumes the same meaning as seen before, while
Rt and
Qt are, respectively, the resistance and the CPE of the nanotube layer.
Rb and
Qb represent the resistance and the
CPE of the barrier layer. By using the reported models, they obtained an excellent fit quality (the fitted values are shown in
Table 1). They found that the corrosion resistance of sample with nanotubes was higher if compared with the sample without nanotubes, due to the higher value of
Rb calculated for nanotube covered samples, as evidence of a thicker oxide layer existing in the anodized specimen. Comparing amorphous and annealed samples, the results showed that the annealing had little effect on the corrosion resistance of the inter-barrier layer (
Rb) for nanotube layers, but it has a significant effect on the corrosion resistance of the outer tube layer (
Rt). This latter effect was attributed to the change of crystallographic structure (from amorphous to anatase) and to the closure of some pores that increases the oxide thickness.
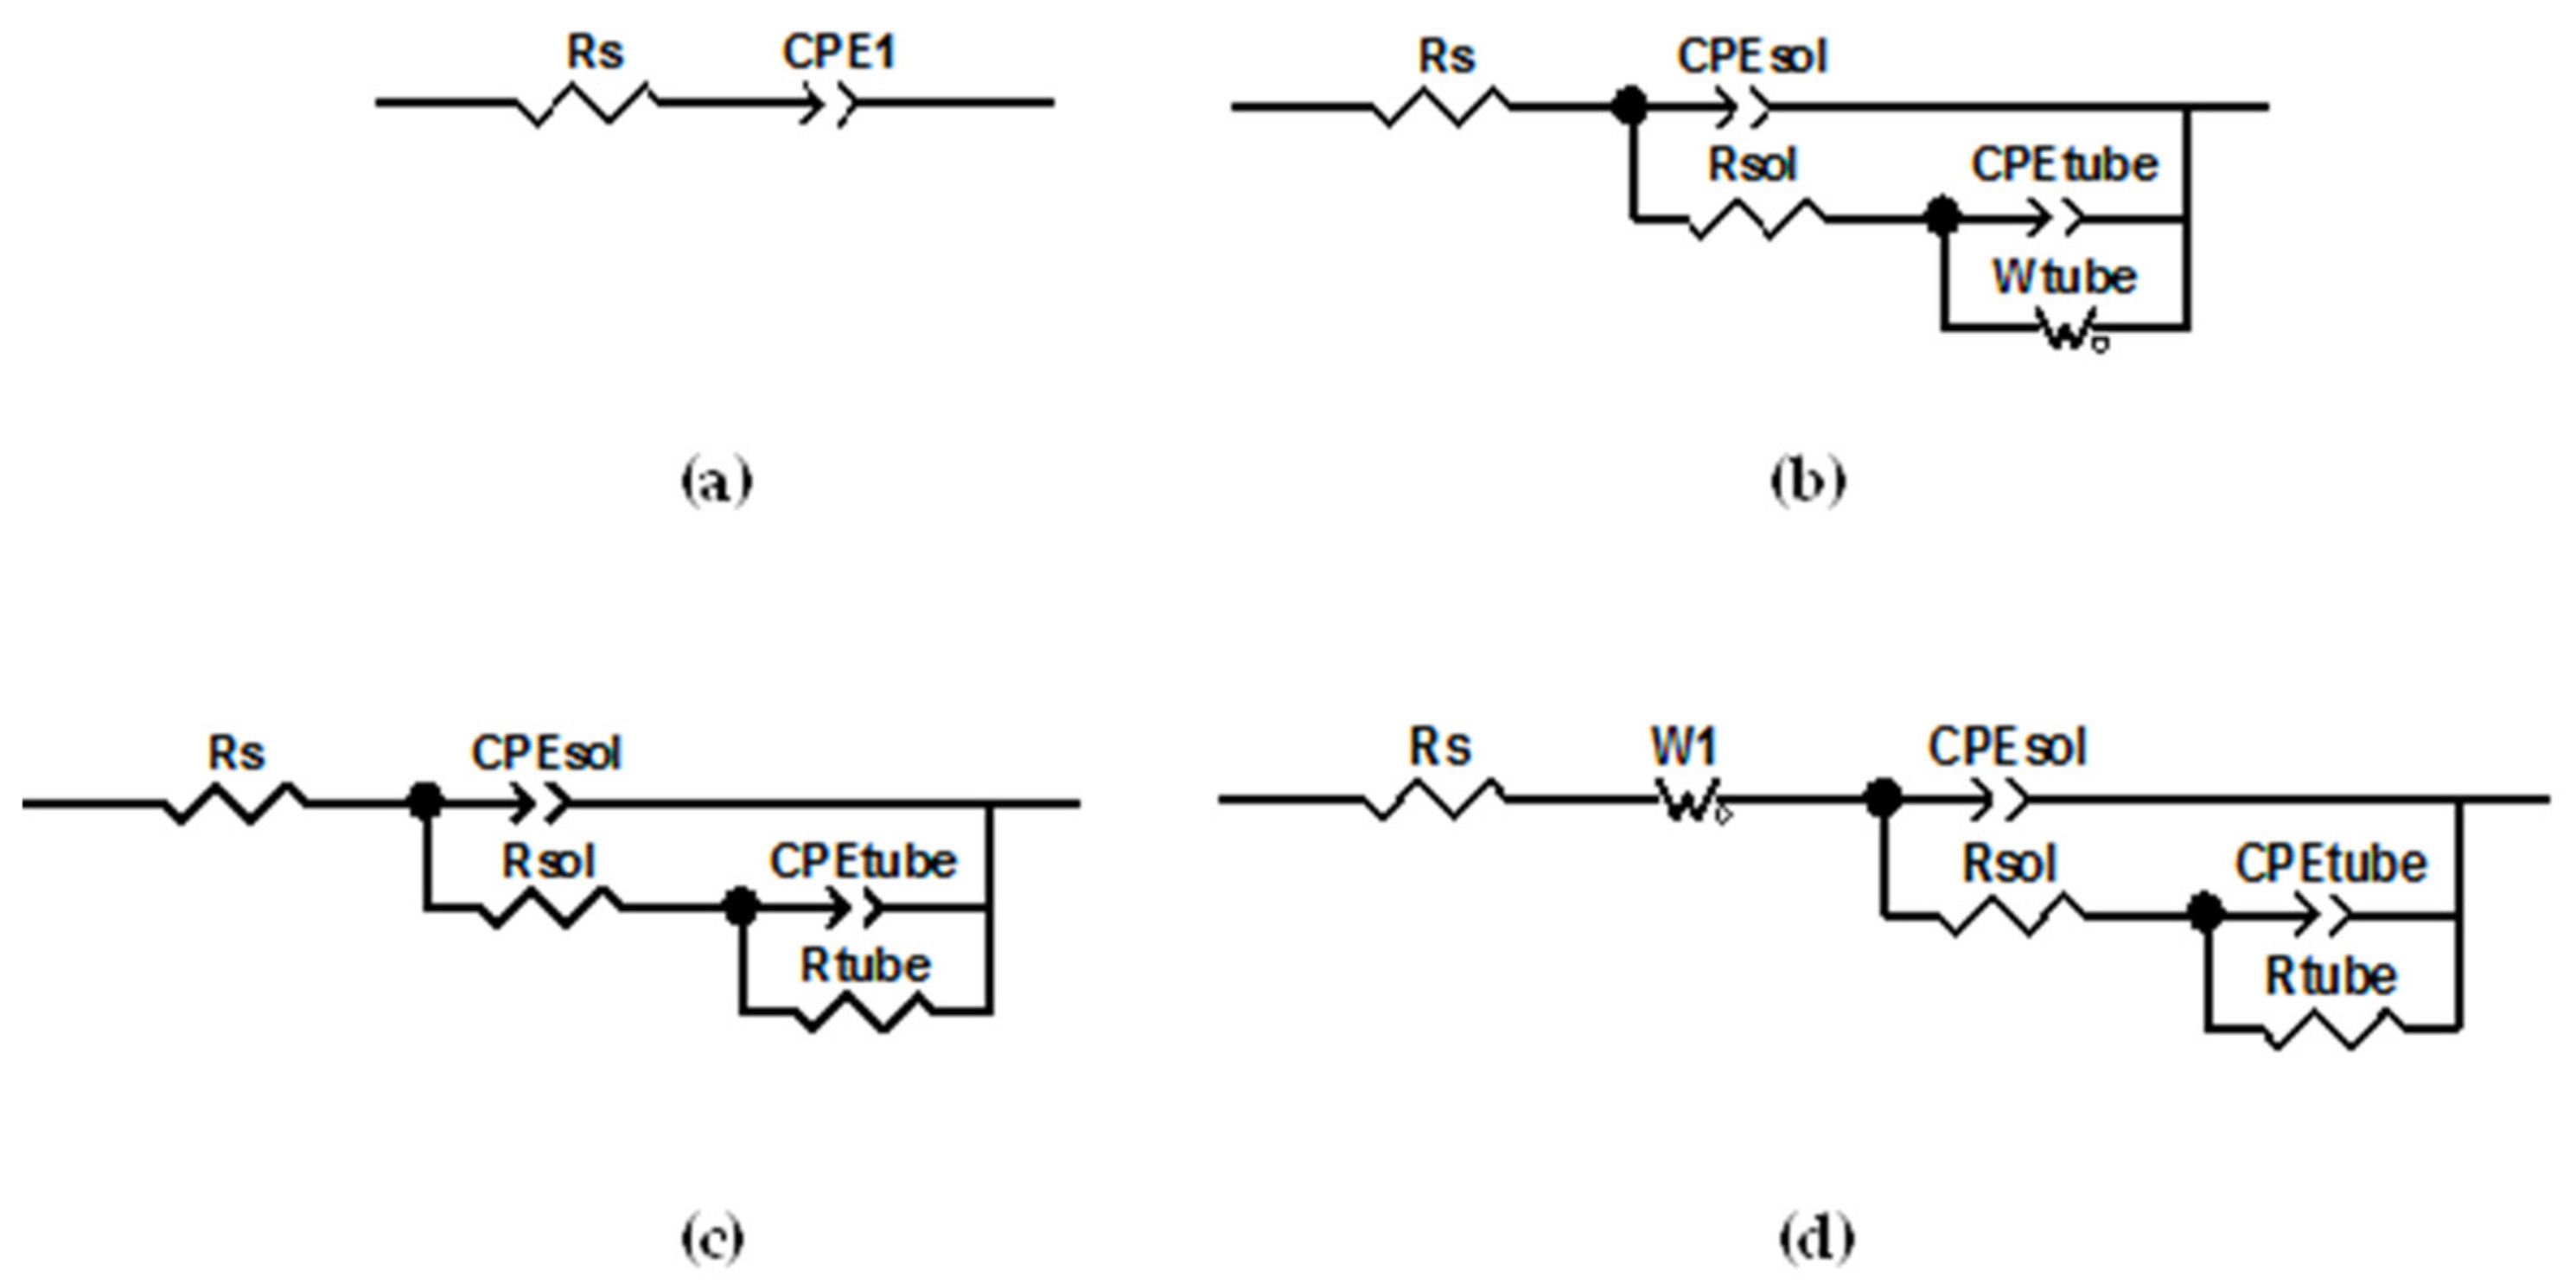
Wen and others [
27] utilized Ti CP2 discs (14 mm in diameter, the thickness of 4.0 mm) annealed in an oven at 800 °C. The polished discs (#1500 grit SiC paper with 0.5 mm Al
2O
3 powder) were anodized at 15 V for 2 h in a water solution containing 1.2% HF and 10% H
2SO
4, in order to obtain amorphous titania nanotubes, subsequently annealed at 450 °C for 3 h, obtaining anatase crystallographic structure. The nanotubes diameter was 100 nm, the wall thickness 20 nm and the length of 1.5 µm. The electrochemical characterization of samples was performed by using Hank’s solution at 37 °C, for one day and two weeks, in the classical three electrodes configuration as defined before, measuring the data in a frequency range from 10 kHz down to 0.1 Hz. In the paper, various equivalent circuits have been used to take into account the change due to the storage in Hank’s solution for two weeks. The equivalent circuit models used for titanium “original,” amorphous and anatase nanotubes are reported in
Figure 4. The authors employed, considering the anatase nanotubes sample, a model utilized by Aziz-Kerzzo et al. [
28] to study experimental data obtained from titanium samples treated with H
2O
2. Aziz-Kerzzo found that the H
2O
2 treatment of Ti surface resulted in the formation of a porous layer on the specimen. By analogy, Wen [
27] has used the same model to study the Ti surface covered by nanotubes. The electrical equivalent elements used are:
Rs, as the solution resistance,
CPE1 as the constant phase element of the titanium substrate,
CPEsol and
Rsol as the constant phase element and resistance from the inside content of the nanotubes, while
CPEtube and
Wtube are the constant phase element and Warburg diffusion of the nanotubes and
W1 is Warburg diffusion element in series with the solution resistance. Anyway, it is interesting to note that they introduced a diffusivity parameter to take into account diffusion of some ions (Cl
− and Na
+) in the structure.
By using the reported models, Wen [
27] obtained an excellent fit quality (
Table 2). They found instability of amorphous nanotubes regarding a significant variation of impedance modulus at prolonged immersion, while, at the same time, a high stability of anatase nanotubes due to higher impedance values. No indication of the formation of calcium/ phosphorus containing compounds and of apatite-like layers has been reported on amorphous or annealed nanotubes. The change of the equivalent circuit used to model the data cannot permit a comparison between the values of the parameter found.
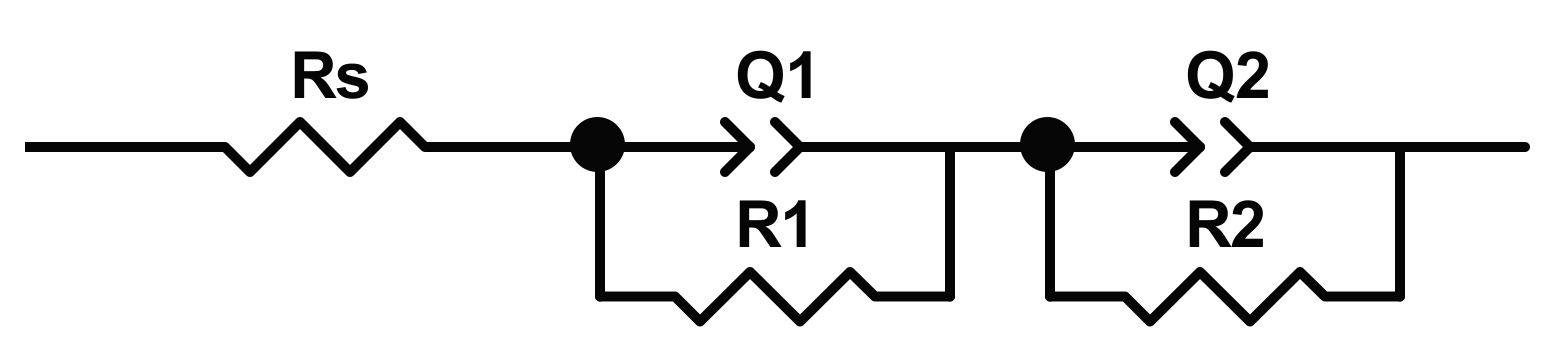
Al-Mobarak and Al-Swayih [
29], following Liu [
30], produced titanium nanotubes in three kinds of solutions to obtain nanotubes showing different diameters, varying from 52 to 93 nm, and different length nanotubes, from 250 to 1200 nm. The samples, made of titanium foil (99.5%), were anodized at 20 V for 30 min in the electrolyte made of 1 M Na
2SO
4 and 0.5 wt % NaF (1 solution), or 1 M H
3PO
4 and 0.8 wt % NaF (2 solution), or 0.5 wt % HF (3 solution). The electrochemical measurement was performed in Hank’s solution at 37 °C, after 60 min of the open circuit potential measurement. The EIS analysis was carried out in a frequency range from100 kHz to of 10 mHz, by using the conventional electrochemical cell. The EIS spectra are interpreted by using a model with two-time constants (shown in
Figure 5),
Rs(
R1Q1)(
R2Q2), in which
Rs is the solution resistance,
R1 and
Q1 are the resistance and the constant phase element of outer nanotube layer,
R2 and
Q2 are the resistance and constant phase element of the inner barrier layer. The results of modeling are reported in
Table 3. The authors assert that: (i) titanium as pristine present two time constants due to the presence of an oxide layer made of a compact passive barrier layer and an outer porous layer; (ii) the diameter dimension affects the electrochemical stability of the nanotubes, in particular, a large diameter leads to decreased corrosion resistance, since nanotubes larger in diameter may include a greater volume of electrolyte, increasing the possibility that corrosion phenomenon can occur.
Al-Swayih [
31] produced titanium nanotubes with diameter from 22 to 75 nm, length from 200 to 830 nm. The samples, made of titanium foil (99.5%), were anodized at 20 V for 30 min in three kinds of electrolyte solutions (inorganic, organic and hybrid one) made of 1 M (NH
4)
2SO
4 and 0.5 wt % NH
4F (A), or a mixture of glycerol and water (50:50 vol %) and 0.5 wt % NH
4F (B), or glycerol and 0.5 wt % NH
4F (C). The electrochemical measurement was performed in Hank’s solution at 37 °C, after 60 min of the open circuit potential measurement. The EIS analysis was conducted in a frequency range of 10
5 Hz to 10 mHz, using the conventional electrochemical cell. The EIS spectra are interpreted by using a model with two-time constants (reported in
Figure 6)
R1(
R1Q1)(
R2Q2), in which
Rs is the solution resistance,
R1 and
Q1 are the resistance and the constant phase element of outer nanotube layer, and
R2 and
Q2 are the resistance and constant phase element of the inner barrier layer.
Authors highlighted [
31] the influence of the electrolyte composition on the nanotubes morphology and, consequently, on their corrosion resistance. In particular, nanotubes anodized in a hybrid solution exhibited a higher corrosion resistance, as indicated by
R2 value (reported in
Table 4). In addition, organic components in the solution can facilitate the formation of the well-ordered TiO
2 nanotubes array, while solutions containing only glycerol suppress the formation of nanotubes structures.
Mohan et al. [
32,
33] have investigated the electrochemical behaviour of titania nanotubes in Hank’s solution, starting from Ti–6Al–7Nb or Ti6Al4V alloys, which although being an interesting application, it is beyond the scope of this paper.
In summary, four papers have used a series/parallel type circuit to describe the nanostructured surface in Hank’s solution, while two others have used a dual oxide layer model (
Rs(
R1Q1)(
R2Q2)
, as reported in
Figure 6. All claim to have obtained very good results from the fitting procedure. The reason why such different equivalent circuits provide an excellent description of nanotubes behavior in Hank’s solution is not clear. For example, the diameter and the length of nanotubes do not seem to be relevant variables; in fact, Al-Swayih [
31] produced nanotubes varying from 22 to 75 nm in diameter and from 200 to 830 nm in length by using the two-time constants model. Wen [
27] found the best fit by using a model containing a Warburg element, when analyzing nanotubes 100 nm in diameter. Al-Mobarak [
30], studying nanotubes varying from 52 to 93 nm in diameter and 250 to 1200 nm in length, did not have this need. On the other hand, due to the lack of works available in the field, it is not possible to perform a statistical analysis of the results, in order to find a correlation between the chemical/physical properties of the nanotubes and the electrical equivalent circuit models used. The modeling of the experimental data by using the transmission line model (TLM) could be a useful way to provide a better understanding of the phenomena involved on the Ti surface. Up to today, few papers have been published using this approach as in [
34], as we know no one utilizes this method to monitor the apatite-like compounds formation on the Ti surface. Our target is to utilize it and show the results in the next paper of this series.
The experimental results obtained in the present test campaign have been evaluated taking into account both the previous analysis of the literature and the goodness of fitting procedure. Our experimental data have been tested by using several equivalents circuits. Best fitting was obtained by using the dual oxide layer model.
3. Results and Discussion
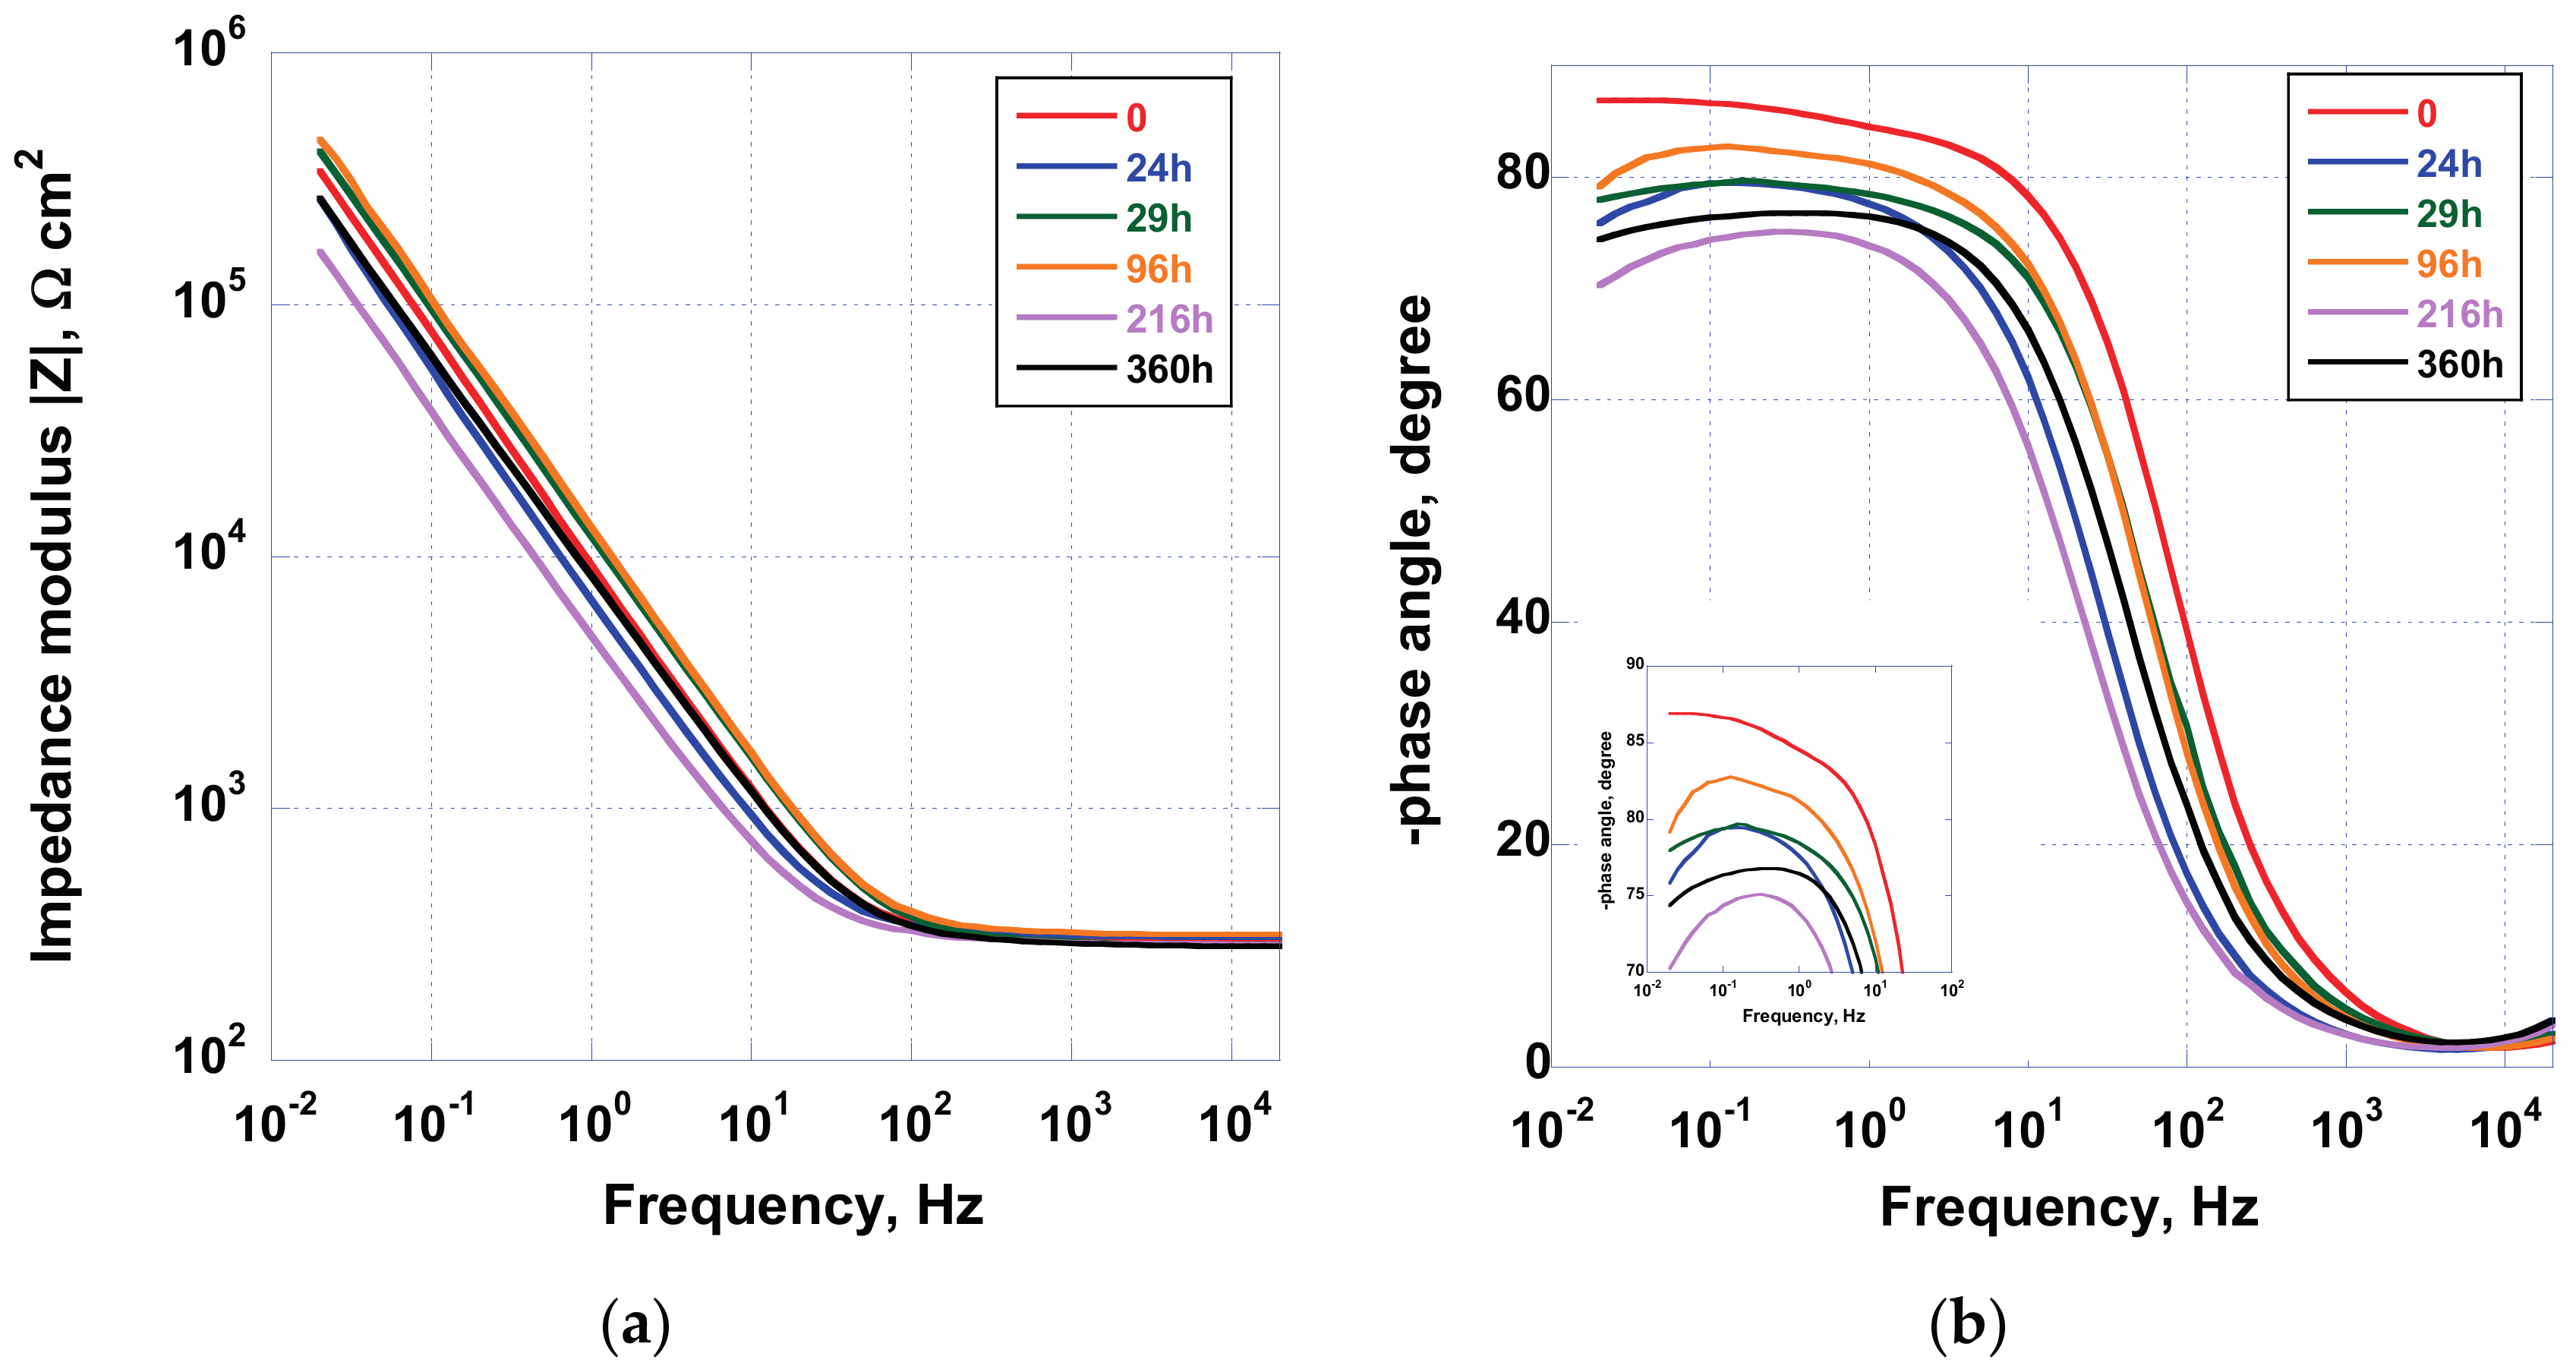
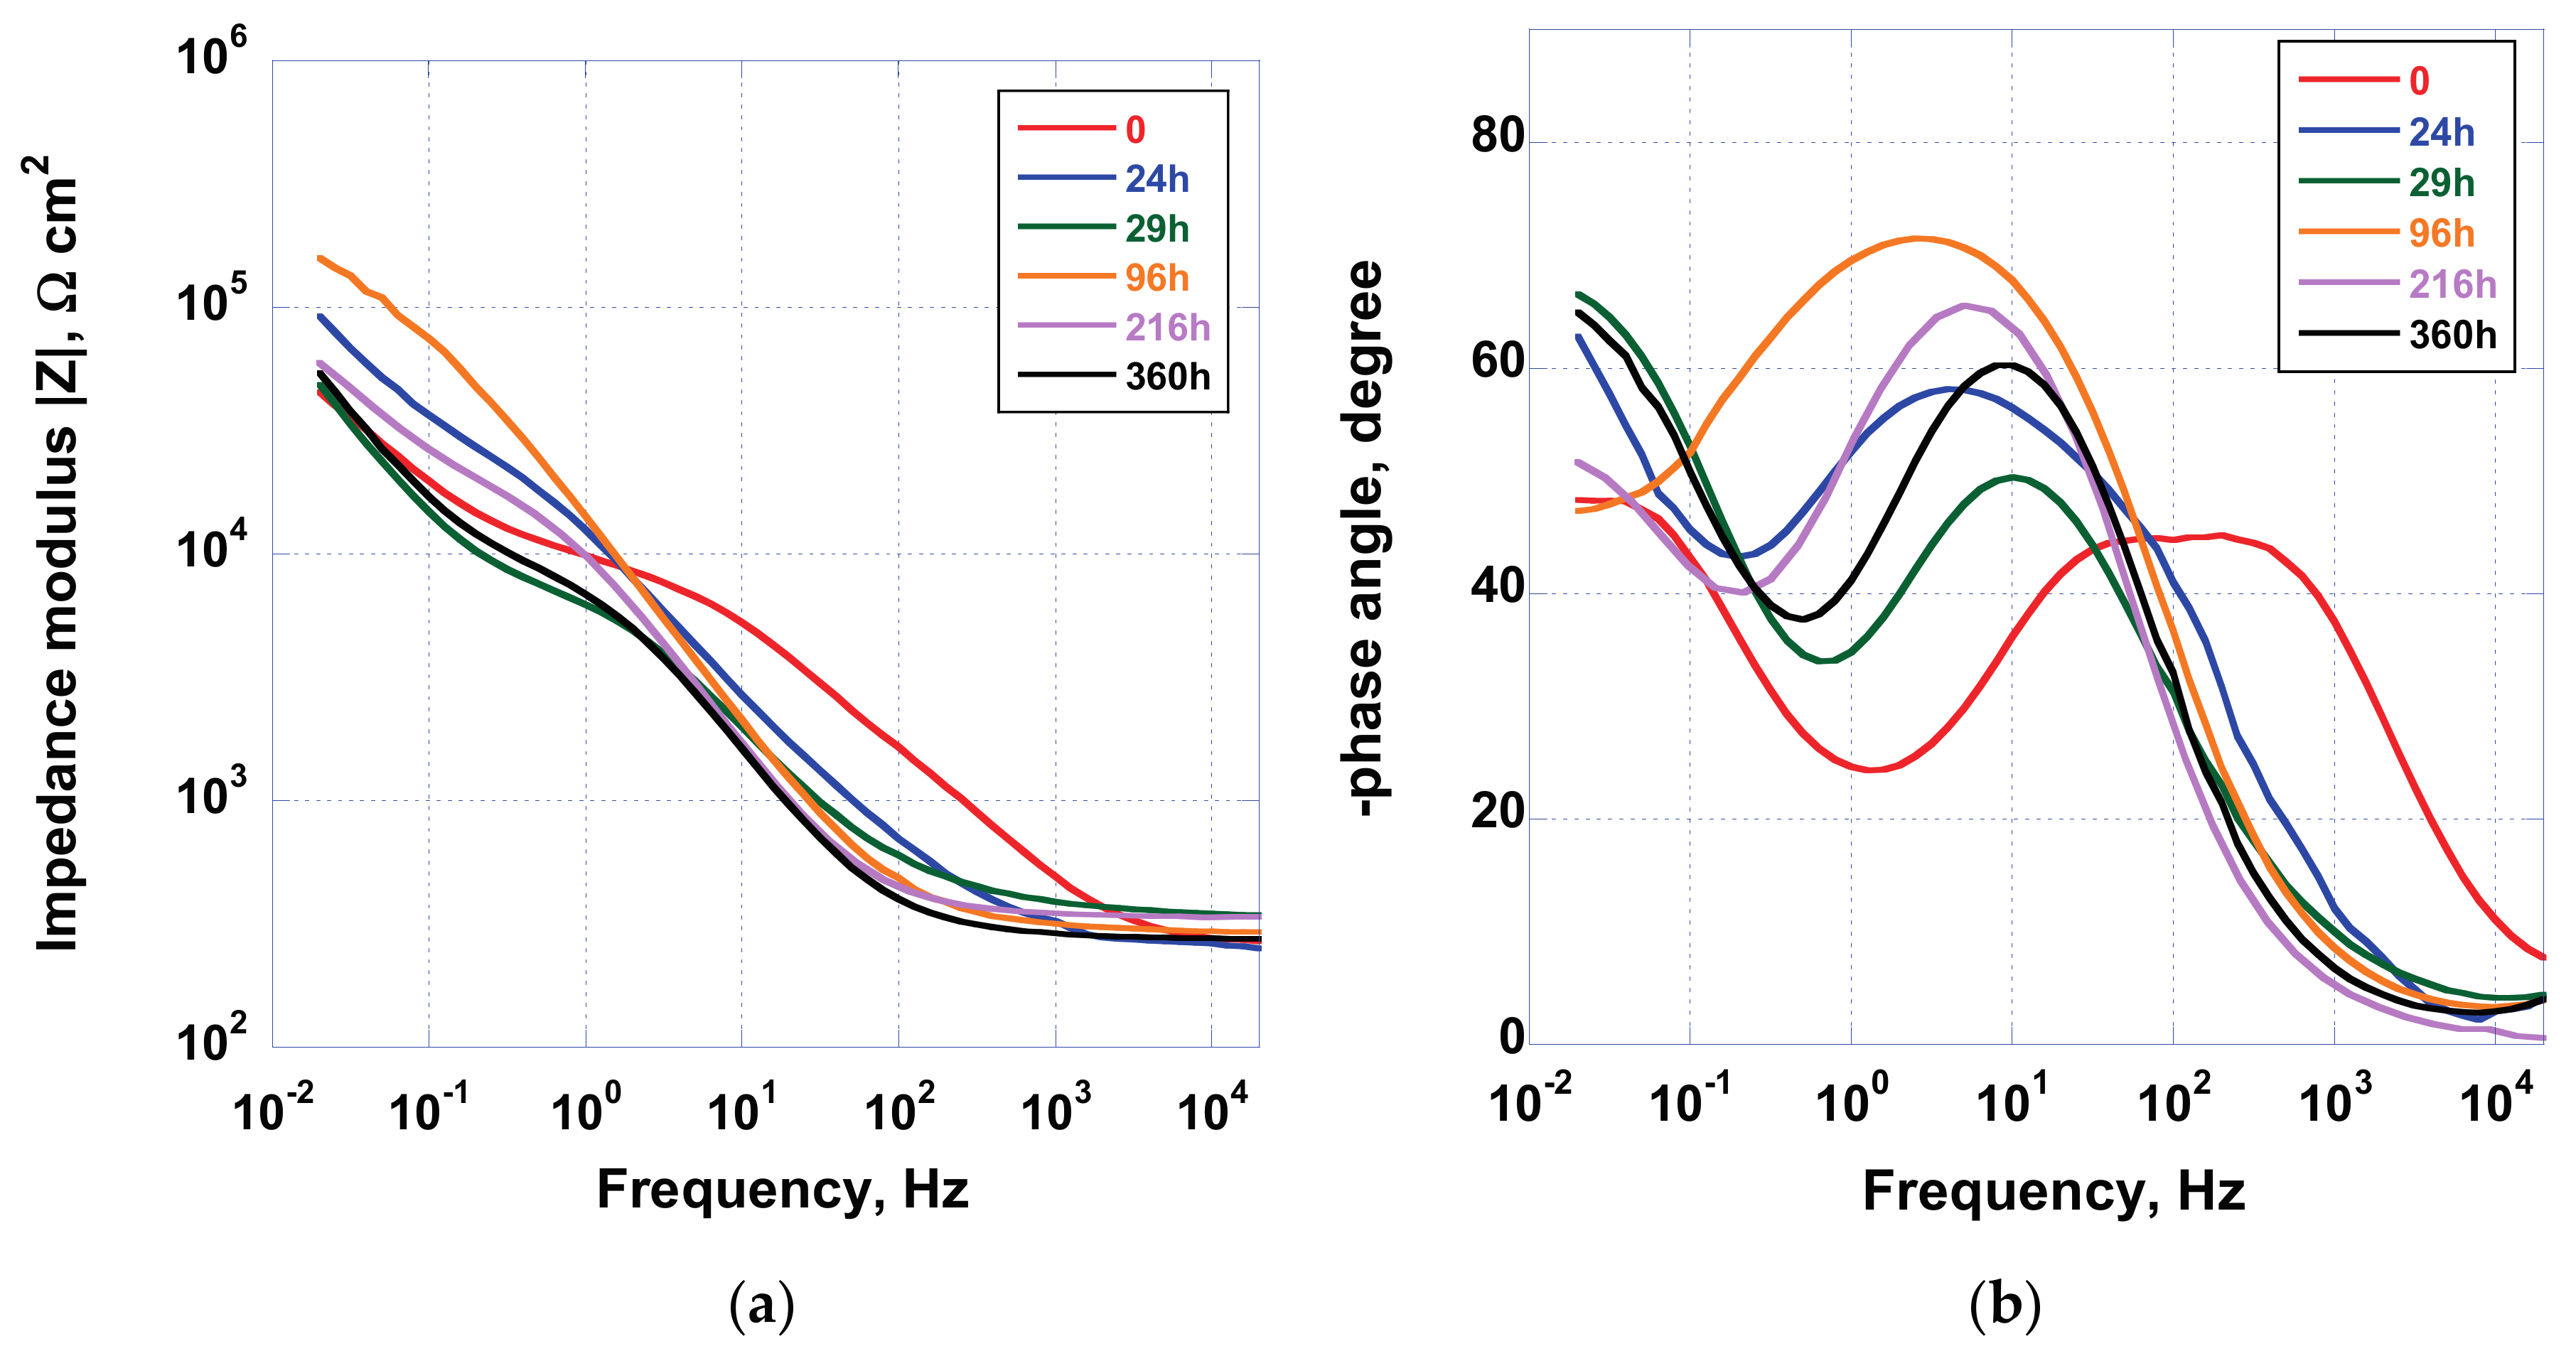
In
Figure 9, the Bode and phase angle plot acquired for the sample AS, when immersed in Hank’s solution for a duration of 360 h, are displayed. Data highlighted the dynamic nature, and therefore the reactivity, of the spontaneously formed oxide on the implant. In fact, after 24 h of immersion, a shift toward lower phase angle values, at low frequencies, can be observed, while, after 96 h of exposure to test solution, the phase angle increases. This oscillating behavior has been detected until the end of the experimental campaign, as can be observed in the close-up picture reported in
Figure 9b. This effect has been associated with the interaction between the TiO
2 oxide surface and the electrolytic solution, containing several anions and cations other than oxygen.
In fact, previous results [
37] have demonstrated that the implant surface, at the end of tests, does not show apatite-like deposition layer. Hence, the change in impedance modulus and phase angle can be linked to a continuous remodeling of the surface showing reconstruction and dissolution of oxide.
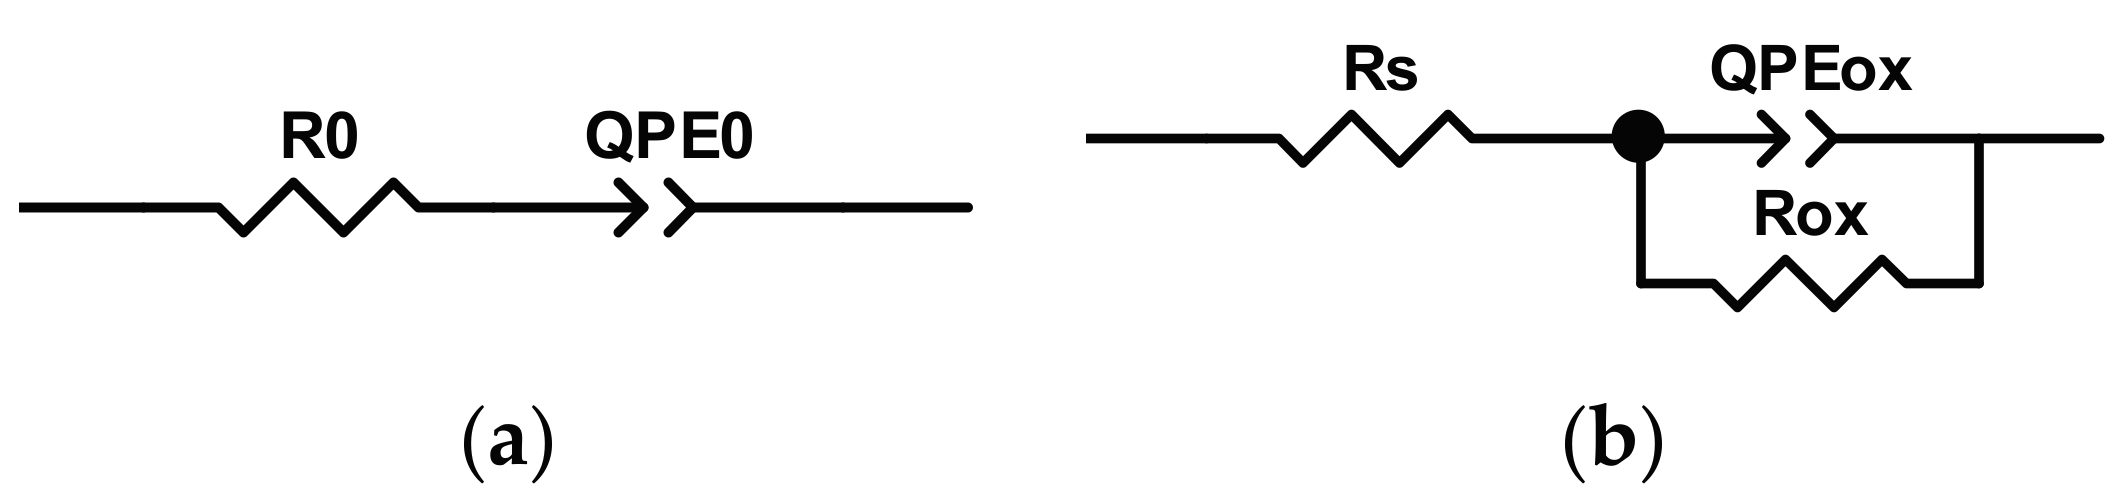
The analysis of experimental data has been performed by using the equivalent circuit models reported in
Figure 10. At the beginning of test campaign (t = 0), the model was constituted by a
R0QPE0 circuit (
Figure 10a), in which
R0 represents the resistance of electrolytic solution and
QPE0 is the constant phase element that takes into account the non-ideal behavior due to the double layer capacitance at oxide/solution interface. For longer exposure time, the experimental data need to be fitted by using the model reported in
Figure 10b, in which
Rs is the resistance of electrolytic solution,
Rox the charge transfer resistance of oxide/solution interface and
QPEox is the constant phase element of double layer at the interface.
The equivalent circuit, reported in
Figure 10b, fitted the experimental data obtained starting after 24 h of immersion in the test solution by showing low values of error, while to model the experimental data recorded at the beginning of the test campaign, i.e., at t = 0, the model reported in
Figure 10a, has to be employed. In fact, as can be seen from
Figure 9b, the sample as the measurement starts has shown, at low frequencies, a capacitive behavior (phase angle value equal to about 87 degrees). The physical implication of this occurrence is that, at t = 0, the charge transfer resistance is very high, suggesting that reaction rate occurring at the interface is very low. When the reaction starts, the equivalent circuit, used to model the data, changes in the circuit reported in
Figure 10b.
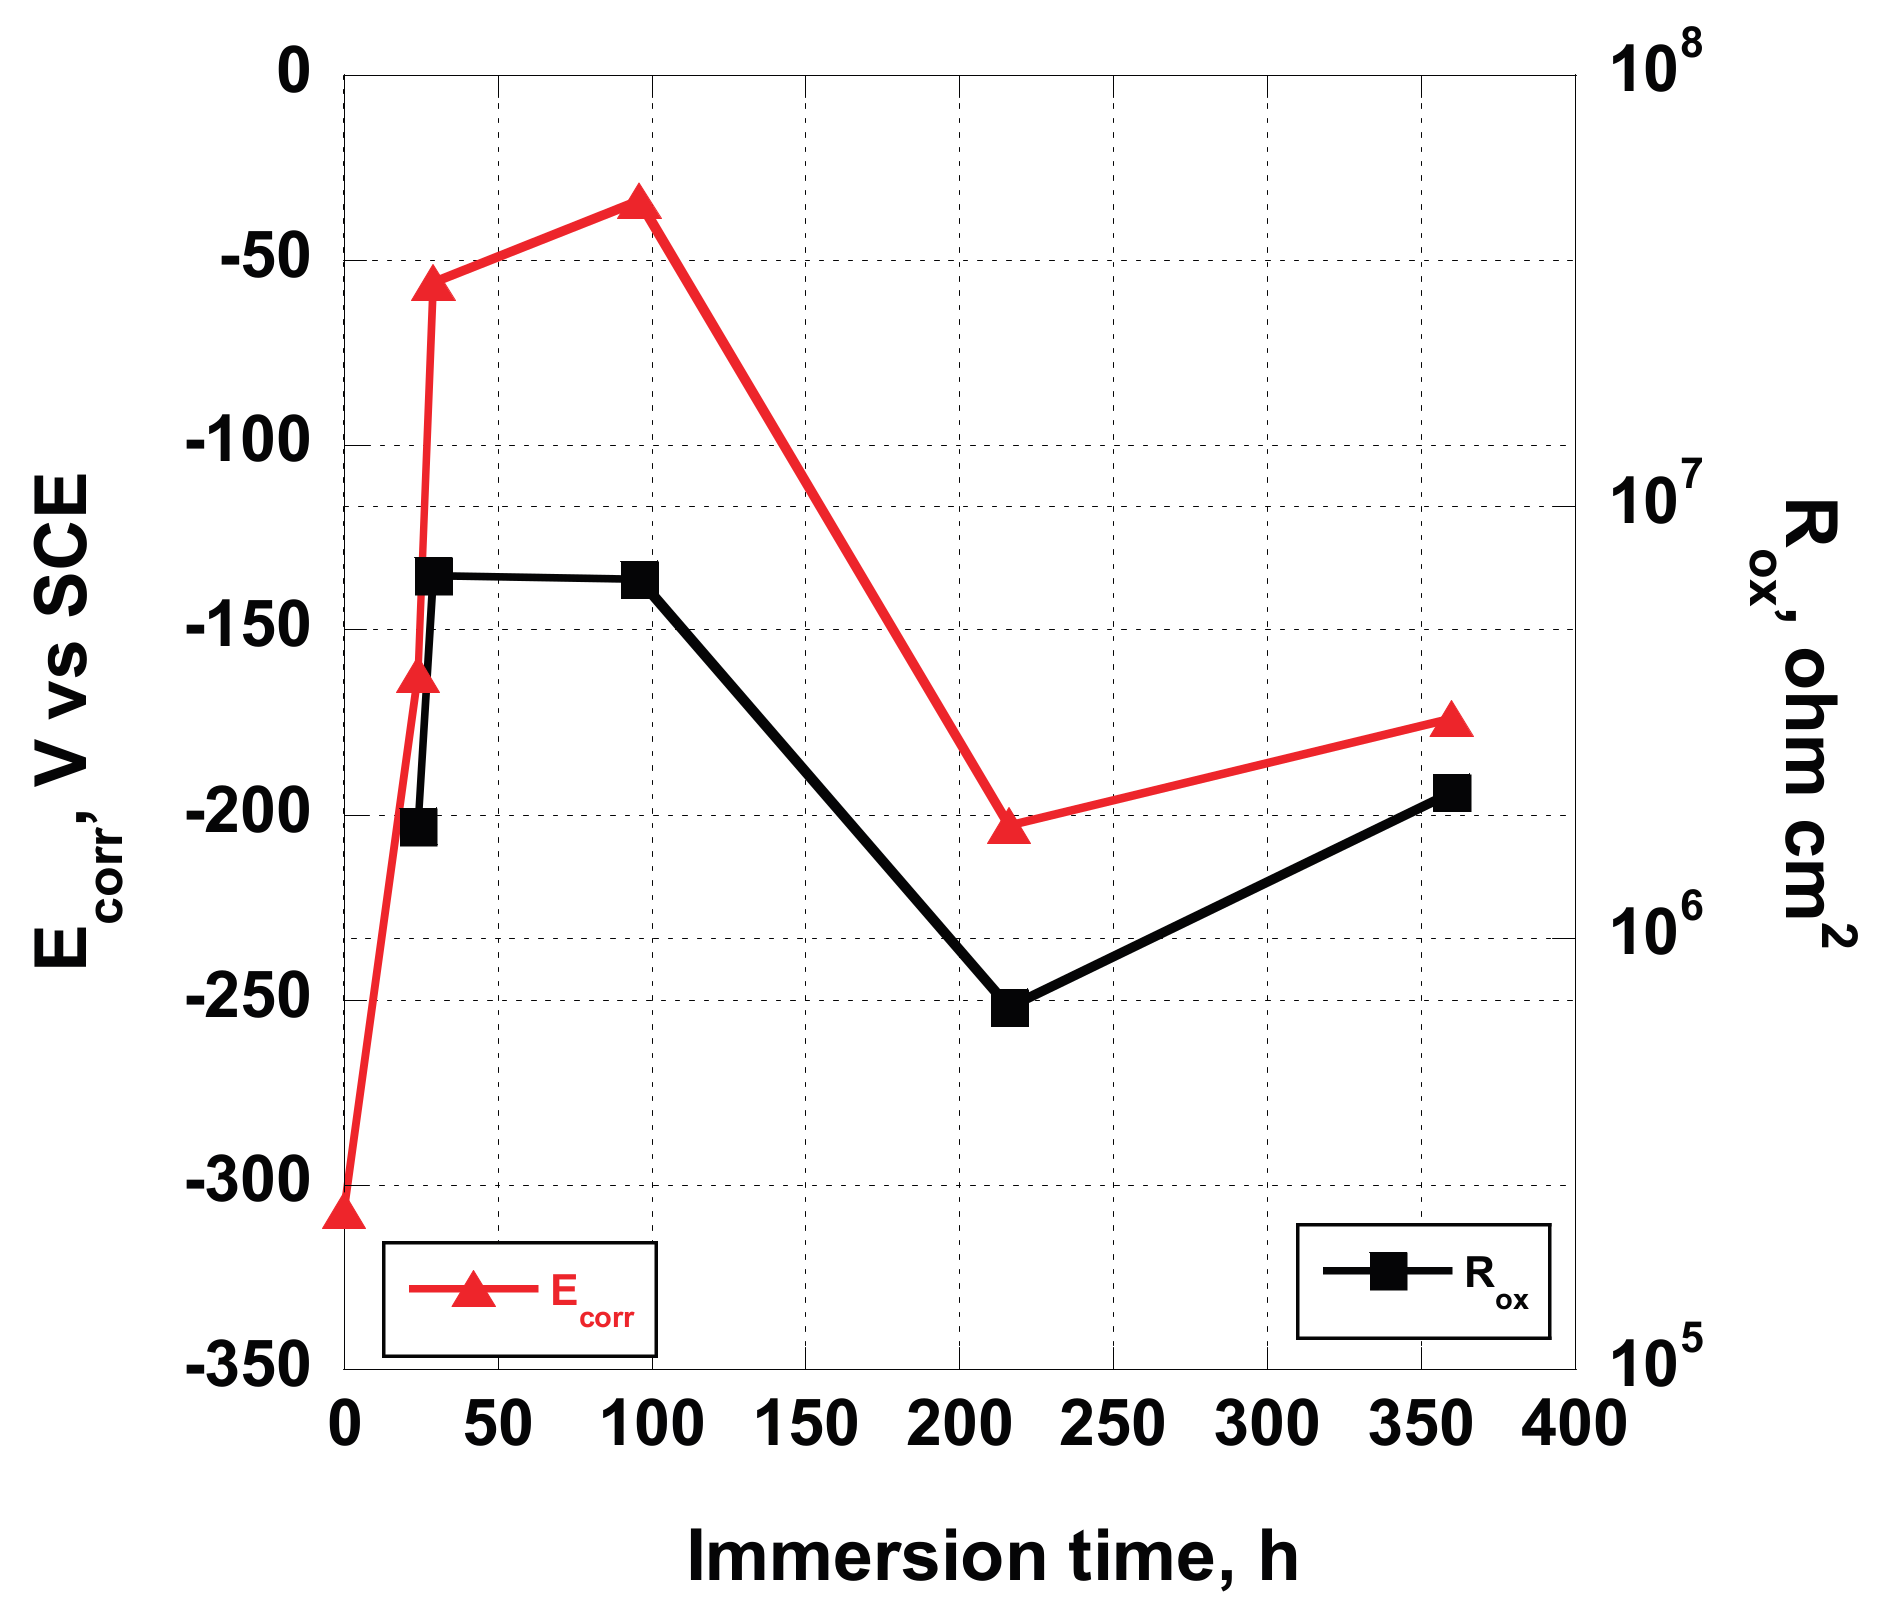
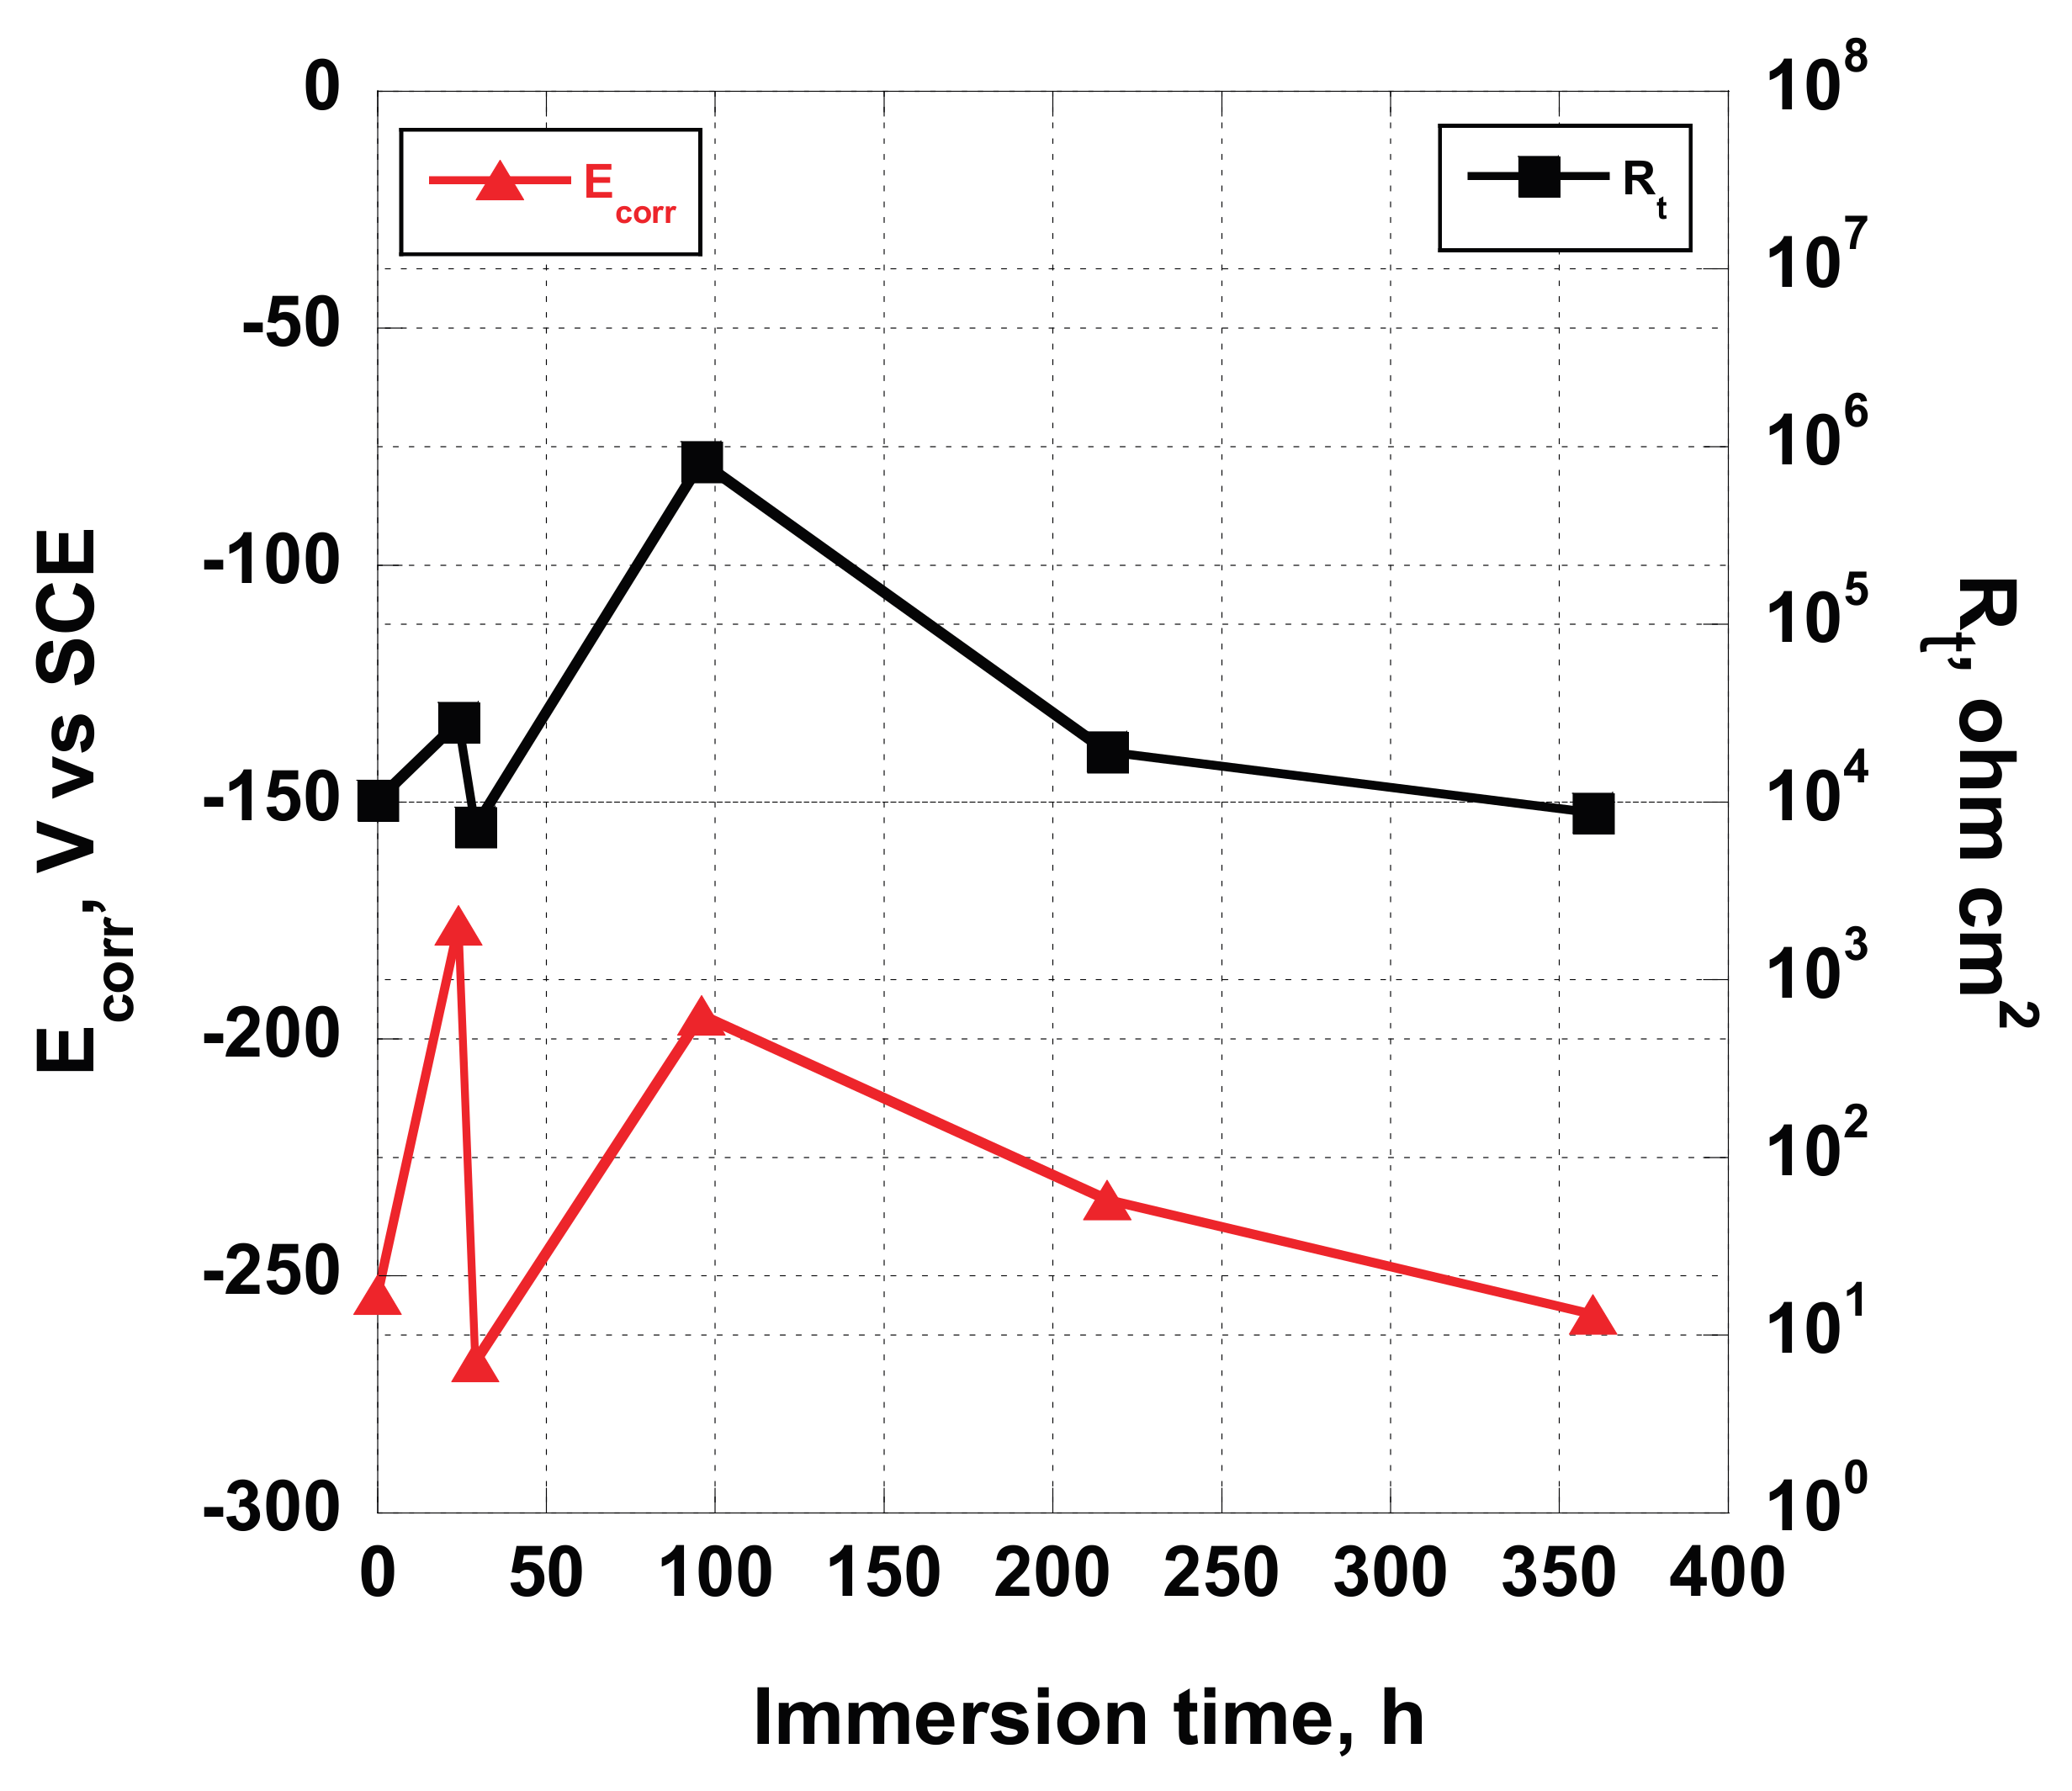
A significant relationship has been found comparing the corrosion potential, recorded at the beginning of each EIS measurement, and the estimated
Rox values obtained fitting the EIS data (reported in
Table 7). As can be seen from
Figure 11, the
Rox value follows the variation of the corrosion potential, showing an increase until 96 h of exposure to the test solution, and then a decrease followed by a little rise. This occurrence confirms the hypothesis that surface of the untouched screw, when immersed in Hank’s solution, is subjected to a reorganization instead of a degradation. A thin porous oxide layer formed when exposed to air covers the untreated implant. When immersed in Hank’s solution, which contains a certain amount of salts and oxygen dissolved in it, at pH = 7.4, some chemical reactions are triggered, determining the increase of the oxide layer thickness caused by the presence of oxygen and the slightly basic pH, dealing with a little increase of
Rox. In the same time, an increase of
Ecorr occurs, due to the decrease of the extension of the surface occupied by the anodic areas, while cathodic oxide protected areas expand. Then, the system restructures its surface (decreasing
Rox and
Ecorr) trying to reach a new equilibrium state.
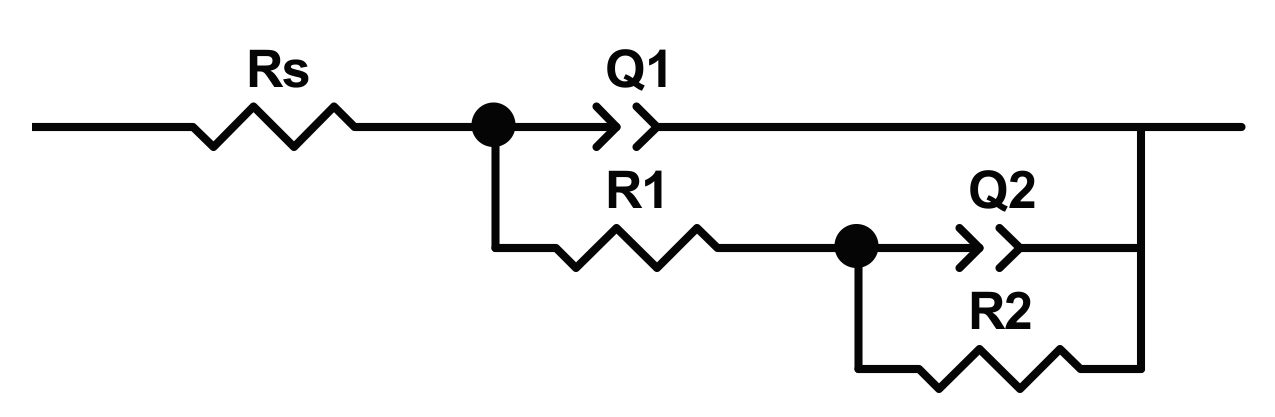
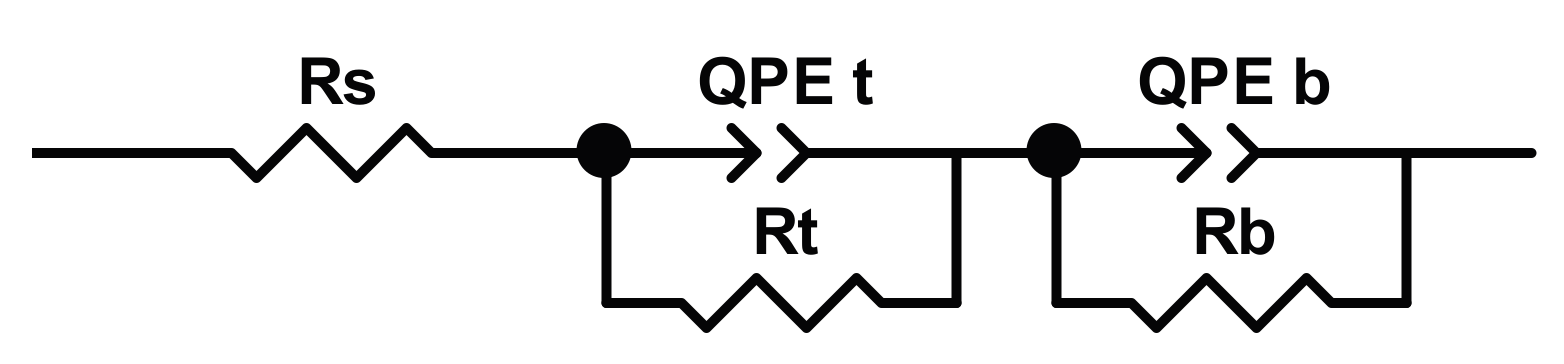
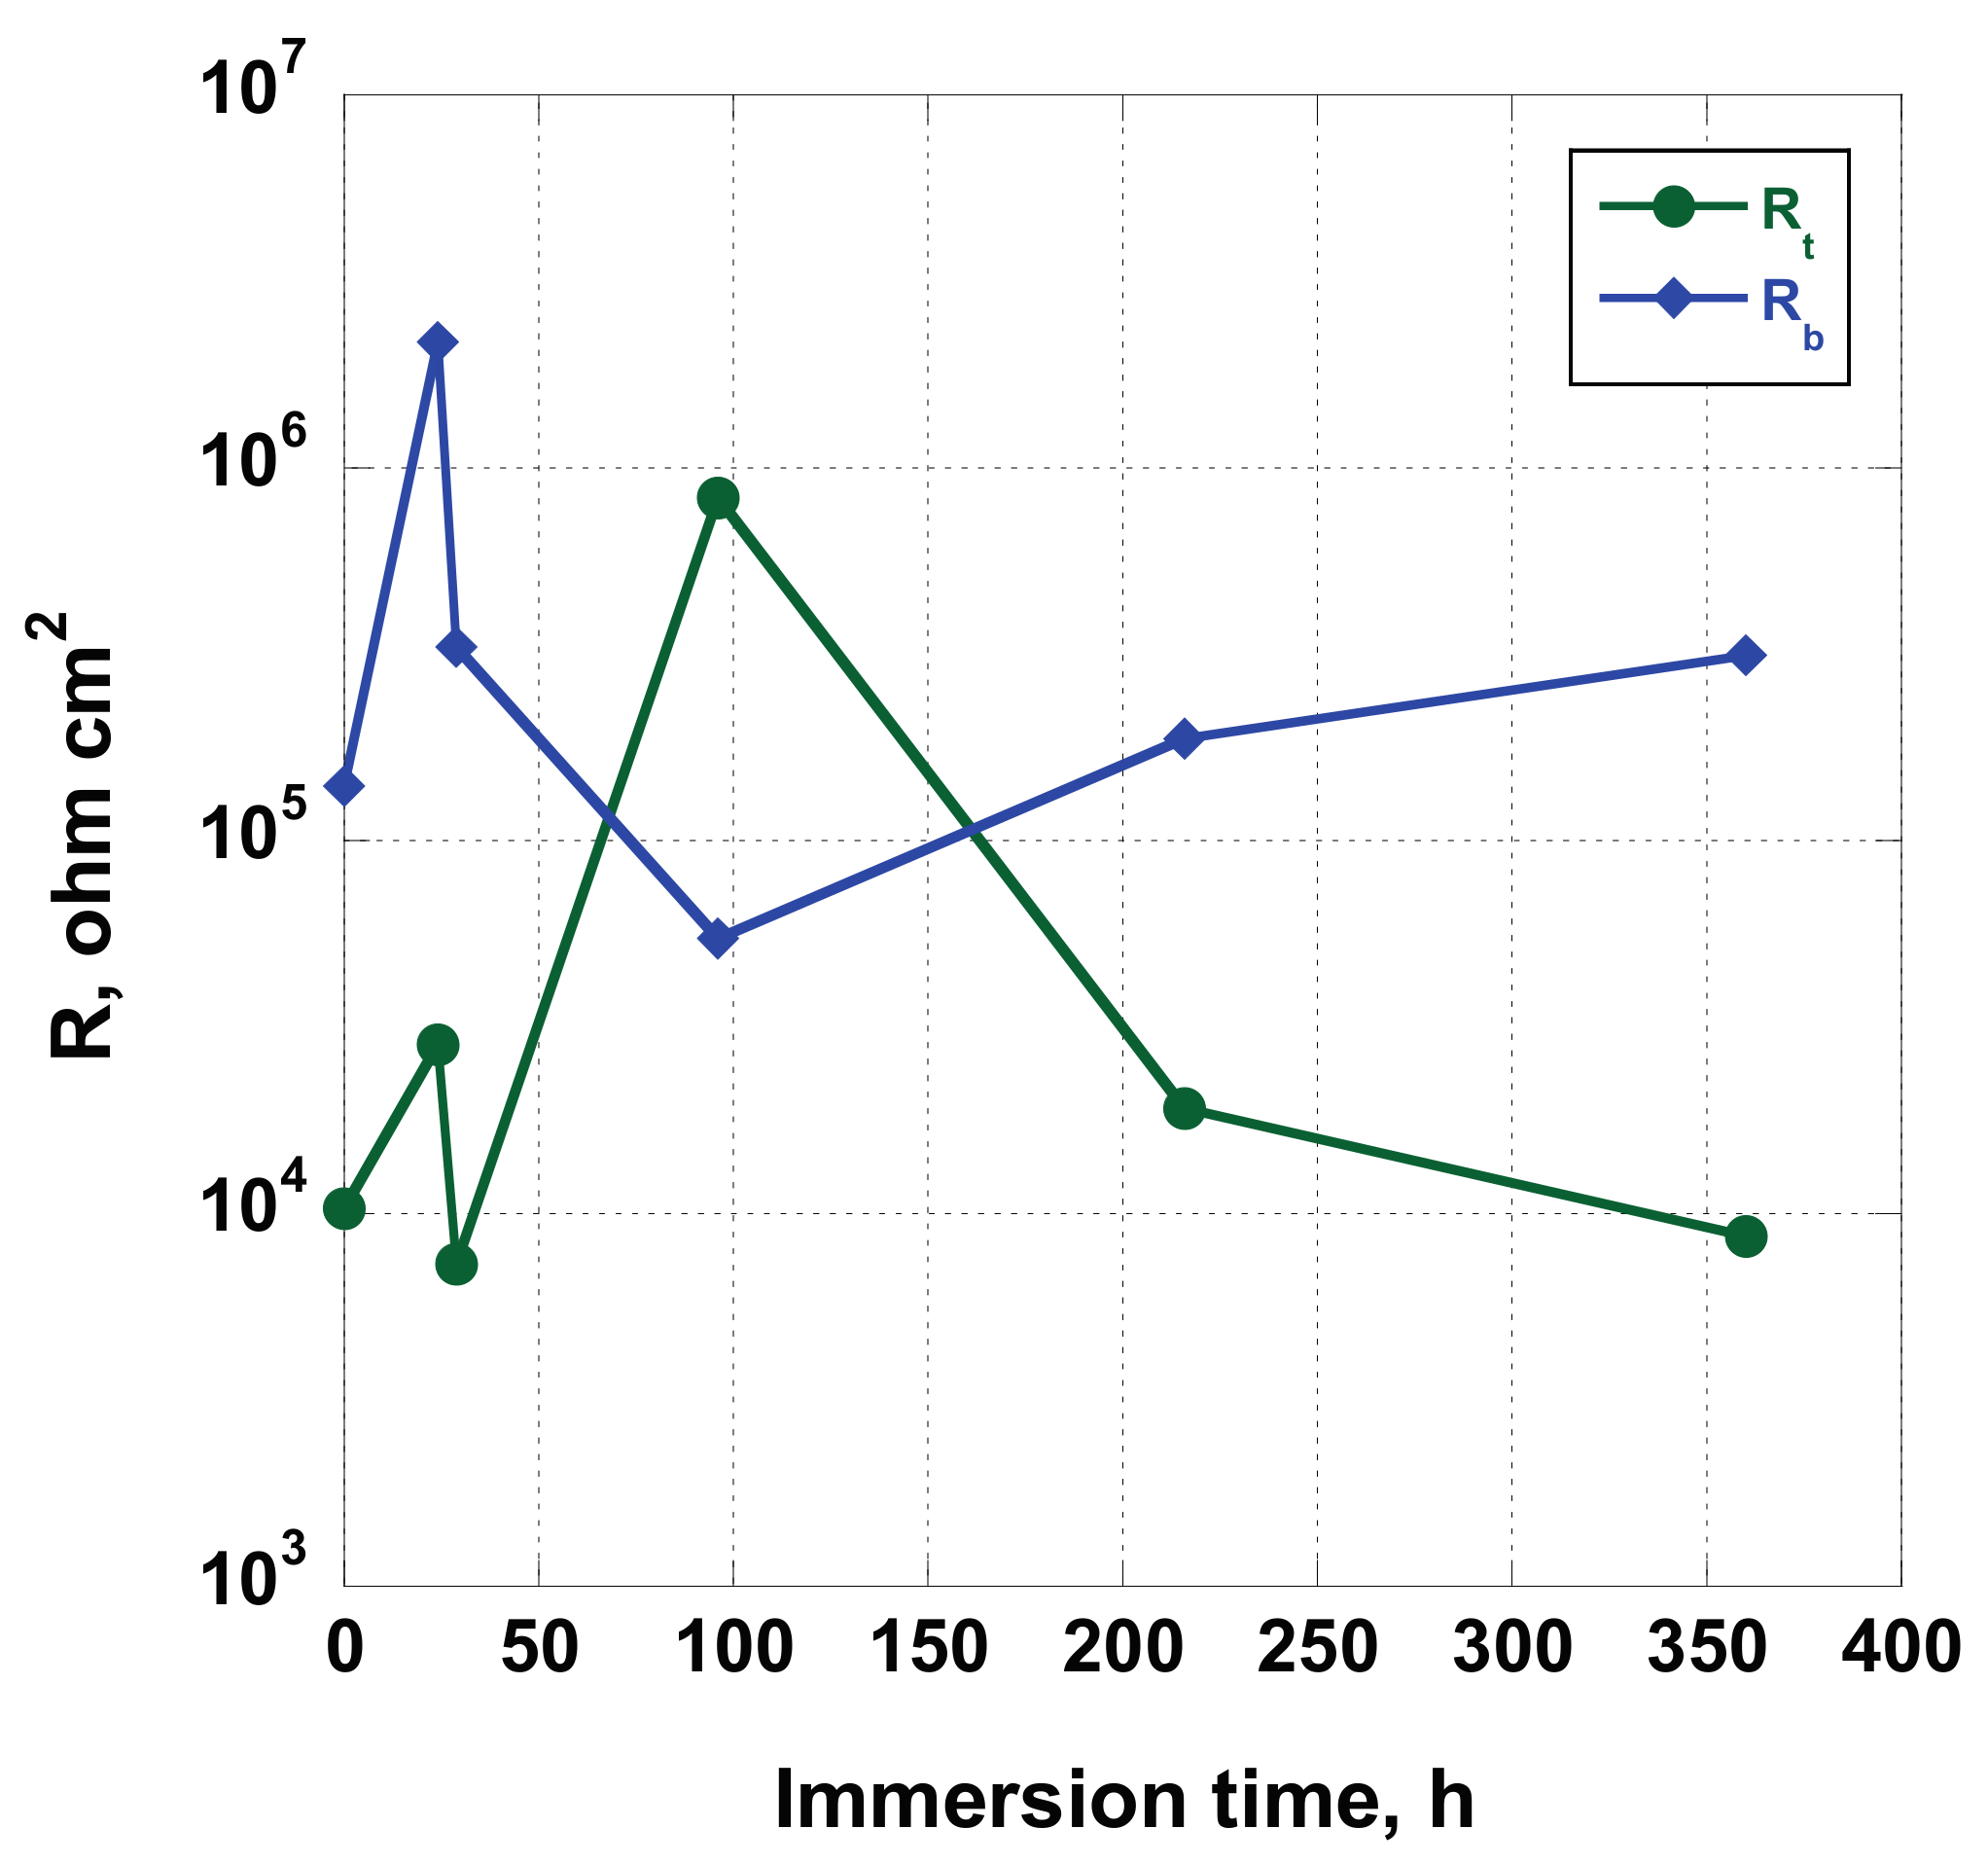
In
Figure 12, the modulus of impedance and phase angle plots acquired for the sample NT, when immersed in Hank’s solution for duration of 360 h, are displayed. As can be seen, a two-time constants equivalent circuit (reported in
Figure 13) is needed to model the experimental data obtained studying the NT sample.
The fit’s results, reported in
Table 8, allow analysing the interaction between the NT sample and Hank’s solution. In the same table, the
Ecorr values, measured at the time indicated, are also reported.
The complex behavior showed by the NT sample is highlighted by the changes of the values exhibited by the fitting parameters (
Figure 14).
Rt and
Rb values are oscillating for the duration of the test, varying from 7.32 × 10
3 Ω to 8.32 × 10
5 Ω cm
2 and from 5.45 × 10
4 to 2.17 × 10
6 Ω cm
2, respectively, demonstrating high activity of the sample due to the contact with Hank’s solution. In our previous paper [
37], the formation/dissolution of a protective layer on the nanotubes surface has been assumed and, due to their shape, in the gap between the nanotubes. Shortly after, during the immersion in the test solution, the surface is covered by spots of salt deposited from Hank’s solution. Due to the pH slightly acid existing at the bottom of the nanotubes, if compared to the pH of the solution, precipitation/dissolution of chemicals, containing Ca, P, Mg, can occur on the overall nanotube surfaces. These processes lead to a variation of
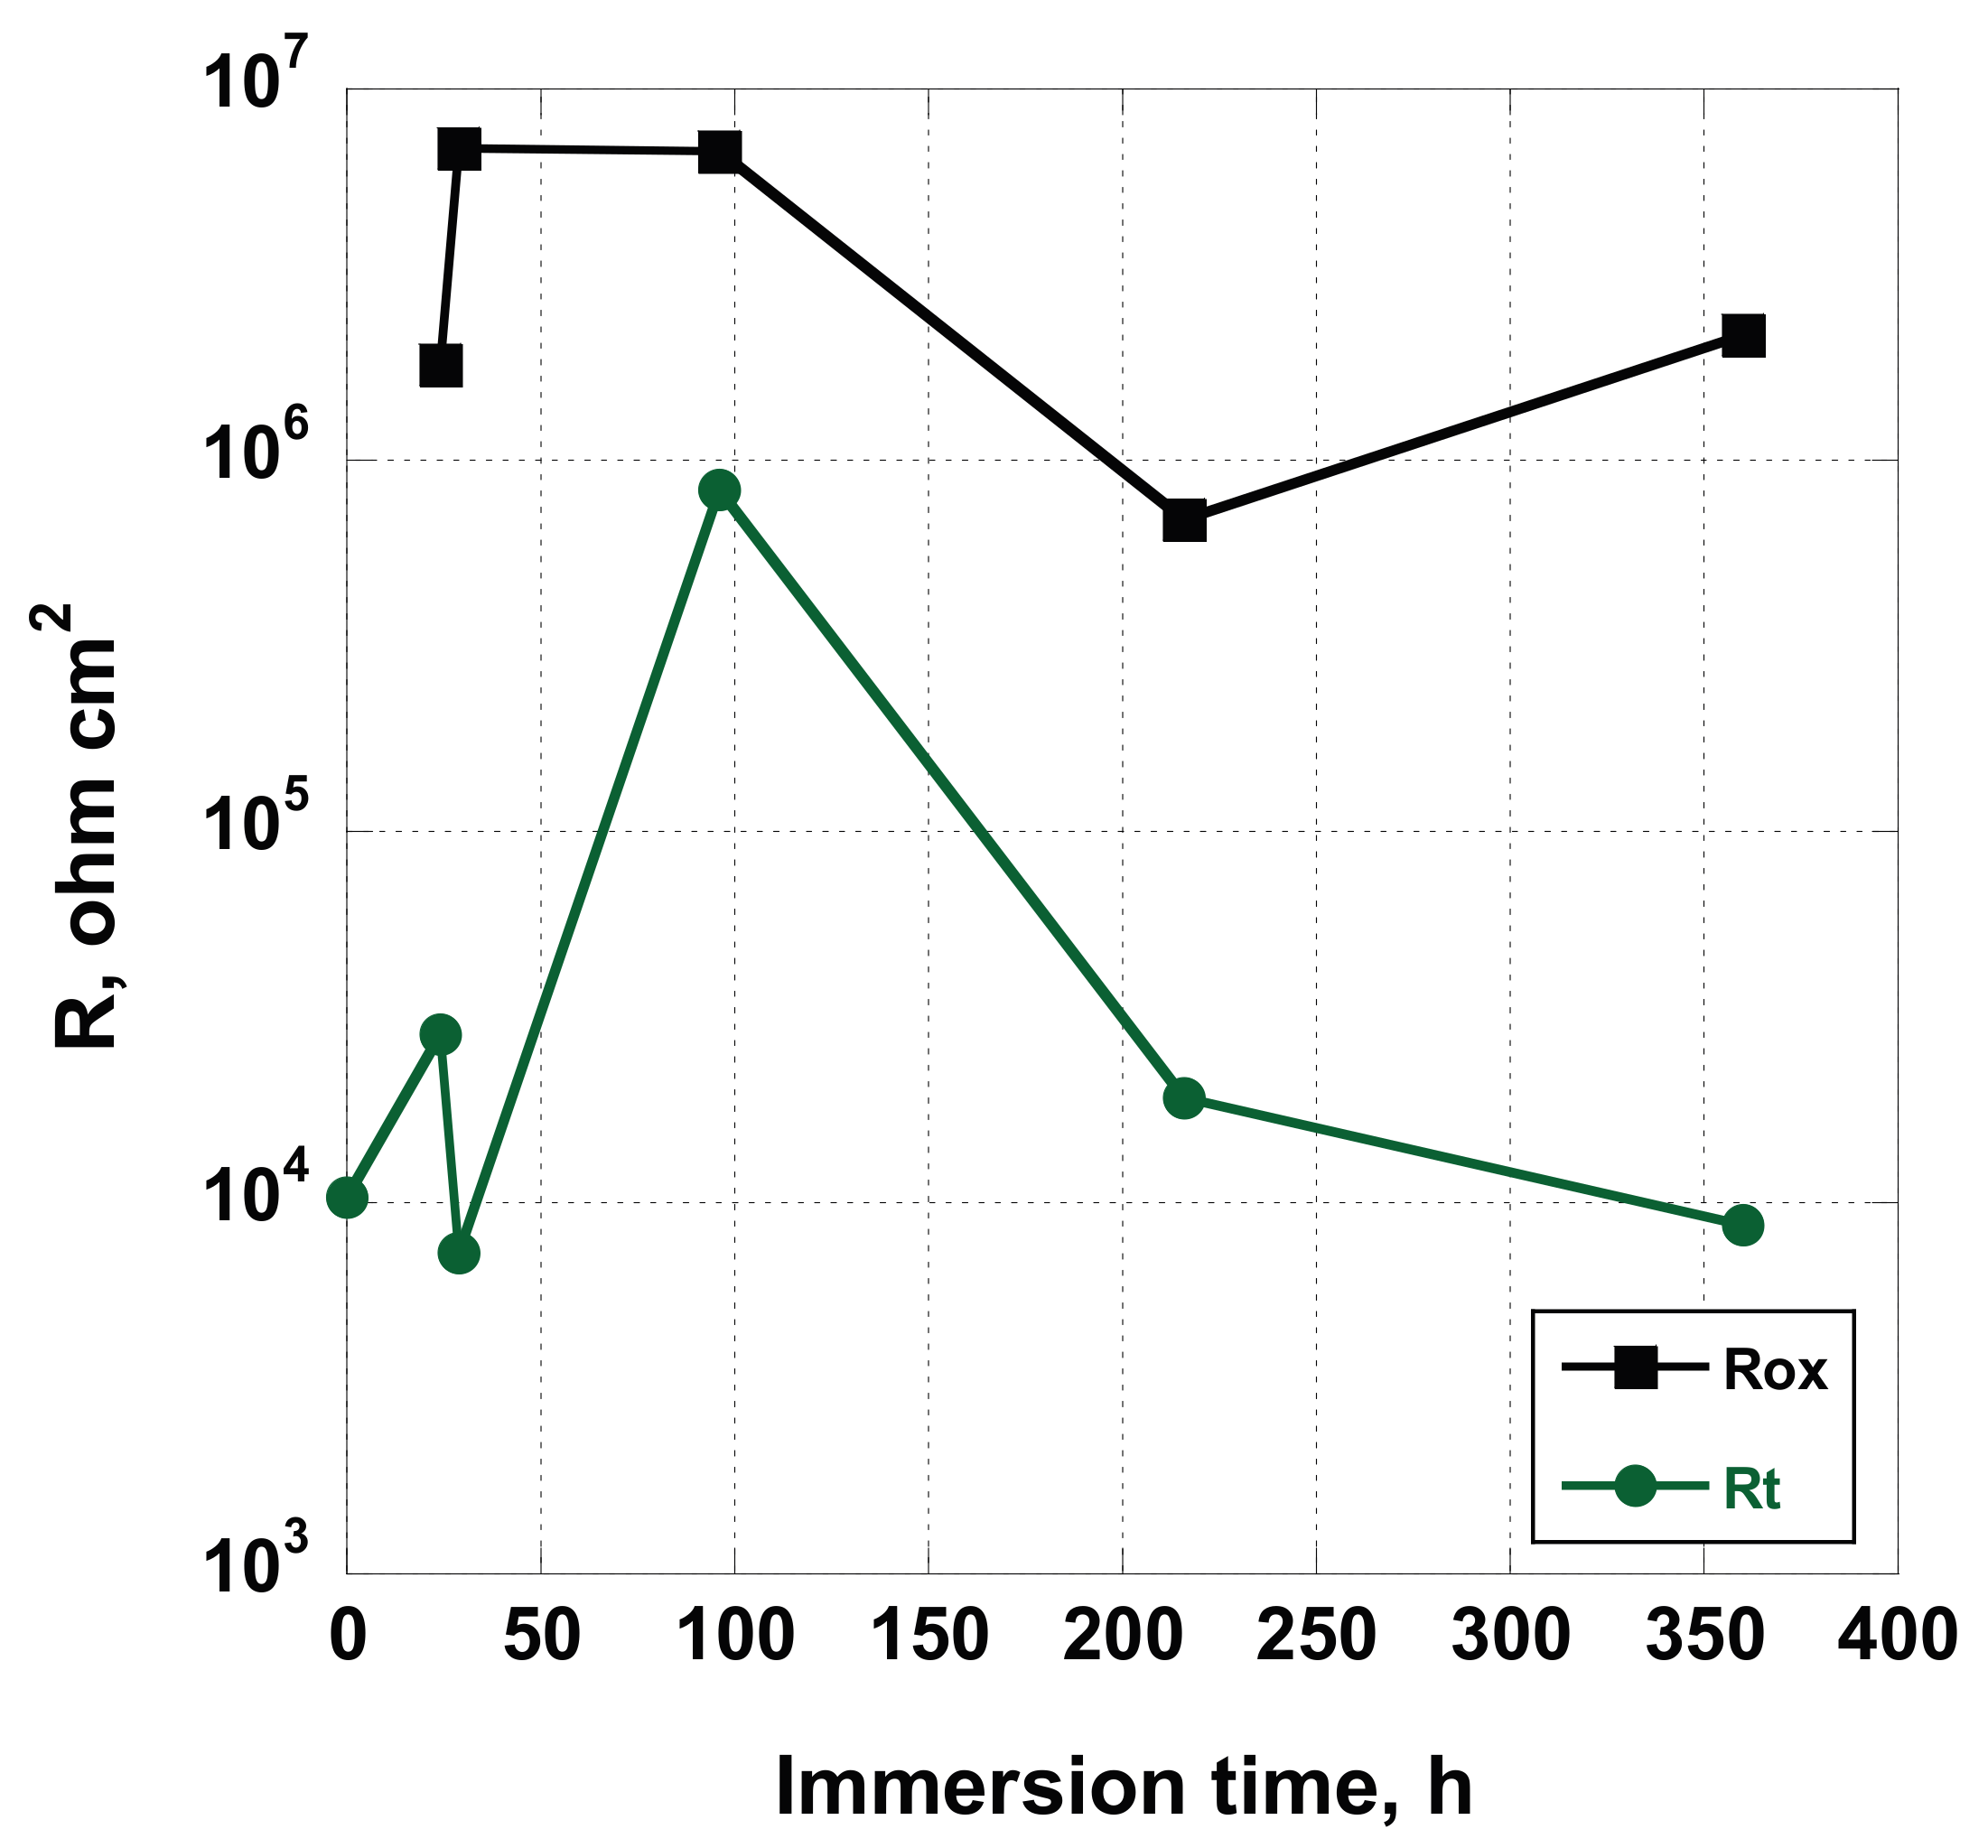
Ecorr value and the fitting parameters of the equivalent circuit.
The hypothesis is confirmed by the trend of
Ecorr values when compared to
Rt (
Figure 15). In fact, a good relationship has been found comparing their variation: the
Rt estimated value follows the change of the corrosion potential with a good approximation. As seen before, analyzing the case of sample AS, a similar behavior was found comparing values acquired by
Rox and
Ecorr. Even if the similarity exists for both the samples AS and NT, the nature of this correspondence is different. In the first case, it can be related to the reorganization of the surface, while, in the former, it can be addressed to surface reorganization and deposition of salts from Hank’s solution. In fact, while the
Rox variation, for the AS sample, is of about one order of magnitude (varying from 6.90 × 10
5 Ω to 6.80 × 10
6 Ω cm
2), the
Rt values change of two order of magnitude (from 7. 32 × 10
3 to 8.32 × 10
5 Ω cm
2), this effect can be attributed to the deposition of some insulating compounds containing Ca, P and Mg. Nevertheless, comparing the values assumed by
Rox and
Rt, (without taking into account synergic effect due to the barrier layer on the overall corrosion resistance of the nanostructured sample), it seems that the NT sample showed a more active behavior (see
Figure 16). In our opinion (we are collecting more experimental data by using Brunauer–Emmett–Teller analysis to confirm this hypothesis that will be discussed in the third part of this series of papers), the real extent of exposed area of the coated sample is much higher related to the uncoated one. In this way, the estimated values of
Rt should be much greater than that obtained by using the geometric area of the sample, as is usually reported in the scientific literature.
The QPE elements, used in the modeling of the experimental data using the equivalents circuits, are utilized to take into account the non-ideal behavior of capacitors to be employed in the simulation. The impedance of a constant-phase element is defined as
ZQPE = 1/(Q(jω)
n, where −1 ≤
n ≤ 1. The “
n” values can be associated to the bulk or surface inhomogeneity of structures under analysis. As reported in
Table 7,
nox varied from 0.88 to 0.92, while n
b ranged from 0.83 and 0.92 (
Table 8), showing that the oxide formed on the AS sample and the barrier layer oxide of the NT sample possessed a compact structure so that themselves behaved like quasi-ideal capacitors. The
nt values varied between 0.65 and 0.84, highlighting the non-homogenous structure of the nanotubes layer and the effect of the inorganic compounds deposited, which partially filled the pores [
37].


