Abstract
Biodegradable metal foams have been studied as potential materials for bone scaffolds. Their mechanical properties largely depend on the relative density and micro-structural geometry. In this work, mechanical behavior of iron foams with different cell sizes was investigated under various compression tests in dry and wet conditions and after subjected to degradation in Hanks’ solution. Statistical analysis was performed using hypothesis and non-parametric tests. The deformation behavior of the foams under compression was also evaluated. Results show that the mechanical properties of the foams under dry compression tests had a “V-type” variation, which is explained as a function of different geometrical properties by using a simple tabular method. The wet environment did not change the compression behavior of the iron foams significantly while degradation decreased the elastic modulus, yield and compression strengths and the energy absorbability of the specimens. The deformation of open cell iron foams under compression is viewed as a complex phenomenon which could be the product of multiple mechanism such as bending, buckling and torsion.
Keywords:
biodegradable metals; iron foam; scaffold; compression; degradation; cell size; open cell foam 1. Introduction
Porous metals or metal foams are used in different applications where altered material properties of the parent metal are beneficial to the quality of the application. In biomedical engineering, metal foams can be used for biodegradable orthopedic implants such as bone scaffolds. Although foaming does not change all the material properties of the cell-wall material, there are properties which depend on the density (and therefore porosity) and micro-structural geometry of cellular materials: “the stiffness, the mechanical strength, the thermal and electrical conductivity as well as acoustic properties” [1]. One should note that the stiffness (elastic modulus) of a cellular structure, e.g., iron foam, depends on the architecture of the structure to a great extent. Therefore, it should not be confused with the elastic modulus of the cell wall material, e.g., iron [1]. As stated in [2], the material properties of metal foams “most directly” depend on the relative density and the properties of the parent material. However, structural properties such as pore sizes, cell types, etc. also influence the material properties of the foams. Bone scaffolds are implanted in the body to serve as a platform on which bone formation takes place. An ideal bone scaffold would resemble the mechanical properties of the natural bone. One advantage of porous metals over solid metals is their lower stiffness, which makes it closer to that of a bone. This would help to reduce stress shielding which can happen in case of using solid metals due to their higher Young’s modulus than that of the bone. Porous structure can also contribute to new tissue infiltration and bone formation [3,4]. The structure of the porous scaffold (pore size distribution, interconnectivity and porosity) is an influential factor on the quality of the scaffold as it affects the level of cell penetration, cell growth and material transportation into and out of the scaffold [5].
Different biocompatible porous metals have been studied to serve as scaffolds for orthopedic applications: tantalum, magnesium and its alloys, titanium and its alloys, and iron-foam based materials [5,6]. Magnesium, iron and zinc are considered as biodegradable metals. However, among the available studies on biodegradable systems, the majority of the investigations have been on magnesium based materials due to their non-toxicity and similar mechanical behavior to that of human bone [7]. There have been controversies over biocompatibility of iron due to the emergence of metallosis, local destruction of tissues as a result of mechanical-biological, electro-energetic, and chemical-toxic effects of metal after implantation, of iron implants [8]. Nevertheless, there exist studies that show iron-based materials are possibly suitable for temporary biodegradable implants [9,10]. They provide answers to the two major drawbacks of magnesium-based materials which are high degradation rate that limits the use of such materials on small implants with approximate life span of 6–12 months, and hydrogen evolution during corrosion that can disturb the healing process [7,11,12,13]. Mechanical properties of iron-based alloys, e.g., strength and ductility, can be easily tailored to meet the criteria for some biomedical applications. They are viewed as good candidates for load bearing biodegradable implants owing to their high mechanical properties, e.g., high strength [13], and biocompatible, non-toxic characteristics [7]. However, a major challenge of using iron as a biodegradable implant is its slow rate of degradation [7,14]. Different approaches have been proposed to improve the corrosion rate of iron such as alloying elements modification, poly(lactic-co-glycolic acid) infiltration, and coating [6,15,16,17]. The objective of this study is to investigate the mechanical behavior of iron-foams as a function of their structural geometry where several iron foam specimens with different structural properties underwent uniaxial compression tests. Results are discussed in terms of the influence of porous properties, i.e., cell size, pore size, number of pores and strut thickness, and influence of environmental conditions, i.e., wet and dry condition as well as degradation on mechanical behavior of iron foam samples. Deformation mechanisms of iron foams under compression were also studied using scanning electron microscope images (SEM) analysis.
2. Materials and Methods
2.1. Iron Foam Specimens
The specimens were open cell pure iron foam with nominal cell diameters of 450 (IF45), 580 (IF58) and 800 (IF80) µm manufactured by Alantum. The foams were produced by the replication of open cell polyurethane (PU) foams [18]. To do so, a thin layer of Ni is sputtered on the PU foam to make the foam conductive for the following electroplating process. Then, iron would be electroplated on the foam to produce the open cell iron foams [18]. Measurements of cell sizes, pore sizes and strut thicknesses of iron foam samples were performed using scanning electron microscope images (SEM, Quanta 250 FEI, Hillsboro, OR, USA). More details on the geometrical measurement are available in Section A of the Supplementary Materials (Figure S1 and Table S1). One should note that these measurements were conducted on 2D images, and the 3D structure of the foams was not considered. Thus, the average measurements should be considered as estimations. The relative density of a foam is defined as ratio of the foam density over the density of the cell-wall material (ρ*/ρs) [19]. To obtain the foam densities, the iron foam sheets were cut into cubic specimens by a stainless-steel scalpel. For each group of iron foams, three specimens were used. The dimensions of the specimens were measured via caliper to obtain the apparent volume (the bulk volume which contains the struts and pores). The mass of each specimen was measured via a sensitive digital scale. The foam densities were calculated as the ratio of masses over apparent volumes. The density of the cell-wall material (iron) was taken as 7.874 (g/cm3). The calculated average relative density values of IF45, IF58 and IF80 samples were 0.038, 0.027 and 0.025, respectively (Table 1). It should be mentioned that for calculation of the relative densities, it was assumed that the solid structures of the foams contained only iron, and no remainder of PU was present. To prepare the cubic samples for the mechanical tests, they were initially cut from the sheets via a stainless-steel scalpel slightly larger than the final dimensions, and the thicknesses remained unchanged. Then the width and length were reduced to the final dimension by a rotary cutting tool kit. The nominal width and length of iron foam specimens considered for dry compression tests was 10 mm × 10 mm, and the nominal thickness (along the loading direction) for IF45, IF58 and IF80 was 1.7, 2.1 and 2.6 mm, respectively. According to [20], the minimum requirement for the size of all the spatial dimensions of the specimens and for their ratio to the average pore size is 10 mm and 10, respectively. The length and width of the iron foam specimens satisfy both mentioned requirements and have been verified as detailed in Section B of the Supplementary Materials (Figure S2). For wet compression tests and immersion tests, the specimens (only IF80) had similar nominal dimensions as the dry test specimens. To understand the deformation mechanisms, a new set of IF45 specimens were prepared to undergo dry compression tests before SEM observations. They were also prepared in the same fashion as other specimens with similar nominal dimensions. However, because no quantitative analysis was involved in this part, the accuracy of measured dimensions was not critical.

Table 1.
Relative density, cell size, end-strut and branch-strut thicknesses of the iron foams.
2.2. Mechanical Testing
2.2.1. Compression Test Parameters and Conditions
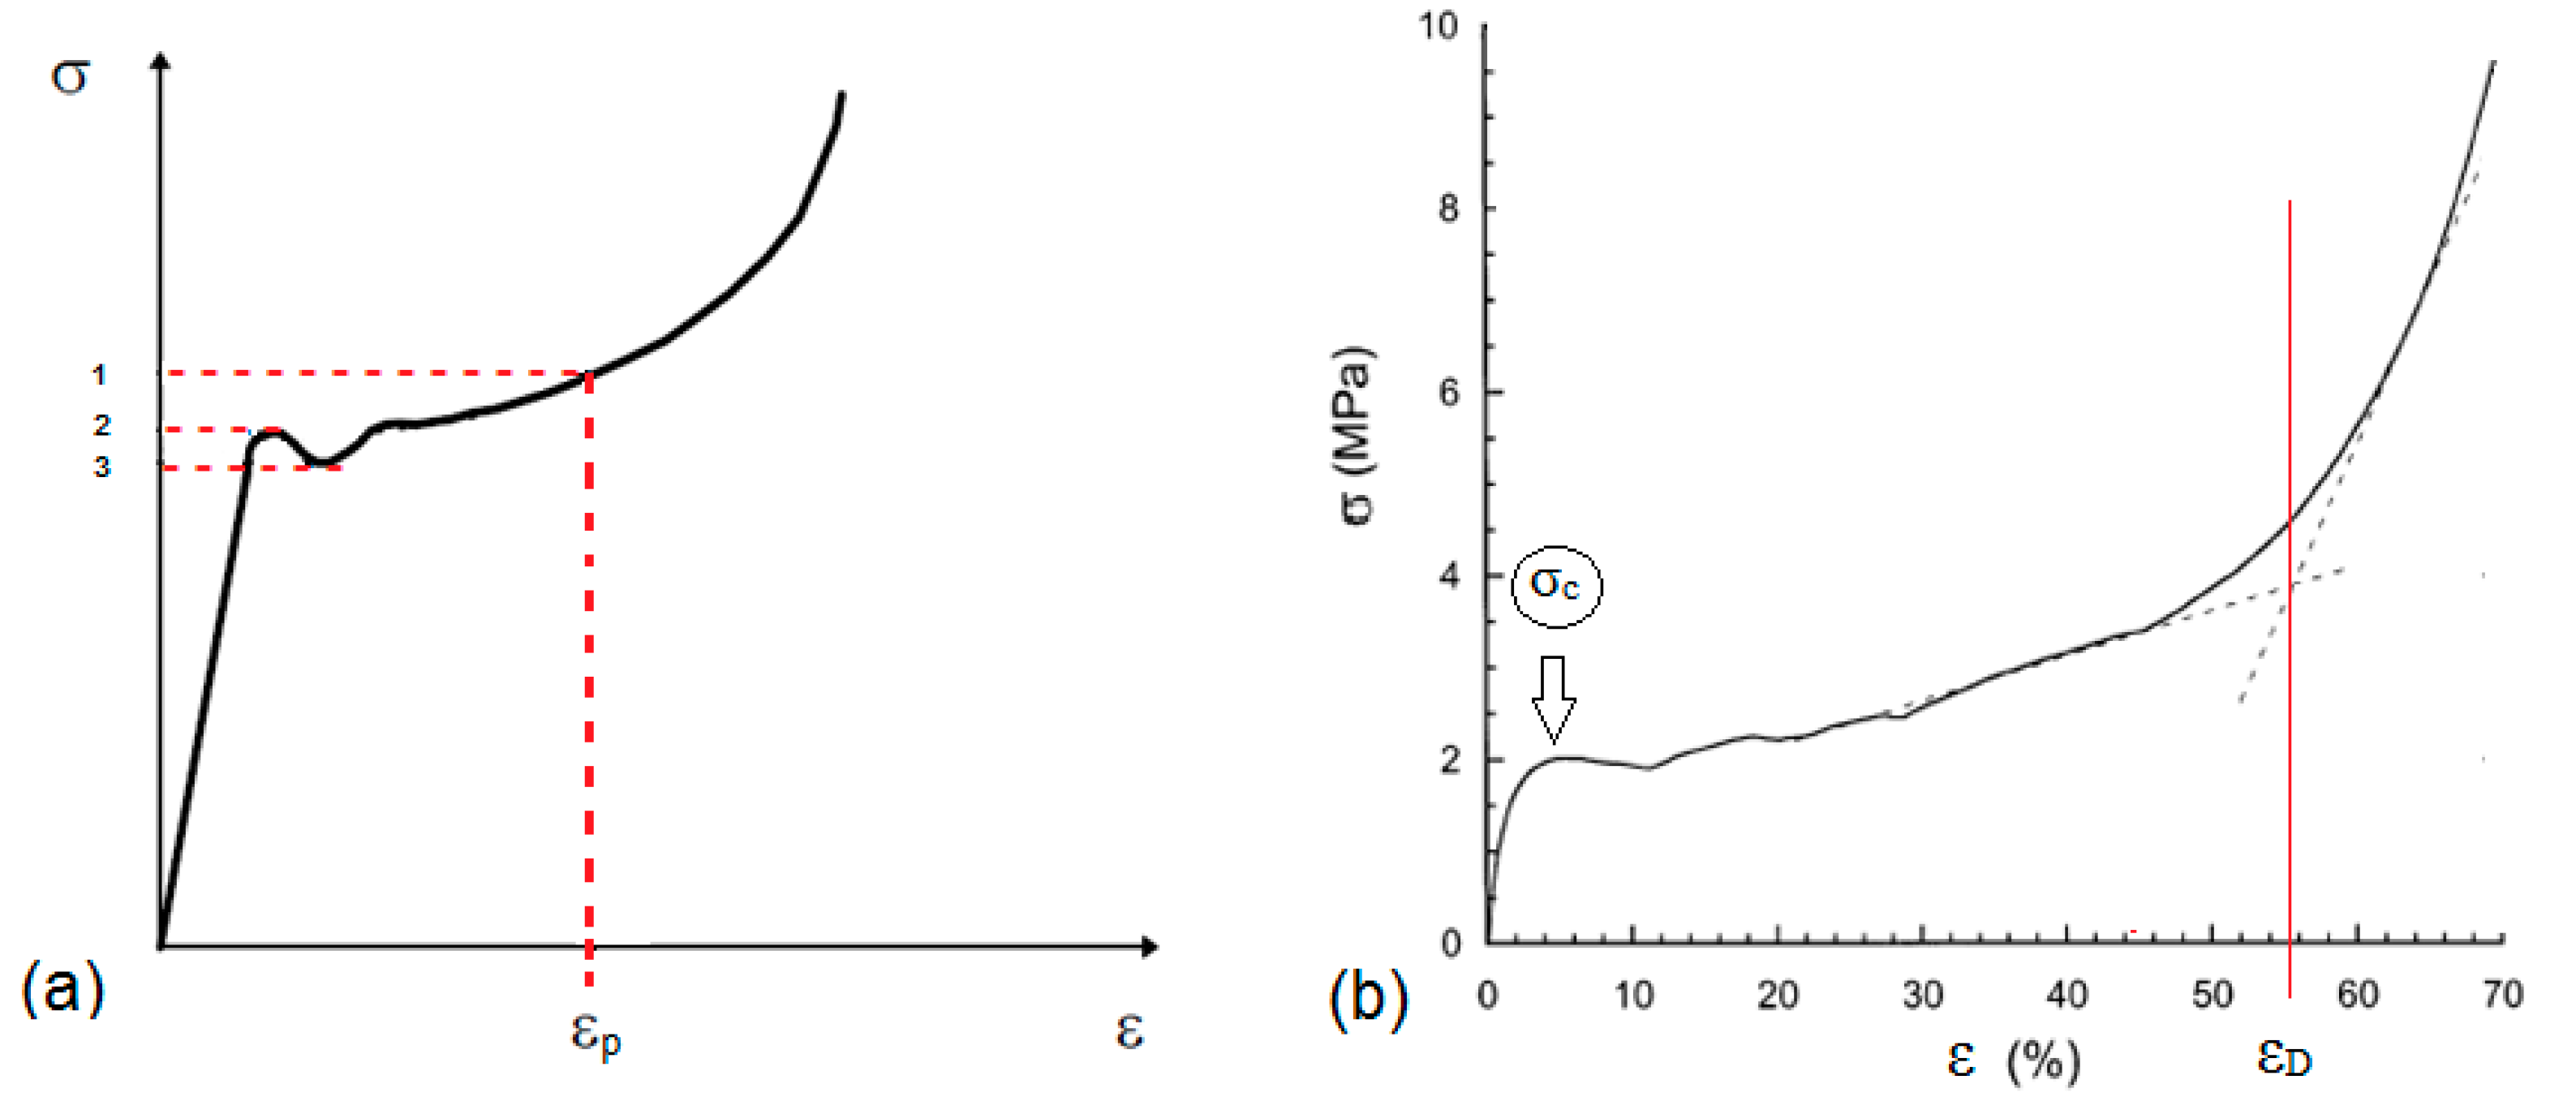
Figure 1 presents typical stress–strain curves of metallic foams under compression. Different specimen sizes and cross-head speeds were considered initially to choose proper test parameters. Finally, it was decided to use specimens with compression area of 100 mm2 (A = 10 × 10 mm2) and the cross-head speed 0.001 mm/s for all the tests and analyses. The compression tests under dry and wet conditions were carried out by Instron machine (ElectroPuls E1000, Instron, Norwood, MA, USA) with a 2 kN load cell. The details of the procedure for choosing the test parameters as well as the dry compression stress–strain curves of all the iron foam samples are available in Section B of the Supplementary Materials (Figures S2–S5).
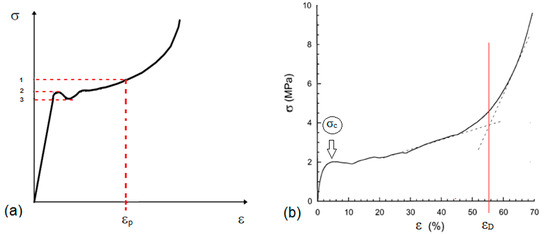
Figure 1.
(a) A typical stress–strain curve of a foam under compression, numbers indicate different methods to define the compression strength; and (b) determination of densification strain. Adapted from [21,22].
Given that the biological environment within the body is not dry, wet compression tests were carried out on IF80 specimens to provide a more realistic condition. The tests were conducted within Hanks’ solution (H1387, Sigma Aldrich, Saint Louis, MO, USA) at 37 °C filled into a cylindrical bath (inside diameter = 140 mm, solution fill height = 50 mm) mounted on the Instron machine after the specimen is fixed without gap within the platens (diameter = 50 mm, thickness = 25 mm) and before loading. The configuration allowed the solution to escape during compression and hydrostatic pressure was avoided. In addition, considering that the environment within the body is corrosive, static immersion tests were conducted on IF80 specimens to investigate the effects of degradation on mechanical behavior of iron foams. In the static immersion, the specimens were hung from a wire and submerged in 100 mL of the Hanks’ solution then placed in separate incubators (ThermoFisher Scientific, Waltham, MI, USA) for three or seven days at 37 °C and 5% CO2 atmosphere. The compression test parameters and the specimen nominal sizes were identical to those of the previous dry and wet tests. Finally, a few compression tests were performed on IF45 specimens in order to understand the deformation and failure mechanism of iron foams under compression. To do so, the specimens underwent compression up to different strain levels and then they were observed under SEM.
2.2.2. Compression Properties
In order to assess the mechanical behavior of the iron foams, the following properties were determined using the stress–strain response of the specimens: Elastic modulus (E), yield strength (σy), compression strength (σc), densification strain (εD) and the energy absorbability per volume up to the point of densification (W). The elastic modulus values were approximated by the linear fitting tool of the Quick Fit Gadget provided in OriginPro 2016 software (OriginLab, Northampton, MA, USA). After estimating the slope of the linear elastic regime (E) on each stress–strain curve, the yield strength was approximated by 0.2% offset method [23]. For most of the iron foam specimens investigated in this study, compression strength (σc) was taken as the first local maximum after elastic regime (marked by 2 and σc in Figure 1a,b, respectively). However, if there was no apparent first local maximum, an arbitrary local maximum in the plateau region was chosen to represent the compression strength stated by Banhart and Baumeister [21]. Densification strain (εD) can be defined as a strain at which densification begins. However, because normally there is no abrupt transition from plateau regime to densification regime, εD can be defined as the intersection of the tangents to the plateau and densification regimes (marked as εD in Figure 1b) [22]. In this study, it was tried to draw the tangents from the midpoint of the plateau regime (where the second derivation is close to zero) and from a part of the densification regime where the slope seems to become stable. The points were selected by eyeballing. A larger εD implies that the material undergoes higher strains before the onset of densification. The value of energy absorbed per volume up to the densification strain (W) is equal to the area underneath the stress–strain diagram from ε = 0 to ε = εD, expressed as [22]:
The point of ε = 0 was determined as the intersection of the line continuing the linear elastic regime with the strain axis. This method was inspired from the definition of the “zero point for the compressive strain” provided in [20]. High energy absorption capacity indicates the higher level of impact absorption by the material. However, in order to study the impact behavior in a more comprehensive fashion, conducting dynamic impact tests with higher strain rates beside static tests is recommended [24].
2.3. Statistical Analysis
Values of E, σy, σc, εD and W were compared against one another for different groups of specimens via statistical analysis and were shown as mean ± standard deviation. In order to draw a reliable conclusion, hypothesis tests (One-way ANOVA, t-test) along with non-parametric tests (Kruskal–Wallis ANOVA, Two-Sample Kolmogorov–Smirnov Test) were carried out in the OriginLab software. The non-parametric tests were conducted due to the small sample sizes. Unlike parametric hypothesis tests, the normal distribution of population is not assumed when conducting non-parametric tests [25].
3. Results
3.1. Iron Foam Structure
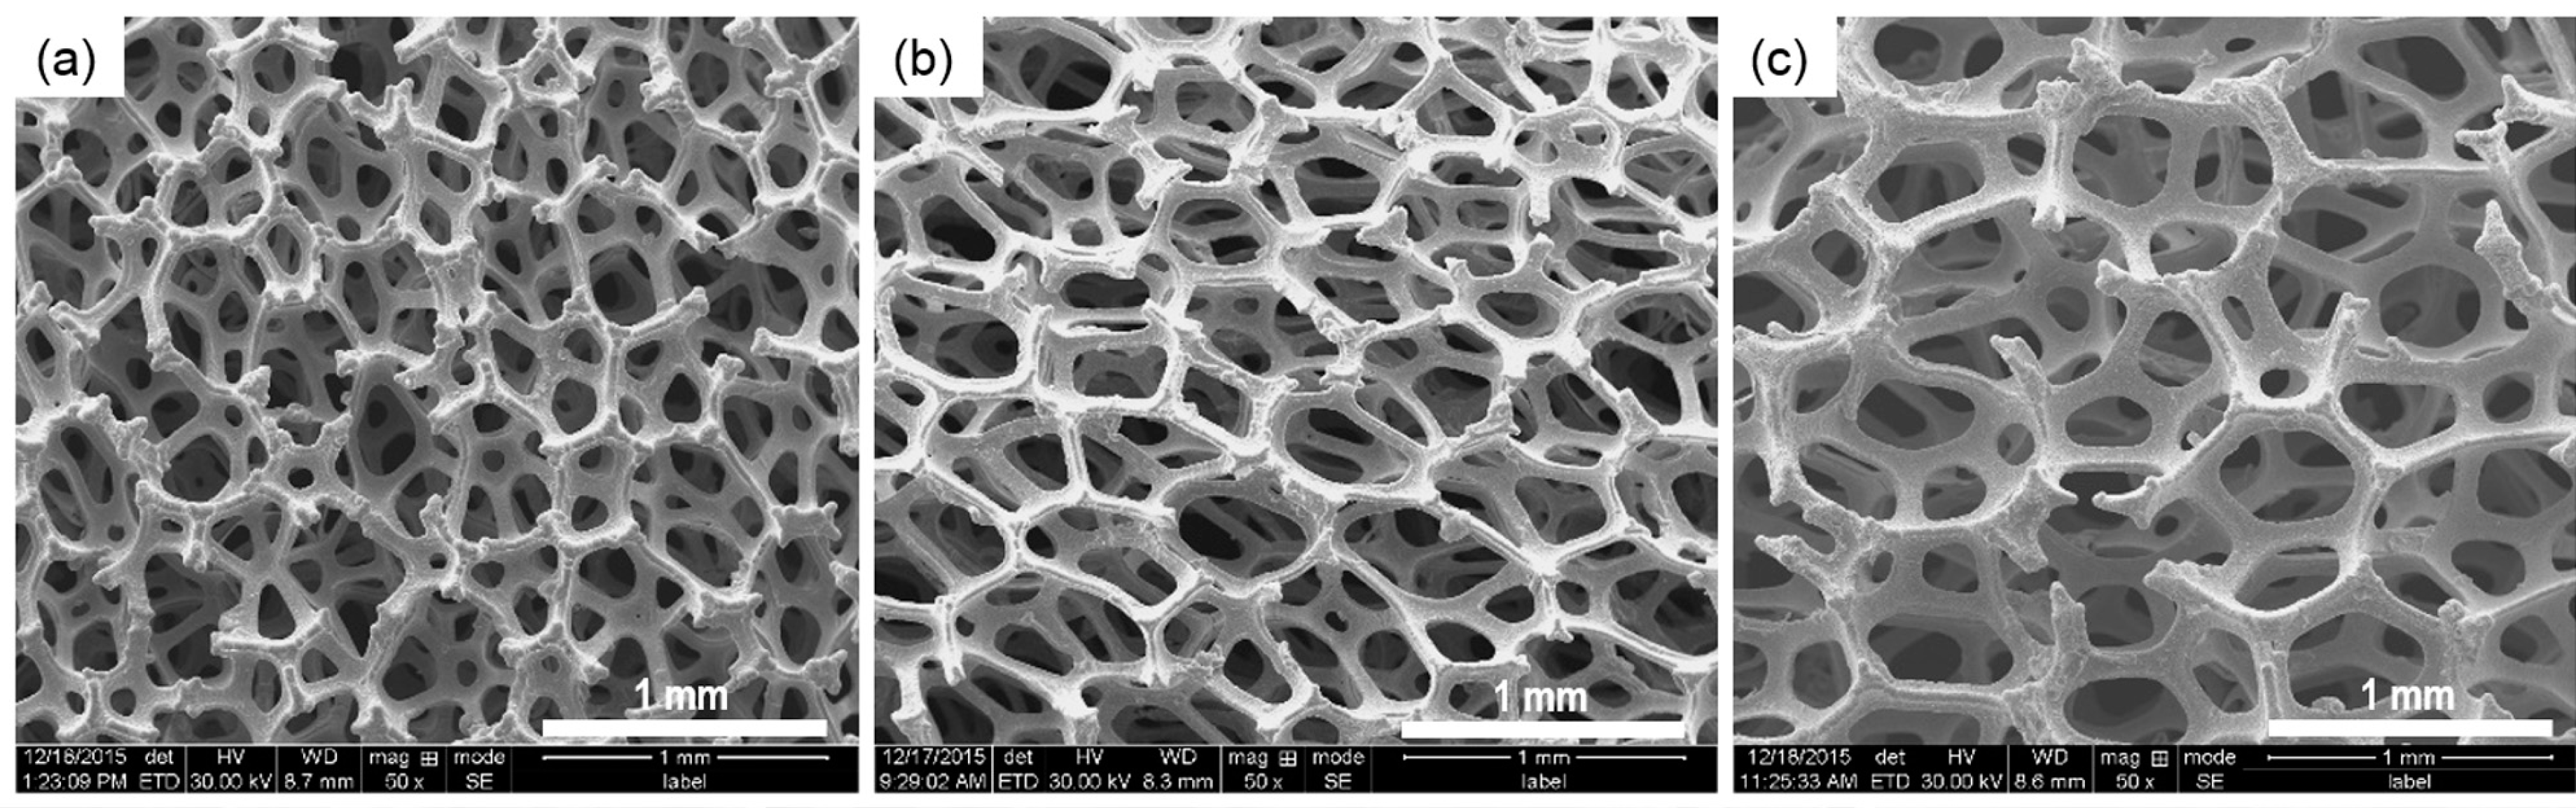
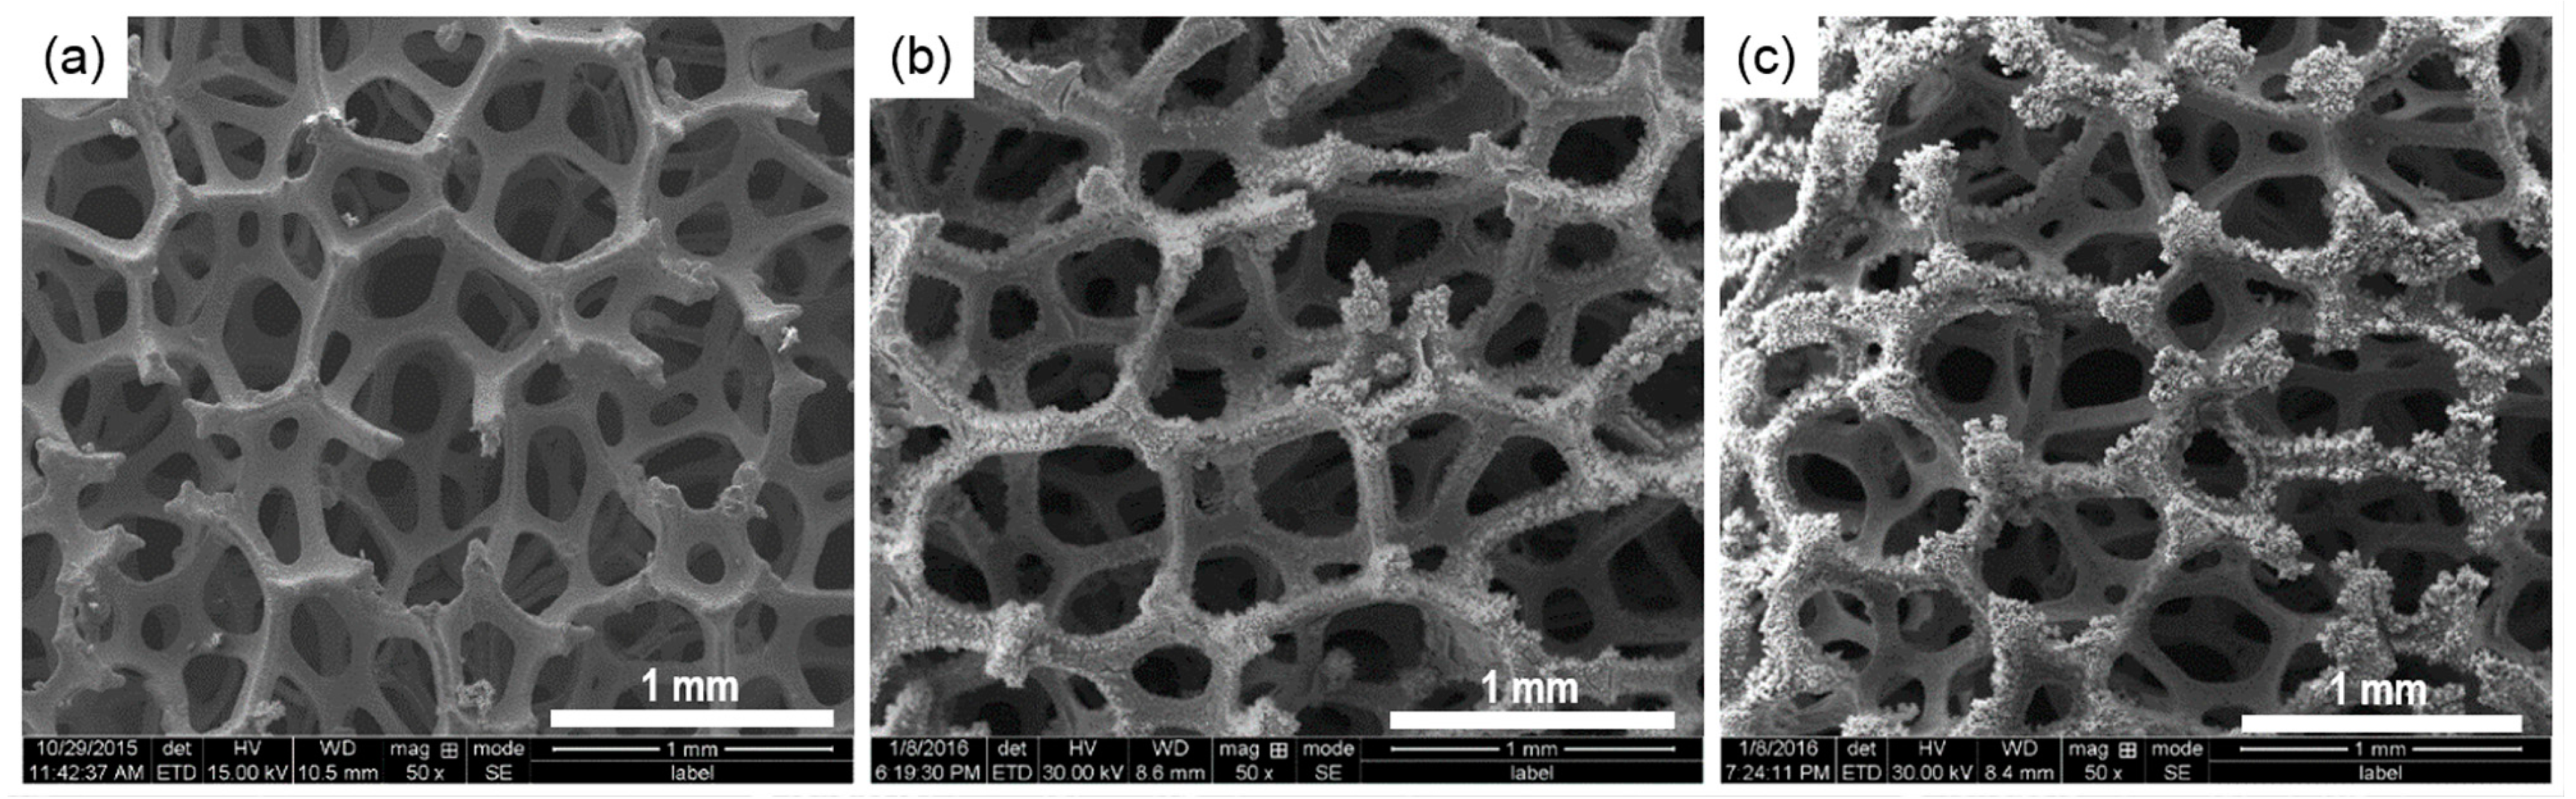
Figure 2 depicts the structure of iron foams with different average cell sizes. It shows that IF80 specimens tend to have thicker struts than those of IF45 and IF58 specimens. Strut thicknesses of the iron foams of different cell sizes are shown in Table 1. The mean values of both branch-strut and end-strut thicknesses of the IF80 specimen are significantly higher than those of the IF45 and IF58 specimens. Definition of cell size, branch-strut and end-strut as well as detail measurement are given in Figure S1 and Table S1 of the Supplementary Materials.

Figure 2.
Scanning electron microscope (SEM) images of iron foam structures: (a) IF45; (b) IF58; and (c) IF80.
3.2. Dry Compression Behavior of the Iron Foams
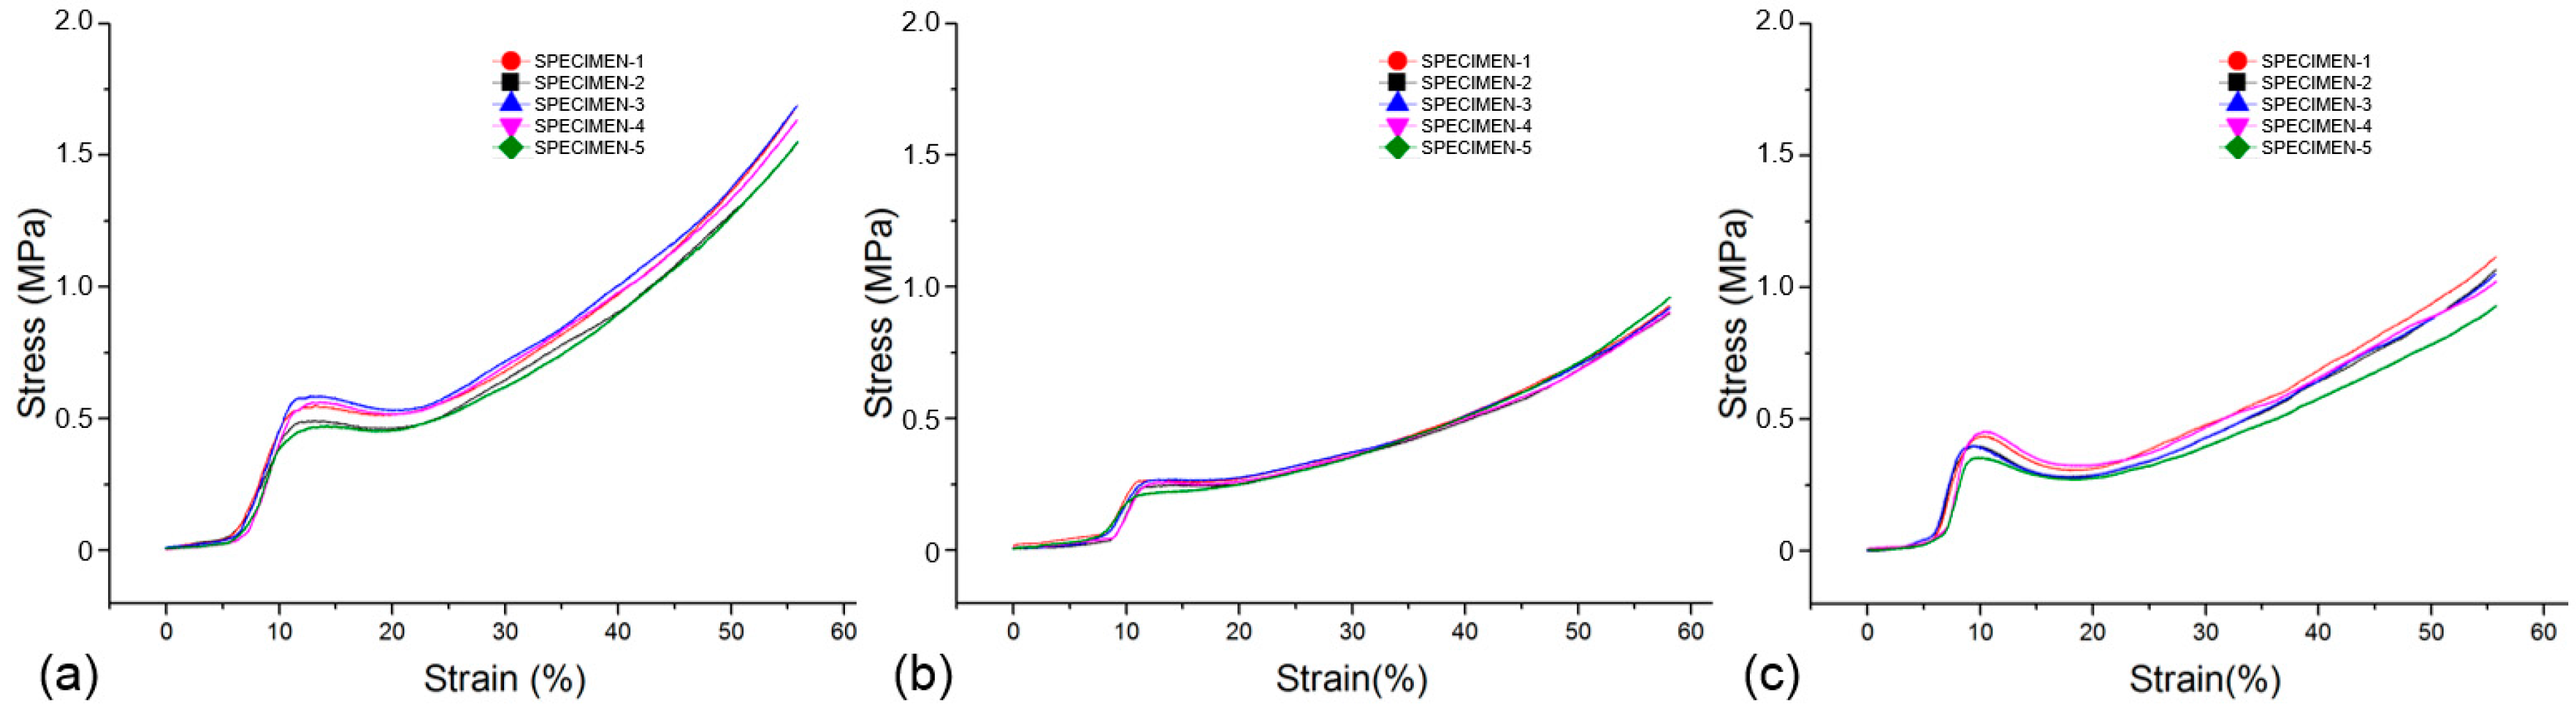
The stress–strain curves resulted from the dry compression tests on iron foams of different cell sizes are shown in Figure 3. The shifting of the curves within a sample group can be the result of non-identical micro configurations even if they are in the same sample group. The IF45 specimens tend to have higher compression strength than those of IF58 and IF80 specimens. Strain hardening up to the peak followed by a softening is more visible in the stress–strain curves of IF45 and IF80 specimens than those of IF58 specimens. Thus, the local maximum after the linear elastic regime followed by a local minimum in IF58 curves does not stand out as much as it does in IF45 and IF80 curves. The IF58 specimens seem to experience a shorter plateau region than that of IF45 and IF80 specimens. In general, IF45 specimens tend to have the highest strength under compression as they experience the highest level of stress in all regimes. The compression properties of the iron foams are summarized in Table 2. There exists a “V-type” variation of the mechanical properties with respect to the cell sizes, i.e., the mean values of the compression properties of the iron foams of 580 µm nominal cell sizes tend to be lower than those of the specimens with 450 and 800 µm nominal cell size.
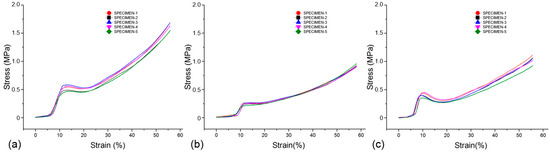
Figure 3.
The stress–strain curves of the dry compression tests for different cell sizes: (a) IF45; (b) IF58; and (c) IF80.
Table 2.
Compression properties of iron foam specimens tested in dry condition.
3.3. Compression Behavior of Iron Foams in Hanks’ Solution and after Degradation
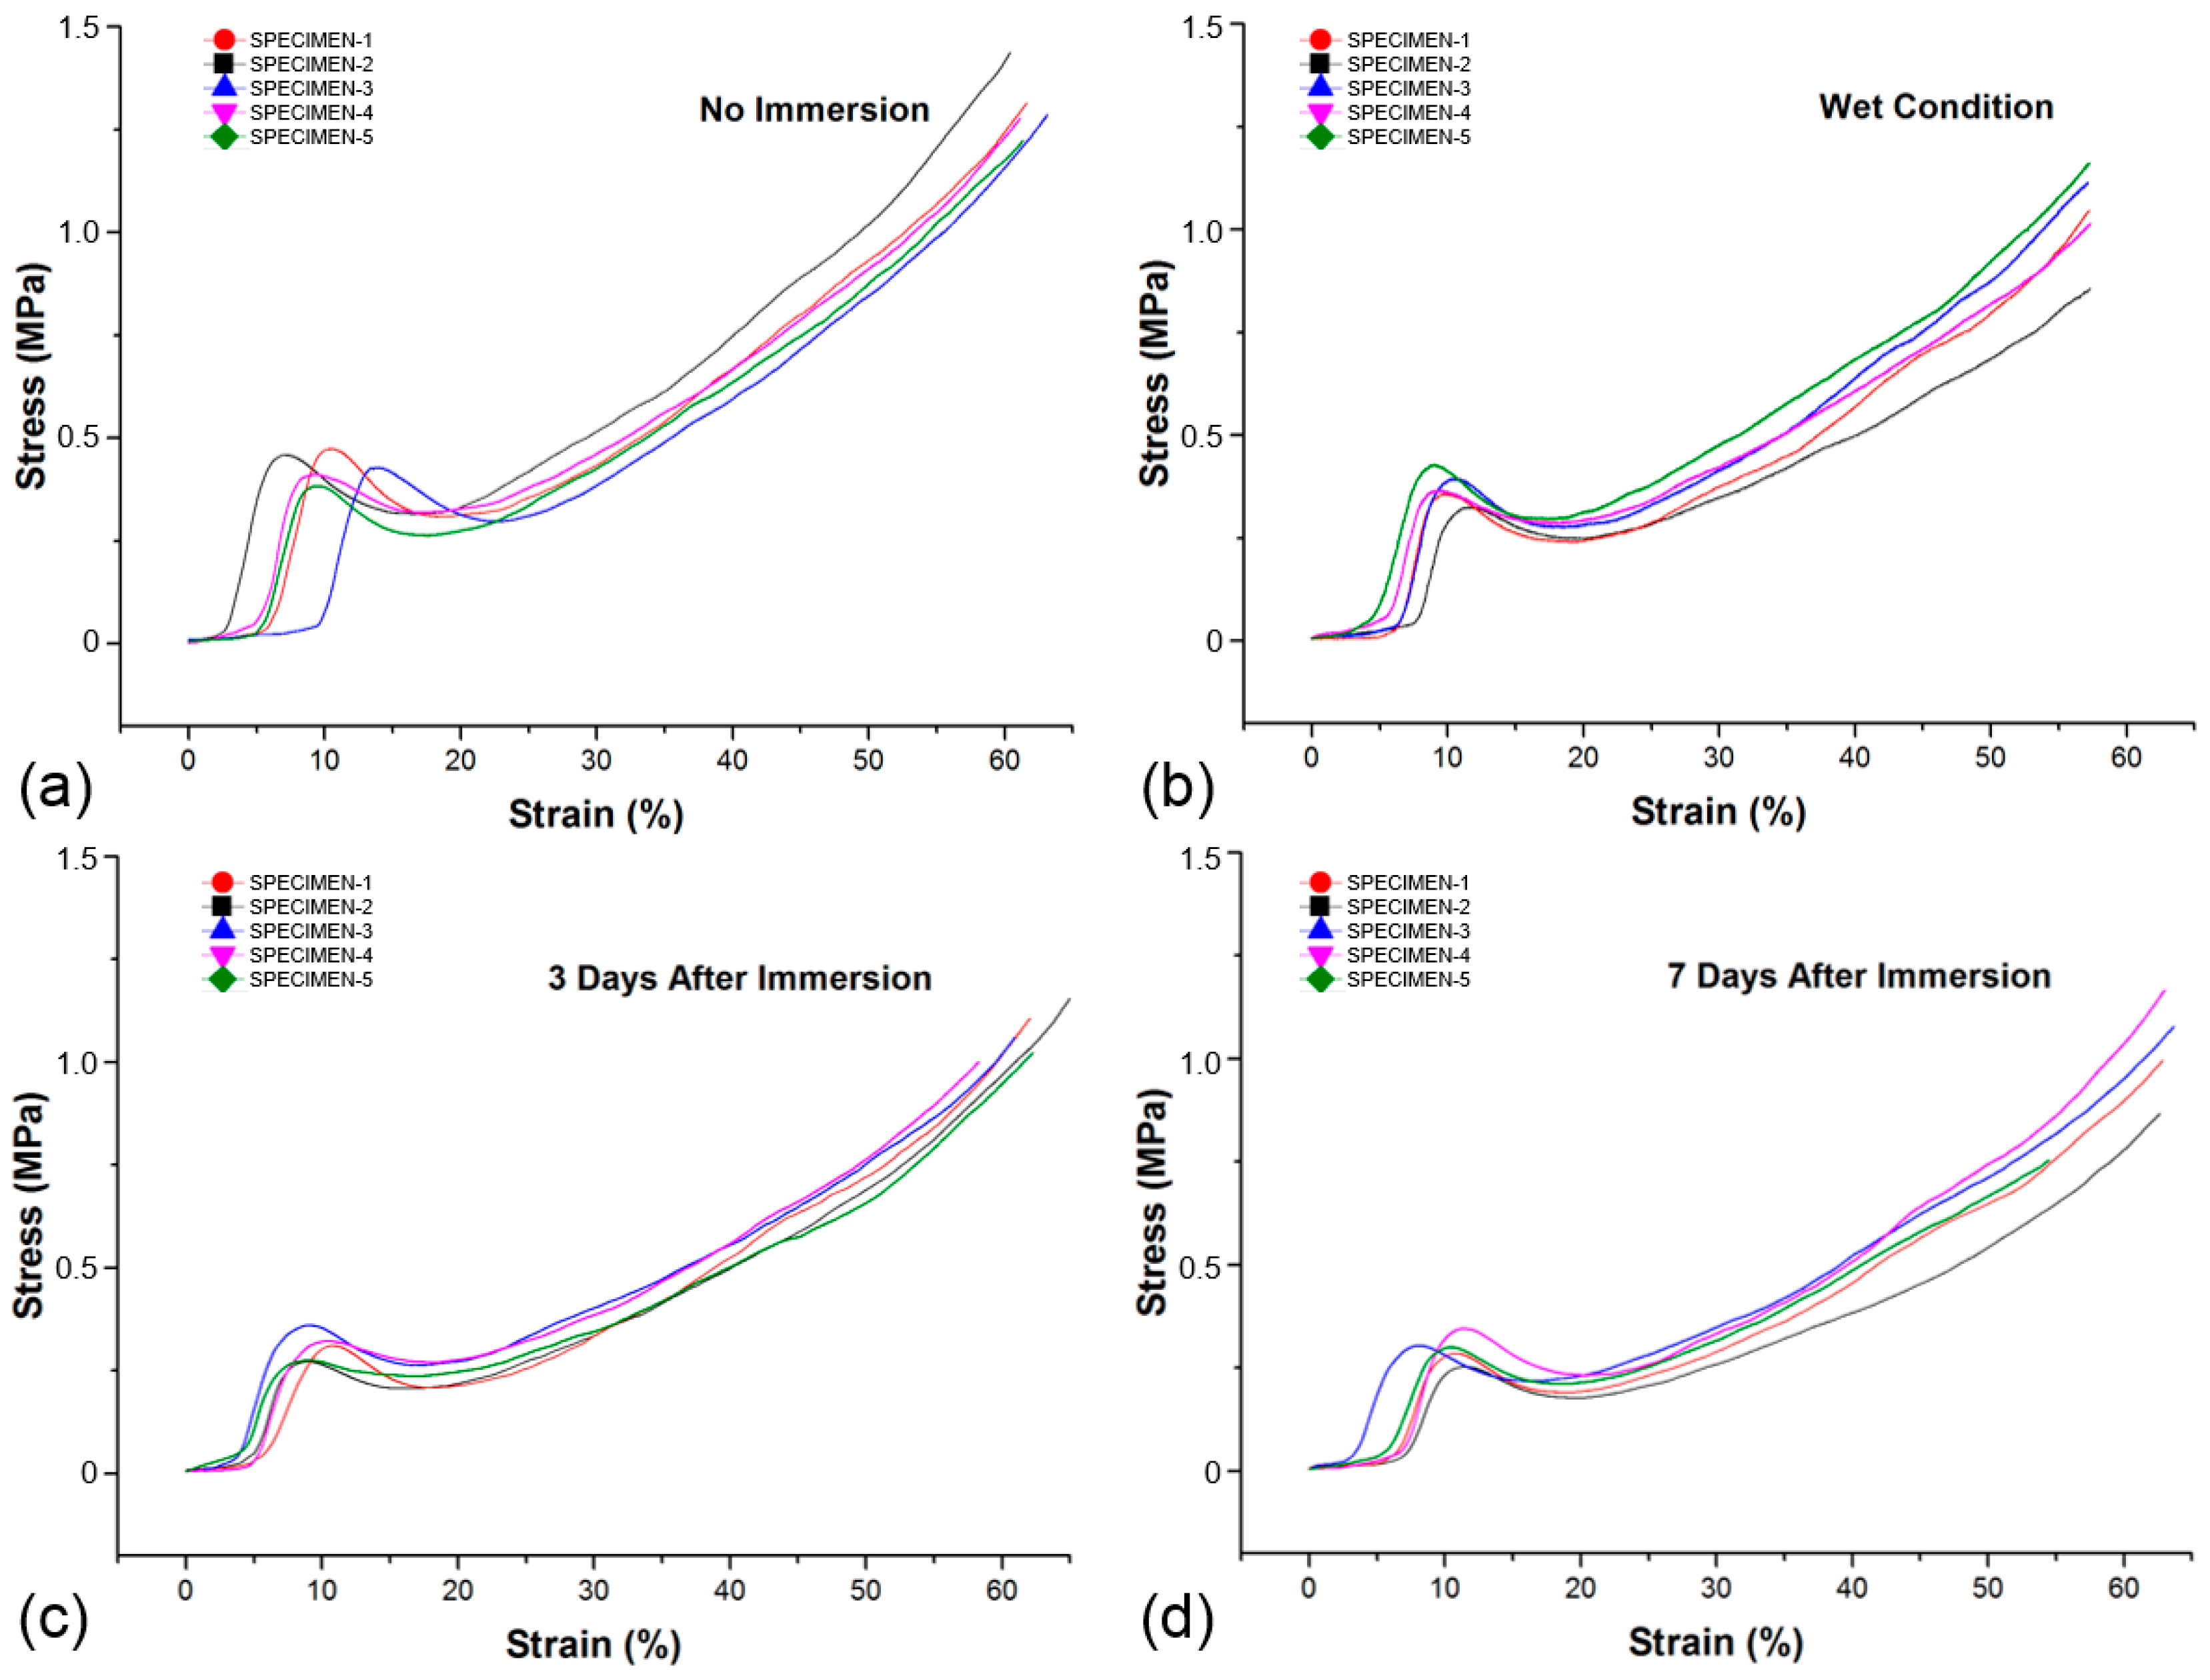
Elastic modulus, yield and compression strength, densification strain and energy absorbability of five IF80 specimens under wet compression tests were calculated and compared against those of IF80 specimens which had undergone dry compression. The properties of specimens after three- and seven-day immersions were also compared with those which had not undergone any immersion. The stress–strain diagrams and mean values of compression properties are demonstrated in Figure 4 and Table 3, respectively. None of the properties are significantly affected by the wet environment. Differently, the compression behavior of IF80 iron foams was affected after three- and seven-day immersions in Hanks’ solution as shown in Figure 4c,d and in Table 3. All the calculated compression strength decreased as a result of degradation. However, these reductions are not significant for densification strain and between the three and seven days after immersion samples.
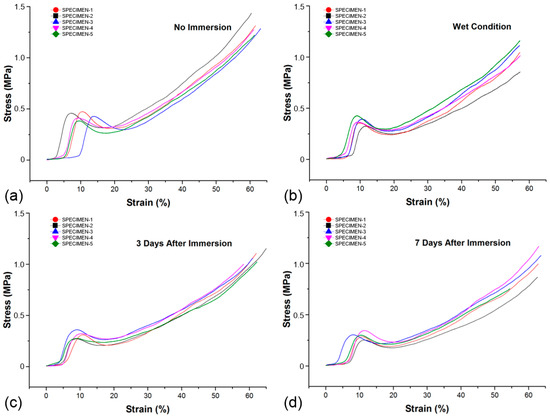
Figure 4.
The stress–strain curves of IF80 specimens: (a) no immersion; (b) wet conditions; (c) three days after immersion; and (d) seven days after immersion.
Table 3.
Compression properties of IF80 specimens under dry and wet condition, and after immersion tests.
3.4. Statistical Analysis
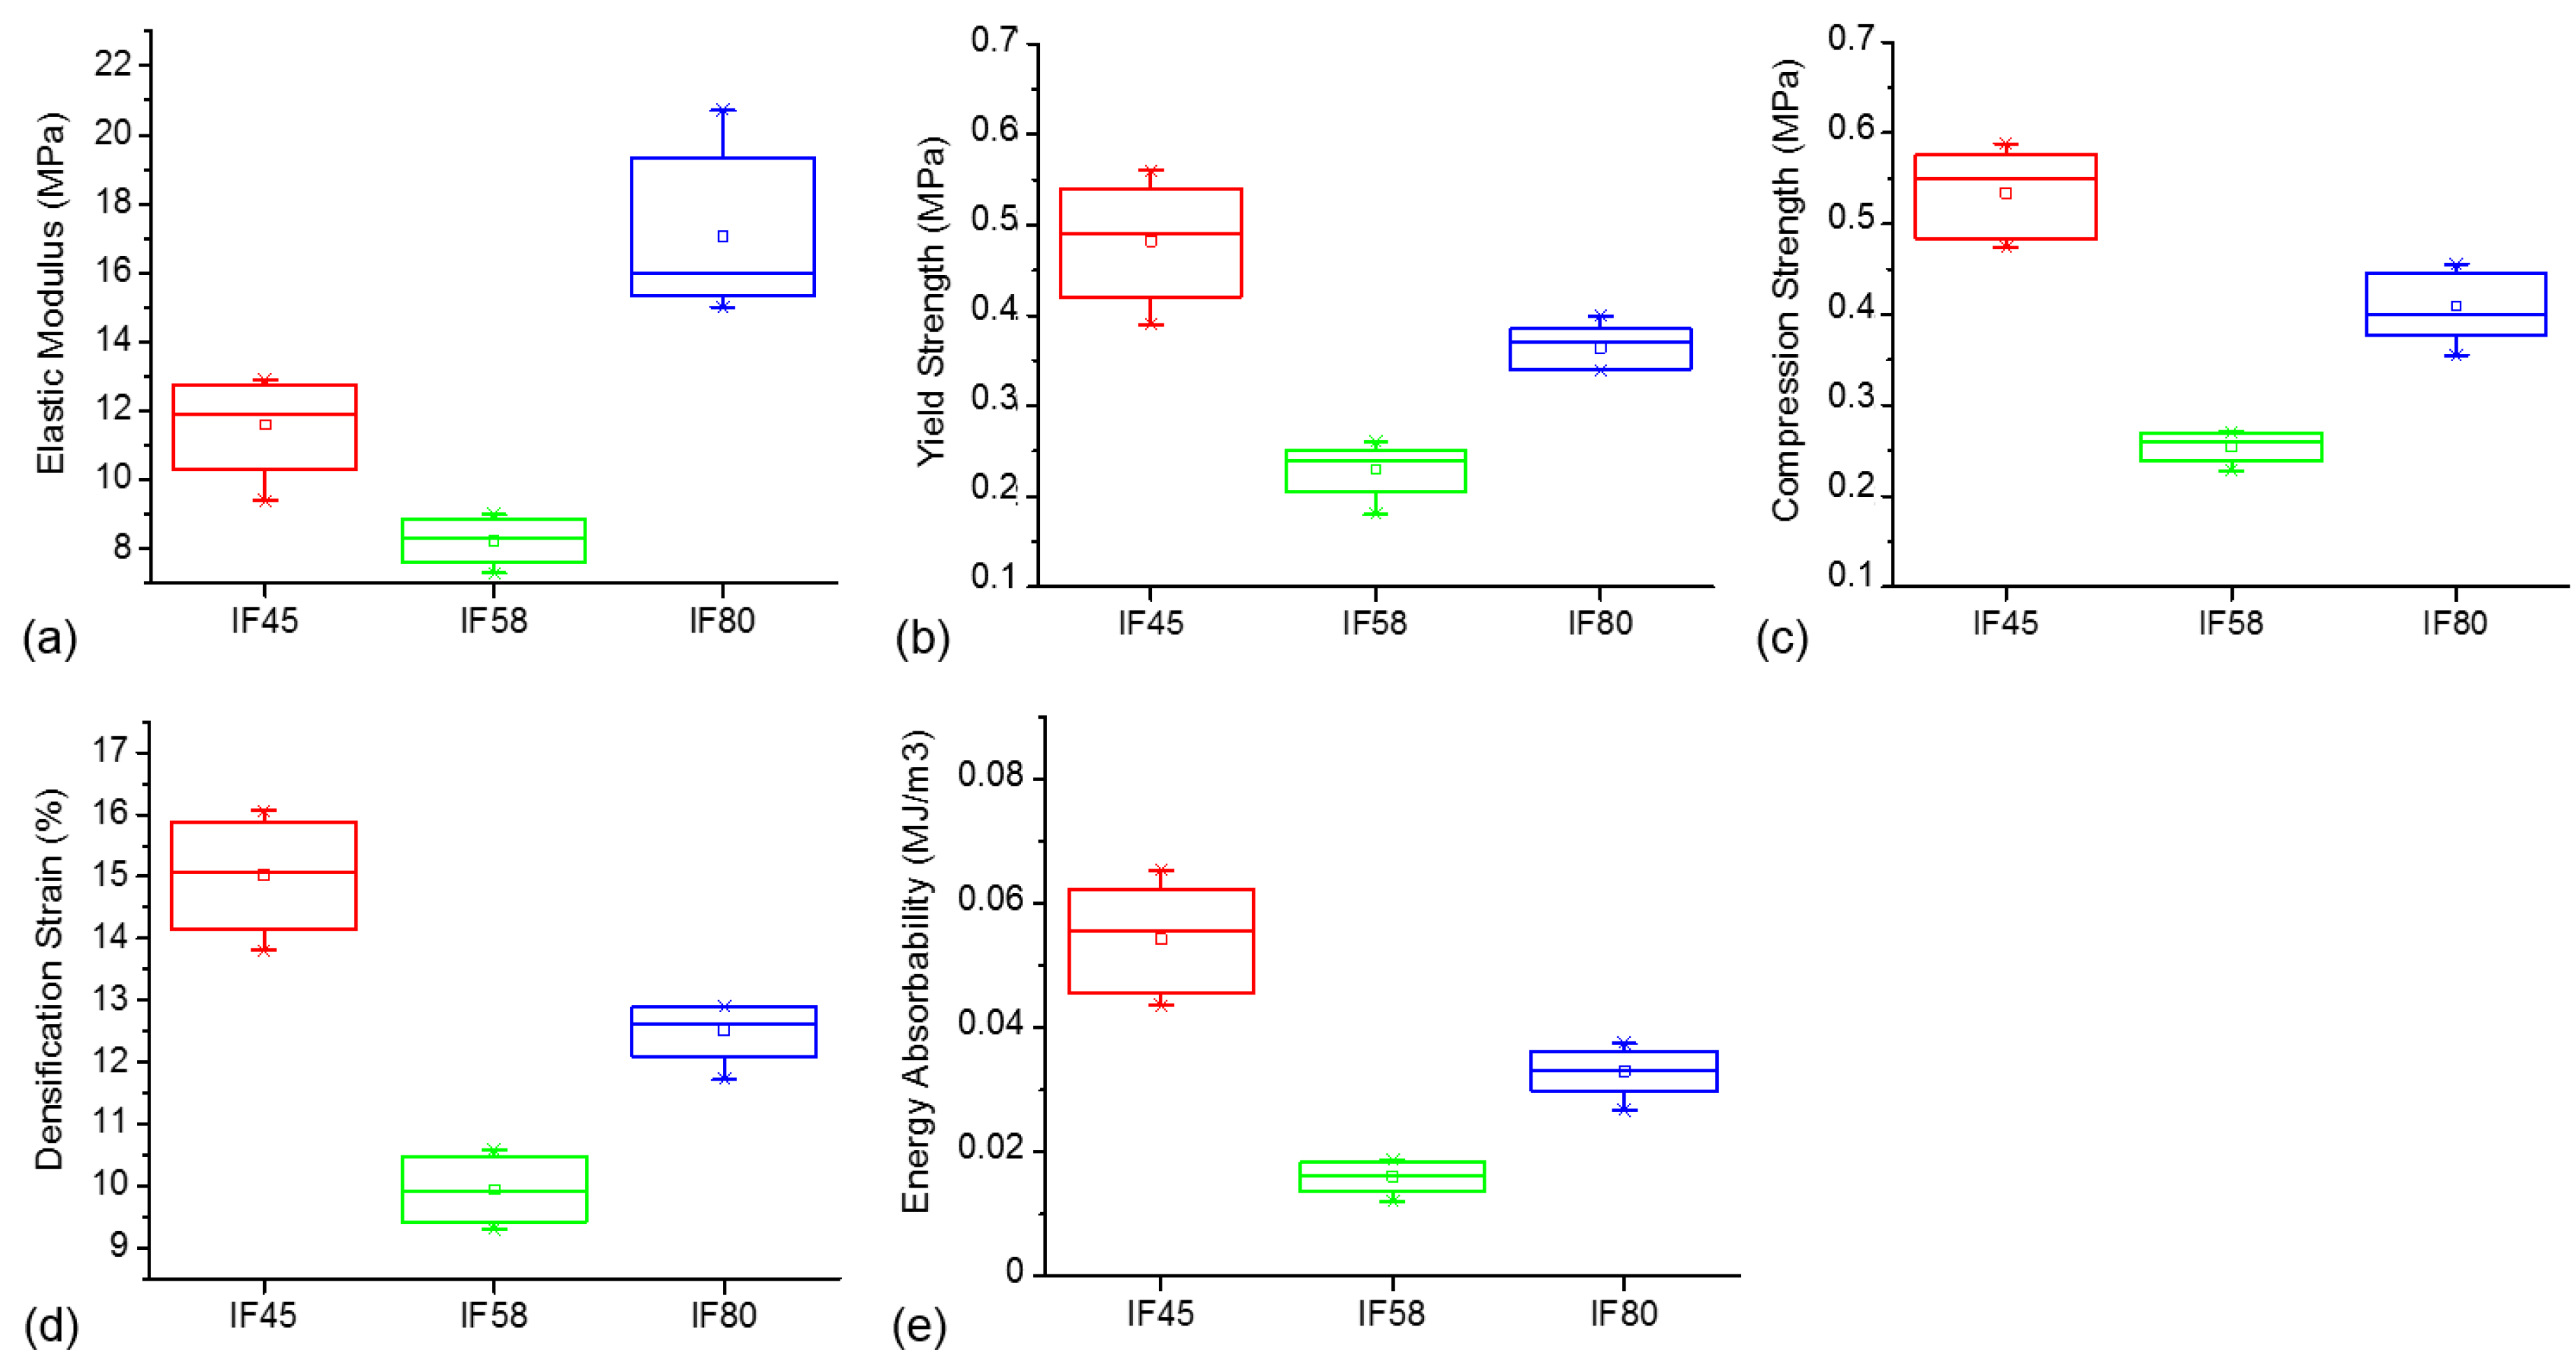
Both hypothesis tests (ANOVA and Tukey) and non-parametric tests were employed to investigate the significance of differences among the values of the elastic and plastic properties of the different iron foams. Figure 5a,b represents the elastic modulus (E) and yield strength (σy) box-charts of the specimens under compression, respectively. Although both of the properties represent a V-type variation, an interesting difference is observed between the two: highest elastic modulus is presented by IF80 specimens, while the highest yield strength is presented by IF45 specimens. Indeed, among all the determined properties, it is only the elastic modulus that has a V-type variation in which IF80 specimens present the highest values. Figure 5c depicts the compression strength box-charts of the iron foam specimens of different cell sizes. The figure shows a V-type variation of the strength (Figure 5c). The mean values of compression strengths within IF45, IF58 and IF80 samples were 0.53, 0.255 and 0.41 MPa, respectively. According to the ANOVA and Tukey tests, at α = 0.05, all the population means of σy, E and σc were significantly different from one another. The results obtained from non-parametric tests agreed with those of hypothesis tests: the null hypothesis in Kruskal–Wallis ANOVA test was rejected at significance level of 0.05. Two-sample Kolmogorov–Smirnov (K–S) tests with significance level of 0.05 were carried out within each possible sample pair. The results of K–S tests showed that all the distributions were significantly different from one another, except for the case of the yield strength difference between IF45 and IF80 samples which contradicts the result drawn from the Tukey test. However, given the difference shown by the box-chart of Figure 5b, the Tukey test result seems to be more reliable, i.e., the difference between the yield strength value of IF45 and IF80 populations is significant.
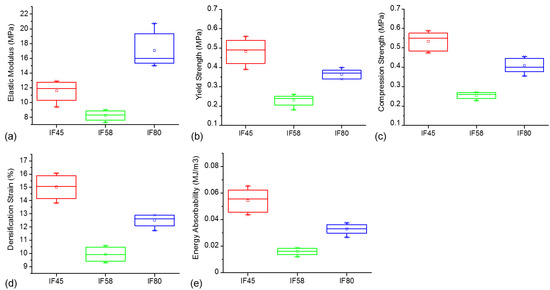
Figure 5.
Box charts for iron foam specimens of different cell sizes: (a) elastic modulus; (b) yield strength; (c) compression strength; (d) densification strain and (e) energy absorbability.
Figure 5d depicts the densification strain (εD) box-charts of the iron foam specimens of different cell sizes. Similar to the compression strength variations, IF45 and IF58 samples show the highest and the lowest values of densification strain, respectively (V-type variation). Both One-way ANOVA and non-parametric Kruskal–Wallis ANOVA tests were conducted to evaluate the significance of difference between the populations. Based on the ANOVA and Tukey test results, all the population means were significantly different form one another with a significance level of 0.05. This was in agreement with the result obtained by Kruskal–Wallis ANOVA test at α = 0.05, and the three two-sample K–S tests between pairs at α = 0.05. Therefore, it can be concluded that IF45 and IF58 samples possess the highest and the lowest level of densification strain, respectively. Figure 5e depicts the amount of absorbed energy per Volume (W) up to the densification strain for specimens of different cell sizes which was also compared against one another via one-way ANOVA, Tukey, Kruskal–Wallis ANOVA, and Two-Sample Kolmogorov–Smirnov (K–S) tests. The mean value of energy absorbability within IF45, IF58 and IF80 samples was 0.054, 0.016 and 0.033 MJ/m3, respectively. According to the Homogeneity of Variance test results, the population variances were significantly different (α = 0.05) which violates the equality-of-variance requirement to perform ANOVA test. Although the ANOVA test results stated that at least two populations are significantly different, three two-sample t-tests at significance level of 0.01 were performed due to the violation. The results of the t-tests suggest that every population is significantly different from the other two (α = 0.01). Same conclusion was drawn from performing a Kruskal–Wallis ANOVA test in conjunction with three two-sample Kolmogorov–Smirnov (K–S) tests at significance level of 0.05. Therefore, it is concluded that iron foams of 450 µm and 580 µm average cell sizes have the highest and the lowest level of energy absorbability, respectively.
To compare the results of wet and dry compression tests, both two-sample t-test and two-sample non-parametric Kolmogorov–Smirnov test at significance level of 0.05 were utilized. For the case of the elastic modulus, E, the t-test showed that the difference between the values of the two groups was significant which disagreed with what the Kolmogorov–Smirnov test suggested, i.e., the two distributions were not significantly different. Thus, considering that the values of E were just an estimation and that the sample sizes were small, it is not feasible to make a reliable comment on the elastic behavior of the iron foams within the wet environment. However, for the other compression properties the results of the statistical tests were consistent. Although the results of compression tests showed that under wet condition, the mean values of the σy, σc, εD and W tended to be slightly lower than those of the dry tests, the results of all the hypothesis and non-parametric tests showed otherwise: None of the calculated mechanical properties under wet condition were significantly different from those of dry compression. This suggests that the wet environment did not significantly influence the mentioned mechanical properties of the iron foams.
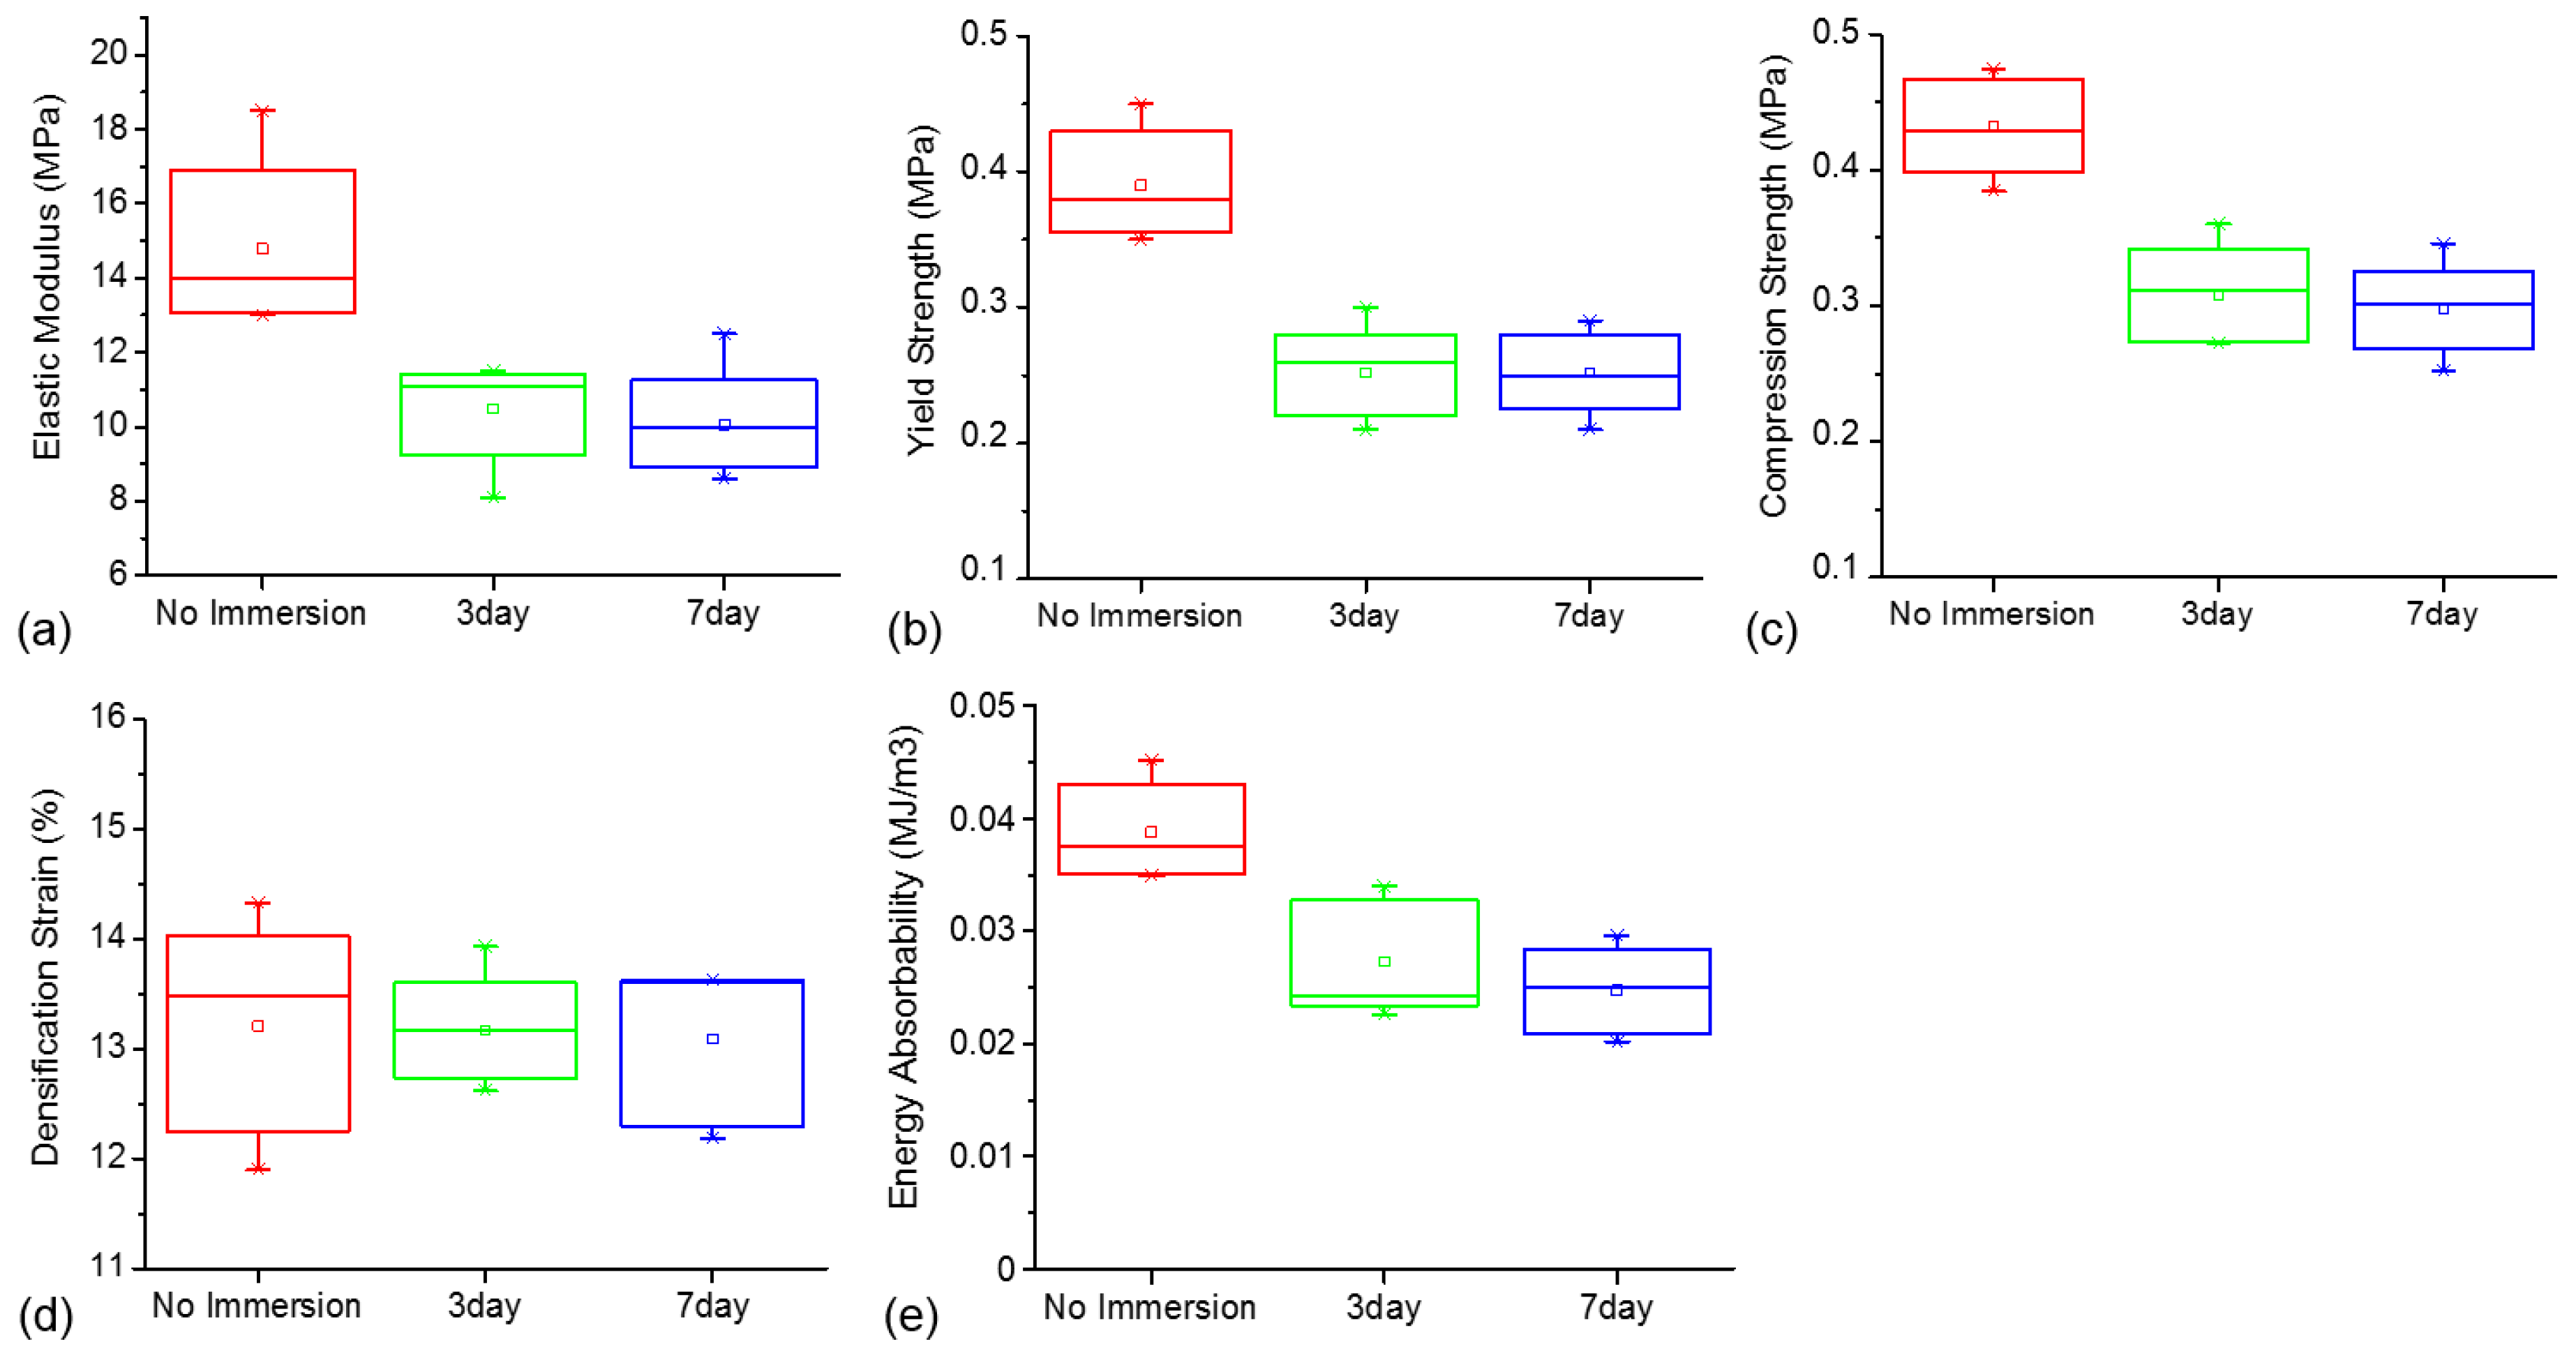
The significance of difference between the mechanical properties of the iron foams after different periods of immersion was investigated via hypothesis and non-parametric tests. Figure 6a–c,e depicts the elastic modulus, yield strength, compression strength and the energy absorbability box charts of IF80 specimens after three- and seven-day immersion tests, respectively. In addition, the box charts samples upon which no immersion test was performed are included. The figure shows that there is a relatively high reduction in the levels of all the four properties after three-day immersion (Figure 6). In addition, the result of one-way ANOVA indicated that (α = 0.05), at least two sample population were significantly different, and the results of Tukey test showed that (α = 0.05) the mean differences between “three-day immersion” and “seven-day immersion” samples were not significant unlike the other two comparisons, i.e., “no immersion–three-day immersion” and ”no immersion–seven-day immersion” samples. Identical conclusions were drawn from conducting Kruskal–Wallis ANOVA tests in conjunction with three Kolmogorov–Smirnov tests within the sample pairs at α = 0.05.

Figure 6.
Box charts for iron foam specimens of different immersion time: (a) elastic modulus; (b) yield strength; (c) compression strength; (d) densification strain and (e) energy absorbability.
Figure 6d depicts the densification strain box-charts of IF80 iron foam specimens after three- and seven-day immersions as well as those on which no immersion test was performed. Looking at the box-charts, the difference between the densification strain levels does not seem to be significant. As the normality of the densification strain values within each sample group was evaluated by Shapiro–Wilk tests, it appeared that the normality of “seven-day immersion” sample population was rejected unlike the other two groups. The result of one-way ANOVA and Kruskal–Wallis ANOVA showed that at α = 0.05, the difference between the sample population were not significant. Although the normality requirement for the ANOVA test was violated, the result of the test is expected to be valid given the proximity of strain densification mean values of the samples.
3.5. Deformation of the Iron Foams after Compression
To understand the deformation and failure mechanism of open cell iron foams during compression, various compression tests were conducted on IF45 specimens followed by SEM observation of the compressed specimens. Figure 7 depicts four specimens compressed up to strain levels of 10.8%, 12.8%, 29.8% and 49.5%. The areas marked with red circles depict the struts that experienced bending or plastic deformation. Because the direction of the compression force is perpendicular to the image surfaces, it is difficult to identify buckling in the struts, if it existed. However, considering that the majority of the struts are not completely perpendicular or parallel to the loading direction, it is expected that both bending and buckling contribute to the deformation of some struts.
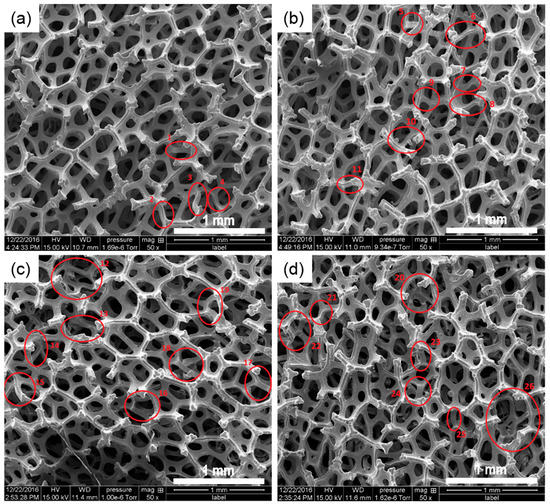
Figure 7.
Deformed structure of four IF45 specimens at compression strain of: (a) 10.8%; (b) 12.8%; (c) 29.8%; and (d) 49.5%.
Figure 8 depicts the magnified images of some marked regions in Figure 7. It shows the deformation of struts of four specimens at different stages of compression after elastic regime. In samples with the maximum compression strain levels of 10.8%, 12.8% and 29.8%, formation of S-shape plastic hinges in some of the marked regions can be observed, e.g., region 2, 3, 7, 8, and 14 (Figure 8a). C-shape bending is observed in some of the struts of specimens with compression strains of 29.8% and 49.5%, e.g., region 13, 24 and 26 (Figure 8b). Plastic S-shape and C-shape deformation in some struts of open cell aluminum alloy (A356) and 316L stainless steel foams under quasi-static compression has been observed in the previous works by others [26,27]. Deformation bands are present in a few struts of the specimen with the highest level of compression strain (49.5%). These adjacent struts are marked with red circles of number 21, 23 and 27 (Figure 8c).
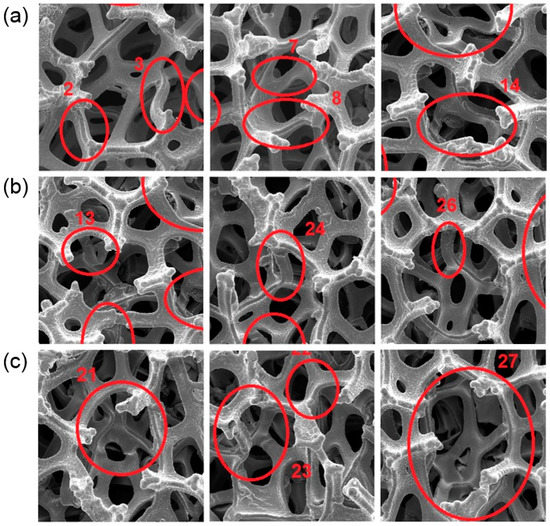
Figure 8.
Different shapes formed on plastically deformed struts: (a) S-shape; (b) C-shape; and (c) deformation bands.
3.6. Morphology of the Iron Foams after Immersion Tests
Figure 9 depicts the morphological structure of three specimens, one of which was not immersed and the other two were immersed in Hanks’ solution for three and seven days. As shown in the picture, layers of corrosion products were formed on the struts after immersion. The figure suggests that the layers on seven-day immersed specimen are thicker than those on three-day immersed specimens.
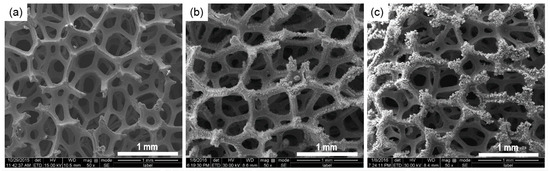
Figure 9.
Morphology of the IF80 samples: (a) no immersion test; (b) after three-day immersion; and (c) after seven-day immersion.
4. Discussion
4.1. Effect of Structural Properties on Elastic and Plastic Compression Behavior of Iron Foams
As mentioned in the previous sections, stress–strain curves of iron foams under compression are composed of three main regimes: linear elastic, plateau and densification. In the case of metal foams, or other foams made of materials with a plastic yield point, as the stress goes beyond the linear elastic region, plastic collapse takes place. The collapse of cell walls continues until the cells collapse to an extent which further strain requires much higher level of stress, starting the densification part of the compression diagrams [28]. However, the presence of some plastic deformations during elastic regime has been pointed out in compression of some closed-cell aluminum foams [29]. In addition, a significant softening after hardening was observed in many of the iron foam specimens (Figure 3). As explained in [29], softening in closed-cell aluminum foams that underwent compressive loading and unloading was attributed to the collapse of the cells resulted from the plastic collapse of a single deformation band perpendicular to the loading direction. Similarly, plastic collapse of struts/cells may have caused the softening in some of the iron foam specimens. Thus, absence of a significant softening indicates that massive cell collapses do not take place immediately after the beginning of the plateau. Lower densification strain of IF58 specimens (Table 2) could be the result of smaller end-strut thicknesses (Table S1) in IF58 specimens, making the cells weaker especially on the loaded ends, leading them to a faster densification.
In general, the mechanical properties of foams depend on structural properties and the properties of the cell-wall (parent) material [28]. The most important structural properties are relative density (the ratio of the density of the cellular material to the density of the solid material), cell type (open or close) and the level of anisotropy in the cells. The most influential cell wall properties are the solid density (ρs), the Young’s modulus (Es), the yield strength (σys), the fracture strength (σfs) and the creep parameters (ns, os and σos) [28]. Because the cell-wall material properties of the samples are not significantly different in this study, it is expected that at least some of the geometrical and structural properties such as the relative densities, cell size, pore size and strut thicknesses influence the mechanical behavior of the iron foams. In the work of Amsterdam et al. [30], it was observed that the relative density influenced the plastic collapse stress values of open cell aluminum foams. In this study, however, the relative density of IF58 and IF80 specimens are very close, so it is expected that other parameters have had more contribution to the variation of the level of the mechanical properties between the two samples. The influence of cell size on mechanical behavior of the foams has been a matter of controversy. As stated in [29], in most cases, mechanical properties of metal foams do not depend on cell size. This was observed in the study of the deformation behavior of the open-cell stainless steel conducted by Kaya and Fleck [27], wherein, at the same relative density, the inhomogeneity in the microstructure was found the influential factor and not the cell size. Investigating the influence of density, cell size and cell shape on the mechanical properties of open cell 6101 aluminum foams, Nieh et al [31] found that, under similar densities, cell size does not have any significant effect on strength while the cell shape had some influences [31]. On the other hand, there have been researchers who found the cell sizes would affect the mechanical properties of the foam or that of a lattice structure [32,33].
In their work, Jian et al. [34] observed that the compressive and fracture strength of porous NiTi alloy samples increased with decreasing mean pore size. The samples of different porosities and pore sizes went under quasi-static compression tests (crosshead speed of 2.4 mm/min) while the range of porosities and pore sizes were 53–55.6% and around 264.8–1026.6 µm, respectively. Therefore, the variation between pore size values seems to be much more considerable than that of the porosities. However, studying the effect of pore size on the mechanical properties of open cell aluminum foams with spherical pores, Bin et al. [35] demonstrated that compressive stress–strain diagrams generally raised as the pore sizes increased. The authors, however, speculated that this was “related to a change in aspect ratio of the wall thickness against the edge length” [35]. Unlike the aforementioned research works wherein increasing pore size resulted in either increasing or decreasing the compression strength, in the study of Xu et al. on biomedical porous NiTi alloys, [36] the strength values varied with pore sizes in a “S type” fashion, i.e., as the pore size increased once, the value of the strength dropped initially, and after the second and third increase of the pore size, the strength increased and decreased, respectively. They attributed this behavior of porous NiTi alloys to the pore size as well as the number of pores both of which represent the same effect on the mechanical properties of the porous alloys, i.e., the increase of the pore size and the number of pores would result in a decrease in the value of mechanical properties including the Rockwell hardness, compression strength and elastic modulus. The similar pattern in variation of the mechanical properties with increasing pore size was observed in this study (V type). According to the information provided by the manufacturer, the nominal pore density of iron foams with nominal cell size of 450, 580, 800 µm is 100–110, 90–100, and 60–70 ppi (the number of pores per linear one inch). Therefore, it is expected that the number of pores in IF80 specimens to be significantly lower than that of IF45 and IF58 specimens around 38% and 32%, respectively. On the other hand, increasing the average pore size from IF58 to IF80 is around 4% for both pore size ranges of 100 < pore size < 200 and pore size > 200 (using the data provided in Table S1). Therefore, it is speculated that the decrease of the number of pores is more influential than the increase of the pore sizes, helping to raise the compression strength from IF58 to IF80 sample. The variation of energy absorbability per volume up to densification strain (W) had a direct relationship with compression strengths. This is expected given the behavior of cellular materials in plateau regime, i.e., an increase in the compression strength is associated with the rise of plateau region which results in increasing the area underneath the stress–strain curve. A linear relationship between the energy absorption capacity and plastic collapse stress (compressive strength) of open-cell 6101 aluminum alloy foams under compression was also observed in the work of Krishna et al. [37]. The same V-type pattern was also observed for variation of the offset yield strength and densification strain values. However, for the case of elastic modulus values under dry compressions, although the V-type variation was still present, an important difference was noticed: IF80 specimens showed the highest values of E unlike the other four properties (σy, σc, εD and W) for which IF45 specimens showed the maximum values. This can be due to the high influence of the end and branch strut thicknesses which are significantly higher for IF80 specimens than those of the other two groups (Table S1). The effect of cell size and relative density on the elastic behavior of an open-cell polymer foam was studied by Maheo et al. [38]. Their experimental results showed that the increase of cell size and relative density led to the increase of the elastic modulus of the foams.
Given that multiple factors potentially control the mechanical behavior of the iron foams, predicting the mechanical behavior of the foams under compression is a complex task. Therefore, a simple tabular method which takes into account multiple parameters, i.e., cell size, pore size, number of pores and strut thicknesses is proposed to explain the V-shape variation of compression strengths of the foams studied in this work. Nonetheless, it should be noted that some of the assumptions may be simplistic. In addition, the method is only proposed as an initial step to develop a model which predicts the variation of the mechanical properties of open cell foams (compression strength for the case of this study) as a function of the geometrical properties. Thus, a more sophisticated model may be developed in the future works. The assumptions of the tabular method, based on the literature review, are as follow:
- -
- The compression strength has a direct linear relationship with relative density and strut thickness, and it has an inverse relationship with the pore sizes and the number of the pores.
- -
- All the considered properties have an equal weight to affect the compression strength of the foams.
In the proposed method, for each geometrical property, e.g., relative density, an effect value (EV) which represents the effect of the parameter on the compression strength level of a particular group of open-cell foam is determined. The EV is assigned to each group of iron foams (maximum EV = 100) depending on the average value of the property in the corresponding sample (IF45, IF58, IF80). For each property, the maximum EV of 100 is assigned to the group which would obtain the maximum compression strength, if the corresponding property was the only factor influencing the mechanical strength. For example, for the case of relative density, IF45 sample receive EV of 100, because it has the maximum relative density among all the samples. Therefore, IF45 specimens would have the maximum strength among other cell-size group, if the only determining factor was relative density. Alternatively, for the case of the pore-number factor, IF80 sample is given EV of 100, for IF80 specimens have the lowest number of pores (according to the ppi data). Therefore, if the number of pore was the only parameter to determine the compression strength, IF80 specimens would have the highest strength among all the sample groups of iron foams. Then, after assigning the maximum point for a sample, the EV of the other groups were determined based on their value of the corresponding property relative to that of the sample with maximum EV. For example, for the case of relative density, the EV of the IF58 and IF80 samples was 71.05 and 65.79, respectively, which are resulted from the following equations:
More details on the calculations of the points are available in Section C of the Supplementary Materials. All the assigned points are shown in Table 4. Considering the described EV assignment process, a sample with higher total average EV is expected to have a higher compression strength and therefore energy absorbability. Please note that the final assigned EV associated with pore size are the result of taking the average of the EVs for pore sizes larger than 200 and those of between 100 and 200 µm using the data of Table S1. Similarly, the assigned EVs for each group with respect to the strut thickness were the average of the EVs calculated for end-strut and branch-strut thicknesses. That is why a maximum EV of 100 is not shown in those columns. As expected, IF45 and IF58 groups have the highest and the lowest average total EV, respectively (V-type variation).
Table 4.
Assigned EVs of each sample group for the corresponding geometrical properties.
4.2. Effect of Environmental Conditions on Compression Behavior of Iron Foams
The statistical analysis of the mechanical responses under wet and dry compression tests suggests that the wet environment did not significantly influence the mechanical behavior of the iron foams. This could be due to the presence of open cells which let the fluid, which had a low viscosity, to escape as the compression applied. Moreover, because the compression was applied shortly after immersion of the specimens in Hanks’ solution, no degradation effect is expected. Under the condition of higher strain rate and presence of a more viscous fluid inside the cells, an increase in the strength of the foams would have been expected: As an open cell containing a fluid is compressed, more work is needed to act against the viscosity, and a faster deformation of the foam requires more work [28]. However, for the case of this study, the strain rate and the viscosity were so low that their effects on the mechanical properties were negligible.
Comparing the compression behavior of IF80 non-immersed specimens with those of the specimens which were immersed for three- and seven-days showed that the elastic modulus, yield and compression strengths and energy absorption significantly decreased after immersion. This may be explained by degradation of iron due to the corrosion, resulting in lowering the level of the mechanical properties. However, the differences between the three-day-immersed and seven-day-immersed samples were not statistically significant which can be justified by decreasing the degradation rate after a few days. Such degradation behavior was observed in some of the pure iron samples after 10- or 15-day dynamic immersion test in Hanks’ solution in the work of Mariot et al. [39]. This was potentially attributed to the formation of corrosion products on the surface such as iron phosphate which impeded additional degradation “by hindering oxygen diffusion” [39]. In addition, in [40], presence of hydroxide layer on the surface of electroformed iron was pointed as a cause of slowing down the degradation process in the static immersion test. As it appears in Figure 9, layers of corrosion products formed on the struts after seven-days are thicker than those formed after three-day immersion. Thus, this may have contributed to the reduction of corrosion rate.
4.3. Deformation and Failure Mechanism
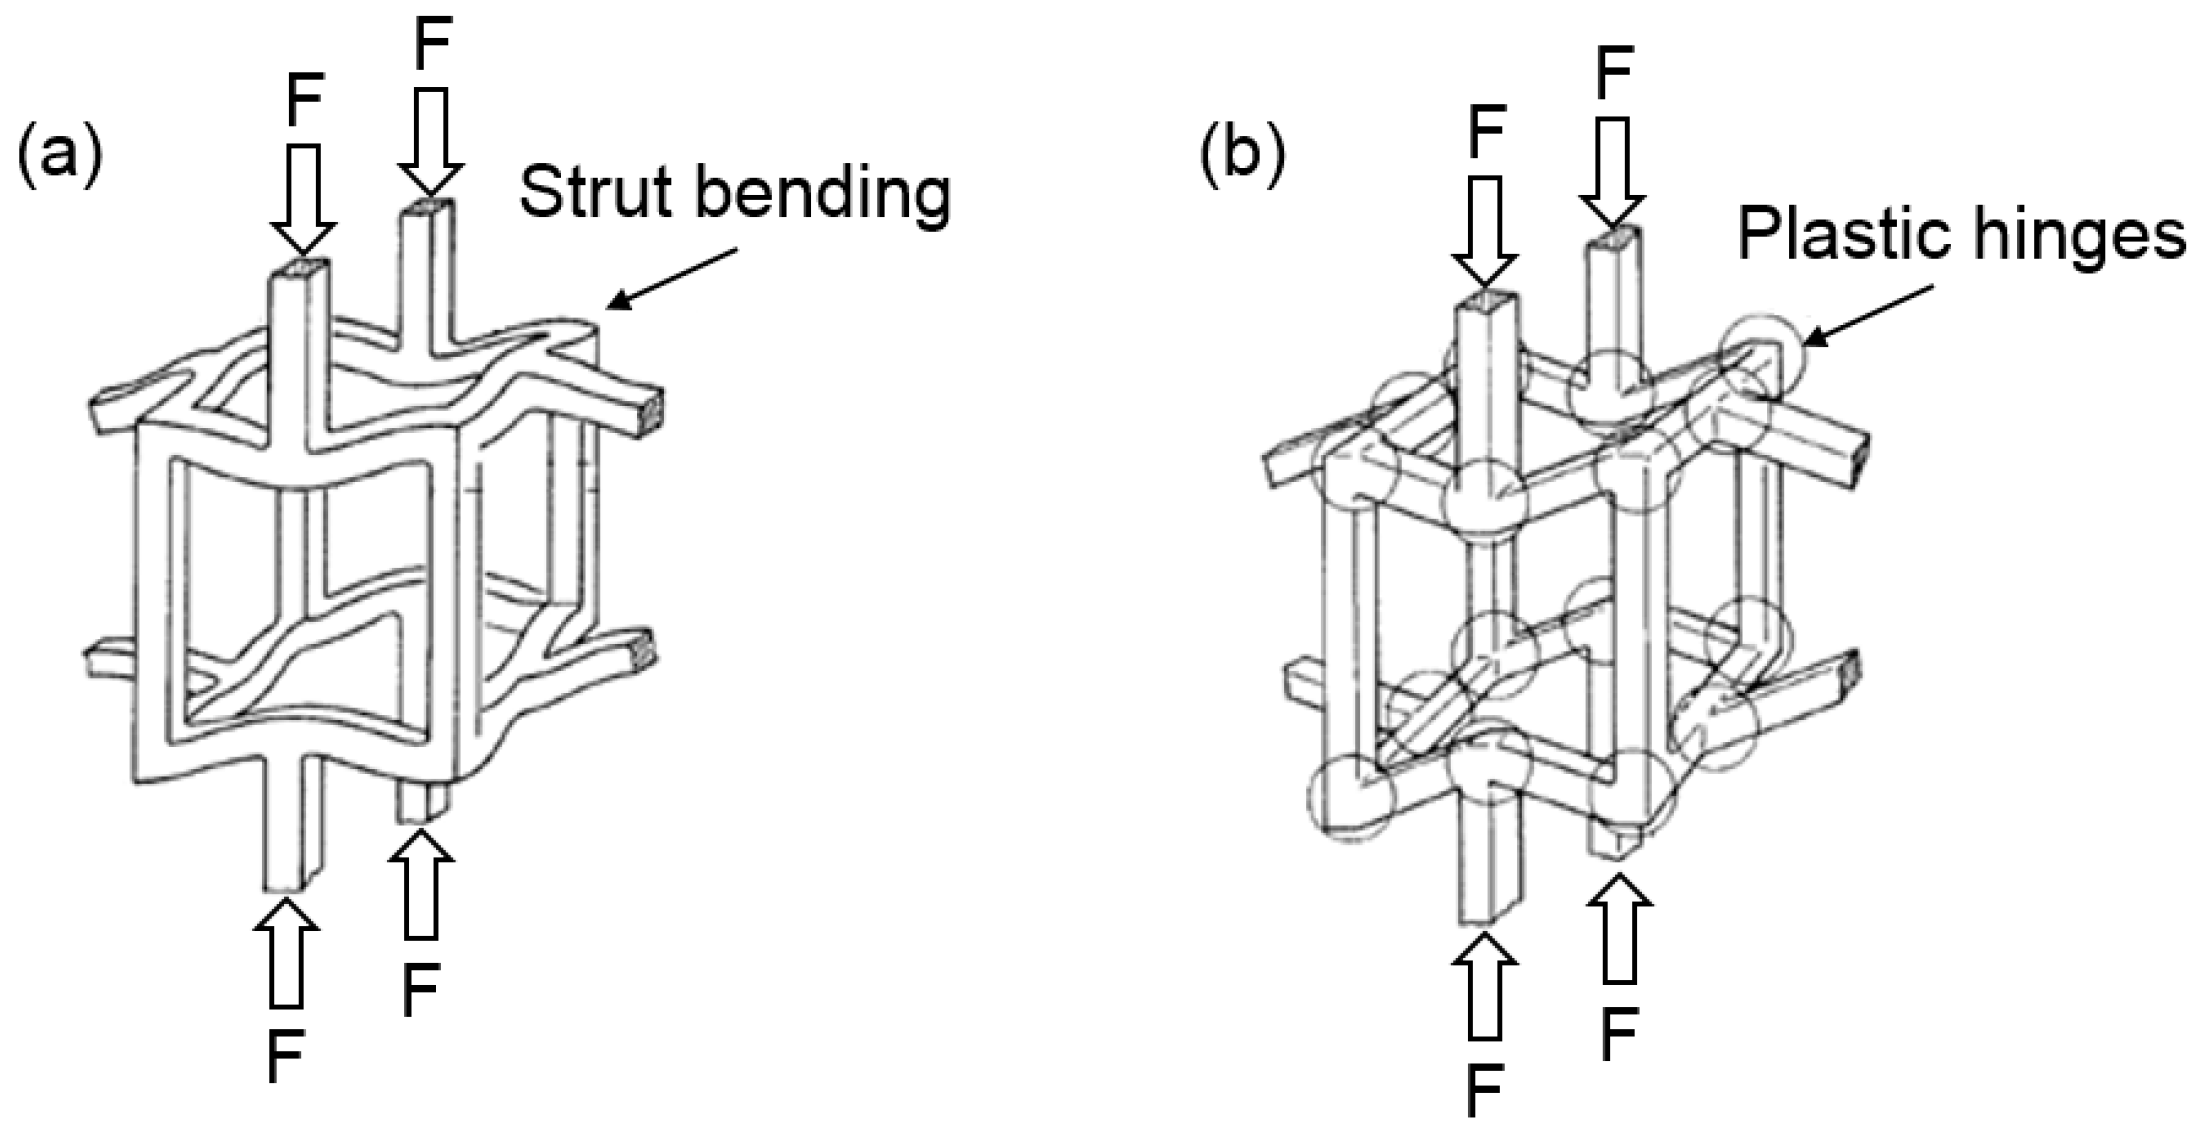
As pointed out previously, three regimes exist during compression of foam: linear elastic, plateau and densification. In open cell foams with low relative densities (ρ*/ρs ≤ 0.1), cell wall bending mainly controls the linear elastic regime. Plastic collapse of the cells during compression gives rise to the plateau of the metal foams which results in formation of plastic hinges in the cell structure. It should be noted that formation of plastic hinges during plateau occurs in the foams made by materials that experience plastic yielding such as metals or rigid polymers [28]. Plastic hinges were formed in iron foam specimens as shown in Figure 8a. Finally, densification takes place “when the cells have almost completely collapsed” and further strains require much higher level of stress when cell walls being adjacent to each other [28]. Figure 10 represents a simple model of an open cell foam under linear elastic deformation and the formation of plastic hinges during plastic collapse.
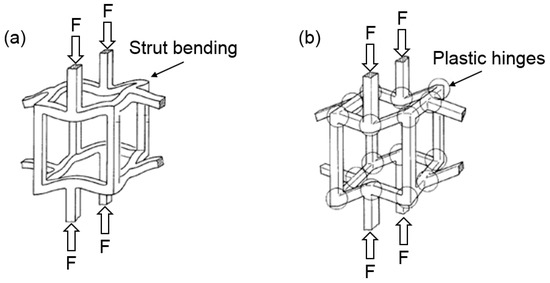
Figure 10.
A simple model of an open cell foam experiencing: (a) linear elastic deformation; and (b) formation of plastic hinges during plastic collapse. Adapted from [28].
Different modes of plastic deformation of struts, including S-shape and C-shape deformations nd deformation bands in IF45 specimens are shown in Figure 8. Although Gibson’s report [29] noted that the buckling of cells takes place during softening of aluminum foams, in this study, the presence or absence of buckling cannot be verified with a high level of certainty as the SEM images show only the surfaces on which compression applied. In other words, the struts whose directions are along the loading axis are not clearly visible. However, given that many of the struts are inclined to the loading axis, it is expected that buckling partially contributes to many of the strut deformatins. In Kaya and Fleck’s work [27], both bending and buckling were addressed as two different deformation mechanisms appeared in different struts. In Daxner’s work [41], both buckling and bending are pointed out as “dominating deformation mechanism” in the struts of “open-cell metallic foams”. In the work of Schuler et al. [26], it is stated that C-shape and S-shape deformations are the product of bending and torsion. Therefore, given that the strut orientation relative to the loading direction is an influential factor on deformation behavior of the foams [37], it is fair to state that the deformation of an open cell iron foam under compression is a complex mechanism which could be the product of different mechanisms in conjunction with each other such as bending, buckling and torsion. However, some of the struts may experience only one form of deformation. The complexity of the strut deformations has been acknowledged in [26] as well.
5. Conclusions
To investigate the influence of geometrical properties and environmental condition on mechanical behavior of porous iron, iron foams of three different cell sizes underwent dry and wet compression tests. In addition, mechanical properties of iron foam specimens after static immersion were assessed and compared with those of non-immersed specimens. Using the stress–strain responses obtained from compression tests, elastic and plastic mechanical properties were analyzed: elastic modulus, yield strength, compression strength, densification strain and energy absorbability per volume up to the point of densification. Two major groups of statistical tests were carried out to analyze the significance of difference between the values of properties: hypothesis tests including ANOVA in conjunction with Tukey post hoc test and t-test, and non-parametric tests including Kruskal–Wallis ANOVA and two-sample K–S tests. In most, though not all, cases, hypothesis and non-parametric tests led to similar conclusions.
It was observed that the mechanical properties of the foams under dry compression tests had a “V-type” variation. Comparing the values of elastic modulus revealed that IF80 specimens had a the highest level of stiffness while for other properties, i.e., yield strength, compression strength, densification strain and energy absorbability, IF45 specimens possessed the highest level under dry compression. A simple tabular method was proposed to explain the variation in compression strength of the iron foams of different geometrical properties with respect to each other. Wet environment generally did not alter the mechanical behavior of the iron foams significantly while degradation decreased the elastic modulus, yield and compression strength and the energy absorbability of the samples. The deformation behavior of the foams under compression was also evaluated via SEM images and different deformation modes were identified. It was speculated that the deformation of open cell iron foams under compression is a complex phenomenon that could be the product of multiple mechanism such as bending, buckling and torsion. However, further studies are needed to understand the failure mechanism of iron foams.
Supplementary Materials
The following are available online at http://www.mdpi.com/2075-4701/7/6/202/s1. Figure S1: Measurement of cell size, pore size and different strut thicknesses on an IF58 specimen, Figure S2: Experimental design and parameters with the number of specimens used in each group, Figure S3: Stress-strain curves of IF45 samples under compression: (a) compression area A1 and cross-head speed S1, (b) compression area A2 and cross-head speed S1, (c) compression area A1 and cross-head speed S2, (d) compression area A2 and cross-head speed S2, Figure S4: Stress-strain curves of IF58 samples under compression: (a) compression area A1 and cross-head speed S1, (b) compression area A2 and cross-head speed S1, (c) compression area A1 and cross-head speed S2, (d) compression area A2 and cross-head speed S2, Figure S5: Stress-strain curves of IF80 samples under compression: (a) compression area A1 and cross-head speed S1, (b) compression area A1 and cross-head speed S2, (c) compression area A2 and cross-head speed S1, (d) compression area A2 and cross-head speed S2, Table S1: Results of the measurement.
Acknowledgments
This work is supported by the Natural Sciences and Engineering Research Council of Canada (NSERC) via the Discovery Grant.
Author Contributions
Hendra Hermawan and Adhitya Trenggono conceived and designed the experiments; Reza Alavi, Adhitya Trenggono and Sébastien Champagne performed the experiments; Reza Alavi and Hendra Hermawan analyzed the data; Reza Alavi wrote the paper; Hendra Hermawan revised and approved the paper.
Conflicts of Interest
The authors declare no conflict of interest.
References and Note
- Pippan, R.; Motz, C.; Kriszt, B.; Zettl, B.; Mayer, H.; Stanzl-Tschegg, S.; Simancik, F.; Kovacik, J. Material Properties. In Handbook of Cellular Metals: Production, Processing, Applications; Degischer, H.P., Kriszt, B., Eds.; Wiley-VCH: New York, NY, USA, 2002. [Google Scholar]
- Ashby, M.F.; Evans, A.G.; Fleck, N.A.; Gibson, L.J.; Hutchinson, J.W.; Wadley, H.N.G. Properties of Metal Foams in Metal Foams: A Design Guide; Butterworth-Heinemann: Oxford, UK, 2000; pp. 40–54. [Google Scholar]
- Wu, S.; Liu, X.; Yeung, K.W.K.; Liu, C.; Yang, X. Biomimetic porous scaffolds for bone tissue engineering. Mater. Sci. Eng. R Rep. 2014, 80, 1–36. [Google Scholar] [CrossRef]
- He, J.; He, F.L.; Li, D.W.; Liu, Y.L.; Yin, D.C. A novel porous Fe/Fe–W alloy scaffold with a double-layer structured skeleton: Preparation, in vitro degradability and biocompatibility. Colloids Surf. B Biointerfaces 2016, 142, 325–333. [Google Scholar] [CrossRef] [PubMed]
- Alvarez, K.; Nakajima, H. Metallic scaffolds for bone regeneration. Materials 2009, 2, 790–832. [Google Scholar] [CrossRef]
- Wen, Z.; Zhang, L.; Chen, C.; Liu, Y.; Wu, C.; Dai, C. A construction of novel iron-foam-based calcium phosphate/chitosan coating biodegradable scaffold material. Mater. Sci. Eng. C 2013, 33, 1022–1031. [Google Scholar] [CrossRef] [PubMed]
- Čapek, J.; Vojtěch, D.; Oborná, A. Microstructural and mechanical properties of biodegradable iron foam prepared by powder metallurgy. Mater. Des. 2015, 83, 468–482. [Google Scholar] [CrossRef]
- Eliaz, N. Biodegradable Metals. In Degradation of Implant Materials; Springer Science and Business Media: New York, NY, USA, 2012; p. 94. [Google Scholar]
- Peuster, M.; Wohlsein, P.; Brügmann, M.; Ehlerding, M.; Seidler, K.; Fink, C.; Brauer, H.; Fischer, A.; Hausdorf, G. A novel approach to temporary stenting: Degradable cardiovascular stents produced from corrodible metal-results 6–18 months after implantation into New Zealand white rabbits. Heart 2001, 86, 563–569. [Google Scholar] [CrossRef] [PubMed]
- Oriňáková, R.; Oriňák, A.; Bučková, L.M.; Giretová, M.; Medvecký, L.; Labbanczová, E.; Kupková, M.; Hrubovčáková, M.; Kova, M. Iron based degradable foam structures for potential orthopedic applications. Int. J. Electrochem. Sci. 2013, 8, 12451–12465. [Google Scholar]
- Zberg, B.; Uggowitzer, P.J.; Löffler, J.F. MgZnCa glasses without clinically observable hydrogen evolution for biodegradable implants. Nat. Mater. 2009, 8, 887–891. [Google Scholar] [CrossRef] [PubMed]
- Vojtěch, D.; Kubásek, J.; Šerák, J.; Novák, P. Mechanical and corrosion properties of newly developed biodegradable Zn–based alloys for bone fixation. Acta Biomater. 2011, 7, 3515–3522. [Google Scholar] [CrossRef] [PubMed]
- Vojtěch, D.; Kubásek, J.; Čapek, J.; Pospíšilová, I. Comparative mechanical and corrosion studies on magnesium, zinc and iron alloys as biodegradable metals. Mater. Technol. 2015, 49, 877–882. [Google Scholar] [CrossRef]
- Kraus, T.; Moszner, F.; Fischerauer, S.; Fiedler, M.; Martinelli, E.; Eichler, J.; Witte, F.; Willbold, E.; Schinhammer, M.; Meischel, M. Biodegradable Fe–based alloys for use in osteosynthesis: Outcome of an in vivo study after 52 weeks. Acta Biomater. 2014, 10, 3346–3353. [Google Scholar] [CrossRef] [PubMed]
- Hermawan, H.; Alamdari, H.; Mantovani, D.; Dubé, D. Iron–manganese: New class of metallic degradable biomaterials prepared by powder metallurgy. Powder Metall. 2008, 51, 38–45. [Google Scholar] [CrossRef]
- Yusop, A.H.M.; Daud, N.M.; Nur, H.; Kadir, M.R.A.; Hermawan, H. Controlling the degradation kinetics of porous iron by poly(lactic-co-glycolic acid) infiltration for use as temporary medical implants. Sci. Rep. 2015, 5, 11194. [Google Scholar] [CrossRef] [PubMed]
- Hermawan, H.; Dubé, D.; Mantovani, D. Degradable metallic biomaterials: Design and development of Fe–Mn alloys for stents. J. Biomed. Mater. Res. Part A 2010, 93, 1–11. [Google Scholar] [CrossRef] [PubMed]
- Oh, K.; Lee, E.; Bae, J.S.; Jang, M.J.; Poss, R.; Kieback, B.; Walther, G.; Kloeden, B. Large scale production and applications of alloy metal foam. Metfoam 2011 Proc. 2011, S, 601–606. [Google Scholar]
- Gibson, L.J.; Ashby, M.F. The structure of cellular solids. In Cellular Solids: Structure and Properties, 2nd ed.; Cambridge University Press: Cambridge, UK, 1997. [Google Scholar]
- International Organization for Standardization. ISO13314: 2011(E), Mechanical testing of metals_Ductility testing_Compression test for porous and cellular metals, Switzerland, 2011-12-15.
- Banhart, J.; Baumeister, J. Deformation characteristics of metal foams. J. Mater. Sci. 1998, 33, 1431–1440. [Google Scholar] [CrossRef]
- Paul, A.; Ramamurty, U. Strain rate sensitivity of a closed-cell aluminum foam. Mater. Sci. Eng. A 2000, 281, 1–7. [Google Scholar] [CrossRef]
- Beer, F.P.; Johnston, E.R.; Dewolf, J.T.; Mazurek, D.F. Mechanics of Materials, 6th ed.; McGraw-Hill: New York, NY, USA, 2012. [Google Scholar]
- Montanini, R. Measurement of strain rate sensitivity of aluminium foams for energy dissipation. Int. J. Mech. Sci. 2005, 47, 26–42. [Google Scholar] [CrossRef]
- OriginLab. Nonparametric Tests. Available online: http://www.originlab.com/index.aspx?go=Products/Origin/Statistics#Nonparametric_Tests_PRO (accessed on 31 March 2017).
- Schüler, P.; Fischer, S.F.; Bührig-Polaczek, A.; Fleck, C. Deformation and failure behaviour of open cell Al foams under quasistatic and impact loading. Mater. Sci. Eng. A 2013, 587, 250–261. [Google Scholar]
- Kaya, A.C.; Fleck, C. Deformation behavior of open-cell stainless steel foams. Mater. Sci. Eng. A 2014, 615, 447–456. [Google Scholar] [CrossRef]
- Gibson, L.J.; Ashby, M.F. The mechanics of foams: Basic results. In Cellular Solids: Structure and Properties, 2nd ed.; Cambridge University Press: Cambridge, UK, 1997. [Google Scholar]
- Gibson, L.J. Mechanical behavior of metallic foams. Annu. Rev. Mater. Sci. 2000, 30, 191–227. [Google Scholar] [CrossRef]
- Amsterdam, E.; Vries, J.H.B.; Hosson, J.T.M.; Onck, P.R. The influence of strain-induced damage on the mechanical response of open-cell aluminum foam. Acta Mater. 2008, 56, 609–618. [Google Scholar] [CrossRef]
- Nieh, T.G.; Higashi, K.; Wadsworth, J. Effect of cell morphology on the compressive properties of open-cell aluminum foams. Mater. Sci. Eng. A 2000, 283, 105–110. [Google Scholar] [CrossRef]
- Stephani, G.; Andersen, O.; Göhler, H.; Kostmann, G.; Kümmel, K.; Quadbeck, P.; Reinfried, M.; Studnitzky, T.; Waag, U. Iron Based Cellular Structures—Status and Prospects. Adv. Eng. Mater. 2006, 8, 847–852. [Google Scholar] [CrossRef]
- Xiao, L.; Song, W.; Wang, C.; Liu, H.; Tang, H.; Wang, J. Mechanical behavior of open-cell rhombic dodecahedron Ti–6Al–4V lattice structure. Mater. Sci. Eng. A 2015, 640, 375–384. [Google Scholar] [CrossRef]
- Jian, Y.T.; Yang, Y.; Tian, T.; Stanford, C.; Zhang, X.P.; Zhao, K. Effect of Pore Size and Porosity on the Biomechanical Properties and Cytocompatibility of Porous NiTi Alloys. PLoS ONE 2015, 10, e0128138. [Google Scholar] [CrossRef] [PubMed]
- Jiang, B.; Wang, Z.; Zhao, N. Effect of pore size and relative density on the mechanical properties of open cell aluminum foams. Scr. Mater. 2007, 56, 169–172. [Google Scholar] [CrossRef]
- Xu, J.L.; Bao, L.Z.; Liu, A.H.; Jin, X.F.; Luo, J.M.; Zhong, Z.C.; Zheng, Y.F. Effect of pore sizes on the microstructure and properties of the biomedical porous NiTi alloys prepared by microwave sintering. J. Alloys Compd. 2015, 645, 137–142. [Google Scholar] [CrossRef]
- Krishna, B.V.; Bose, S.; Bandyopadhyay, A. Strength of open-cell 6101 aluminum foams under free and constrained compression. Mater. Sci. Eng. A 2007, 452–453, 178–188. [Google Scholar] [CrossRef]
- Maheo, L.; Viot, P.; Bernard, D.; Chirazi, A.; Ceglia, G.; Schmitt, V.; Mondain-Monval, O. Elastic behavior of multi-scale, open-cell foams. Compos. Part B Eng. 2013, 44, 172–183. [Google Scholar] [CrossRef]
- Mariot, P.; Leeflang, M.A.; Schaeffer, L.; Zhou, J. An investigation on the properties of injection-molded pure iron potentially for biodegradable stent application. Powder Technol. 2016, 294, 226–235. [Google Scholar] [CrossRef]
- Moravej, M.; Purnama, A.; Fiset, M.; Couet, J.; Mantovani, D. Electroformed pure iron as a new biomaterial for degradable stents: In vitro degradation and preliminary cell viability studies. Acta Biomater. 2010, 6, 1843–1851. [Google Scholar] [CrossRef] [PubMed]
- Daxner, T. Deformation Mechanisms and Yielding in Cellular Metals. In Plasticity of Pressure-Sensitive Materials; Altenbach, H., Öchsner, A., Eds.; Springer: Berlin/Heidelberg, Germany, 2014; pp. 165–166. [Google Scholar]


© 2017 by the authors. Licensee MDPI, Basel, Switzerland. This article is an open access article distributed under the terms and conditions of the Creative Commons Attribution (CC BY) license (http://creativecommons.org/licenses/by/4.0/).